Article

Adsorbents Produced from Olive Mill Waste and Modified to Perform Phenolic Compound Removal

1
CERES, Department of Chemical Engineering, Faculty of Sciences and Technology, University of Coimbra, Rua Silvio Lima, 3030-790 Coimbra, Portugal
2
Chemical Department, School of Science, Sao Paulo State University (Unesp), Av. Eng. Luiz Edmundo Carrijo Coube, 14-01, Vargem Limpa, Bauru CEP 17033-360, SP, Brazil
3
Department of Environmental Technology, Faculty of Chemistry, University of Gdansk, Wita Stwosza 63, 80-308 Gdańsk, Poland
*
Author to whom correspondence should be addressed.
Water 2024, 16(17), 2379; https://doi.org/10.3390/w16172379
Submission received: 10 July 2024 / Revised: 13 August 2024 / Accepted: 17 August 2024 / Published: 24 August 2024
(This article belongs to the Special Issue Advanced Processes for Industrial Wastewater Treatment)

Abstract

:
Olive mill waste (olive pomace, OP, and olive stone, OS) was used in this work to produce adsorbents for the removal of five phenolic acids typically found in olive mill wastewater. OP and OS were subjected to different treatments (combined or not) that were chemically modified (NaOH) or physically modified by two different methods, incipient wetness impregnation (IWI) and hydrothermal deposition (HD), and even biochar production obtaining a total of 16 materials. The materials were characterized by different analytical techniques such as N2 absorption, scanning electron microscopy, infrared spectroscopy, and pH zero-potential charge. The mixture of five phenolic acids was used to evaluate in batch conditions the adsorption capacity of the prepared materials. OS chemically modified with IWI (OSM-IWI) and OS biochar with HD (BOS-HD) presented better adsorption capacity at 157.1 and 163.6 mg/g of phenolic acids, respectively, from a total of 200 mg/g. For some materials, the surface area cannot be correlated with adsorption capacity, unlike pHzpc, where high values fit better adsorption rates. The infrared spectroscopy profile indicates the presence of O-H and N-H functional groups and, the last one, red-shifted in the IWI preparation compared to the HD one. In addition to this, the prepared material from olive mill waste can be suitably used for the mixture of phenolic compounds.

1. Introduction

The Mediterranean countries of Spain, Greece, Italy, and Portugal are the greatest producers of olive oil [1]. The exponential growth of the population has led to an increase in its consumption, which will promote higher olive mill waste and wastewater production [2,3]. This olive mill wastewater has a high content of phenolic compounds, inhibiting the microorganisms used in the biological treatment [2,3]. Several physicochemical processes have been studied to reduce the toxicity related to the phenolic content, which can be expensive compared to the biological systems [2]. In addition, olive mill wastewater (OMW) produced can also be obtained as solid waste from olive pomace (OP) [4,5]. Depending on the extraction process, the amount and type of OP and OMW can be different and have broad characteristics. The main extraction processes for olive oil production in continuous mode can be two- or three-phase systems [6]. In the two-phase system, OMW and OP are obtained from horizontal centrifugation where the solid waste (OP) presents a high water content [7]. Due to the water content, this material is dried and part of the oil is extracted again producing extracted oil and pomace with a low amount of water. Typically, the liquid fraction, olive mill wastewater, is stored in evaporation lagoons creating several environmental issues such as odor, soil contamination, and surface and groundwater contamination [8,9,10,11]. Therefore, over the years, different approaches have been followed to improve OMW treatment to reduce the environmental impact.
Several technologies of a physical and chemical nature or even biological nature after the suitable pre-treatment have been applied [12,13,14]. Regarding the solid fractions such as olive pomace (OP) and olive stone (OS), landfill disposal and incineration are the most common final destinations [15]. Over the years, numerous methods have been proposed to dispose and valorize olive oil waste. These techniques include thermo-chemical processes, anerobic digestion, fermentation, blending, and chemical extraction of bioactive compounds [16,17,18]. Therefore, this material has a high carbon composition, which can be useful for biochar production. The biochar production has increased due to the physicochemical characteristics, which are interesting for a wide range of applications [19]. Biochar can be an alternative material of activated carbon that is useful for the adsorption of phenolic compounds at a low cost and working as a circular economy approach [20]. This modified material has a high carbon content, surface functional group composition, large surface area, porosity, capacity for ionic exchange, and stable structure [19,20]. Biochar prepared from the solid fraction of OMW evaporation lagoons was used for the polyphenol content removal from OMW, and a high removal of hydroxytyrosol was verified [21]. Rocha et al. [22] impregnated iron in OP and OS for Fenton’s process application for phenolic acid abatement revealing the potential for a higher impregnation yield on these materials. Thanks to the natural abundance of lignocellulosic fibers in olive pomace (OP), the biocomposite industry uses agricultural waste (or by-products) as renewable fillers for polymeric matrices. Research on olive stone flour has demonstrated its effectiveness as a cost-effective reinforcing filler for polypropylene matrices, thus opening new avenues for the utilization of this by-product [23]. Akbas and Yusan [24] chemically modified OP using different acids, characterized it, and utilized it for the removal of Ce(III) from aqueous solutions. Non-treated olive pomace was also tested to investigate the impact of chemical modification on the removal of Ce(III). Several studies have shown that OP could be used as a biosorbent to remove contaminants such as phenols [25], dyes [26], or heavy metals like Cd(II), Pb(II), and Cu(II) [26,27]. This olive mill waste reveals the capacity to remove metals from the liquid solutions. However, the preparation of biochar from these materials in separate and in combination with other modification methodologies has not been deeply studied in the literature [20,28,29].
The hydrothermal (HD) method is the application of water in high-temperature and high-pressure conditions to produce a high-purity and a controlled morphology adsorbent. The hydrothermal method is used for the metal deposition onto the support and can produce high surface materials with a low capacity to agglomerate [30]. Lan et al. [31] produced iron loaded into the MCM-41 material by dipping and hydrothermal conditions and verified that the material prepared by hydrothermal method presented a higher surface area. On the other hand, the incipient wetness impregnation (IWI) method is very useful for the controlled deposition of metallic content inside of the porous substrate; this technique can serve to control the dispersion of the metal over the support [32,33]. This technology was used as a comparison with the HD method since it can increase the pore size of materials.
The main goal of this work is to modify OP and OS materials under hydrothermal and incipient wetness impregnation methods to improve the adsorption capacity through the increase in the surface area. Moreover, the chemical modification with sodium hydroxide followed by biochar production was explored to improve the biosorbent activity through surface modification. The adsorption of phenolic acids was followed and related to the different physical parameters obtained during the modification of materials.

2. Materials and Methods

2.1. Waste Material Activation and Preparation

An industry in the center region of Portugal provided olive mill waste (pomace and stone). These two materials were washed and dried for 12 h at 100 °C, and the particle size ranges selected for olive stone (OS) and olive pomace (OP) were from 1.00 to 4.76 mm and 0.60 to 4.76 mm, respectively. Then, part of these selected particles was ground and milled to achieve a particle size diameter from 177 to 850 µm. These materials, OS and OP, were then submitted to different modifications, biochar production, and physical–chemical treatments.
The non-milled particles of OS and OP were used for the biochar production. This production through calcination in a static atmosphere was made in a muffle at 500 °C for 2 h. After calcination, ultrapure water was used to wash the biochar and the ashes were removed by filtration followed by drying at 100 °C overnight. These samples obtained from OS and OP were named BOS and BOP, respectively, where “B” is related to biochar.
The 30 g of selected milled particles of OP and OS was placed under stirring in a 2.5 M NaOH aqueous solution for 16 h at ambient temperature to be chemically modified. Then, the material was washed with ultrapure water and filtered along different cycles until the collected water achieved a neutral pH. Further, the chemically modified material named OSM and OPM, where M is related to “modified”, was dried at 100 °C overnight.
This chemical modification method was used to produce chemically modified biochar where the drying step was replaced by the calcination step at 500 °C for 2 h. These samples were named BOSM and BOPM. Further to these modifications, the materials were submitted to two different physical–chemical treatments. One was the hydrothermal (HD) treatment, where the pH of the solution was adjusted to 10 with NaOH solution. After, part of the non-milled material was mixed with this solution in a Teflon digestion vessel and autoclaved for 20 h at 200 °C. Then, after this physical–chemical activation, the materials were filtered and dried for 12 h at 100 °C. The second one, IWI, was made by mixing water with non-milled biomass, and the homogeneity was guaranteed by manual stirring. This final mixture was calcinated at 350 °C for 1 h after being dried for 12 h at 100 °C and washed several times with ultrapure water. Then, the samples prepared by HD and IWI were named with the addition of its suffix.

2.2. Analytical Characterization Techniques

The morphology of prepared samples was assessed using field-emission scanning electron microscopy (FE-SEM) with a JEOL JSM-7610 F instrument (JEOL JSM-7610F, Tokyo, Japan). The chemical composition was determined by Raman spectroscopy at room temperature using a Thermo Scientific DXR Smart Raman spectrometer (Thermo Fischer Scientific, Waltham, MA, USA) with a 532 nm laser. The 3P Instrument Micro 100 sorption analyzer (3P Instruments, Odelzhausen, Germany) was used to measure the specific surface area (BET). The BET surface area and porosity structure of the materials were evaluated by analyzing nitrogen adsorption–desorption isotherms. Additionally, the Barrett–Joyner–Halenda (BJH) method was used to determine the pore size distribution and volume. Fourier transform infrared spectroscopy (FTIR) was performed in a 4200 Jasco spectrometer (Easton, MD, USA) over the spectra range from 4000 to 650 cm−1. This analysis was made for the best adsorbents with physical–chemical modifications and biochar. The potential of pH zero-point charge (pHzpc) was measured after 24 h of equilibrium of 0.1 g of adsorbent with a desired initial pH of ultrapure water solution. To do this, 25 mL of 1-week, pH-adjusted water prepared with NaOH or HCl solution was used. In this case, the NaCl solution was not used to avoid the formation of a double thick layer due to ionic strength [34]. The absence of salt solution is closer to the conditions of the adsorption medium allowing the release of possible functional groups of the material surface as a counter ion of the medium [35].

2.3. Adsorption Experiments

The 5 phenolic acids, trans-cinnamic acid (TCA), 3,4-Dihydroxybenzoic (DHB), 4-Hydroxybenzoic (HB), 3,4,5-Trimethoxybenzoic (TMB), and 3,4-Dimethoxybenzoic (DMB) used in the adsorption experiment were acquired from Sigma-Aldrich. The synthetic solution was composed of ultrapure water and a mixture of 5 phenolic acids with 100 mg/L of each acid [36]. The adsorption experiments were performed in batch mode with synthetic solution placed for 30 min in cylindric reactors at a stirring speed of 9 rpm by translational rotation (Heidolph Reax 20) with 0.25 g of adsorbent. The adsorption conditions, time, and stirring were based on the previous work of the group in [22]. After the adsorption time, enough sample volume was filtred (0.45 µm) to be evaluated by high-performance liquid chromatography (HPLC) analysis.
The adsorption capacity of different prepared materials was evaluated by HPLC following the phenolic acid concentrations. The HPLC analysis was performed in a Waters apparatus equipped with a C18 column operated at 40 °C. The mobile phase flow was adjusted to 1.0 mL/min constituted by a 50/50 mixture of methanol and acidifed water (0.1% H3PO4). The phenolic acids were quantified by an UV-Vis detector at the wavelength of 255 nm. The results of HPLC provided the values of the percentage of phenolic acid removal comparing the area of chromatograms presented in Equation (1).
A d s i = A 0 A f A 0 · 100
where Adsi is the percentage of each acid removed in the adsorption; A0 is the initial chromatogram area of the respective acid; Af is the final chromatogram area of the same acid at the end of 30 min.
So, the phenolic acid removal content in the function of the mass of adsorbent, in mg/gads, was calculated by Equation (2).
q e = A d s i m a d s · V s o l
where qe is the adsorption capability in mg/gads; mads is the mass of adsorbent used in the adsorption trials; Vsol is the volume of solution used in the adsorption test.

3. Results and Discussion

3.1. Prepared Materials Characterization

The chemical structure of the prepared samples was analyzed using Raman spectroscopy, with the results depicted in Figure 1. The spectra consisted of two main peaks, including the D band around 1350 cm−1, which indicated the presence of defects and disorders within the carbon lattice [37], and the G band around 1580 cm−1, corresponding to the graphitic order and in-plane stretching of the C-C bonds [38]. Additionally, the 2D band, observed around 2710 cm−1 is related to an overtone of the D band [39]. Among the samples prepared by the IWI method, the 2D band is present but generally less pronounced compared to those prepared by the HD method. The samples prepared by the HD method generally exhibit a mix of ordered and disordered structures, with a notable graphitic content. For instance, samples such as OSM-HD display a well-defined 2D band and a lower ID/IG ratio (Table 1), suggesting a higher graphitic order [40]. On the other hand, samples prepared by the IWI method tend to show higher ID/IG ratios, indicative of a greater disorder, as seen in the OPM-IWI and BOP-IWI samples. These samples also exhibit less-pronounced 2D bands, reflecting fewer well-defined graphitic layers.
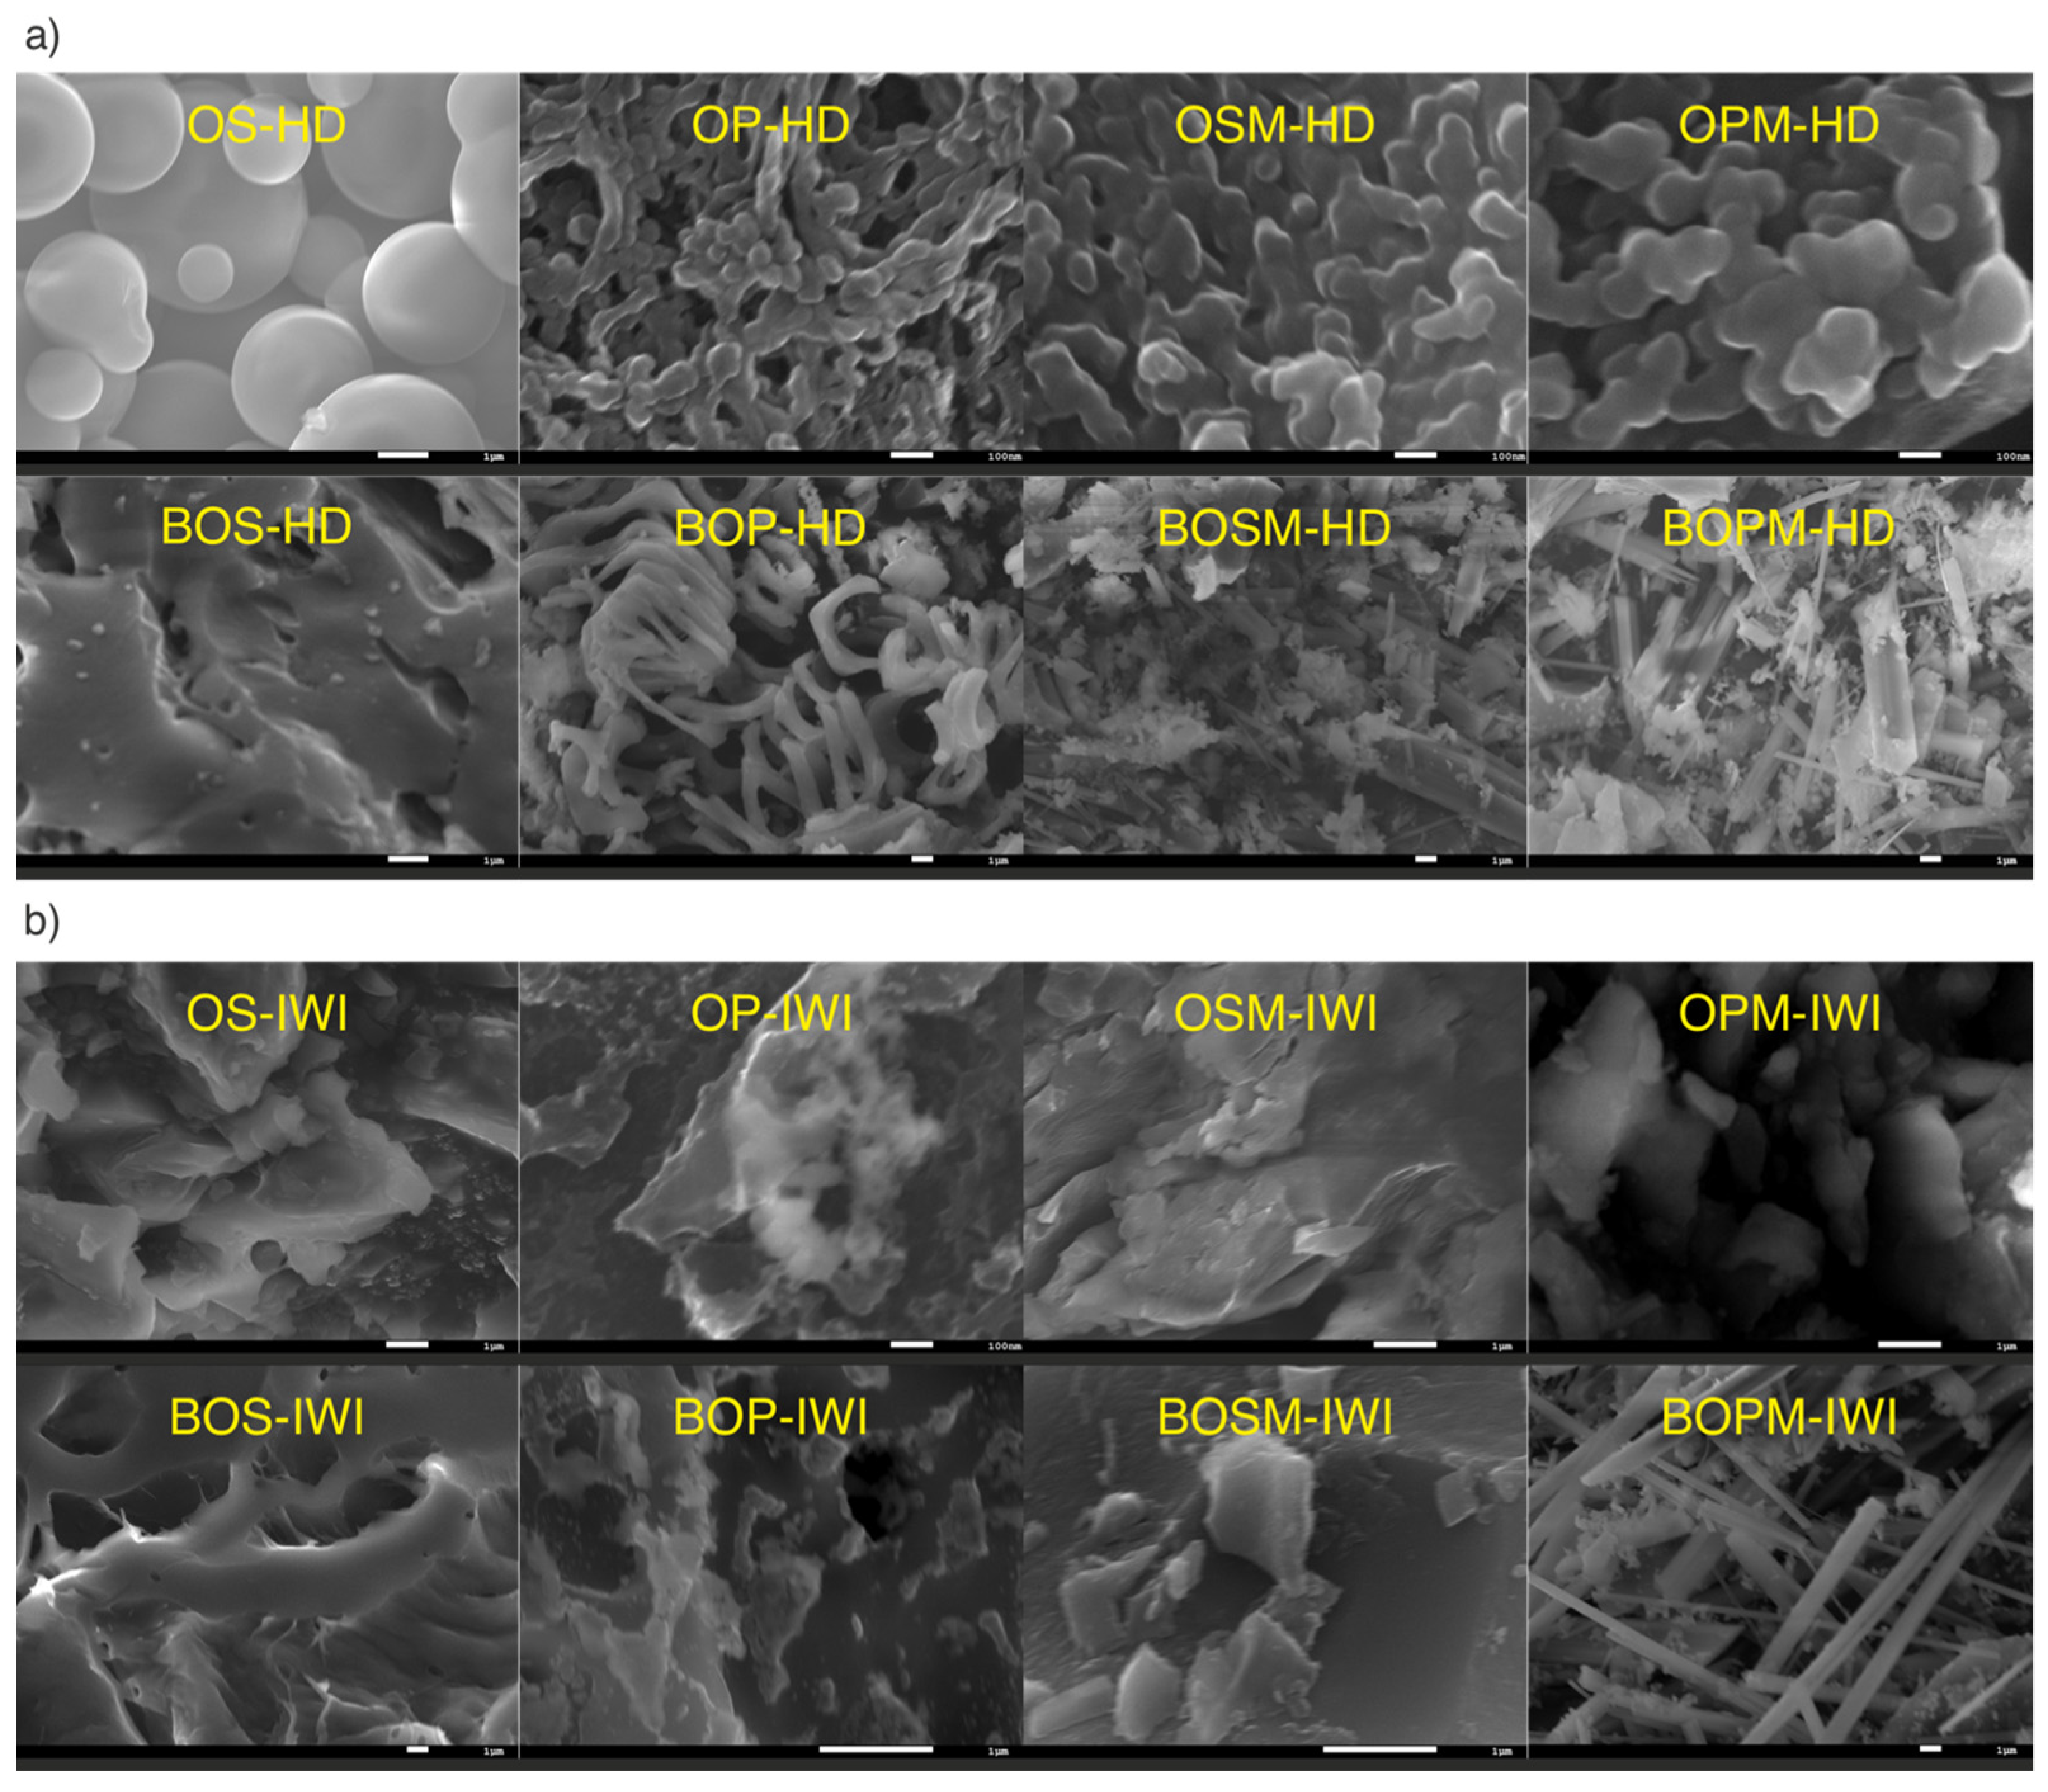
The morphology of the samples obtained using different methods is shown in Figure 2. Samples prepared using the HD method generally exhibit more defined and varied structures, while those prepared using the IWI method tend to have rougher, more dense features. Regardless of the method used, the samples exhibit slightly different morphologies. However, similarities are evident in the BOPM samples obtained from both methods, which feature needle-like structures. OPM-HD exhibited a similar morphology to OSM-HD but with slightly larger dimensions. Spherical particles with a smooth surface are visible in the OS-HD sample. A rough, layered structure was observed for the OS-IWI sample, while the OSM-IWI sample displayed a dense, compact morphology.
Table 1 presents various physicochemical properties of prepared samples, including their BET surface area, pore size, pore volume, and pHzpc. The highest BET surface areas were observed in the OSM-HD (254.6 m2/g) and OP-HD (227.4 m2/g) samples, while the lowest values were found in the samples prepared by the IWI method, specifically OPM-IWI (15.9 m2/g) and BOSM-IWI (15.6 m2/g). The largest BET surface area corresponded to the morphology of spheres or small nanoparticles observed in SEM images. To conclude, samples prepared via the HD method generally exhibit higher surface areas compared to the IWI preparation method (more evidently in the OP materials). There was no consistent trend observed in pore size when comparing the HD and IWI methods, as the sizes vary significantly within both methods. However, according to the data obtained for the pore size, generally speaking, the pore size except in one case, is always bigger for the IWI preparation method compared to the HD method. In fact, the largest pores were observed in BOP-IWI (9.3 nm) and OPM-IWI (8.4 nm), while the smallest pores were observed in samples prepared by the HD method, namely OSM-HD (4.3 nm) and BOS-HD (4.4 nm). Spherical particles with a smooth surface are visible in the OS-HD sample. This agrees with the BET surface area increase for the smaller pore size when the HD method is used [41]. Moreover, the larger pore size also presents a lower pore volume (Table 1).
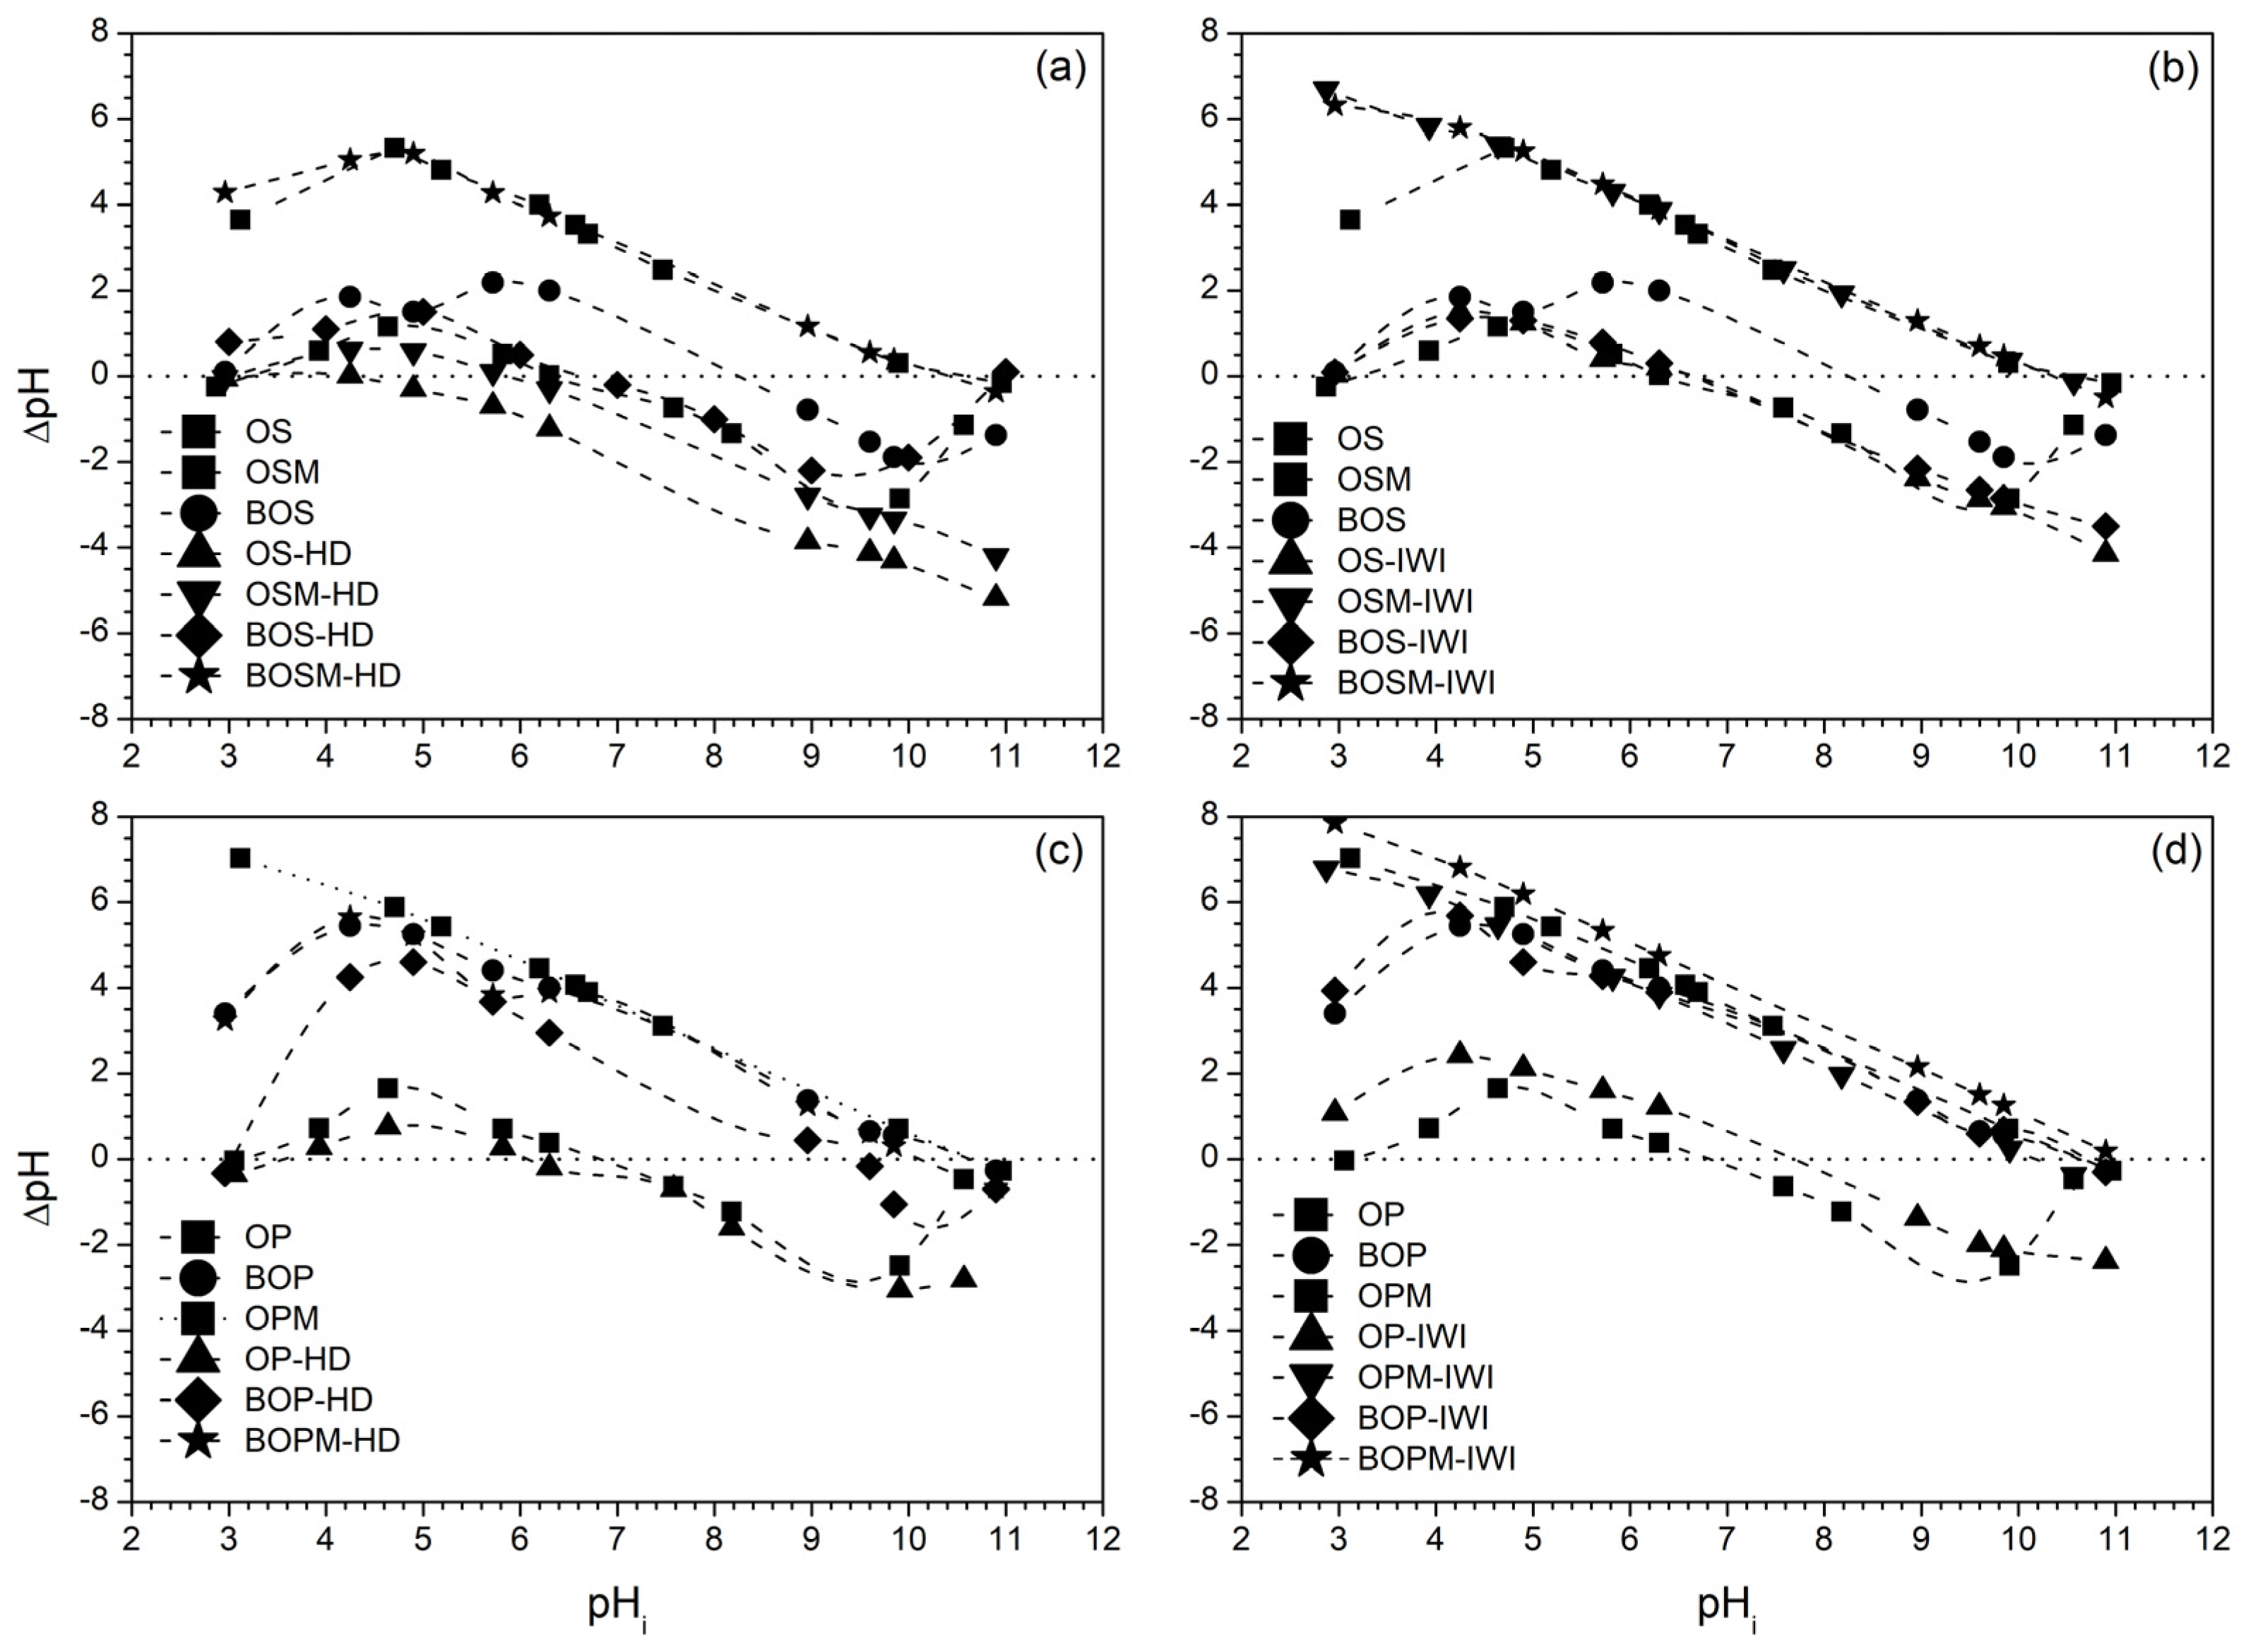
The behavior of the adsorbent and its performance in the adsorption process can be related to the surface distributed charge in the medium; therefore, the determination of pHzpc is a relevant parameter. The pHzpc determines the values where the material surface charge is zero; above this value, the material surface is negatively charged, and below the pHzpc values, the surface has a positive charge [42]. Figure 3 presents the pHzpc measurements for all materials prepared in this work, and Table 1 presents the numerical pHzpc values.
From the profiles presented in Figure 3, it is possible to observe that BOSM-HD, OSM-IWI, BOSM-IWI, BOP, BOPM-HD, OPM-IWI, and BOP-IWI have a positive surface charge in all the ranges on pH applied in this work (due to the high pHzpc value). The pH value was about 3.5 for the adsorption experiments, which corresponds to the natural pH resultant from the phenolic acid mixture. For the all materials, the pHzpc value is around neutral and the pH is between 2 and −2, except for BOP-HD with a high value of pHzpc. According to the characteristics of all the materials, the positive surface charge under the operational pH the electrostatic interaction should play the main role in the adsorption of phenolic content [43,44,45]. Lawal et al. [45] produced biochar from oil palm fronds for phenol acid removal and verified that the pH of the solution has an impact on adsorption capacity. The phenolate produced at higher pH values (above 6.5) was attracted by the positively charged biochar surface, and when the pH was higher than the biochar pHzpc, the negatively charged surface repulsed this phenolate, reducing its adsorption [45].
It is interesting to note that the OS material that developed only a positive surface charge is the material with the lowest BET area (smaller than 55 m2/g), while in the OS materials whose pHzpc value is around a neutral pH, the BET area is greater than 150 m2/g. In the OP-IWI materials, the pHzpc is higher than 7.6 and the BET area is below 50 m2/g, while in OP-HD, the pHzpc is higher than 6.0 and the BET area is higher than 99.0 m2/g. Generally speaking, the IWI preparation method produces materials with a lower surface area compared to the HD preparation method.
Comparing the raw materials with the respective biochar and HD modified-biochar (OS → BOS → BOS-HD; OP → BOP → BOP-HD) proves that biochar production increases pHzpc. With the thermal treatment, it is possible that functional groups, like carboxylic acids and amines, are exposed thus facilitating the compensation of a pH driving force solution. However, even with high pH values, these functional groups donate negative groups (the final pH is higher than the initial pH) and the solution’s only driving force at high pH values is Na+ (coming from NaOH). This means that those negative groups are weakly bound to the main chair. The additional HD treatment of the biochar leads to those functional groups’ removal (in fact, after preparation, the initial water solution changed from transparent to wine color), and the pHzpc value decreased compared to the respective biochar material.
Comparing BOS and BOP for the HD method, the higher value of pHzpc for BOP can be attributed to the composition of the materials. The OS material possesses more hemicellulose and cellulose [22,46], while OP possesses more Klason lignin and extractives [46,47]. It is notable that the IWI treatment (OS → BOS → BOS-IWI; OP → BOP → BOP-IWI) applied to BOS materials is capable of removing the provider of negative functional groups, while for BOP, this does not occur. However, although BOP-IWI developed a high positive surface charge (high pHzpc value), this material was not capable of adsorbing any phenolic acid compared to BOS-IWI (that will be further presented).
For OS and OP which were modified by the chemical treatment with the NaOH solution (OS → OSM-HD and OSM-IWI; OP → OPM-HD and OPM-IWI), the same behavior is observed as discussed for the biochar related to the pHzpc values. The surface composition of these materials changed by the predominance of basic groups, which is consistent with the pHzpc data (Table 1). Jedynak and Charmas [29] concluded that the addition of KOH to the biochar preparation results in an increase in the carboxyl and carbonyl groups at the material surface. Moreover, in the present study, some biochar prepared by both the HD and IWI methods (BOS-HD and BOS-IWI) when modified with the NaOH solution suffered an increase in pHzpc over the basic values (Table 1).
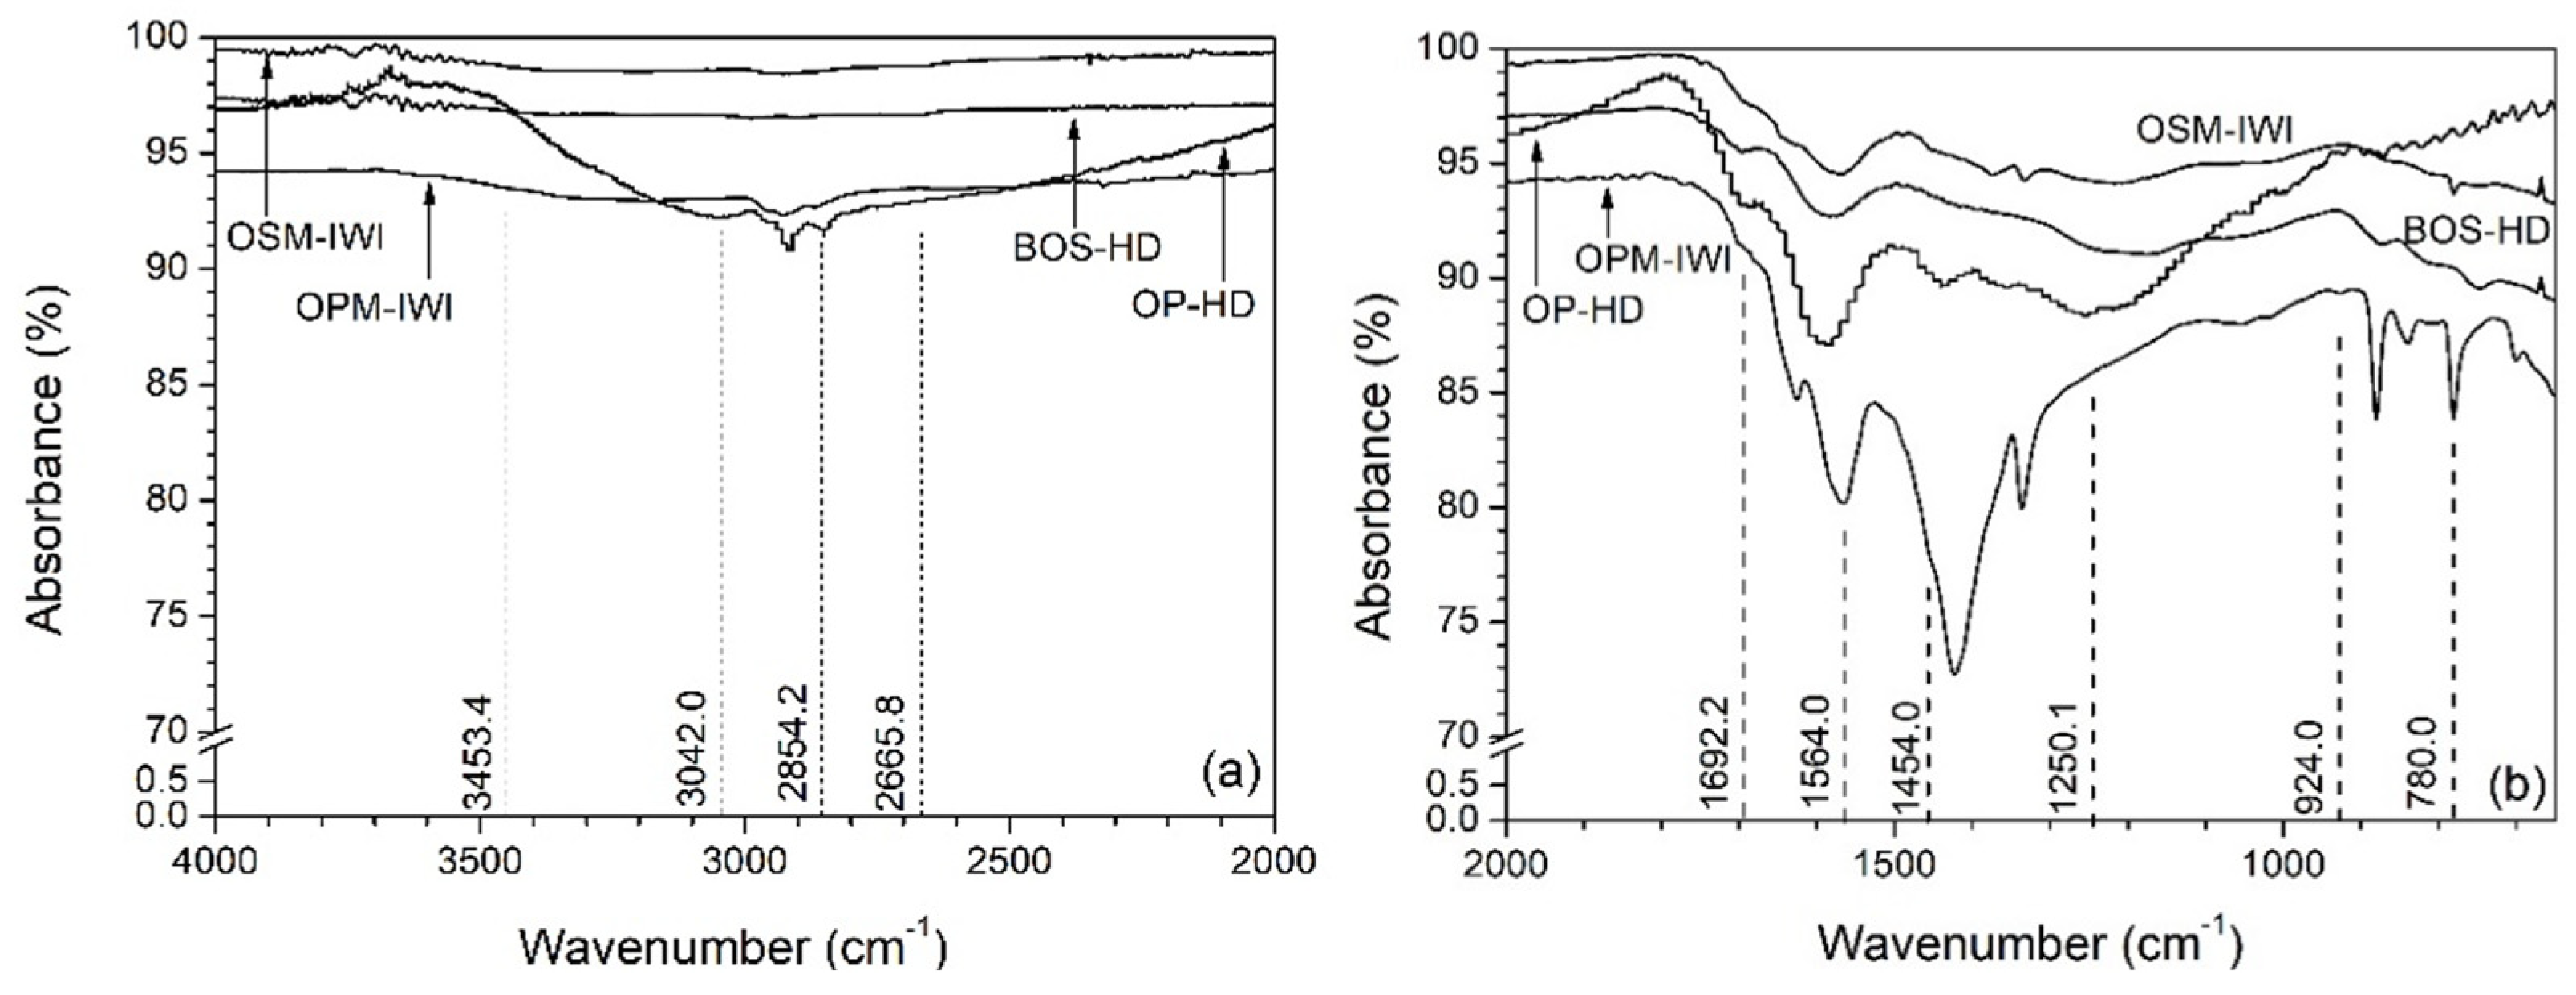
To understand the properties of the better adsorbents that made them applicable for olive mill wastewater treatment, they were characterized by FTIR before the adsorption process, as shown in Figure 4.
The bands between 3750 and 3500 cm−1 for the materials (Figura 4a) are related to the O-H group stretching vibrations [48]. The bands 2923 and 2854 cm−1 are associated with the stretching vibration of the C-H group [49]. In Figure 4b, it is possible to observe the bands between 1700 and 1600 cm−1, which is related to the presence of the carbonyl group C=O being more evident in the OPM-IWI material probably related to the NaOH modification [50]. Moreover, some authors refer to 1564 cm−1 as the aromatic C=C stretching vibration, and this is present in all the modified materials (Figure 4b) [51]. The bands between 924.0 and 780.0 cm−1 are correlated with the out-of-plane vibration of CH2 (alkenes) and CH (aromatics) bands [52].
As expected, the OP material presented bands associated with the C-H and C-H2 bonds, because OP is the component of the fruit most susceptible to damage during the extraction process. The OS material is hard and possesses more lignin and cellulose [22]. The first extraction breaks down the cell wall, and the second extraction (with hexane) forces the exit of the olive oil. This process exposes the chemical bonds of the cell wall.
At the pH of the experimental tests (around 4.5), all of the acids are dissociated according to the pKa and all of them possess a non-zero polar surface area defined as the combined surface area belonging to oxygen and nitrogen atoms and hydrogen atoms bound to these electronegative atoms [53] due to the functional groups (carboxylic acids and hydroxides), which may be interacting with the O-H and N-H groups of the adsorbent surface.

3.2. Phenolic Acid Adsorption

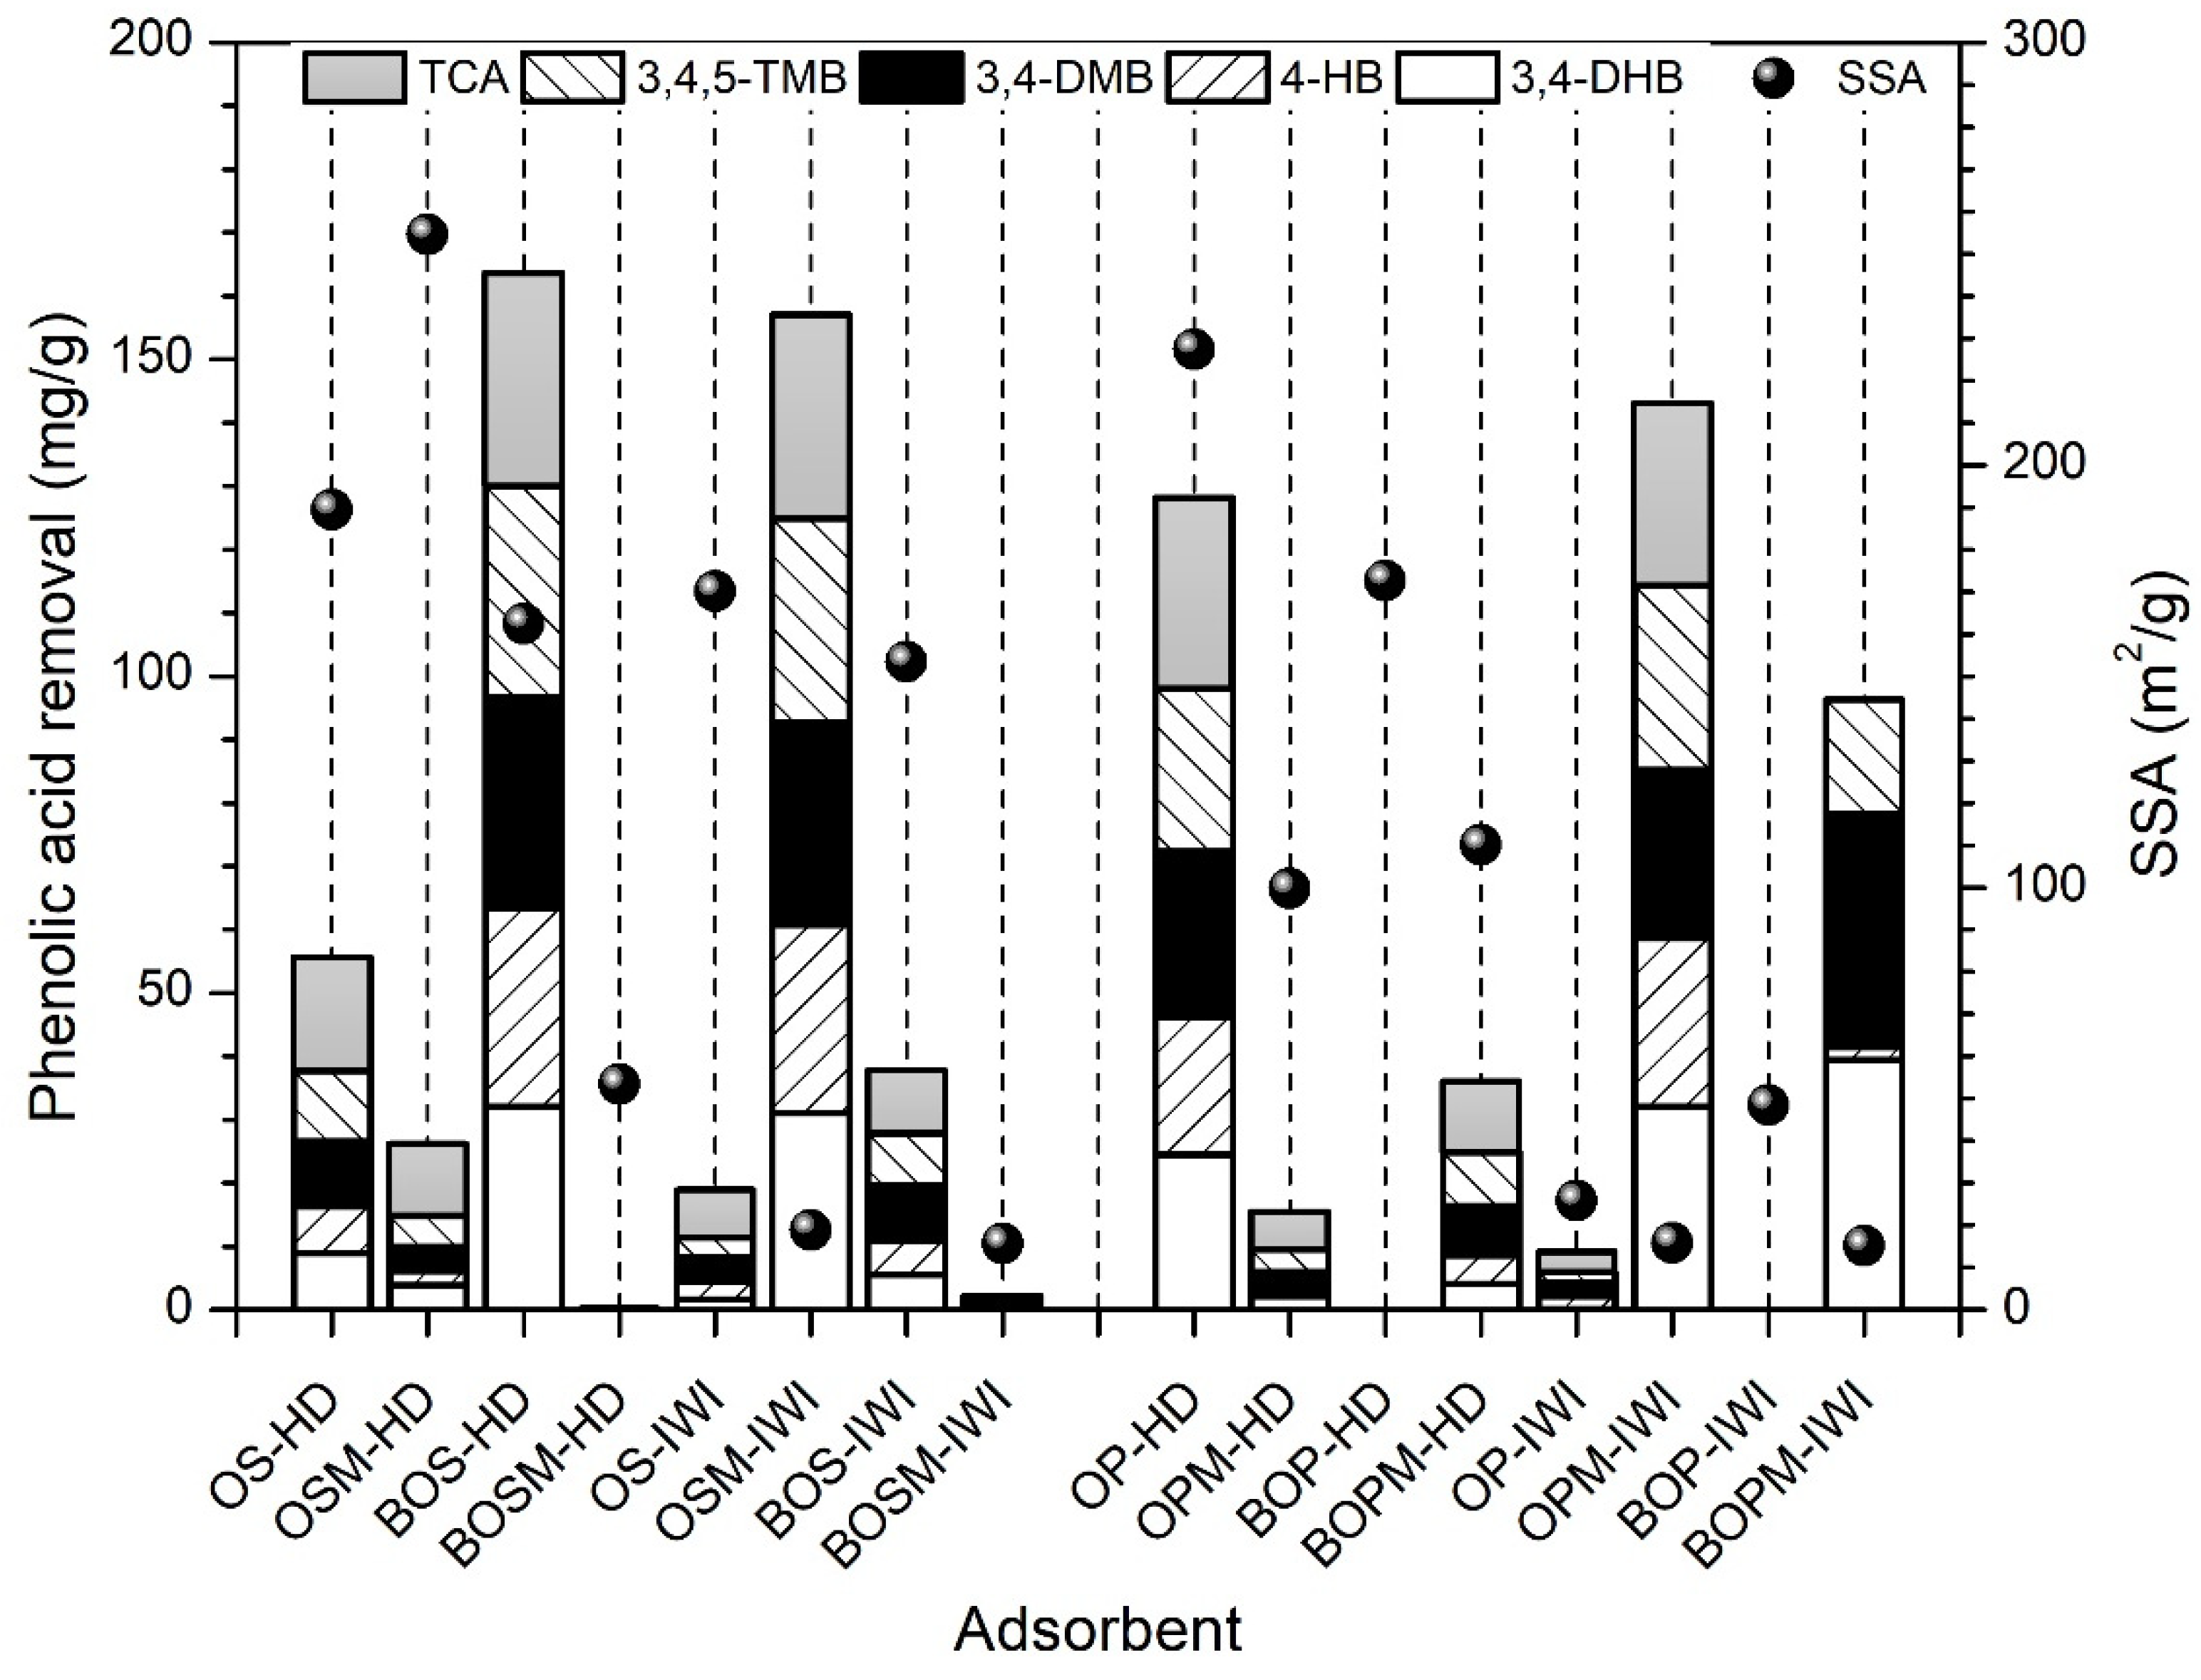
This waste material was recovered from OMW and was prepared to be used for the phenolic acid removal through its adsorption capacity. The amount of phenolic acids removed by the adsorption of the materials studied in this work is presented in Figure 5 and in function to the specific surface area of each prepared material (also presented in Table 1).
From Figure 5, it is possible to observe that, among the OS and OP materials, BOS-HD and OSM-IWI and OP-HD and OPM-IWI were the better materials to adsorb all phenolic acids considered in this study, even though the total amount that could be adsorbed was not reached in the conditions applied. BOS-HD, OSM-IWI, OP-HD, and OPM-IWI adsorb 163.6, 157.1, 128.1, and 143.1 mg/g of phenolic acid from a total of 200 mg/g. Abid et al. [21] prepared biochar using the solid fraction of OMW provided from evaporation lagoons through pyrolysis at different temperatures of 450 °C, 550 °C, and 650 °C for polyphenol removal. The materials obtained present a very low surface area from 2.77 to 6.39 m2/g, and the pHzpc was from 8.7 and 9.7, increasing with temperature. The authors obtained a maximum removal of 140.47 mg/g of polyphenol for the best material [21]. The adsorbent capacity of these four materials is patent on the removal rate in 30 min of contact, which was 82%, 79%, 64%, and 72% for BOS-HD, OSM-IWI, OP-HD, and OPM-IWI, respectively. This removal obtained in such a short period of contact is a signal of the adsorption capacity these materials have for phenolic acids.
The highest SSA value is partially related to a high phenolic acid removal rate by adsorption since for some materials, such as OSM-HD and BOP-HD with high surface areas, very low phenolic acid removal was observed. BOS-HD and OP-HD possess 162.5 and 227.4 m2/g, respectively, while OSM-IWI and OPM-IWI possess 18.9 and 15.0 m2/g, respectively. Also, the high adsorption capacity can be correlated with pHzpc, because the same materials present values of 6.6, 6.1, 10.3, and 10.2, and the values of ΔpH are closer to zero for the first two materials but highly positive for OSM-IWI and OPM-IWI. In addition, the degree of graphitization does not indicate a correlation between adsorption properties due to values between 0.69 and 0.84.
According to the results, the IWI modification for the OS and OP materials proved that it can produce a lower specific surface area (BET, Table 1) compared to the HD method. However, the chemical modification with the NaOH solution before the IWI application proved to decrease the surface area and promote the increase in pHzpc (Table 1). This higher pHzpc also reveals that this material can be useful for the removal of phenolic acids (Figure 5 and Table 1). In fact, as previously discussed for the pHzpc analysis, the electrostatic interaction seems to have the most relevant role in the modified materials. Kah et al. [44] verified tannic acid removal which is neutral around a pH of 4.5, and when the pH increases above 4.5, the interaction between the biochar surfaces decreases due to the repulsing effect. Abid et al. [21] also verified the higher removal of polyphenol content for the high pHzpc value, obtaining a removal of 40%. On the other hand, in the present study, the biochar production (except for BOS-HD) was not as relevant for phenolic acid adsorption as the chemical modification (Figure 5).
Considering the preparation method, it is possible to conclude that, in general, the modification with NaOH followed by the IWI method is the better way to obtain material (among the methods studied in this work) with a higher adsorption capacity.
To compare the results of the present study with the commercially activated carbon for phenolic acid removal, some studies will be presented. Lu and Sorial [54] used the activated carbon commercial to remove o-cresol and 2-ethylphenol and were able to remove 176 mg/g and 207 mg/g, respectively, using a single solution of each and a higher concentration of phenolic compounds. Méndez-Díaz et al. [55] removed about 242.9 mg/g of phthalic acid using activated carbon, but the initial concentration ranged from 50 to 500 mg/L. Senol et al. [56] used activated carbon to remove phenolic content and achieved a 38–40% removal in 2 h. Bouharat et al. [57] removed 3.7 g/L of phenolic content from OMW using 4 g of activated carbon in 5 min. Therefore, according to our results, the prepared materials have a high adsorption capacity like activated carbon and were obtained from OMW solid waste, which can work as a circular economy approach.
The possible mechanisms and interactions between adsorbent and adsorbate were discussed. But for this, it is important to consider the chemical structure of the different phenolic acids presented in the work, as can be seen in Table 2.
In fact, according to the characterization of the materials presented in Section 2, it is possible to see some differences in the prepared materials. These main differences are in the surface area, pHzpc, and surface morphology. However, the nature of adsorbates is not so different; all of them possess an aromatic ring and carboxylic groups, and two of them possess phenol groups, as can be seen in Table 2.
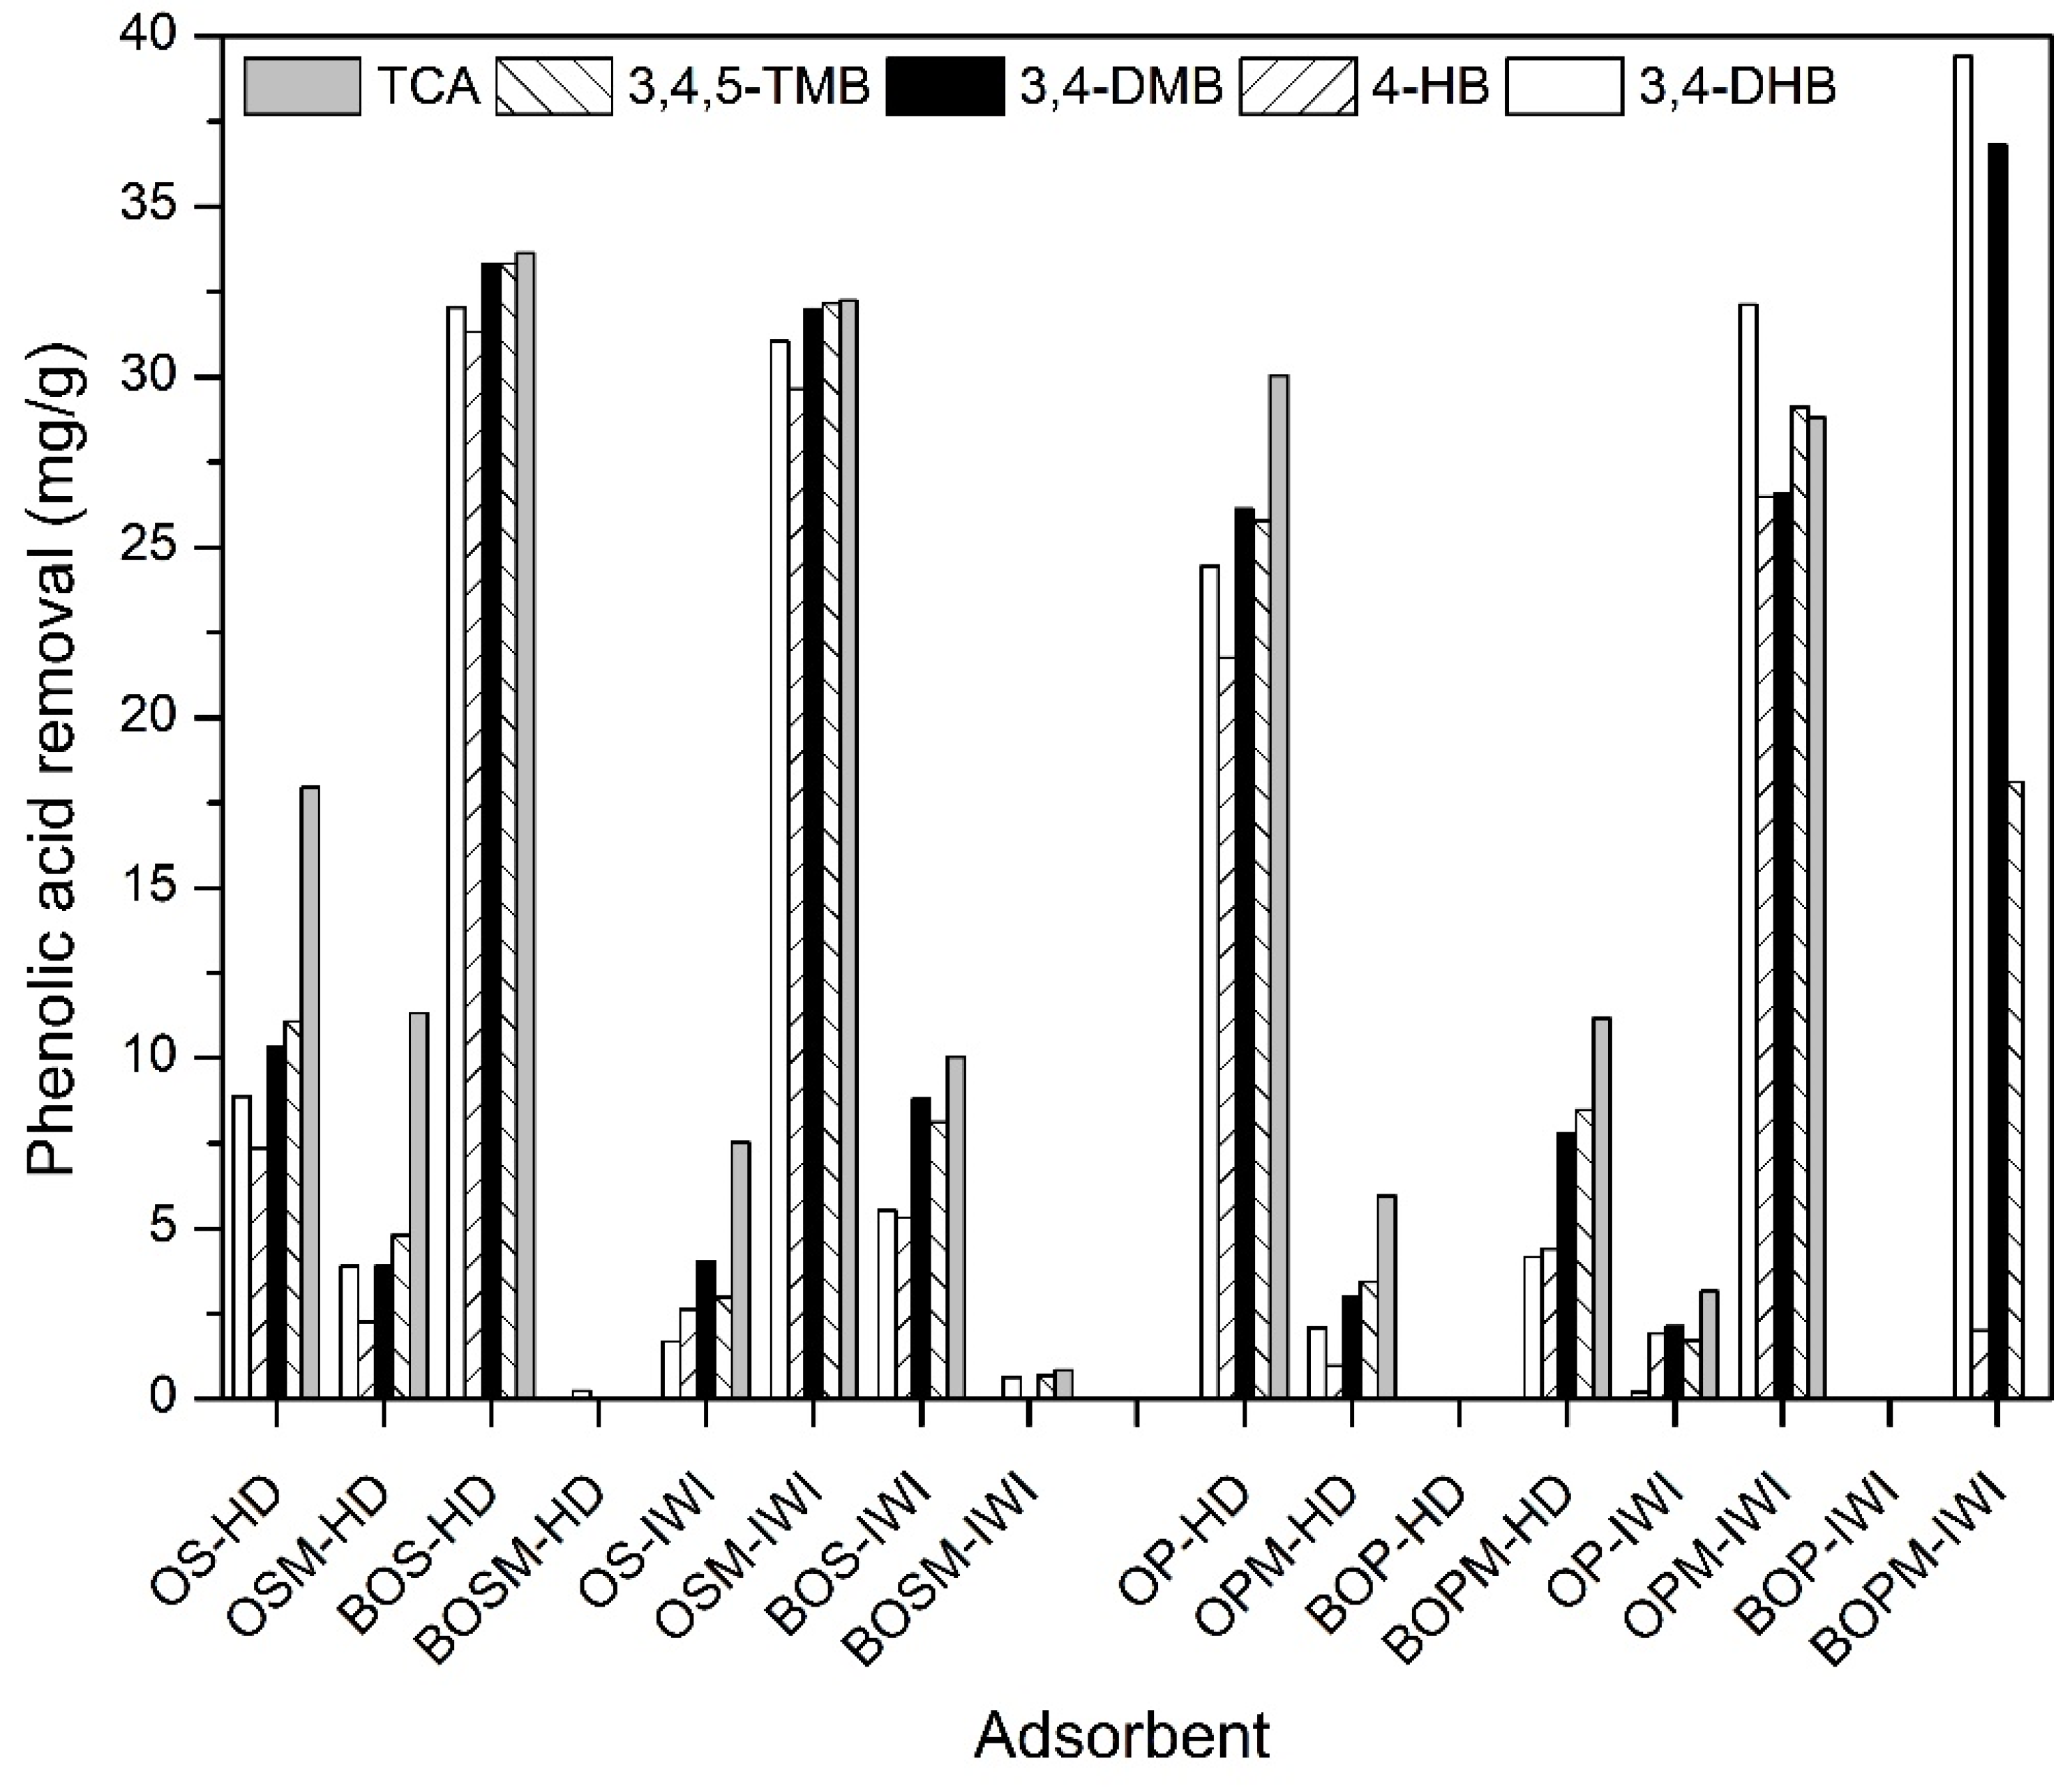
Figure 6 shows the adsorbed amount of each phenolic acid in the function of the prepared materials.
As can be seen in Figure 6, it seems in general that the adsorbents do not make any adsorbate selection, except for BOPM-IWI, which clearly has a preference for 3,4-DHB and 3,4-DMB. This similarity can be related to the way that the adsorption occurs on the material surface as previously discussed [58,59]. The phenolic acids used in the work (Table 2) can be in the protonated and deprotonated forms, which can affect the interaction with the adsorbents. In some of these materials, multilayer adsorption may occur through hydrogen bonds, electrostatic interaction (due to the electrostatic potential maps [22,60]), and π–π interaction [61]. So, the chemical nature of the adsorbates could be contributing to accumulative adsorption, especially in materials with a low surface area. Romero-Cano et al. [62] used orange peels for phenol adsorption and concluded that the presence of carboxylic groups in the adsorbent can produce hydrogen bonds between the hydroxyl group of the absorbates. Moreover, according to our results, it is possible to see that the electron donor–acceptor interactions between the oxygen and phenol groups as well as the hydrogen bonds between the carboxylic groups can be mainly responsible for the adsorption success.

4. Conclusions

In this work, a part of olive mill waste (olive pomace and stone) was used to produce adsorbents to reduce the toxicity of olive mill wastewater, related to the presence of five phenolic acids. The different preparation methods are biochar production, chemical (NaOH) and physical modifications (incipient wetness impregnation and hydrothermal treatment), and some combinations of them. From the materials produced, it was possible to note that the physical methods, IWI and HD, had different impacts regarding the surface area characteristics. The IWI method produced materials with a lower surface area contrary to the HD method. However, the chemical modification produced materials with high pHzpc values, which have a relevant impact on phenolic acid removal. Therefore, the combination of physical and chemical modifications can produce interesting materials for phenolic acid removal. From the phenolic acid removal, it was possible to conclude that there was no selective character of the waste-modified materials. The FTIR profiles indicate the presence of O-H and N-H for all samples and probably are the polarity groups responsible for the adsorption. With this work, it was possible to produce adsorbents from olive mill waste to adsorb five phenolic acids in simulated olive wastewater. These low-cost materials can be a good solution to reduce the toxicity of OMW, reducing the phenolic content.

Author Contributions

Conceptualization, J.G., R.C.M., and E.D.; methodology, K.d.O.R., F.B., and P.M.; validation, P.M., J.G., R.C.M., and E.D.; investigation, K.d.O.R., F.B., and P.M.; resources, J.G., R.C.M., and E.D.; data curation, K.d.O.R., F.B., and P.M.; writing—original draft preparation, K.d.O.R., J.G., and E.D.; writing—review and editing, J.G., R.C.M., and E.D.; supervision, J.G., R.C.M., and E.D.; funding acquisition, J.G., R.C.M., and E.D. All authors have read and agreed to the published version of the manuscript.

Funding

This research was funded by FCT (Fundação para a Ciência e Tecnologia, Portugal) for the financial support (CEECIND/01207/2018). Thanks are due to FCT/MCTES for the financial support to CERES (UIDB/00102/2020) and to CAPES Print (Process 88887.839535/2023-00).

Data Availability Statement

Data available on request due to privacy restrictions.

Conflicts of Interest

The authors declare no conflicts of interest.

References

  1. The World of Olive Oil. Available online: https://www.internationaloliveoil.org/the-world-of-olive-oil/ (accessed on 20 January 2024).
  2. Ioannou-Ttofa, L.; Michael-Kordatou, I.; Fattas, S.C.; Eusebio, A.; Ribeiro, B.; Rusan, M.; Americano, A.R.B.; Zuraiqi, S.; Waismand, M.; Linder, C.; et al. Treatment efficiency and economic feasibility of biological oxidation, membrane filtration and separation processes, and advanced oxidation for the purification and valorization of olive mill wastewater. Water Res. 2017, 114, 1–13. [Google Scholar] [CrossRef] [PubMed]
  3. Liu, R.; Lu, M.; Zhang, T.; Zhang, Z.; Jin, Q.; Chang, M.; Wang, X. Evaluation of the antioxidant properties of micronutrients in different vegetable oils. Eur. J. Lipid Sci. Technol. 2020, 122, 1900079. [Google Scholar] [CrossRef]
  4. Calabrò, P.S.; Fòlino, A.; Tamburino, V.; Zappia, G.; Zema, D.A. Increasing the tolerance to polyphenols of the anaerobic digestion of olive wastewater through microbial adaptation. Biosyst. Eng. 2018, 172, 19–28. [Google Scholar] [CrossRef]
  5. Medouni-Haroune, L.; Zaidi, F.; Medouni-Adrar, S.; Kecha, M. Olive pomace: From an olive mill waste to a resource, an overview of the new treatments. J. Crit. Rev. 2018, 5, 1–6. [Google Scholar] [CrossRef]
  6. Domingues, E.; Fernandes, E.; Gomes, J.; Castro-Silva, S.; Martins, R.C. Olive oil extraction industry wastewater treatment by coagulation and Fenton’s process. J. Water Proc. Eng. 2021, 39, 101818. [Google Scholar] [CrossRef]
  7. Azbar, N.; Bayram, A.; Filibeli, A.; Muezzinoglu, A.; Sengul, F.; Ozer, A. A review of waste management options in olive oil production. Crit. Rev. Environ. Sci. Technol. 2004, 34, 209–247. [Google Scholar] [CrossRef]
  8. Paraskeva, P.; Diamadopoulos, E. Technologies for olive mill wastewater (OMW) treatment: A review. J. Chem. Technol. Biotechnol. 2006, 81, 1475–1485. [Google Scholar] [CrossRef]
  9. Sampaio, M.A.; Gonçalves, M.R.; Marques, I.P. Anaerobic digestion challenge of raw olive mill wastewater. Bioresour. Technol. 2011, 102, 10810–10818. [Google Scholar] [CrossRef]
  10. Amaral-Silva, N.; Martins, R.C.; Nunes, P.; Castro-Silva, S.; Quinta-Ferreira, R.M. From a lab test to industrial application: Scale-up of Fenton process for real olive mill wastewater treatment. J. Chem. Technol. Biotechnol. 2017, 92, 1336–1344. [Google Scholar] [CrossRef]
  11. Bovina, S.; Frascari, D.; Ragini, A.; Avolio, F.; Scarcella, G.; Pinelli, D. Development of a continuous-flow anaerobic co-digestion process of olive mill wastewater and municipal sewage sludge. J. Chem. Technol. Biotechnol. 2021, 96, 532–543. [Google Scholar] [CrossRef]
  12. Al-Bsoul, A.; Al-Shannag, M.; Tawalbeh, M.; Al-Taani, A.A.; Lafi, W.K.; Al-Othman, A.; Alsheyab, M. Optimal conditions for olive mill wastewater treatment using ultrasound and advanced oxidation processes. Sci. Total Environ. 2020, 700, 134576. [Google Scholar] [CrossRef]
  13. Shabir, S.; Ilyas, N.; Saeed, M.; Bibi, F.; Sayyed, R.Z.; Almalki, W.H. Treatment technologies for olive mill wastewater with impacts on plants. Environ. Res. 2023, 216, 114399. [Google Scholar] [CrossRef] [PubMed]
  14. Vaz, T.; Quina, M.M.J.; Martins, R.C.; Gomes, J. Olive mill wastewater treatment strategies to obtain quality water for irrigation: A review. Sci. Total Environ. 2024, 931, 72676. [Google Scholar] [CrossRef] [PubMed]
  15. Mata-Sánchez, J.; Pérez-Jiménez, J.A.; Díaz-Villanueva, M.J.; Serrano, A.; Núñez-Sánchez, N.; López-Giménez, F.J. Corrosive properties prediction from olive byproducts solid biofuel by near infrared spectroscopy. Energy Fuels 2014, 28, 5136–5143. [Google Scholar] [CrossRef]
  16. Del Mar Contreras, M.; Romero, I.; Moya, M.; Castro, E. Olive-derived biomass as a renewable source of value-added products. Process Biochem. 2020, 97, 43–56. [Google Scholar] [CrossRef]
  17. Christoforou, E.; Fokaides, P.A. A review of olive mill solid wastes to energy utilization techniques. Waste Manag. 2016, 49, 346–363. [Google Scholar] [CrossRef]
  18. Duman, A.K.; Özgen, G.Ö.; Üçtuğ, F.G. Environmental life cycle assessment of olive pomace utilization in Turkey. Sustain. Prod. Consum. 2020, 22, 126–137. [Google Scholar] [CrossRef]
  19. Lyu, H.; Zhang, Q.; Shen, B. Application of biochar and its composites in catalysis. Chemosphere 2020, 240, 124842–124852. [Google Scholar] [CrossRef]
  20. Wang, J.; Wang, S. Preparation, modification and environmental application of biochar: A review. J. Clean. Prod. 2019, 227, 1002–1022. [Google Scholar] [CrossRef]
  21. Abid, N.; Masmoudi, M.A.; Megdiche, M.; Barakat, A.; Ellouze, M.; Chamkha, M.; Ksibi, M.; Sayadi, S. Biochar from olive mill solid waste as an eco-friendly adsorbent for the removal of polyphenols from olive mill wastewater. Chem. Eng. Res. Des. 2022, 181, 384–398. [Google Scholar] [CrossRef]
  22. Rocha, K.O.; Brandão, F.; Mendes, C.; Carvalho, M.G.V.S.; Mazierski, P.; Zaleska-Medynska, A.; Gomes, J.; Martins, R.C.; Domingues, E. Olive mill waste bio-based catalyst application in advanced oxidation processes for wastewater treatment. Catal. Today 2024, 432, 114618. [Google Scholar] [CrossRef]
  23. Naghmouchi, I.; Mutjé, P.; Boufi, S. Olive stones flour as reinforcement in polypropylene composites: A step forward in the valorization of the solid waste from the olive oil industry. Ind. Crops Prod. 2015, 72, 183–191. [Google Scholar] [CrossRef]
  24. Akbas, Y.A.; Yuan, S. Development, and characterization of non-treated and chemically modified olive pomace biosorbents to remove Ce(III) ions from aqueous solutions. J. Radioanal. Nucl. Chem. 2020, 323, 763–772. [Google Scholar] [CrossRef]
  25. Stasinakis, A.S.; Elia, I.; Petalas, A.V.; Halvadakis, C.P. Removal of total phenols from olive-mill wastewater using an agricultural by-product, olive pomace. J. Hazard Mater. 2008, 160, 408–413. [Google Scholar] [CrossRef]
  26. Akar, T.; Tosun, I.; Kaynak, Z.; Ozkara, E.; Yeni, O.; Sahin, E.N.; Akar, S.T. An attractive agro-industrial by-product in environmental cleanup: Bye biosorption potential of untreated olive pomace. J. Hazard Mater. 2009, 166, 1217–1225. [Google Scholar] [CrossRef] [PubMed]
  27. Moubarik, A.; Grimi, N. Valorization of olive stone and sugar cane bagasse by-products as biosorbents for the removal of cadmium from aqueous solution. Food Res. Int. 2015, 73, 169–175. [Google Scholar] [CrossRef]
  28. Tomul, A.; Arslan, Y.; Kabak, B.; Trak, D.; Kendüzler, E.; Lima, E.C.; Tran, H.N. Peanut shells-derived biochars prepared from different carbonization processes: Comparison of characterization and mechanism of naproxen adsorption in water. Sci. Total Environ. 2020, 726, 137828. [Google Scholar] [CrossRef]
  29. Jedynak, K.; Charmas, B. Adsorption properties of biochars obtained by KOH activation. Adsorption 2024, 30, 167–183. [Google Scholar] [CrossRef]
  30. Wang, J.; Bai, Z. Fe-based catalysts for heterogeneous catalytic ozonation of emerging contaminants in water and wastewater. Chem. Eng. J. 2017, 312, 79–98. [Google Scholar] [CrossRef]
  31. Lan, B.; Huang, R.; Li, L.; Yan, H.; Liao, G.; Wang, X.; Zhang, Q. Catalytic ozonation of p-chlorobenzoic acid in aqueous solution using Fe-MCM-41 as catalyst. Chem. Eng. J. 2013, 219, 346–354. [Google Scholar] [CrossRef]
  32. Esteves, B.M.; Morales-Torres, S. Maldonado-Hódar, F.J.; Madeira, L.M. Integration of olive stones in the production of Fe/AC-catalysts for the CWPO treatment of synthetic and real olive mill wastewater. Chem. Eng. J. 2021, 411, 128451. [Google Scholar] [CrossRef]
  33. Frainetti, A.J.; Klinghoffer, N.B. Recent experimental advances on the utilization of biochar as a tar reforming catalyst: A review. Int. J. Hydrogen Energy 2023, 48, 8022–8044. [Google Scholar] [CrossRef]
  34. Gustafsson, J.; Mikkola, P.; Jokinen, M.; Rosenholm, J.B. The influence of pH and NaCl on the zeta potential and rheology of anatase dispersions. Colloids Surf. A Physicochem. Eng. Asp. 2000, 175, 349–359. [Google Scholar] [CrossRef]
  35. Salis, A.; Boström, M.; Medda, L.; Cugia, F.; Barse, B.; Parsons, D.F.; Ninham, B.W.; Monduzzi, M. Measurements and Theoretical Interpretation of Points of Zero Charge/Potential of BSA Protein. Langmuir 2011, 27, 11597–11604. [Google Scholar] [CrossRef]
  36. Domingues, E.; Assunção, N.; Gomes, J.; Lopes, D.V.; Frade, J.R.; Quina, M.J.; Quinta-Ferreira, R.; Martins, R.C. Catalytic efficiency of red mud for the degradation of olive mill wastewater through heterogeneous Fenton’s process. Water 2019, 11, 1183. [Google Scholar] [CrossRef]
  37. Shan, X.; Guo, X.; Yin, Y.; Miao, Y.; Dong, H. Surface modification of graphene oxide by goethite with enhanced tylosin photocatalytic activity under visible light irradiation. Colloids Surf. A Physicochem. Eng. Asp. 2017, 520, 420–427. [Google Scholar] [CrossRef]
  38. Anstey, A.; Vivekanandhan, S.; Rodriguez-Uribe, A.; Misra, M.; Mohanty, A.K. Oxidative acid treatment and characterization of new biocarbon from sustainable Miscanthus biomass. Sci. Total Environ. 2016, 550, 241–247. [Google Scholar] [CrossRef]
  39. Le, K.C.; Henriksson, J.; Bengtsson, P.-E. Polarization effects in Raman spectroscopy of light-absorbing carbon. J. Raman Spectr. 2021, 52, 1115–1122. [Google Scholar] [CrossRef]
  40. Ferrari, A.; Baski, D.M. Raman spectroscopy as a versatile tool for studying the properties of graphene. Nat. Nanotechnol. 2013, 8, 235–246. [Google Scholar] [CrossRef]
  41. Plessis, M. Relationship between specific surface area and pore dimension of high porosity nanoporous silicon—Model and experiment. Phys. Status Solidi (a) 2007, 204, 2319–2328. [Google Scholar] [CrossRef]
  42. Lim, C.K.; Bay, H.H.; Noeh, C.H.; Aris, A.; Majid, Z.A.; Ibrahin, Z. Application of zeolite-activated carbon macrocomposite for the adsorption of acid orange 7: Isotherm. Kinetic and thermodynamic studies. Environ. Sci. Pollut. Res. 2013, 20, 7243–7255. [Google Scholar] [CrossRef]
  43. Nawrocki, J.; Rigney, M.; McCormick, A.; Carr, P.W. Chemistry of zirconia and its use in chromatography. J. Chromatogr. A 1993, 657, 229–282. [Google Scholar] [CrossRef] [PubMed]
  44. Kah, M.; Sigmund, G.; Xiao, F.; Hofmann, T. Sorption of ionizable and ionic organic compounds to biochar, activated carbon and other carbonaceous materials. Water Res. 2017, 124, 673–692. [Google Scholar] [CrossRef] [PubMed]
  45. Lawal, A.A.; Hassan, M.A.; Farid, M.A.A.; Yasim-Anuar, T.A.T.; Samsudin, M.H.; Yusoff, M.Z.M.; Zakaria, M.R.; Mokhtar, M.N.; Shirai, Y. Adsorption mechanism and effectiveness of phenol and tannic acid removal by biochar produced from oil palm frond using steam pyrolysis. Environ. Poll. 2021, 269, 116197. [Google Scholar] [CrossRef]
  46. Ballesteros, I.; Oliva, J.M.; Saez, F.; Ballesteros, M. Ethanol production from lignocellulosic byproducts of olive oil extraction. Appl. Biochem. Biotechnol. 2001, 91, 237–252. [Google Scholar] [CrossRef] [PubMed]
  47. Miranda, I.; Simões, R.; Medeiros, B.; Nampoothiri, K.M.; Sukumaran, R.K.; Rajan, D.; Pereira, H.; Ferreira-Dias, S. Valorization of lignocellulosic residues from the olive oil industry by production of lignin, glucose and functional sugars. Bioresour. Technol. 2019, 292, 121936. [Google Scholar] [CrossRef]
  48. Marciniak, M.; Goscianska, J.; Pietrzak, R. Physicochemical characterization of ordered mesoporous carbons functionalized by wet oxidation. J. Mater. Sci. 2018, 53, 5997–6007. [Google Scholar] [CrossRef]
  49. Ashan, M.A.; Islam, M.T.; Hernandez, C.; Castro, E.; Katla, S.K.; Kim, H. Biomass conversion of saw dust to a functionalized carbonaceous materials for the removal of Tetracycline, Sulfamethoxazole and Bisphenol A from water. J. Environ. Chem. Eng. 2018, 6, 4329–4338. [Google Scholar]
  50. Teng, D.; Zhang, B.; Xu, G.; Wang, B.; Mao, K.; Wang, J.; Sun, J.; Feng, X.; Yang, Z.; Zhang, H. Efficient removal of Cd(II) from aqueous solution by pinecone biochar: Sorption performance and governing mechanisms. Environ. Pollut. 2020, 265, 115001. [Google Scholar] [CrossRef]
  51. Wie, J.; Tu, C.; Yuan, G.; Liu, Y.; Bi, D.; Xiao, L.; Lu, J.; Theng, B.K.G.; Wang, H.; Zhang, X. Assessing the effect of pyrolysis temperature on the molecular properties and copper sorption capacity of a halophyte biochar. Environ. Pollut. 2019, 251, 56–65. [Google Scholar]
  52. Vaughn, S.F.; Kenar, J.A.; Thompson, A.R.; Peterson, S.C. Comparison of biochars derived from wood pellets and pelletized wheat straw as replacements for peat in potting substrates. Ind. Crops. Prod. 2013, 51, 437–443. [Google Scholar] [CrossRef]
  53. Schaftenaar, G.; de Vlieg, J. Quantum mechanical polar surface area. J. Comput. Aided Mol. Des. 2012, 26, 311–318. [Google Scholar] [CrossRef]
  54. Lu, Q.; Sorial, G.A. Adsorption of phenolics on activated carbon––Impact of pore size and molecular oxygen. Chemosphere 2004, 55, 671–679. [Google Scholar] [CrossRef] [PubMed]
  55. Méndez-Díaz, J.D.; Abdel daiem, M.M.; Rivera-Utrilla, J.; Sánchez-Polo, M.; Bautista-Toledo, I. Adsorption/bioadsorption of phthalic acid, an organic micropollutant present in landfill leachates, on activated carbons. J. Colloid Interface Sci. 2012, 369, 358–365. [Google Scholar] [CrossRef]
  56. Bouharat, D.; Yousfi, F.E.; Ellaghdach, A.; Souhail, B.D.; Alaoui, N.S. Physico-chemical characterization of olive-oil mill wastewaters of Ben Karrich area (Tetouan province, North of Morocco) and optimization study of their treatment using activated carbon. Mediterr. J. Chem. 2018, 7, 253–258. [Google Scholar] [CrossRef]
  57. Senol, A.; Hasdemir, İ.M.; Hasdemir, B.; Kurdaş, İ. Adsorptive removal of biophenols from olive mill wastewaters (OMW) by activated carbon: Mass transfer, equilibrium and kinetic studies. Asia-Pac. J. Chem. Eng. 2017, 12, 128–146. [Google Scholar] [CrossRef]
  58. Tang, C.; Ni, Z.; Xu, C.; Luo, Y.; Cai, X.; Gao, Q.; Fang, Y.; Zhong, G.; Qiu, R.; Zhang, S. Enhanced adsorption of organic pollutants using N-doped porous carbon derived from hemp stems: Insights into the mechanism. Sep. Purif. Technol. 2024, 333, 125878. [Google Scholar] [CrossRef]
  59. Solomakou, N.; Goula, A.M. Treatment of olive mill wastewater by adsorption of phenolic compounds. Rev. Environ. Sci. Biotechnol. 2021, 20, 839–863. [Google Scholar] [CrossRef]
  60. Wang, M.; Fu, M.; Li, J.; Niu, Y.; Zhang, Q.; Sun, Q. New insight into polystyrene ion exchange resin for efficient cesium sequestration: The synergistic role of confined zirconium phosphate nanocrystalline. Chin. Chem. Lett. 2024, 35, 108442. [Google Scholar] [CrossRef]
  61. Achak, M.; Hafidi, A.; Mandi, L.; Ouazzani, N. Removal of phenolic compounds from olive mill wastewater by adsorption onto wheat bran. Desalin. Water Treat. 2014, 52, 2875–2885. [Google Scholar] [CrossRef]
  62. Romero-Cano, L.A.; Gonzalez-Gutierrez, L.V.; Baldenegro-Perez, L.A. Biosorbents prepared from orange peels using instant controlled pressure drop for Cu (II) and phenol removal. Ind. Crops Prod. 2016, 84, 344–349. [Google Scholar] [CrossRef]
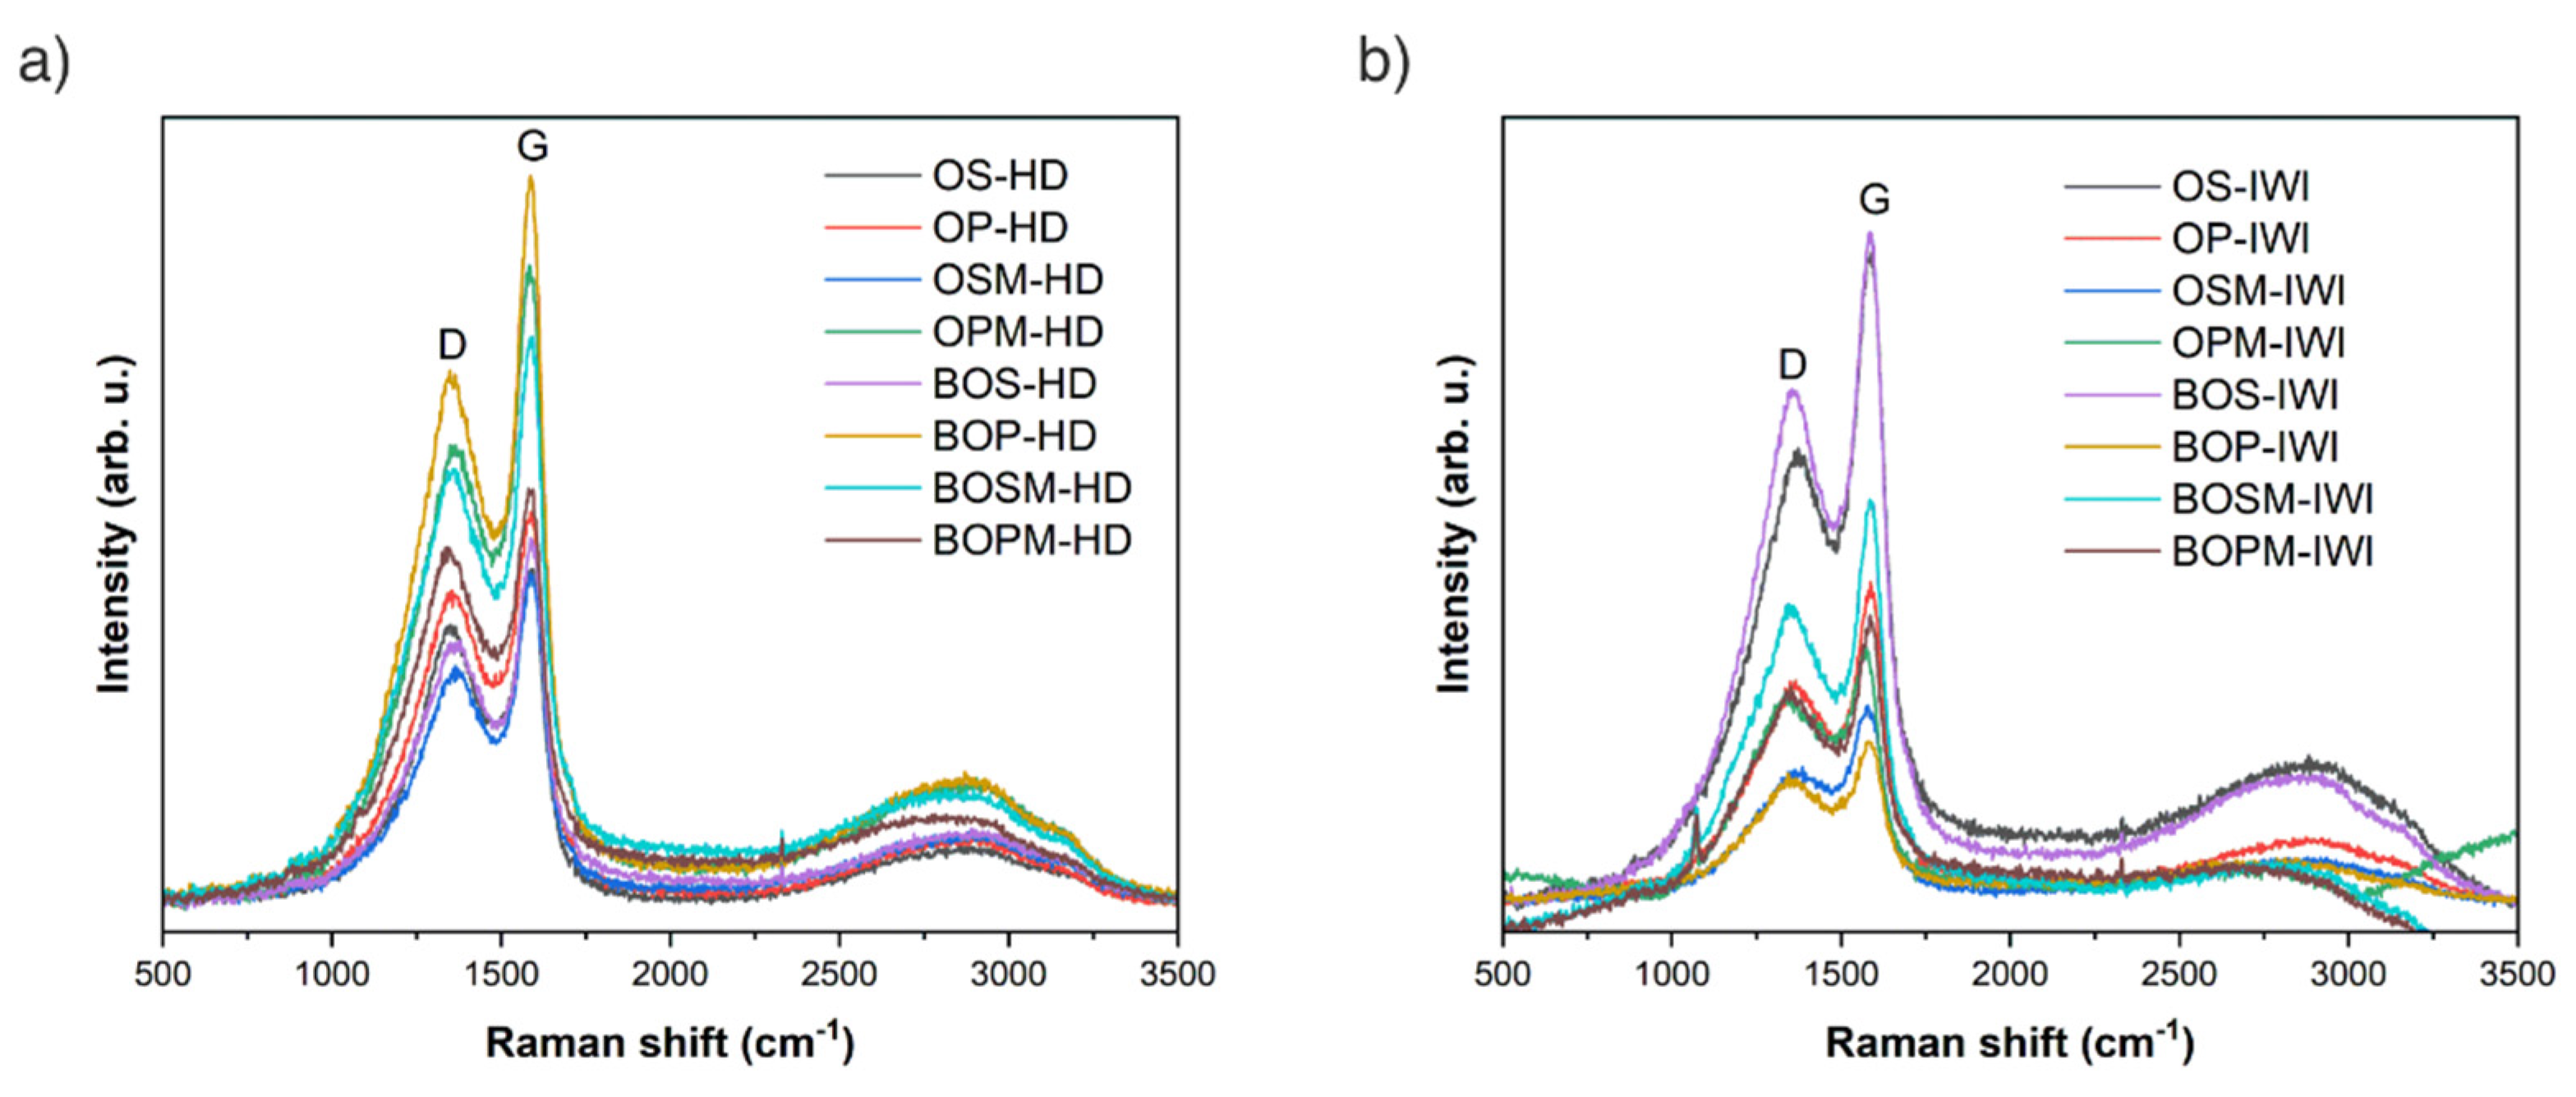
Figure 1. Raman spectra of samples prepared by (a) HD and (b) IWI methods.
Water 16 02379 g001
Figure 2. HR-SEM images of samples prepared by (a) HD and (b) IWI methods.
Water 16 02379 g002
Figure 3. Zero-point charge for the different prepared materials: (a) OS- and HD-related materials; (b) OS- and IWI-related materials; (c) OP- and HD-related materials; (d) OP- and IWI-related materials.
Water 16 02379 g003
Figure 4. FTIR (a) from 4000 to 2000 cm−1; (b) from 2000 to 650 cm−1; of OSM-IWI, BOS-HD, OP-HD, and OPM-IWI.
Water 16 02379 g004
Figure 5. Adsorption capacity of the prepared materials. Bars are related to the phenolic acid removal by adsorption of OS- and OP-based materials (mg/g), and dashed lines connected balls related to specific surface area (SSA) (m2/g).
Water 16 02379 g005
Figure 6. Adsorption capacity of the prepared materials. Bars are related to the phenolic acid removal by adsorption of OS- and OP-based materials (mg/g).
Water 16 02379 g006
Table 1. pHzpc, BET surface area, pore size and volume, and ID/IG ratio of prepared samples.
Sample LabelpHzpcBET (m2/g)Pore Size (nm)Pore Volume (cm3/g)ID/IG (Based on Raman)
OS-HD4.4189.46.10.0760.83
OP-HD6.1227.44.70.0670.78
OSM-HD5.8254.64.30.0650.72
OPM-HD10.799.75.20.0390.73
BOS-HD6.6162.54.50.0490.71
BOP-HD9.5172.64.80.0570.71
BOSM-HD10.453.35.20.0410.76
BOPM-HD10.1110.14.80.0520.83
OS-IWI6.6170.14.80.0450.66
OP-IWI7.625.85.90.0290.70
OSM-IWI10.318.96.20.0260.69
OPM-IWI10.215.98.40.0430.84
BOS-IWI6.6153.44.40.0430.76
BOP-IWI10.648.49.30.0450.77
BOSM-IWI10.315.66.10.0290.74
BOPM-IWI11.015.16.90.0350.73
OS6.317.55.80.034-
OP6.815.35.90.036-
Table 2. Molecular structure of phenolic acids used in the study.
TCA3,4,5-TMB3,4-DMB4-HB3,4-DHB
Water 16 02379 i001Water 16 02379 i002Water 16 02379 i003Water 16 02379 i004Water 16 02379 i005
Disclaimer/Publisher’s Note: The statements, opinions and data contained in all publications are solely those of the individual author(s) and contributor(s) and not of MDPI and/or the editor(s). MDPI and/or the editor(s) disclaim responsibility for any injury to people or property resulting from any ideas, methods, instructions or products referred to in the content.