Article

Runoff Control Performance of Three Typical Low-Impact Development Facilities: A Case Study of a Community in Beijing

1
College of Architecture & Civil Engineering, Beijing University of Technology, Beijing 100124, China
2
China Academy of Urban Planning & Design, Beijing 100124, China
*
Author to whom correspondence should be addressed.
Water 2024, 16(17), 2373; https://doi.org/10.3390/w16172373
Submission received: 31 July 2024 / Revised: 20 August 2024 / Accepted: 22 August 2024 / Published: 23 August 2024
(This article belongs to the Special Issue Urban Flood Frequency Analysis and Risk Assessment)

Abstract

:
The development of sponge cities advocates for sustainable urban rainwater management, effectively alleviating urban flood disasters, reducing non-point-source pollution, and promoting the recycling of rainwater resources. Low-Impact Development (LID) serves as a key strategy in this context, providing essential support for urban rainwater control and pollution reduction. To investigate the runoff control effects of LID measures and to reveal the relationship between facility runoff control performance and installation scale, this study focuses on a sponge community in Beijing. A SWMM model was constructed to analyze the rainwater flood control and pollutant load reduction effects of different LID facilities, including bio-retention cells, green roofs, and permeable pavements. Using evaluation indicators such as surface runoff, node overflow, and pollutant control rates, this study examined how facility performance varies with installation scale under different rainfall conditions. The combination scheme of LID equipment optimal configuration is designed by using multiple criteria decision analysis (MCDA) and cost–benefit theory. The results indicate significant differences in performance among the various LID facilities across different rainfall scenarios. Specifically, the optimal installation proportion for runoff and overflow control of permeable pavements were found to be between 30% and 70%. Green roofs demonstrate superior performance in handling extreme rainfall events, while bio-retention cells exhibit significant effectiveness in controlling Total Suspended Solids (TSSs). Through comprehensive performance evaluation, this study identified the optimal combination scale under a 3-year rainfall recurrence interval as 30% permeable pavements, 20% green roof, and 60% bio-retention cells. This combination effectively leverages the strengths of each facility, ensuring system stability and efficiency while also demonstrating optimal management efficiency in cost–benefit analyses. The findings of this research provide valuable insights for future urban water management and infrastructure development.

1. Introduction

Urban flooding refers to the phenomenon of water accumulation in urban areas caused by excessive runoff and node overflow due to insufficient drainage system capacity, which can lead to traffic congestion, building damage, and environmental pollution [1,2]. In recent years, urbanization has led to a significant decline in the permeability of underlying surfaces and a reduction in the time for surface runoff accumulation. Currently, drainage methods primarily focused on “rapid discharge” are insufficient to meet the demands of modern urban development, placing tremendous pressure on urban drainage systems, which is a major cause of urban floods [3]. Due to constraints such as infrastructure, land use, engineering difficulties, and social impacts, it is challenging to renovate pipeline networks in urban areas, particularly in older districts, to alleviate flood issues [4,5]. Against this backdrop, green infrastructure/LID has gained widespread attention in the engineering sector as a method for controlling surface runoff [6,7]. As a rainwater management concept, LID aims to minimize the environmental impact of land development and maintain rainwater runoff at natural levels [8].
LID facilities originated in the 1990s in Maryland, USA, and represent a sustainable urban rainwater management method [9]. LID facilities include permeable pavements, green roofs, and bioretention cells, which promote storage and infiltration by reducing surface impermeability. By decreasing the total amount of rainwater runoff entering the drainage system, LID facilities can alleviate the burden on drainage networks, thereby mitigating the occurrence of urban flood disasters [10,11]. Many scholars and experts have extensively studied and applied the effects of LID facilities on runoff control [12,13,14,15,16,17,18]. The performance of LID facilities is evaluated through a variety of methods, including numerical simulation and model analysis [19], field experiment and monitoring [20], spatial analysis and GIS application [21], multi-criteria decision analysis and cost–benefit analysis [22], climate change scenario simulation [23], and system evaluation and comprehensive application [24]. Xu et al. [19] proposed a method based on marginal cost greedy strategy (MCGS). By calculating the marginal cost and marginal benefit of each LID facility, the optimal allocation scheme can effectively balance the cost and control effect of the facility, and improve the practicability and economy of LID design. Chen et al. [25] studied the hydrological and water quality improvement effects of green infrastructure in integrated drainage overflow communities. It was found that green infrastructure could significantly improve water quality and hydrological conditions, reduce sewage overflow events, and improve the environmental quality of communities. Palla et al. [21] used the Web-GIS TRIG Eau platform to evaluate the mitigation effect of rainwater harvesting systems on urban flooding in two residential areas in Italy. Our study shows that a reasonable LID layout can effectively reduce flood risk and improve urban water resource management. Kaykhosravi et al. [22] proposed simplified geospatial models for ranking the effects of different LID solutions in urban runoff management. The results provide policy makers with strategies to achieve optimal runoff control with a limited budget. Yang et al. [23] evaluated the mitigation effect of LID facilities on urban floods and non-point source pollution under climate change, simulated the impact of future climate change on the performance of urban LID facilities, and found that with the increase of extreme weather events, the design of existing LID facilities may need to be adjusted to cope with greater rainfall. Martin-Miklea et al. [24] analyzed the mixed-use watershed to determine the priority implementation area of LID measures. Identifying the priority implementation area of LID can significantly improve the effect of water resource management, optimize land use, and enhance ecological benefits.
Most of the existing studies focused on improving the control effect of LID facilities, especially maximizing the control effect of runoff or floods by optimizing parameter design and spatial distribution under the condition of limited facility space or limited cost [26,27,28]. These studies have provided important guidance for engineering practice, especially in small-scale watershed or community-level projects. However, when the research is extended from local optimization to the regional scale, the impact of LID facility deployment scale on the overall control effect begins to emerge. The number and distribution density of LID facilities and their interaction with the hydrological system at the regional scale have not been systematically studied and quantitatively assessed. Therefore, the relationship between LID facility deployment scale and its control effect is still a gap in the research, which is worthy of further exploration.
The main objective of this study is to evaluate the runoff control performance of LID facilities and determine the relationship between the scale of LID facility deployment and their control effectiveness. A sponge city construction pilot community in Beijing is selected as the study subject, and a hydraulic model is established to simulate the runoff control and pollutant load reduction effects under different LID deployment schemes. Based on evaluation indicators such as surface runoff, node overflow, and pollutant control rates, this study analyzed how the runoff control effectiveness of different types of LID facilities varies with deployment scale under different rainfall conditions, thereby identifying the optimal deployment scale for various types of LID facilities. Lastly, through MCDA and cost–benefit theory, a combined scheme for the optimal deployment of LID facilities was designed.

2. Materials and Methods

Figure 1 illustrates the technical route of this study. Firstly, basic data such as pipe network, land cover, and rainfall in the study area were collected, which provided necessary data for the construction of hydrodynamic models, the simulation of drainage processes, and the promotion of LID facilities. Subsequently, the construction and calibration of the hydrodynamic model of the study area and the setting of LID facility parameters were completed using SWMM software (Version: 5.2). The design rainfall data are input into the established hydrodynamic model to simulate the drainage process. This process involved modeling the effects of different LID facilities on runoff, overflow, and pollution reduction at different deployment scales and comparing the results for different rainfall return periods. Finally, MCDA and cost–benefit analysis were used for decision-making to determine the optimal combination and deployment scale of LID facilities in the study area.

2.1. Study Area Overview

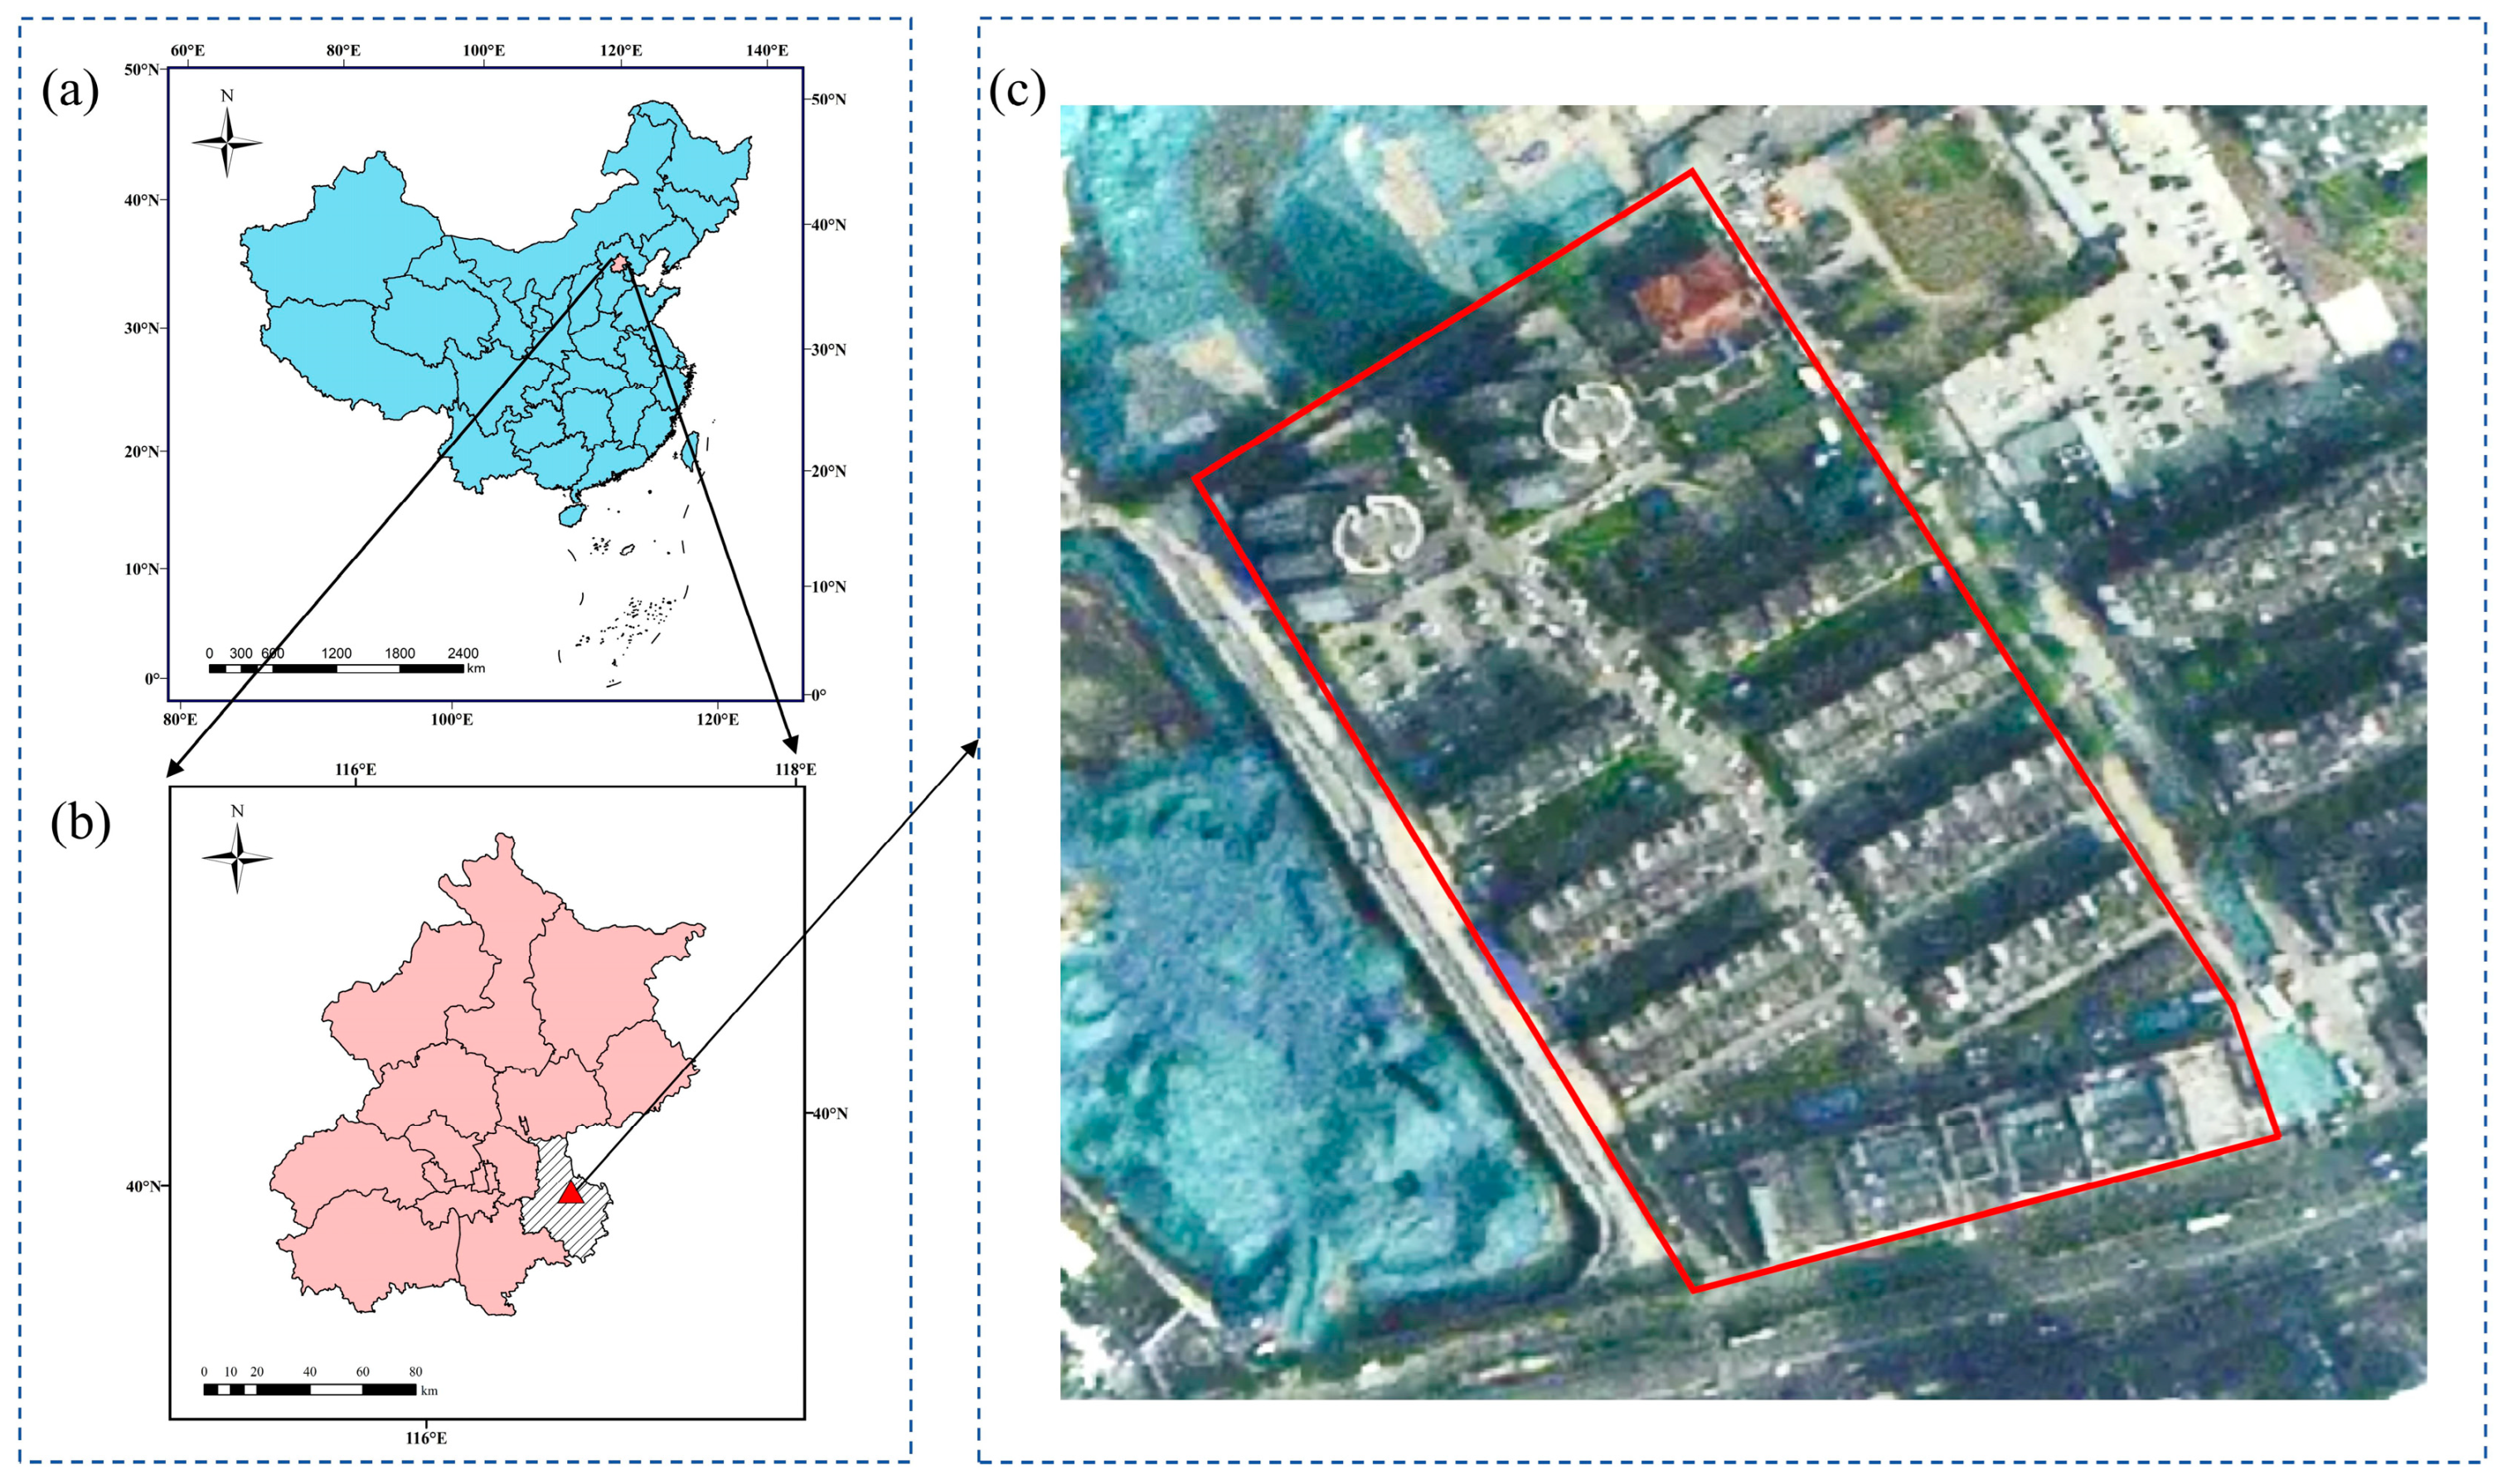
The study area is located in Tongzhou District, Beijing, China (Figure 2), with geographical coordinates of 39.92° N latitude and 116.69° E longitude, and it falls within the Haihe River Basin. The region is in a warm, semi-humid continental climate zone, with an average annual precipitation of around 595 mm, 85% of which occurs during the rainy season (June to September). The study subject is a typical old residential community, comprising 9 residential buildings, 2 commercial buildings, and 1 educational facility, covering an area of around 5.0 hectares. The main land use types in this area include hard pavements, building rooftops, and green spaces (see Figure 2), with impermeable areas accounting for approximately 76% of the total area. The overall terrain of the community is characterized by higher elevation in the north and lower elevation in the south, with a regional elevation difference of around 1.1 m: the highest point is 20.82 m, the lowest point is 19.71 m, and the average slope is 1.14%. According to data from the local drainage management authority, the pipe diameter of the drainage system ranges from 300 to 400 mm, with overall design standards being relatively low. As a result, water accumulation often occurs during the rainy season, making the area susceptible to flood disasters.

2.2. Designing Rainfall Scenarios

This study aims to assess the variation in runoff control effectiveness of LID facilities with deployment scale under different rainfall return periods. The design rainfall utilized in this analysis follows the formula outlined in the Beijing local standard [29]. The equation for rainstorm intensity is presented as follows (Equation (1)):
q = 1602 1 + 1.037 lg P ( t + 11.593 ) 0.681
In the formula, q represents the design rainfall intensity in liters per second per hectare (L/(s·hm2)); P denotes the rainfall recurrence interval in years; and t indicates the duration of rainfall in minutes.
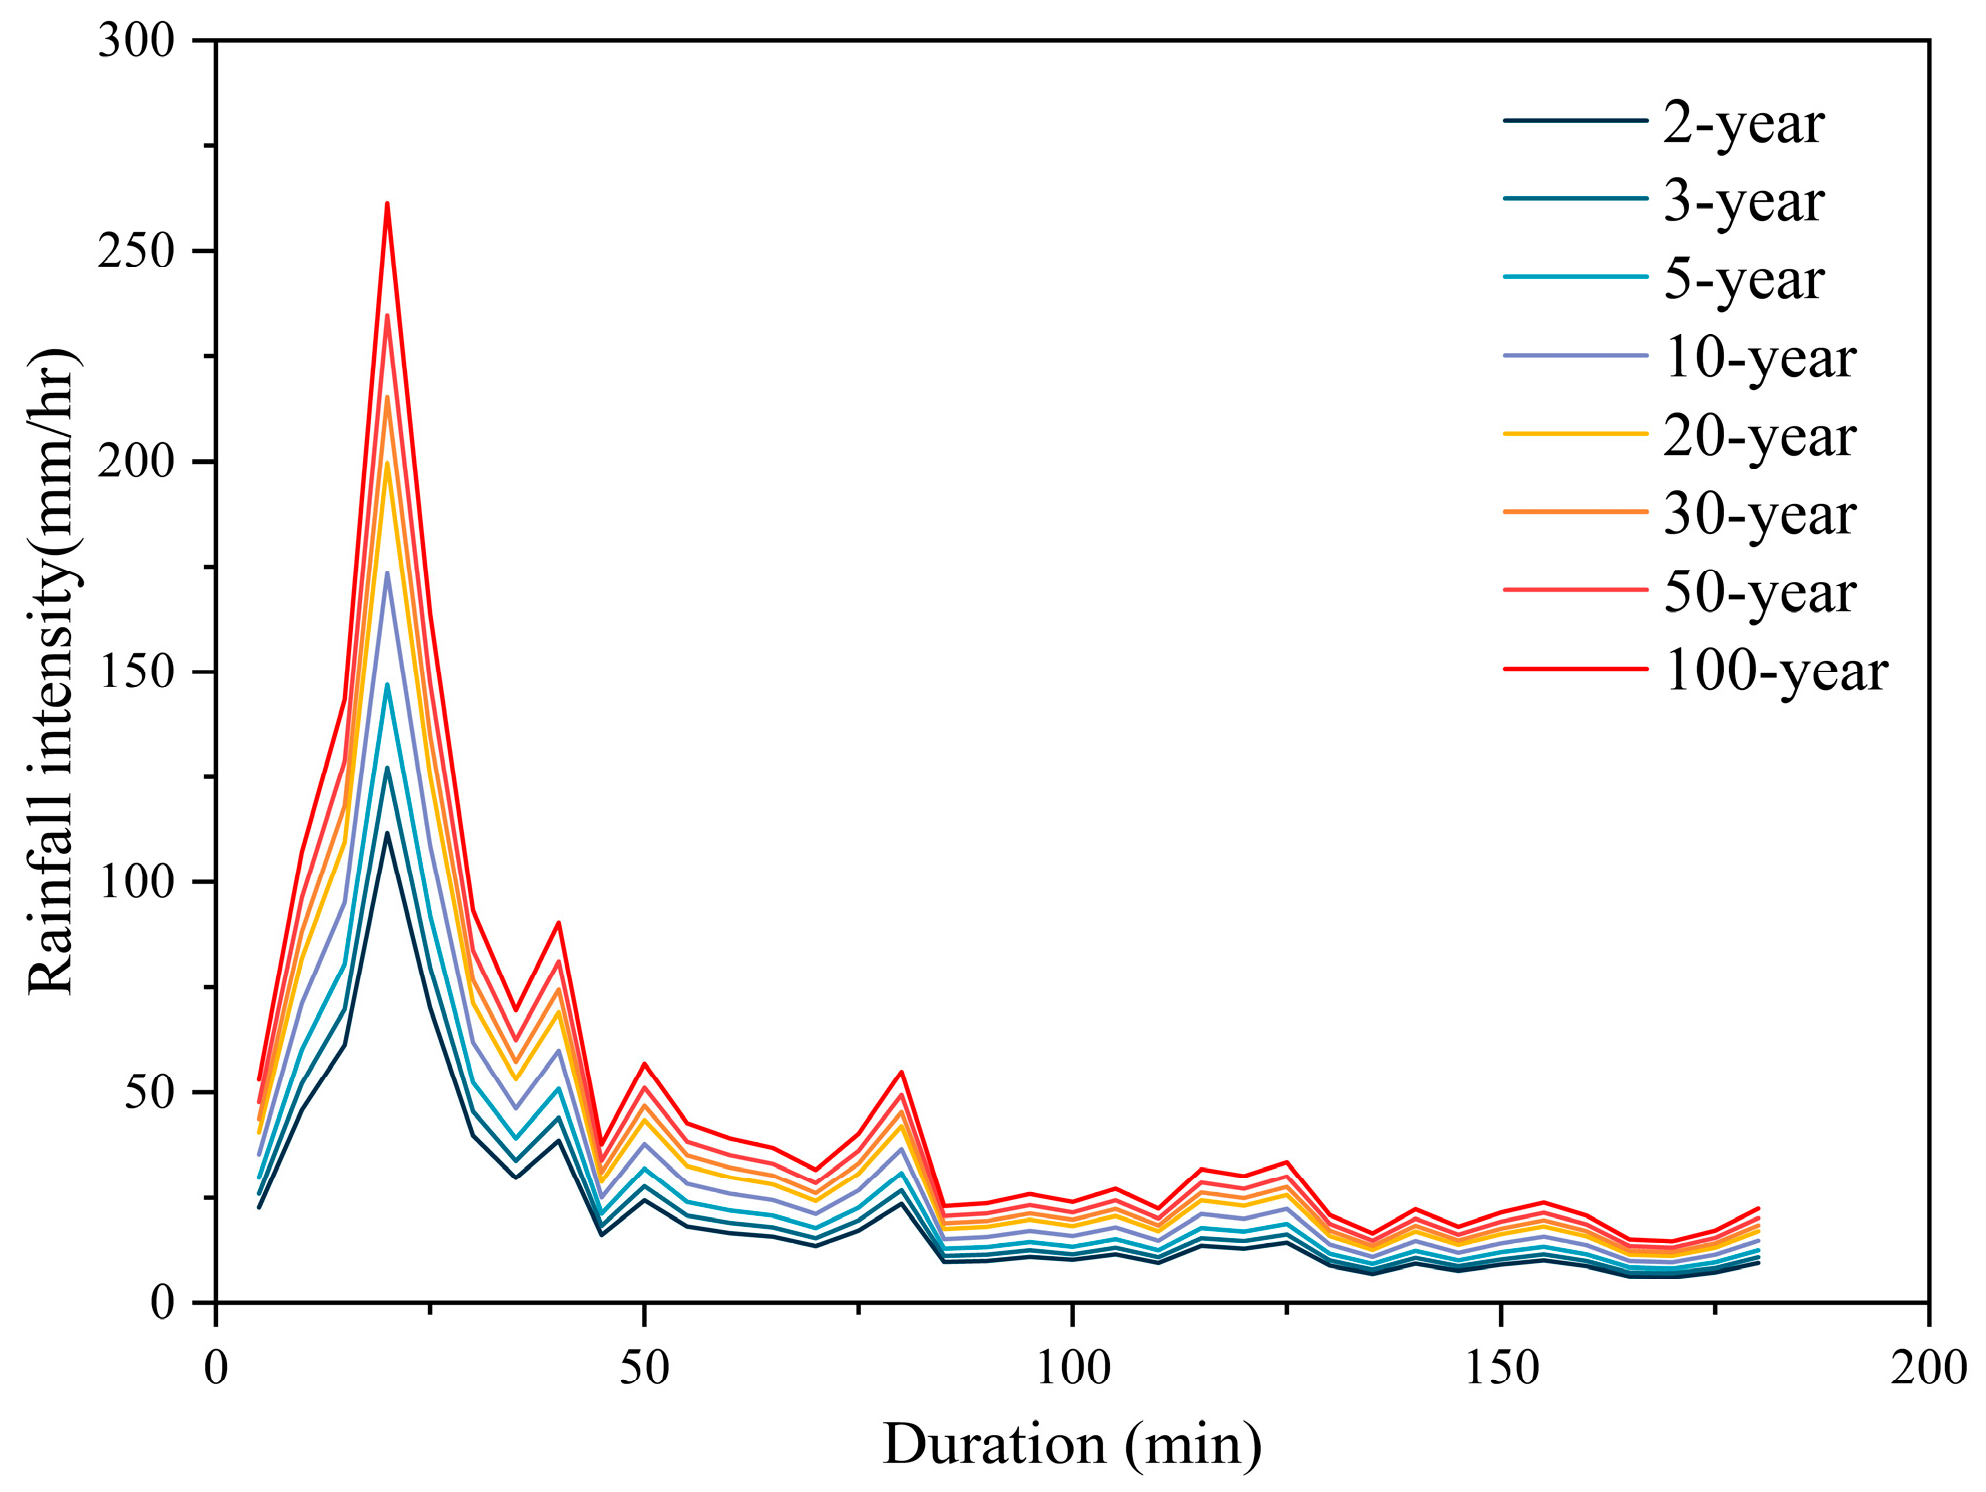
Based on the rainfall intensity formula, the design rainfall process for Beijing was derived with a duration of 3 h and recurrence intervals of 2, 3, 5, 10, 20, 30, 50, and 100 years. Figure 3 illustrates the rainfall intensity process curves corresponding to these different recurrence intervals.

2.3. SWMM Model Construction

This study employs the Storm Water Management Model (SWMM), developed by the U.S. Environmental Protection Agency (EPA), to simulate the hydraulic processes of rainfall runoff and pipe flow. This model can simulate the processes of surface runoff and node overflow. Furthermore, SWMM is capable of characterizing and simulating LID facilities, assessing their effectiveness in reducing surface runoff, enhancing rainwater infiltration, and improving water quality.

2.3.1. Hydraulic Model Setup

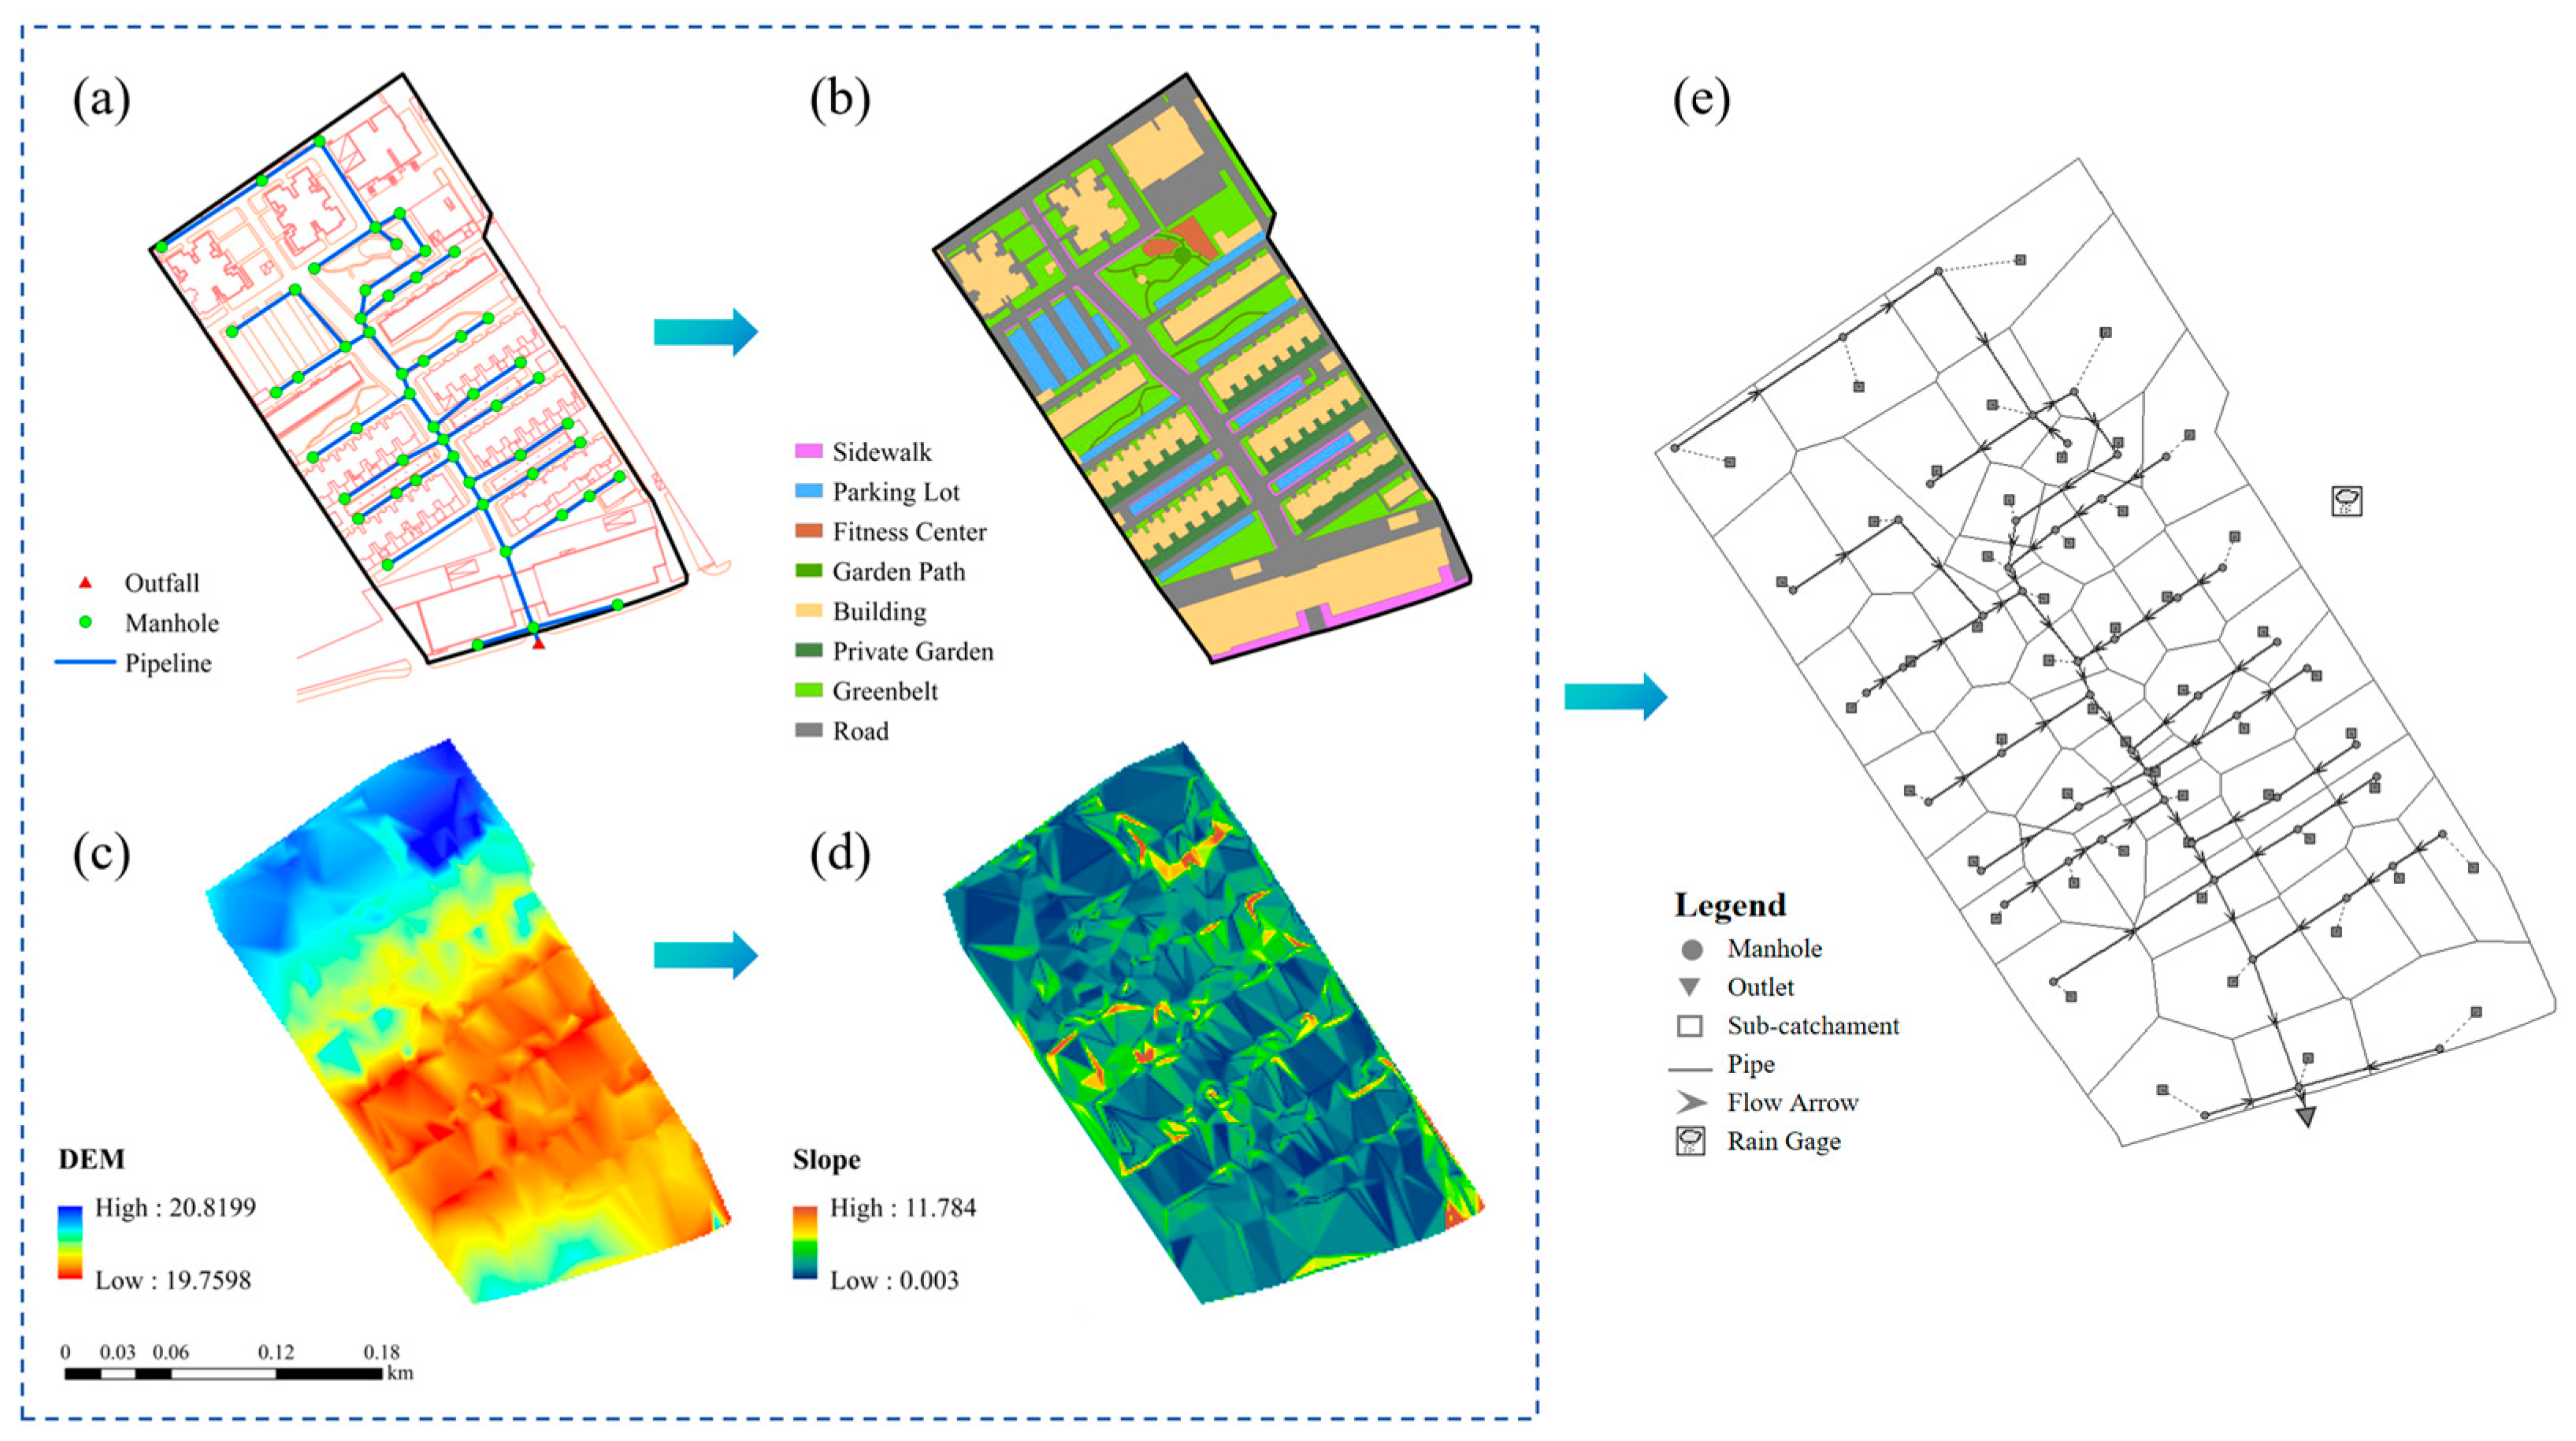
First, the basic data required for constructing the SWMM model were preprocessed, including drainage network data, elevation data, and land use types. The pipe network model was developed based on survey data provided by the local drainage management authority, as shown in Figure 4a. This model consists of a total of 52 pipes, 52 manholes, and 1 outfall. Additionally, a flow monitoring device is installed at the outlet of the study area.
Based on the distribution of manholes, surface slope directions, and the distribution of buildings within the community, the Thiessen polygon method was used to delineate sub-catchments by creating polygons around each stormwater manhole. This method ensures that runoff is directed to the nearest manhole by associating each sub-catchment with the closest manhole [30]. A land use distribution map (Figure 4b) was created based on the land use types in the study area to determine the land use data for each sub-catchment. Further analysis of the elevation data from the study area (Figure 4c) generated a slope distribution map for the sub-catchments (Figure 4d). Given the different runoff calculation methods in SWMM regarding infiltration mechanisms and the characteristics of the underlying surfaces in the study area, the Horton model, suitable for urban areas, was selected to calculate surface runoff, while the nonlinear reservoir method was used for the runoff routing process, and the dynamic wave method was adopted for pipe network calculations. Ultimately, a hydrodynamic model of the study area was established (Figure 4e).

2.3.2. Pollution Model Setup

Based on the distribution of the underlying surfaces in the study area, only the accumulation of pollutants on building rooftops, roads, and green spaces needs to be considered in the model. Total Suspended Solids (TSSs), a common pollutant in rainwater, are selected as the primary pollutant indicator for water quality simulation, modeling the concentration of pollutants at the outfall of the drainage network [31,32]. This study uses a saturation function equation to calculate pollutant accumulation and an exponential equation to simulate the pollutant reduction process. In the pipes, the quality components of the washed water are transported through the transport system, which is calculated using dynamic wave theory, until the pollutants are finally discharged—a process regarded as a one-dimensional transport process. Advection reflects the movement of pollutants with the flow of water, while the build-up/wash-off model simulates the accumulation of pollutants on the surface and their subsequent washing into the fluid system during rainfall events. The processes of the movement of pollutants can be described by the mass conservation equation (Equation (2)) [33]. The initial pollutant parameters for different underlying surfaces are determined with reference to the SWMM user manual and the related literature [34], with the results presented in Table 1.
c t = ( u c ) x + x ( D c x ) + r c
where c is the concentration of pollutant load (ML−1); u is the longitudinal velocity (Lt−1); D is the longitudinal diffusion coefficient (L2/T); r c is the reaction rate term (ML−3T−1); x is the longitudinal distance (L); and t is the time (s).

2.3.3. Calibration of Model Parameters

To ensure the model’s rationality and reliability across different rainfall events, three actual rainfall events on 4 June 2019, 8 July 2019, and 3 August 2019 were selected for simulation. The model was calibrated and validated by comparing the simulated outflow of the drainage network to the monitored values. The Nash–Sutcliffe efficiency coefficient (NSE) is a widely used dimensionless evaluation metric in hydrological models, used for quantitatively assessing the accuracy of model simulation results [35]. The model validation results are shown in Figure 5. The NSE for all three rainfall events exceeded 0.75, indicating that the established one-dimensional drainage model is suitable for subsequent simulations. The parameters adjusted during the calibration process mainly included the surface Manning’s coefficient for different land surfaces, runoff coefficients, Horton infiltration parameters, and the Manning’s coefficient for pipes. The model parameter values for different land surfaces in the study area are presented in Table 2.

2.3.4. LID Facilities and Parameter Settings

Based on the on-site survey data of old residential areas and the distribution of different land surfaces, this study selected three widely used and effective LID facilities for research: green roof (GR), permeable pavement (PP), and bio-retention cell (BR) [36]. Among them, green roofs are installed on building rooftops, permeable pavements are placed on hardened roads, and bio-retention cells are set up in green spaces, as shown in Figure 6. Referring to the SWMM user manual and the “Technical Guidelines for Sponge City Construction” of Beijing, as well as other relevant specifications and the literature [37], the main parameters of the LID facilities are listed in Table 3.

2.4. Analysis of LID Facility Performance

2.4.1. Hydrological Performance Evaluation Indicators for LID

Appropriate indicators are essential for evaluating the performance of LID facilities. This study comprehensively assesses the control effects of LID facilities on the hydrological and hydraulic processes of urban catchments from three perspectives: surface runoff, pipeline systems, and pollutant load. Surface runoff reduction is selected as the evaluation indicator for surface hydrological processes, node overflow reduction is chosen as the evaluation indicator for network flooding processes, and TSS reduction is utilized as the evaluation criterion for pollutant load. The performance of LID facilities varies with the scale of their deployment. The degree of performance of unit LID facilities can be accurately assessed for their effectiveness and efficiency under different conditions, thereby optimizing design and resource allocation to enhance the overall system’s performance. The existing quantifiable evaluation indicators for LID facility functions, as mentioned above, can succinctly characterize the runoff and pollution control capabilities of individual LID measures or overall planning designs; however, they cannot accurately reflect the performance level of unit LID facilities. This study uses the SWMM model to simulate and analyze the runoff control performance of individual LID facilities at different deployment scales, assessing their unit performance (the reduction amount per unit area). The unit performance indicator is defined as Equations (3)–(5):
U R = R u n o f f b a s e l i n e R u n o f f L I D A r e a L I D
U O = O v e r f l o w b a s e l i n e O v e r f l o w L I D A r e a L I D
U P = T S S b a s e l i n e T S S L I D A r e a L I D
where U R is the runoff control performance of the unit facility (m3/m2); U O is the overflow control performance of the unit facility (m3/m2); U P is the TSS control performance of the unit facility (g/m2); and Area is the area of the LID facilities.

2.4.2. Spatial Layout Strategies for LID

To further analyze the response relationship between the runoff control performance of LID facilities and facility scale, the design scale of LID facilities is defined as the proportion of the underlying surface area corresponding to each type of LID facility, with design schemes for different LID facilities set at increments of 10%. The corresponding underlying surface types for permeable pavements and green roofs are hard surfaces and building rooftops, respectively, while the underlying surface type for bio-retention cells is green space. In the SWMM, different scales of permeable pavements, green roofs, and bio-retention cells are set up, and the drainage process is simulated under different rainfall return periods. The Design scheme of LID facility layout scale is shown in Table 4.

2.4.3. Multi-Criteria Decision Analysis and Cost–Benefit Decision-Making

This study employs MCDA to systematically evaluate and compare the overall performance of LID facilities under different schemes [38]. The unit performance analysis data of LID facilities is standardized as the foundational data, and the entropy method is used to determine the weights of each indicator. Finally, the overall score for each deployment ratio is calculated. The specific process is as follows:
  • In order to eliminate the dimensional influence between indicators and ensure that different indicators are compared on the same scale, the data of each indicator are standardized and standardized by min–max. The standardization formula is Equation (6).
    X i j = X i j min ( X i j ) max ( X i j ) min ( X i j )
    where, i represents the LID layout ratio, j represents the LID performance evaluation index, X i j is the value of i layout ratio on the j index, min ( X j ) is the minimum value in the j index, max ( X j ) is the maximum value in the j index, and X i j is the value of X i j after standardization.
  • The information entropy of each index is calculated and the information content and uncertainty of each index are evaluated. The higher the entropy value, the more uniform the data distribution of the index, the smaller the difference, and the weaker the influence on the decision. A lower entropy value indicates that the data distribution of the index is more different and has a stronger influence on decision-making. The calculation formula of information entropy is Equation (7).
    E j = k i = 1 n P i j ln ( P i j )
    where E j is the information entropy of the j index, k = 1 ln ( n ) is used to ensure that the entropy value is within the interval [0, 1], where n represents the total number of layout proportions, and P i j = X i j i = 1 n X i j represents the proportion of i layout ratio under j index.
  • The weight of each index is calculated. The larger the weight, the more important the index is in the evaluation system, and the more influence it has on the comprehensive evaluation of LID scheme. A smaller weight indicates a lower importance of the indicator. The weight of each index can be calculated by Equation (8).
    W j = 1 E j j = 1 m ( 1 E j )
    where W j is the weight of the j indicator, and m represents the total number of indexes.
  • After determining the weight of each index, the comprehensive score of the layout ratio is calculated (Equation (9)). The higher the comprehensive score is, the better the comprehensive performance of the LID layout ratio in all indicators is, and it is a better choice.
    S i = j = 1 n W j X i j
S i is the composite score of the proportion of the i layout ratio.
Based on the comprehensive performance analysis of the LID facilities, the optimal deployment scale ratio for each type of LID facility can be determined. By combining the optimal scales of the three facilities, the optimal deployment scheme for LID facility performance is obtained. Changes in extreme weather necessitate an enhancement of control targets, which means that additional investments in LID facility construction will be required beyond the existing infrastructure. The cost–benefit analysis of LID facilities is an important tool for assessing their economic rationality and environmental benefits. By comparing the additional investments with the associated benefits they bring, a quantitative evaluation of the cost-effectiveness of new facilities can be achieved, thus realizing the effective utilization of resources [39]. The costs of LID facilities can refer to the unit costs listed in the “Technical Guidelines for Sponge City Construction” [36], as detailed in Table 5.

3. Results

3.1. Runoff Control Performance of LID Facilities

Figure 7 illustrates the change in surface runoff control volume of three types of LID facilities with varying deployment scales under different return periods. Under the same return period, the surface runoff control volume increases with the increase in deployment scale, and the increment becomes more significant with higher return periods. The runoff control effect of permeable pavements is shown in Figure 7a. At smaller deployment scales, the runoff control effect is better under low return periods. As the deployment scale increases, the runoff control effect under high return periods gradually surpasses that under low return periods. When the facility scale is at 30%, the runoff control volume under a 2-year return period is 8 × 10³ m3 and 10 × 103 m3 greater than those under the 50-year and 100-year return periods, respectively. When the facility scale reaches 80%, the runoff control volume under both the 50-year and 100-year return periods is more than twice that under the 2-year return period. The control effects of green roofs and bio-retention cells are shown in Figure 7b and Figure 7c, respectively. Overall, when the facility scale is less than 40%, the difference in surface runoff control volume of the facilities under different return periods is minimal. As the facility scale increases, the impact of return period on the runoff control effect of the facilities gradually becomes more pronounced. At a 100% deployment scale, the difference in runoff control volume between the 2-year and 100-year return periods reached 8 × 10³ m3 and 14 × 103 m3, respectively. The surface runoff control effect of permeable pavements is most affected by the return period, followed by bio-retention cells, and finally green roofs.
Figure 8 illustrates the reduction effects of node overflow for three types of LID facilities at different recurrence periods, as influenced by the installation scale. Similar to the surface runoff control effects, the amount of node overflow reduction from permeable pavements increases with the installation scale, and the increase is more pronounced at higher recurrence periods. When the facility scale is at 20%, the overflow reduction for the 2-year recurrence period is 0.7 × 10³ m3, while for the 100-year recurrence period, it is 0.4 × 10³ m3. When the facility scale reaches 100%, the overflow reduction for the 2-year recurrence period is 1.1 × 10³ m3, compared to 3.9 × 10³ m3 for the 100-year recurrence period. At smaller installation scales, LID facilities exhibit better node overflow control effects under low recurrence periods; however, at larger scales, the control effects are more significant under high recurrence periods. The overflow control effects of green roof and bio-retention cells follow similar trends as the runoff control effects concerning rainfall and installation scale. When the facility scale is below 40%, the differences in node overflow control among different recurrence periods are also minimal.
Figure 9 illustrates the variation in pollution load control effects of three types of LID facilities with installation scale under different return periods. Overall, under the same return period conditions, the TSS control amount of LID facilities exhibit a logarithmic increase with the increase in facility scale. Taking the TSS pollution control effectiveness of permeable pavements as an example, when the installation scale increases from 10% to 100%, the TSS reduction amount under the 2-year return period rises from 31 kg to 72 kg, while under the 100-year return period, it increases from 32 kg to 87 kg. From a quantitative perspective, there is no obvious regular relationship between TSS reduction effects across different return periods. However, when the installation scale is less than 60%, the TSS reduction effect under high return period rainfall is slightly lower than that under low-return-period conditions.
Overall, the hydrological control effects of LID facilities increase with the growth of installation scale, which is also supported by previous studies. However, this relationship is not linear; the rate of improvement in control effectiveness gradually diminishes, indicating the presence of a marginal effect. This suggests that the performance of LID facilities is not constant but is influenced by scale effects, leading to continuous variation.

3.2. Unit Performance Analysis of LID Facilities

Figure 10 presents a three-dimensional bar chart that visually demonstrates the variations in unit performance of permeable pavements under different installation percentages and rainfall recurrence periods. In each subplot, the x-axis represents the percentage of LID facility installation, the y-axis denotes different rainfall recurrence periods (ranging from 2-year to 100-year), and the z-axis indicates the corresponding reduction amounts of environmental indicators. The performance of permeable pavements in controlling surface runoff and node overflow is shown in Figure 10a,b. Both performances exhibit a trend of initially increasing and then decreasing with the growth of permeable pavement installation scale, indicating that the maximum performance is achieved within a certain installation proportion threshold (approximately 30% to 70%), with values ranging from 3.8 to 4.1 m3/m2 for runoff control and 0.12 to 0.19 m3/m2 for overflow control. Below this threshold, the performance decreases as the recurrence period increases; however, once the threshold is surpassed, the performance improves with increasing recurrence periods. As illustrated in Figure 10c, the TSS control performance of the facility rapidly decreases with the increase in installation proportion, and after reaching a proportion of 50%, the performance declines more slowly, with a range of 3.3 to 13.3 g/m3. The influence of rainfall recurrence period on the pollution control performance of permeable pavements is relatively minor.
Figure 11 illustrates the variations in unit performance of green roofs under different installation percentages and rainfall recurrence periods. Unlike permeable pavements, the runoff and overflow control performance of green roofs remains relatively stable under high recurrence periods (10-year–100-year), as shown in Figure 11a,b, with range values of 1.56 to 2.14 m3/m2 for runoff control and 0.05 to 0.084 m3/m2 for overflow control. At lower recurrence periods, when the installation proportion is 20%, the overflow control performance shows a slight improvement. The TSS control performance of green roofs initially decreases rapidly with increasing installation proportion. After reaching a threshold installation proportion of 30%, the performance declines more slowly, as depicted in Figure 11c, with range values of 2.8 to 8.8 g/m3. Before reaching this threshold, TSS control performance slightly improves with increasing recurrence periods; however, beyond the threshold, the TSS control performance slightly decreases with higher recurrence periods.
Figure 12 illustrates the variations in unit performance of bio-retention cells under different installation percentages and rainfall recurrence periods. As shown in Figure 12a,b, the runoff and overflow control performance of bio-retention cells remain relatively stable under high recurrence periods (10-year–100-year), with range values of 3.0 to 3.0 m3/m2 for runoff control and 0.15 to 0.16 m3/m2 for overflow control. In contrast, under lower recurrence periods (2-year–5-year), the runoff control performance significantly decreases as the installation scale increases, while the overflow control performance exhibits an initial increase followed by a decline, reaching its maximum performance at an installation proportion of 30%. Unlike permeable pavements and green roofs, the TSS control performance of bio-retention cells significantly improves with increasing installation scale, demonstrating better performance under lower recurrence periods. For example, at a recurrence period of 2 years and an installation proportion of 100%, the TSS control performance reaches an optimal value of 82.6 g/m3, which is notably superior to that of permeable pavements and green roofs.

3.3. Comprehensive Performance Analysis of LID Facilities

Based on the analysis of the runoff, overflow, and TSS control performance results of the LID facilities, this study employs a multi-criteria decision analysis method to evaluate their overall performance. The entropy method is used to determine the weight of each indicator, with the weight proportions of the indicators for different recurrence periods shown in Table 6. PP could effectively treat most rainfall in the low return period (2-year to 5-year), with significant effects on runoff and overflow control and higher weight. With the increase in the return period, the rainfall increased, and the infiltration capacity of PP gradually saturated, resulting in the relative weakening of its runoff and overflow control effect, and the weight tended to be stable. The water storage and infiltration capacity of GR and BR were sufficient and the effect of runoff control was stable during the low reproducibility period. However, during the high return period, the water storage capacity of the facility shows an advantage when dealing with large amounts of rainfall, and the runoff weight increases significantly, while the overflow control effect decreases. In terms of TSS control, PP treated a large number of pollutants under high rainfall intensity, and its weight increased. The TSS control weight of GR was stable, while the TSS control weight of BR increased first and then decreased, and its effect was weakened due to overflow caused by extreme rainfall. Ultimately, the comprehensive performance scores for individual LID facilities at various installation proportions are calculated, as illustrated in Figure 13. The performance scoring of permeable pavements is depicted in Figure 13a. As the installation scale increases, its performance exhibits a trend of initially increasing and then decreasing under lower recurrence periods (2-year–10-year), while in higher recurrence periods (20-year–100-year), the trend shows a decrease, followed by an increase, and then another decrease. Using installation proportions of 40–70% as a threshold, it can be observed that before reaching this threshold, higher recurrence periods correlate with lower performance; however, beyond this threshold, performance improves with increasing recurrence periods. For instance, the optimal installation proportions for permeable pavements under recurrence periods of 3-year and 100-year are 30% and 80%, respectively. The performance of green roofs is presented in Figure 13b. Under lower recurrence periods (2-year–10-year), performance decreases as installation scale increases. In higher recurrence periods (20-year–100-year), the performance exhibits a rapid decrease, stabilizes, and then gradually increases. In contrast, the performance of bio-retention cells show a gradual decline with increasing installation scale, as illustrated in Figure 13c.

3.4. Cost–Benefit Analysis of Combined LID Facilities

Based on the multi-criteria decision analysis method and the requirements of the Technical Guidelines for Sponge City Construction in China regarding the proportion of bio-retention cells, permeable pavements, and green roofs in residential areas, the optimal combination scale of LID facilities for this study area under different return periods can be determined. Taking a return period of 3 years as an example, the optimal combination of LID facilities for this rainfall condition is 30% permeable pavements, 20% green roofs, and 60% bio-retention cells. If there is a future need to enhance control objectives, additional investments can be made based on the existing LID facilities, and a cost–benefit assessment can be conducted to evaluate the improvement in performance and the increase in costs for different combinations, thereby identifying the combination with the highest benefits. For the scenario of a 3-year return period, the following LID facility combination plans are proposed, controlling one type of LID facility to gradually increase its coverage from the initial optimal scale by increments of 10% up to 100%.
  • Plan One: Increase bio-retention cells: 30% permeable pavements (PP) + 20% green roofs (GR) + (60–100%) bio-retention cells (BR);
  • Plan Two: Increase permeable pavements: (30–100%) PP + 20% GR + 60% BR;
  • Plan Three: Increase green roofs: 30% PP + (20–100%) GR + 60% BR.
The cost–benefit curve is illustrated in Figure 14. The initial construction cost for the LID facility combination is CNY 5.8 million, achieving control effects on overflow, runoff volume, runoff depth, peak runoff, and TSS pollutant load of 98.6%, 78%, 79%, 66%, and 57%, respectively. Overall, Plan Two exhibits the highest cost/benefit ratio, followed by Plan Three, and then Plan One. This indicates that increasing permeable pavements in the study area achieves better control effects at the same cost compared to other LID facilities. When the coverage of permeable pavements in Plan Two is increased to 1.798 hectares, resulting in an additional investment of CNY 0.448 million, there will be no overflow in the study area. Conversely, if Plan One is implemented, an additional investment of CNY 2.352 million would be necessary. The cost–benefit analysis of the combined LID facilities provides guidance for government departments or construction units in selecting construction plans based on the corresponding control objectives.

4. Discussion

Through the analysis of the layout scale of three LID facilities and their effects on runoff control, overflow control, and pollutant load control under different recurrence periods, the results indicate that with the increase in the scale of LID facilities, the surface runoff control volume, node overflow reduction, and pollutant load control effects significantly improve, particularly under high recurrence conditions, where the enhancement of control effects is even more pronounced. This finding aligns with previous research results, demonstrating that the effectiveness of LID facilities relies on the reasonableness of their scale and design. Permeable pavements exhibit the best surface runoff control effects among all facilities, especially when the layout scale reaches 80%. Under a 100-year recurrence period, the runoff control volume is more than twice that of the 2-year recurrence period, showcasing their strong potential in addressing extreme rainfall events. In smaller rainfall events, the runoff rate is slower, and LID facilities with a lower installation percentage will not accept excessive external runoff, and can generally make full use of their water storage capacity and additional storage space of the soil to effectively reduce their own runoff. However, during extreme rainfall events, the runoff rate is fast and the soil saturates rapidly, and LID facilities are easily overloaded, resulting in increased overflow and diminished runoff reduction effects. PP in a low proportion could permeate rainwater effectively under low-intensity rainfall. However, during heavy rainfall, water flow velocity increased, and the rainfall rate of PP in a low proportion exceeded its infiltration capacity, resulting in more runoff. Therefore, the flow reduction benefit of PP in smaller events is more significant. This phenomenon emphasizes the priority of permeable pavements in urban flood prevention design, especially in the face of changing rainfall patterns due to climate change. Although the control effects of green roofs and bio-retention cells are relatively weaker, their control performance shows little difference when the facility scale is below 40%. This indicates that in the early layout stage, all three types of facilities have a certain baseline effect on runoff control. As the scale of the facilities increases, the impact of recurrence periods gradually becomes evident, suggesting that we should consider different rainfall intensities when designing LID measures to optimize facility configurations. In terms of pollution control, all three facilities exhibit an exponential growth trend with increasing layout scale, particularly the performance of green roofs in controlling total suspended solids (TSSs), highlighting their importance in improving water quality. Although the TSS reduction effects under high-recurrence-period rainfall is slightly lower than those under low recurrence periods, the overall trend still indicates that increasing facility scale can effectively enhance the purification capacity of water bodies.
The runoff and overflow control performance of permeable pavements demonstrates a trend of first increasing and then decreasing. When the installation ratio of permeable pavements is between 30% and 70%, the facilities effectively intercept and convey water, resulting in a certain degree of retention and infiltration capacity. However, beyond this threshold, performance declines due to limitations in the paving materials or design, as the substrate’s infiltration capacity becomes saturated. Additionally, as shown in Figure 10c, TSS control performance is optimal at a 50% installation ratio and subsequently weakens. This may be due to the facility effectively utilizing its interception characteristics under low loading conditions, while under high loading conditions, it faces challenges related to drainage and pollutant loading. In comparison, green roofs exhibit relatively stable runoff and overflow control performance under high return periods, as illustrated in Figure 11a,b. This indicates that their plant cover and soil’s water storage capacity can effectively respond to extreme rainfall events. However, the TSS control performance of green roofs is somewhat lacking at a 30% installation ratio, reflecting insufficient coverage of plant roots at lower ratios, which may lead to a reduced interception capability for smaller particles. The performance of bioretention cells, shown in Figure 12, is particularly outstanding. Flow and overflow control performance remains relatively stable under high return periods, while runoff control performance is noticeably poorer under low return periods. This may be due to low-intensity rainfall not fully utilizing the storage capacity of the root zone soil. Compared to the other two facilities, bioretention cells excel in TSS control, achieving a performance level of 82.6 g/m3. This indicates their ability to more effectively filter and intercept pollutants, likely stemming from their design, which promotes sustained retention of water flow and biological purification effects.
According to the performance ratings of permeable pavements shown in Figure 13a, as the installation scale increases, their performance exhibits a trend of initially increasing and then decreasing under lower return periods (2-year–10-year). Conversely, under high return periods, a wave-like fluctuation pattern of “decrease–increase–decrease” is observed. This suggests that under low-return-period conditions, permeable pavements can effectively reduce runoff during the initial stages, but after reaching a certain scale, performance may decline due to limitations in rainwater infiltration or saturation of the pavement surface. Under high return periods, the facilities show significant performance fluctuations, likely related to extreme rainfall events and variations in water flow management capacity, reflecting the system’s adaptability to different rainfall intensities and frequencies. The performance assessment results for green roofs and bioretention cells reveal a similar trend to those of permeable pavements, although the differences between high and low return periods vary. Notably, the overall performance gap for green roofs across different return periods is substantial, indicating their advantages in runoff control and precipitation management. This may be attributed to their unique plant conservation and soil moisture retention characteristics. Integrating the China Sponge City Construction Technical Guidelines with the performance evaluation of LID facilities in this study area, optimal combinations for different return periods have been established. For instance, under a 3-year rainfall return period, the recommended optimal combination is 30% permeable pavements, 20% green roofs, and 60% bioretention cells. This configuration effectively leverages the advantages of each facility, enhancing overall performance. Particularly in the face of higher rainfall intensities, this combination ensures system stability and effectiveness. Regarding cost-effectiveness assessments, the initial construction cost of the optimal combination is CNY 5.8 million, achieving control effects of 98.6%, 78%, 79%, 66%, and 57%, respectively. Scheme two, which involves increasing the area of permeable pavements, demonstrates the best cost/benefit ratio, highlighting the potential to enhance management efficiency with the same level of investment. These results indicate that increasing the coverage of permeable pavements is an effective approach to improve regional runoff control and should be prioritized in future urban water management and infrastructure development.

5. Conclusions

Through the analysis of three types of LID facilities under different return periods, it was found that as the installation scale of LID facilities increases, their effectiveness in controlling surface runoff, overflow, and pollutant loads significantly improves, especially under high-return-period conditions. Permeable pavements demonstrate the best runoff control capability among all facilities, particularly when the installation scale reaches 80%, highlighting their importance in urban flood prevention design during extreme rainfall events. The study emphasizes the need to consider rainfall intensity and facility scale when designing LID measures to optimize their configuration and enhance water quality and runoff management effectiveness.
The runoff and overflow control performance of permeable pavements exhibits a trend of initially increasing and then decreasing, with optimal control effects occurring within the installation ratio range of 30% to 70%; beyond this threshold, performance declines. In contrast, green roofs show relatively stable control capabilities under high return periods, demonstrating their advantages in handling extreme rainfall events. Bioretention cells perform excellently in TSS control, effectively filtering and intercepting pollutants, indicating the importance of their design for continuous water flow retention and biological purification.
Overall, the study provides important insights into the performance of different facilities under varying rainfall conditions, serving as a reference for future urban water management. Through the comprehensive performance evaluation of permeable pavements, green roofs, and bioretention cells, the optimal combination scales for different return periods were determined. It is recommended to adopt a configuration of 30% permeable pavements, 20% green roofs, and 60% bio-retention cells for a 3-year return period. This combination fully leverages the advantages of each facility, ensuring system stability and effectiveness, while also demonstrating optimal management efficiency in cost–benefit assessments. The study indicates that increasing the coverage of permeable pavements is an effective way to enhance regional runoff control, making it a priority in future urban water management and infrastructure development.
The method in this study can analyze the relationship between the scale of LID facility deployment and its control effectiveness and use this control effectiveness to determine the optimal regional LID deployment plan. This approach evaluates the overall performance of LID deployment schemes based on the simulation results of a drainage network model, providing more comprehensive decision-making support for urban planners and drainage management departments, whether considering single-type or combined LID deployment schemes. Future research needs to further refine the evaluation metrics for the overall performance of LID facilities, incorporating the construction and maintenance costs of different LID facilities to enhance the comprehensiveness of these metrics. Additionally, it will be important to investigate how LID performance may vary under different climate change scenarios, to better address future environmental challenges.

Author Contributions

Conceptualization, J.X. and H.W.; methodology, J.X. and Z.Z.; software, J.X.; validation, X.L. and Z.L.; formal analysis, J.Z.; investigation, J.X.; resources, H.W.; data curation, Z.Z.; writing—original draft preparation, J.X.; writing—review and editing, Z.Z.; visualization, J.X.; supervision, Z.Z. and Z.Y.; project administration, H.W.; funding acquisition, H.W. All authors have read and agreed to the published version of the manuscript.

Funding

This research was funded by General Program of National Natural Science Foundation of China (grant number: 72373011).

Data Availability Statement

The data presented in this study are available on request from the corresponding author.

Conflicts of Interest

The authors declare no conflicts of interest.

References

  1. Zhang, N.; Alipour, A. A multi-step assessment framework for optimization of flood mitigation strategies in transportation networks. Int. J. Disaster Risk. Reduct. 2021, 63, 102439. [Google Scholar] [CrossRef]
  2. Paulik, R.; Zorn, C.; Wotherspoon, L.; Sturman, J. Modelling national residential building exposure to flooding hazards. Int. J. Disaster Risk. Reduct. 2023, 94, 103826. [Google Scholar] [CrossRef]
  3. Liu, Y.; Huang, X.; Yang, H. An integrated approach to investigate the coupling coordination between urbanization and flood disasters in China. J. Clean. Prod. 2022, 375, 134191. [Google Scholar] [CrossRef]
  4. Bertilsson, L.; Wiklund, K.; de Moura Tebaldi, I.; Rezende, O.M.; Verol, A.P.; Miguez, M.G. Urban flood resilience—A multi-criteria index to integrate flood resilience into urban planning. J. Hydrol. 2019, 573, 970–982. [Google Scholar] [CrossRef]
  5. Bayas-Jimenez, L.; Martinez-Solano, F.J.; Iglesias-Rey, P.L.; Boano, F. Economic Analysis of Flood Risk Applied to the Rehabilitation of Drainage Networks. Water 2022, 14, 2901. [Google Scholar] [CrossRef]
  6. Fiori, A.; Volpi, E. On the Effectiveness of LID Infrastructures for the Attenuation of Urban Flooding at the Catchment Scale. Water Resour. Res. 2020, 56, e2020WR027121. [Google Scholar] [CrossRef]
  7. Jean, M.; Morin, C.; Duchesne, S.; Pelletier, G.; Pleau, M. Optimization of Real-Time Control with Green and Gray Infrastructure Design for a Cost-Effective Mitigation of Combined Sewer Overflows. Water Resour. Res. 2021, 57, e2021WR030282. [Google Scholar] [CrossRef]
  8. Zhou, Z.; Li, Q.; He, P.; Du, Y.; Zou, Z.; Xu, S.; Han, X.; Zeng, T. Impacts of rainstorm characteristics on flood inundation mitigation performance of LID measures throughout an urban catchment. J. Hydrol. 2023, 624, 129841. [Google Scholar] [CrossRef]
  9. Hill, B.; Liang, Q.; Bosher, L.; Chen, H.; Nicholson, A. A systematic review of natural flood management modelling: Approaches, limitations, and potential solutions. J. Flood Risk. Manag. 2023, 16, e12899. [Google Scholar] [CrossRef]
  10. Pugliese, F.; Gerundo, C.; De Paola, F.; Caroppi, G.; Giugni, M. Enhancing the Urban Resilience to Flood Risk Through a Decision Support Tool for the LID-BMPs Optimal Design. Water Resour. Manag. 2022, 36, 5633–5654. [Google Scholar] [CrossRef]
  11. Li, C.; Zhang, Y.; Wang, C.; Shen, R.; Gisen, J.I.A.; Mu, J. Stormwater and flood simulation of sponge city and LID mitigation benefit assessment. Environ. Sci. Pollut. R. 2023. [Google Scholar] [CrossRef] [PubMed]
  12. Li, F.; Yan, X.; Duan, H. Sustainable Design of Urban Stormwater Drainage Systems by Implementing Detention Tank and LID Measures for Flooding Risk Control and Water Quality Management. Water Resour. Manag. 2019, 33, 3271–3288. [Google Scholar] [CrossRef]
  13. Suresh, A.; Pekkat, S.; Subbiah, S. Quantifying the efficacy of Low Impact Developments (LIDs) for flood reduction in micro-urban watersheds incorporating climate change. Sust. Cities Soc. 2023, 95, 104601. [Google Scholar] [CrossRef]
  14. Liu, C.; Xie, T.; Yu, Q.; Niu, C.; Sun, Y.; Xu, Y.; Luo, Q.; Hu, C. Study on the response analysis of LID hydrological process to rainfall pattern based on framework for dynamic simulation of urban floods. J. Environ. Manag. 2024, 351, 119953. [Google Scholar] [CrossRef]
  15. Zhu, Z.; Chen, Z.; Chen, X.; Yu, G. An assessment of the hydrologic effectiveness of low impact development (LID) practices for managing runoff with different objectives. J. Environ. Manag. 2019, 231, 504–514. [Google Scholar] [CrossRef]
  16. Li, F.; Chen, J.; Engel, B.A.; Liu, Y.; Wang, S.; Sun, H. Assessing the Effectiveness and Cost Efficiency of Green Infrastructure Practices on Surface Runoff Reduction at an Urban Watershed in China. Water 2021, 13, 24. [Google Scholar] [CrossRef]
  17. Arvand, S.; Noroozi, Z.G.; Delghandi, M.; Alipour, A. Evaluating the impact of LID -BMPs on urban runoff reduction in an urban sub-catchment. Urban Water. J. 2023, 20, 604–615. [Google Scholar] [CrossRef]
  18. Pour, S.H.; Wahab, A.K.A.; Shahid, S.; Asaduzzaman, M.; Dewan, A. Low impact development techniques to mitigate the impacts of climate-change-induced urban floods: Current trends, issues and challenges. Sustain. Cities Soc. 2020, 62, 102373. [Google Scholar] [CrossRef]
  19. Xu, T.; Engel, B.; Shi, X.; Leng, L.; Jia, H.; Shaw, L.; Liu, Y. Marginal-cost-based greedy strategy (MCGS): Fast and reliable optimization of low impact development (LID) layout. Sci. Total Environ. 2018, 636, 240–251. [Google Scholar] [CrossRef]
  20. Yang, B.; Zhang, T.; Li, J.; Feng, P.; Miao, Y. Optimal designs of LID based on LID experiments and SWMM for a small-scale community in Tianjin, north China. J. Environ. Manag. 2023, 334, 117442. [Google Scholar] [CrossRef]
  21. Palla, A.; Gnecco, I. The Web-GIS TRIG Eau Platform to Assess Urban Flood Mitigation by Domestic Rainwater Harvesting Systems in Two Residential Settlements in Italy. Sustainability 2021, 13, 7241. [Google Scholar] [CrossRef]
  22. Kaykhosravi, S.; Khan, U.; Jadidi, M. A simplified geospatial model to rank LID solutions for urban runoff management. Sci. Total Environ. 2022, 831, 154937. [Google Scholar] [CrossRef] [PubMed]
  23. Yang, W.; Zhang, J.; Krebs, P. Low impact development practices mitigate urban flooding and non-point pollution under climate change. J. Clean. Prod. 2022, 347, 131320. [Google Scholar] [CrossRef]
  24. Martin-Miklea, C.; Kirsten, M.; Julianb, J.; Mayer, P.M. Identifying priority sites for low impact development (LID) in a mixed-use watershed. Landsc. Urban Plan. 2015, 240, 29–41. [Google Scholar] [CrossRef]
  25. Chen, J.; Liu, Y.; Gitau, M.; Engel, B.; Flanagan, D.; Harbor, J. Optimal designs of LID based on LID experiments and SWMM on hydrology and water quality in a combined sewer overflow community. Sci. Total Environ. 2019, 665, 69–79. [Google Scholar] [CrossRef]
  26. Xie, Y.; Wang, H.; Wang, K.; Ge, X.; Ying, X. The Application and Potential of Multi-Objective Optimization Algorithms in Decision-Making for LID Facilities Layout. Water Resour. Manag. 2024. [Google Scholar] [CrossRef]
  27. Tansar, H.; Duan, H.; Mark, O. Catchment-Scale and Local-Scale Based Evaluation of LID Effectiveness on Urban Drainage System Performance. Water Resour. Manag. 2022, 36, 507–526. [Google Scholar] [CrossRef]
  28. Lago, C.A.F.D.; Hamedani, A.S.; Mendiondo, E.M.; Giacomoni, M.H. Simulation and optimization framework for evaluating the robustness of low-impact development placement solutions under climate change in a small urban catchment. Hydrol. Sci. J. 2023, 68, 2057–2074. [Google Scholar] [CrossRef]
  29. Liu, K.; Chen, B.; Wang, S.; Wang, H. An urban waterlogging footprint accounting based on emergy: A case study of Beijing. Appl. Energ. 2023, 348, 121527. [Google Scholar] [CrossRef]
  30. Dong, Z.; Bain, D.J.; Akcakaya, M.; Ng, C.A. Evaluating the Thiessen polygon approach for efficient parameterization of urban stormwater models. Environ. Sci. Pollut. R. 2023, 30, 30295–30307. [Google Scholar] [CrossRef]
  31. Yazdi, M.N.; Sample, D.J.; Scott, D.; Owen, J.S.; Ketabchy, M.; Alamdari, N. Water quality characterization of storm and irrigation runoff from a container nursery. Sci. Total Environ. 2019, 667, 166–178. [Google Scholar] [CrossRef] [PubMed]
  32. Taghizadeh, S.; Khani, S.; Rajaee, T. Hybrid SWMM and particle swarm optimization model for urban runoff water quality control by using green infrastructures (LID-BMPs). Urban For. Urban Green. 2021, 60, 127032. [Google Scholar] [CrossRef]
  33. Storm Water Management Model Reference Manual (Volume 3, Water Quality); United States Environmental Protection Agency, Office of Research and Development: Washington, DC, USA, 2016. Available online: www.epa.gov/water-research (accessed on 10 November 2023).
  34. Agency, E.P. Storm Water Management Model User’s Manual, 5.2 ed.; United States Environmental Protection Agency, Office of Research and Development: Washington, DC, USA, 2022. Available online: www.epa.gov/water-research/storm-water-management-model-swmm (accessed on 10 November 2023).
  35. Saniei, K.; Yazdi, J.; MajdzadehTabatabei, M.R. Optimal size, type and location of low impact developments (LIDs) for urban stormwater control. Urban Water J. 2021, 18, 585–597. [Google Scholar] [CrossRef]
  36. Wang, H.; Zeng, P.; Liu, Z.; Li, W.; Zhou, J. Optimization of LID Strategies for Urban CSO Reduction and Cost Efficiency: A Beijing Case Study. Water 2024, 16, 965. [Google Scholar] [CrossRef]
  37. DB11/T 1743-2020; Standard for Sponge City of Construction and Design. Beijing Municipal Commission: Beijing, China, 2021.
  38. Gulshad, K.; Szydlowski, M.; Yaseen, A.; Aslam, R.W. A comparative analysis of methods and tools for low impact development (LID) site selection. J. Environ. Manag. 2024, 354, 120212. [Google Scholar] [CrossRef]
  39. Wu, X.; Tang, R.; Wang, Y. Evaluating the cost-benefit of LID strategies for urban surface water flooding based on risk management. Nat. Hazards 2024. [Google Scholar] [CrossRef]
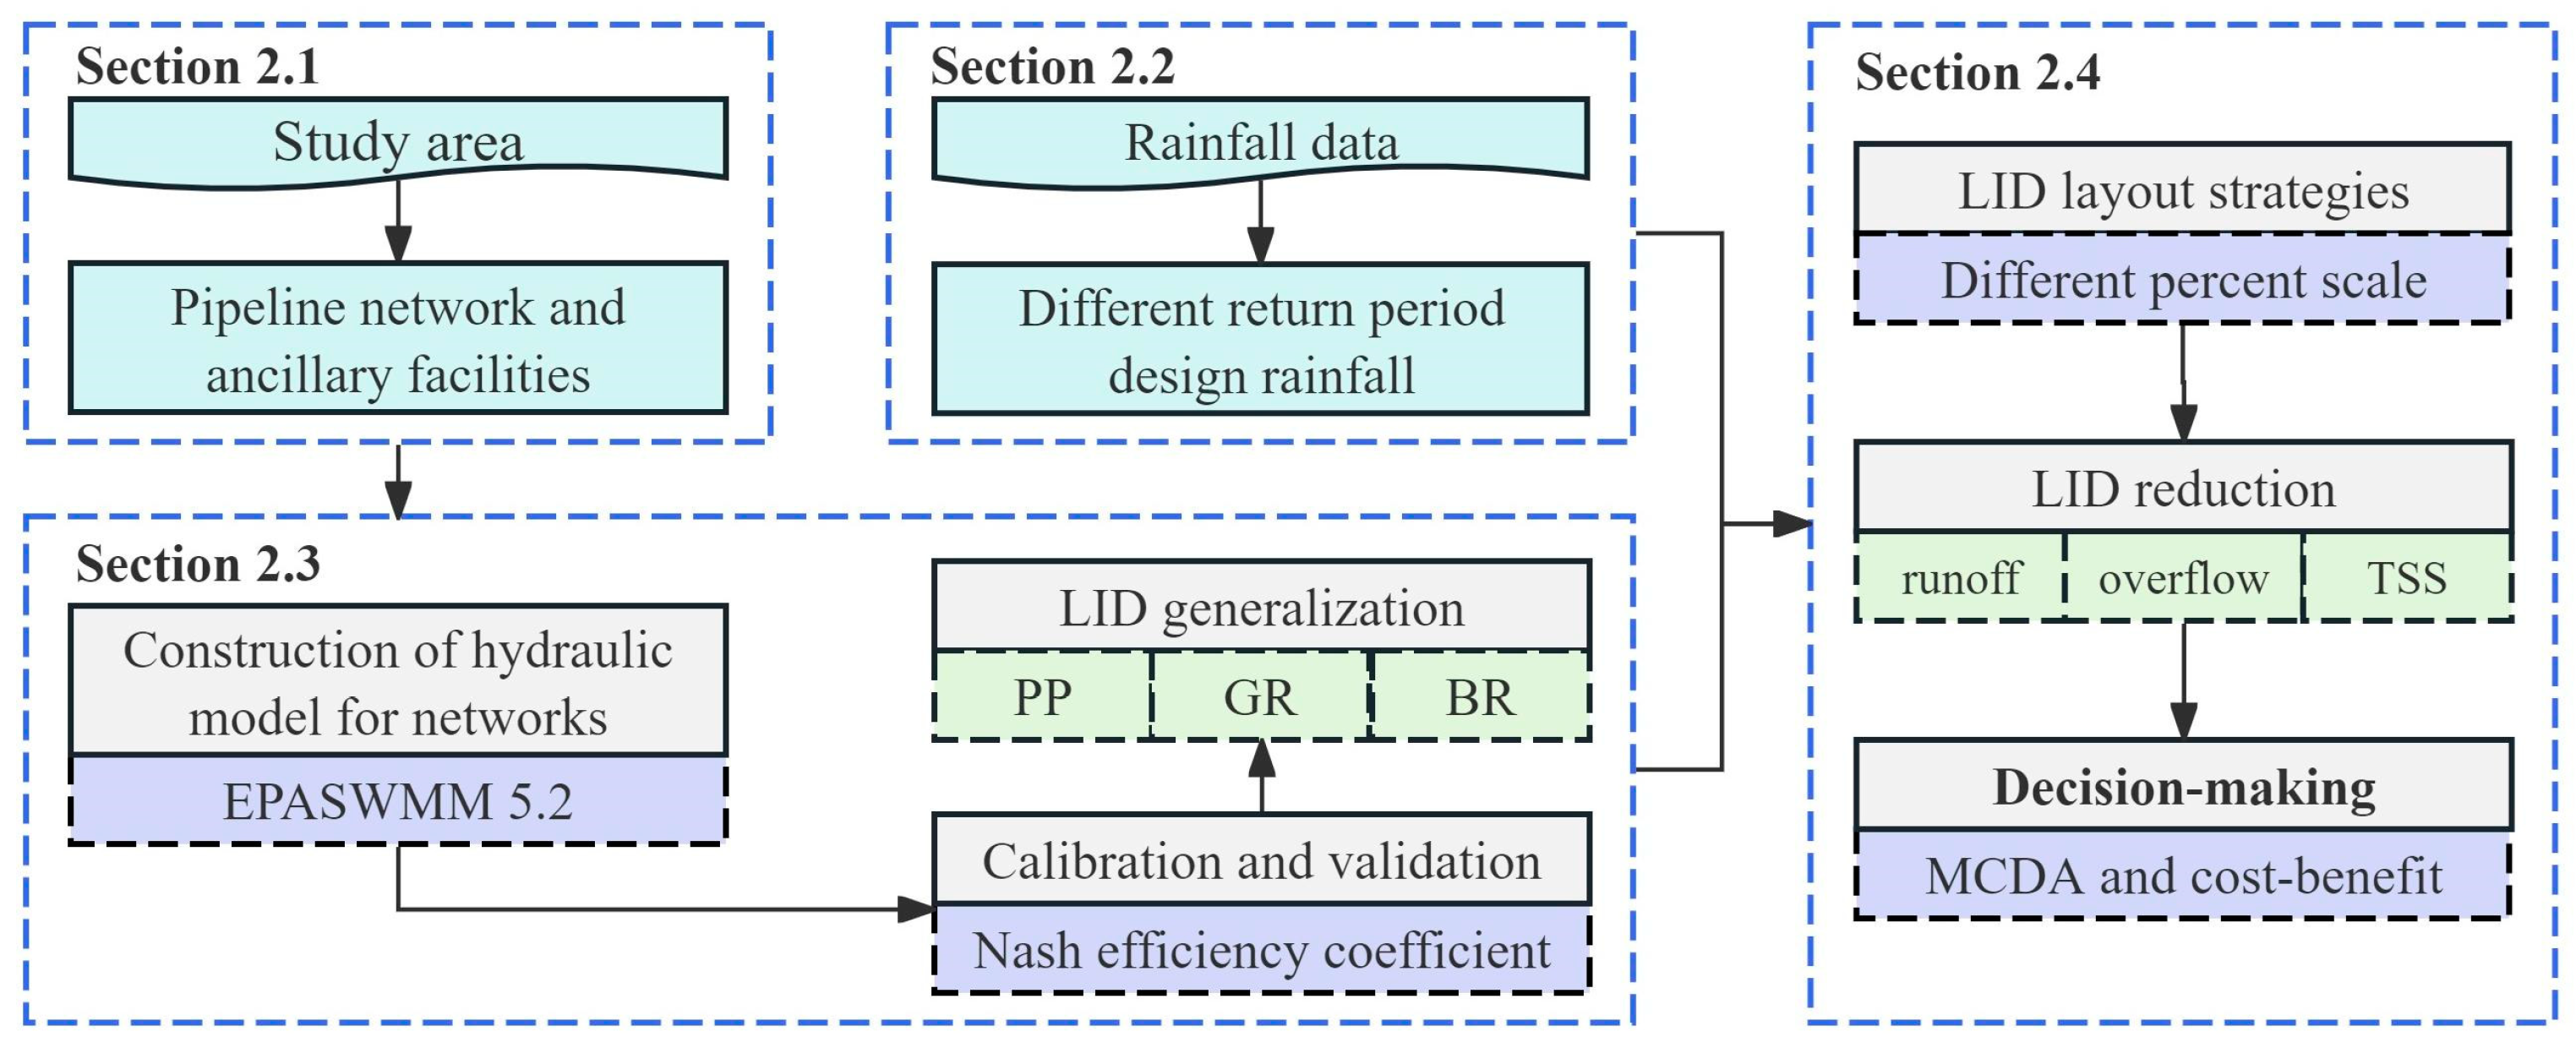
Figure 1. Flowchart of the modeling framework used in this study.
Water 16 02373 g001
Figure 2. Overview of the study area: (a) map of China; (b) a map of Beijing; and (c) image map of the study area.
Water 16 02373 g002
Figure 3. Rainfall intensity process lines for different design return periods.
Water 16 02373 g003
Figure 4. Schematic representation of the SWMM model of the study area: (a) Pipe network; (b) Distribution of land use types; (c) DEM-Digital Elevation Model; (d) Distribution of slope; (e) SWMM model.
Water 16 02373 g004
Figure 5. Calibration results of model parameters and validation results of rainfall runoff process: (a) 4 June 2019 rainfall event; (b) 8 July 2019 rainfall event; (c) 3 August 2019 rainfall event.
Water 16 02373 g005
Figure 6. Schematic diagram of LID facility layout area.
Water 16 02373 g006
Figure 7. Surface runoff control effect of LID facilities: (a) permeable pavements; (b) green roofs; and (c) bio-retention cells.
Water 16 02373 g007
Figure 8. Node overflow reduction effect of LID facilities: (a) permeable pavements; (b) green roofs; and (c) bio-retention cells.
Water 16 02373 g008
Figure 9. TSS reduction effect of LID facilities: (a) permeable pavements; (b) green roofs; (c) bio-retention cells.
Water 16 02373 g009
Figure 10. Changes in unit performance of permeable pavements: (a) surface runoff; (b) node overflow; and (c) TSS load.
Water 16 02373 g010
Figure 11. Unit performance changes of green roof: (a) surface runoff; (b) node overflow; and (c) TSS load.
Water 16 02373 g011
Figure 12. Unit performance changes of bio-retention cells: (a) surface runoff; (b) node overflow; and (c) TSS load.
Water 16 02373 g012
Figure 13. Comprehensive performance of LID facilities: (a) permeable pavements; (b) green roofs; and (c) bio-retention cells.
Water 16 02373 g013
Figure 14. Cost–benefit curve of LID facilities: (a) overflow volume reduction rate; (b) runoff volume reduction rate; (c) runoff depth reduction rate; (d) peak runoff reduction rate; and (e) TSS reduction rate.
Water 16 02373 g014
Table 1. Water quality parameter values for SWMM model.
Land Use TypeMax. Buildup/(kg·hm−2)Rate ConstantWash Off CoefficientWash Off Exponent
Road600.60.0091.9
Building450.50.0101.8
Greenbelt350.560.0061.2
Table 2. SWMM model parameter calibration values.
SurfaceRunoff CoefficientInitial Losses (mm)Initial Infiltration Rate (mm/h)Minimum Infiltration Rate (mm/h)Decay Constant (1/h)Manning
Building0.90.15---0.012
Road0.90.15---0.011
Green-2.572241.20.15
Table 3. Values of LID facility parameters.
Process LayersParameterGreen RoofPermeable PavementBio-Retention Cell
Surface LayerBerm Height/mm8080200
Vegetation Volume Fraction0.300.7
Surface Roughness0.40.10.2
Surface Slope/%0.10.013
Pavement LayerThickness/mm 120
Void Ratio 0.15
Permeability/(mm·h−1) 120
Soil LayerThickness/mm150700200
Porosity0.50.50.5
Field Capacity0.20.20.2
Wilting Point0.0850.0240.085
Conductivity/(mm·h−1)181818
Conductivity Slope101010
Suction Head/mm110110110
Storage LayerThickness/mm-200300
Void Ratio-0.750.5
Seepage Rate/(mm·h−1)-1818
Drainage MatThickness/mm80--
Void Ratio0.5--
Roughness0.1--
Drain SystemDrain Exponent 0.50.5
Drain Offset Height/mm 66
Table 4. Design scheme of LID facility layout scale.
Design ScaleGreen Roof (ha)Permeable Pavement (ha)Bio-Retention Cell (ha)
10%0.160.220.10
20%0.310.450.20
30%0.470.670.29
40%0.630.900.39
50%0.781.120.49
60%0.941.340.59
70%1.101.570.69
80%1.251.790.78
90%1.412.010.88
100%1.572.240.98
Table 5. LID facility costs.
LID FacilitiesUnit Infrastructure Cost (RMB·m−2)
Green Roof300
Permeable Pavement200
Bio-retention Cell600
Table 6. Indicator weight values of LID facilities under different return periods.
Index Weight2-Year3-Year5-Year10-Year20-Year30-Year50-Year100-Year
PPrunoff0.30830.34310.23140.1890.18710.21220.21450.219
overflow0.3080.2910.35210.32910.24080.21840.22090.2323
TSS0.38370.36590.41650.48190.57210.56940.56470.5487
GRrunoff0.34220.32710.28710.46170.46780.42330.47690.5817
overflow0.37640.36090.45970.35820.32660.34290.26880.1358
TSS0.28150.31210.25320.180.20560.23380.25430.2825
BRrunoff0.32730.3180.30020.28050.31780.39060.49390.541
overflow0.29930.27690.27460.25880.20660.15830.12750.1261
TSS0.37340.4050.42520.46060.47550.45110.37860.3329
Disclaimer/Publisher’s Note: The statements, opinions and data contained in all publications are solely those of the individual author(s) and contributor(s) and not of MDPI and/or the editor(s). MDPI and/or the editor(s) disclaim responsibility for any injury to people or property resulting from any ideas, methods, instructions or products referred to in the content.