Article

Effects of Freeze−Thaw Cycles on Available Nitrogen Content in Soils of Different Crops

1
School of Hydraulic and Electric-Power, Heilongjiang University, Harbin 150080, China
2
Institute of Groundwater in Cold Regions, Heilongjiang University, Harbin 150080, China
*
Author to whom correspondence should be addressed.
Water 2024, 16(16), 2348; https://doi.org/10.3390/w16162348
Submission received: 28 June 2024 / Revised: 6 August 2024 / Accepted: 19 August 2024 / Published: 21 August 2024

Abstract

:
In order to study the effect of freeze−thaw cycles on the content of available nitrogen in soils of different crops and obtain an in-depth understanding of changes in soil fertility and soil environment in cold regions, a laboratory simulation experiment was conducted with different freeze−thaw times, temperature differences, and periods. The changes in available nitrogen concentrations in the 0–15 cm and 15–30 cm layers of corn, vegetable, and paddy soils were measured by the alkaline-hydrolysis diffusion method. The results were as follows. (1) The freeze−thaw process had significant effects on the available nitrogen content in the three soils. Under the treatment with different numbers of freeze−thaw cycles, the available nitrogen content in the 0–15 cm layers of corn soil, vegetable soil, and paddy soil reached the maximum values at the 8th, 1st, and 3rd freeze−thaw cycle, at 156.92 mg/kg, 479.17 mg/kg and 181.75 mg/kg, respectively; the available nitrogen content decreased slowly after reaching the maximum value. (2) Under the freeze−thaw temperature-difference treatment, the available nitrogen concentration in the 0–15 cm layers of corn soil, vegetable soil, and paddy soil reached the maximum value at a temperature difference of 30 °C, at 147 mg/kg, 476 mg/kg and 172.5 mg/kg, respectively, and the available nitrogen content of the 15–30 cm soil layers changed slightly. (3) Under different freeze−thaw periods, the magnitudes of the changes in soil available nitrogen concentration in 0–15 cm of corn soil and paddy soil were, in descending order, short-term freezing and long-term melting > long-term freezing and long-term melting > short-term freezing and short-term melting > long-term freezing and short-term melting. The soil available nitrogen concentration at different depths in the vegetable soil reached the maximum value under the treatment with long-term freezing and short-term melting. (4) The available nitrogen content of paddy soil under the high-water-content condition was higher than that of paddy soil under the low-water-content condition, and the change in available nitrogen content was more obvious under the high-water-content condition under different freeze−thaw period treatments; the opposite was true for corn soil and vegetable soil. Simulation studies on rapid changes in soil nitrogen content during tests that simulate winter freeze−thaw conditions are important for understanding crop growth, the application of nitrogen fertilizer in spring, and the prevention of surface-water pollution from agricultural runoff.

1. Introduction

Freeze−thaw cycles are a special natural phenomenon that occurs in the middle and high latitudes or in mountainous areas. When the outdoor temperature changes, the soil temperature also changes and fluctuates back and forth around the freezing point, so the soil freezes and thaws constantly [1]. Under the conditions caused by global warming, the soil freeze−thaw process and the time of onset of soil freezing will also change, which will affect the related functions of the ecosystem [2]. Frequent freeze−thaw processes are associated with changes in soil aggregate structure [3], humus concentration [4], salt migration [5], hydrothermal distribution [6], biological activity [7], etc., changing the distribution structure of elements in the soil. In recent years, the influence of freeze−thaw cycles on soil nitrogen type has been tested in alpine, tundra, wetland, and other regions [8]. Northeastern China is a significant region for grain production in China. However, there have been relatively few studies on the effect of freeze−thaw cycles on farmland soil in this area. The properties and fertility of farmland soil are closely related to grain production. Northeastern China experiences a large temperature difference between morning and evening in spring and is subject to severe seasonal freeze−thaw cycles and snowmelt erosion during the spring thaw [9]. Therefore, the climate may influence the redistribution of soil nutrients during the seasonal freeze−thaw cycle. Available nitrogen refers to the nitrogen in the soil that plants can absorb and utilize during growth. It is the main supply of nutrients for plants. Studying the impact of freezing and thawing on soil nitrogen content is crucial for spring soil management, fertilizer application, and improving plant nutrient status with regard to nitrogen [8].
To date, there has been extensive research, both domestic and foreign, on the impact of freezing and thawing on soil nitrogen. Brooks et al. [10] conducted a study on alpine soil under snow-cover conditions and found that the microbial-biomass nitrogen content increased significantly during early snowmelt, while inorganic nitrogen decreased. During late snowmelt, the microbial-biomass nitrogen pools decreased sharply, but the inorganic nitrogen pools did not change during the same period. Elliott et al. [11] collected surface soils from old temperate fields and investigated changes in soil extractable nitrogen under different freeze−thaw amplitudes and freezing rates. They concluded that freeze−thaw damage to soil organisms does not affect soil nitrogen content. However, an increase in soil protein-hydrolysis activity above freezing temperatures leads to an increase in extractable nitrogen, which subsequently increases upon thawing in mid-winter. Deelstra et al. [12] analyzed hydrological data from a small agricultural catchment in Northern Europe near the Baltic Sea region and found that nutrient losses are higher during freezing periods, with an average nitrogen loss of 5–35% per year. Wei et al. [13] utilized a semi-distributed hydrological model to simulate regional runoff and nitrogen changes in different forms. The study concluded that soil water content significantly influences soil nitrogen loss. Kämäri et al. [14] applied a nutrient-loading model in a cold-region watershed to simulate and assess nitrate nitrogen fluxes and concentrations based on five years of nitrate nitrogen flux and concentration data, laying the groundwork for further exploration of nitrogen flushing during fall and under snowmelt conditions. Cheng et al. [15] quantitatively investigated the relationship between runoff and runoff intensity, infiltration, erodibility of sediment and soil, and nitrogen-phosphorus loss through indoor experimental simulations and redundancy analysis and reached the conclusion that the fluctuation in sediment loss as well as total loss of nitrogen and phosphorus from the soil after freezing and thawing treatment was large in the low-water-content condition. Costa et al. [16] studied extreme hydrologic and nutrient variability in an agricultural watershed draining to Lake Winnipeg using an extension of the Modular Modeling System of the Cold Regions Hydrologic Modeling Platform. Juan et al. [17] analyzed the microbial nitrogen and soluble nitrogen fractions of three kinds of farmland soils in Northeast China through indoor freezing-and-thawing simulation experiments and found that the microbial nitrogen increased and then decreased during the freeze−thaw cycle and that soluble nitrogen fractions also increased significantly; they concluded that freezing and thawing could promote the transformation and accumulation of nitrogen in farmland soils in Northeast China.
The results of related studies at home and abroad provide a reference for exploring soil nutrient loss due to freezing and thawing, but all the simulations use different conditions of freezing and thawing, so there is still a lack of research on nutrient changes in soils of different crops affected by freezing and thawing. Soil nutrient loss in cold areas directly affects the growth of crops, and the effect of winter freezing and thawing on the conversion of soil effective nitrogen content directly affects the fertility of the soil in the spring of northeast China, which has a direct impact on the growth of spring crops. Therefore, this study examined the soils of three different crops from Harbin City, Heilongjiang Province (corn soil, paddy soil, vegetable soil) to determine the available nitrogen content of the three types of soils under conditions of different freeze−thaw times, freeze−thaw temperature differences, and freeze−thaw cycles through analysis. Based on the analysis of the results, we were able to measure the changes in soil available nitrogen caused by freezing and thawing, and this work lays a foundation for investigating the loss of nutrients from agricultural soils, the growth of agricultural crops, and pollution from agricultural surface sources.

2. Materials and Methods

2.1. Overview of the Study Area

The test soil was taken from Harbin City, Heilongjiang Province, which is located in the southwest part of Heilongjiang Province. The overview of the research area is shown in Figure 1. The central part of the region is crossed by the Songhua River basin. As a result of the climate, as well as of other environmental factors, the soil type is relatively rich, with black soil being the most dominant and most widely distributed soil type. Harbin belongs to the cold-temperate continental climate zone, with an average annual temperature of 5.6 °C, precipitation of 423 mm, and a frost-free period of 168 days. The major and minor rivers in the region belong to the Mudanjiang River System and the Songhua River System, with surface water mainly sourced from atmospheric precipitation and groundwater resources mainly sourced from atmospheric-precipitation recharge and rock-gap water. Water resources are characterized by uneven spatial and temporal distribution, being more abundant in the east and scarce in the west [18].

2.2. Sample Collection and Processing

Samples were collected on 4 November 2023 from corn soil, vegetable soil (planted with cabbage), and paddy soil. Samples included corn stalks, cabbage roots and leaves, and paddy stalks and leaves. Soil samples were collected using the multilayer split-point sampling method from depths of 0–15 cm and 15–30 cm. The samples were mixed, bagged, and transported to the laboratory. Weeds, plant roots, and other debris were removed, and the samples were passed through a 2 mm sieve. Corn stalks, cabbage roots and leaves, and paddy stalks and leaves were dried at 85 °C and crushed for reserve use. In this case, the soil density was determined by the ring-knife sampling method, where the ring knife was inserted completely into the soil sample and then slowly removed and the soil density of the sample was calculated by measuring the mass of the filling soil and the volume of the ring knife. The measured initial soil data are shown in Table 1.

2.3. Experimental Design

Freeze−thaw simulation experiments were carried out for 1, 3, 6, 8, 10, and 13 cycles. The freezing temperature was set at −20 °C for a duration of 24 h, after which the melting temperature was set to 15 °C for another 24 h. Additionally, freeze−thaw temperature-difference simulation experiments were carried out for differences of −5 °C to 5 °C, −10 °C to 10 °C, and −15 °C to 15 °C, with both freezing and thawing times set at 12 h. Four different freeze−thaw-period simulation experiments were conducted: short-term freezing and short-term melting (SS), long-term freezing and short-term melting (LS), short-term freezing and long-term melting (SL), and long-term freezing and long-term melting (LL); the short-term experiments lasted 0–12 h, while the long-term experiments lasted 12 h to 5 days. The freezing temperature was set to −20 °C, and the thawing temperature was set to 15 °C.
To prepare the soil samples, we began with 50 g of freshly sieved soil. Deionized water was used to adjust the soil moisture content to 15% for corn soil, 20% for vegetable soil, and 25% for paddy soil. The freeze−thaw-period simulation experiment was configured with soil water contents of 10% for corn soil, 15% for vegetable soil, and 30% for paddy soil, with 1 g of the corresponding crop residue added to the 0–15 cm soil samples (to simulate the field soil condition). The samples were then placed in an aluminum box, which was sealed with plastic wrap, and the ventilation holes on the sealing film were covered to ensure that the samples were free from air circulation. The samples were pre-cultured in a constant-temperature incubator at 5 °C for 7 days to restore their biological activity. This temperature simulates the average air temperature at the beginning of November, when the freeze−thaw cycle of the in situ soil in the field first occurred in the sampling area. Distilled water was used daily to replenish water lost during the pre-cultivation period. At the end of the cultivation, a portion of the soil was removed to determine the initial available nitrogen content of the soil at the corresponding water content. Lost water was regularly replenished. Soil samples from each group were air-dried and ground to determine the available nitrogen content. Each test included three parallel sample groups, with unfrozen and thawed soil serving as the control check (CK) for each test. The test conditions are shown in Table 2.

2.4. Determination Method

The alkaline-diffusion method [19] was used to determine the concentration of soil available nitrogen. The first step involved sifting 1–2 g of air-dried soil sample through a 2 mm sieve and placing it in the outer chamber of the diffusion dish. Next, the dish was slowly rotated horizontally, and 1 g of zinc—ferrous sulfate reductant was added to the outer chamber, which was laid flat on the soil sample. Then, 10 mL of sodium hydroxide solution at a concentration of 1.8 mol/liter was added to the outer chamber of the diffusion dish and 3 ml of boric-acid indicator was added to the inner chamber of the diffusion dish. The diffusion dish was covered tightly and slowly rotated to mix the solution fully with the soil sample. It was then stored at a constant temperature of 40 °C for 24 h. Alkaline conditions were used to induce soil hydrolysis, in which the hydrolysis-prone nitrogen was converted to ammonia nitrogen by alkalolysis, ammonium nitrogen was converted to ammonia by interaction with the added alkali, and nitrate and nitrite nitrogen in the soil were also reduced to ammonia in the presence of a reducing agent. Diffusion of ammonia occurred in the outer chamber of the diffusion dish; this ammonia was then absorbed by the boric-acid solution. Titration was carried out with a standard acid, with methyl red bromo-cresol green indicator used to determine the results of the titration. The initial moisture content of the soil was determined by the drying method (GBT50123-2019) [19], with the oven temperature set at 105 °C until a constant weight was reached. The formula used to calculate the available concentration of nitrogen is given in Equation (1), as follows:
A v a i l a b l e   n i t r o g e   n c o n t e n t = ( v v 0 ) × c × 14 m × k × 10 3
where v is the standard solution volume of hydrochloric acid used for titrating a sample (mL); v0 is the standard solution volume of hydrochloric acid for the titration blank (mL); c is the concentration of the hydrochloric acid standard solution (mol/L); m is the quality of air-dried soil sample (g); k is the conversion coefficient of moisture from air-dried soil sample to dried soil, with k = air-dried soil quality/dried soil quality; and 14 is the relative atomic mass of the nitrogen (N) atom.
An electric-heating constant-temperature blast drying oven (101-1A type, Manufacturer: Tianjin Test Instrument Co., Ltd., Tianjin, China. Purchased from: Tianjin, China) was used for soil drying, and a large-capacity freezer (BC/BD-421DT, Manufacturer: Changhong Meiling Co., Ltd., Hefei, China. Purchased from: Hefei, China) was used for soil freezing. Soil pre-cultivation and thawing were carried out in a fully automatic intelligent incubator (HWS-80B, Manufacturer: Mingtu Machinery Equipment Co., Ltd., Changge, China. Purchased from: Changge, China).

2.5. Data Analysis

The measurement results from the experiment were expressed as the mean ± standard deviation of three groups of parallel samples. The data were processed using Excel 2010, Origin 2019, and SPSS 23.0 software. The significance tests for changes in soil available nitrogen concentration versus the number of freeze−thaw cycles, the number of periods of freeze−thaw, and the size of freeze−thaw temperature differences were processed by one-way analysis of variance (ANOVA), and the experimental values were used for multiple comparisons by Duncan’s method with the significance level set at 0.05. Different lowercase letters indicate significant differences when the results were compared at the 0.05 level.

3. Results

3.1. Effect of Freeze−Thaw Frequency on Available Nitrogen Content in the Soil of Different Crops

As shown in Figure 2, the analysis of variance (ANOVA) revealed a significant effect of the number of freeze−thaw cycles on the available nitrogen concentration of the soils at depths of 0–15 cm and 15–30 cm in corn soil (p < 0.05). With the increase in the number of freeze−thaw cycles, the available nitrogen content of the soils all showed a decreasing, then increasing, then decreasing trend. The soil nutrient content in the top 15 cm increased by 4.66%, 15.28%, 7.91%, and 7.29% respectively, as the soil depth increased. The maximum value of soil nutrient content reached 156.92 mg/kg after 8 cycles of freezing and thawing. However, the concentration of available nitrogen in the soil decreased with increasing soil depth. In the 15–30 cm layer of soil in the corn field, the available nitrogen content increased slowly after freeze−thaw treatment, reaching a maximum value of 137.22 mg/kg after the 10th freeze−thaw treatment, which was 5.15% higher than that of the control group. At the beginning of the freeze−thaw treatment, the nitrogen content of the soil at different depths decreased compared to that of the control group.
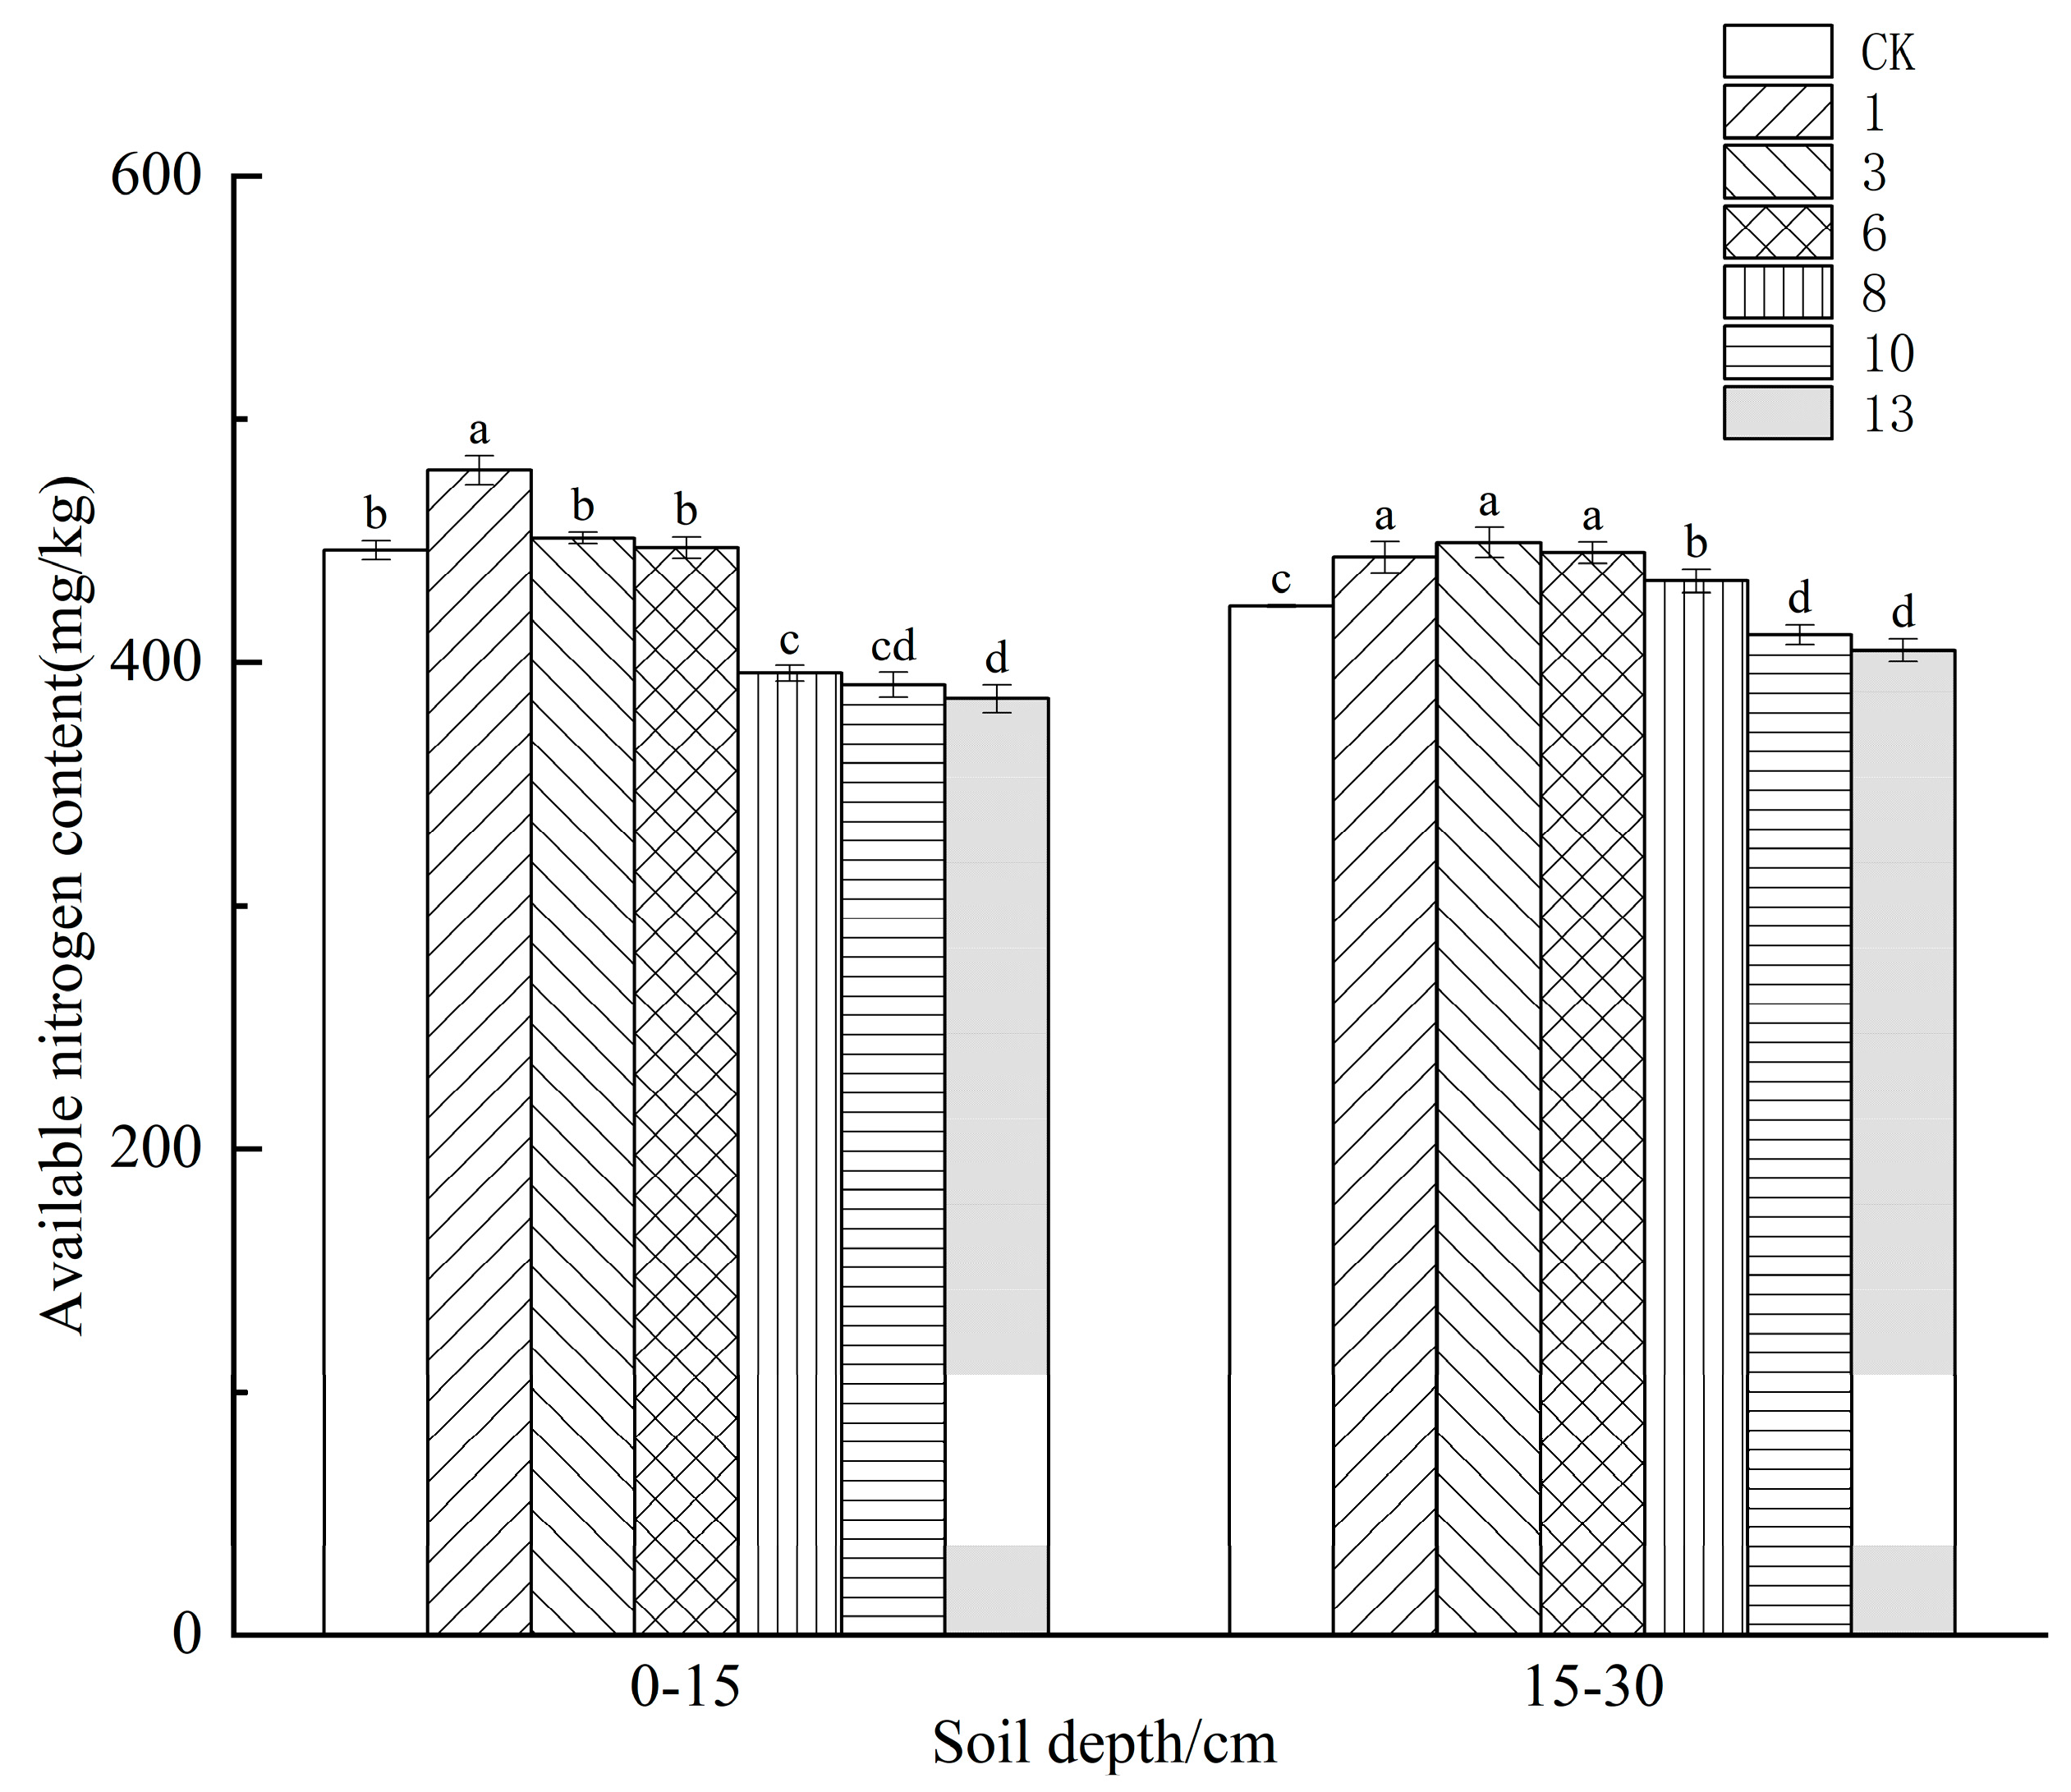
Based on the results of the analysis of variance (ANOVA) presented in Figure 3, it can be concluded that the available nitrogen concentration of the 0–15 cm and 15–30 cm soils in the vegetable soil had a significant effect on the number of freeze−thaw cycles (p < 0.05). With an increase in the number of freeze−thaw cycles, the available nitrogen content of the soil showed a rising trend followed by a slow decrease. The soil at a depth of 0–15 cm reached its maximum value of 479.17 mg/kg after the first freeze−thaw cycle, a value 7.38% higher than that of the control group. The nitrogen content increased by 1.12% and 0.22% in the 3rd and 6th cycles, respectively, compared to the control. In the 8th, 10th, and 13th freeze−thaw cycles, the available nitrogen content of 15–30 cm soil reached a maximum value of 449.37 mg/kg, which was 6.2% higher than that of the control group. However, after the 10th and 13th freeze−thaw cycles, the available nitrogen content decreased compared to that of the control group.
According to the analysis of variance presented in Figure 4, the available nitrogen concentrations of the paddy soil of 0–15 cm and 15–30 cm were significant affected by the increase in the number of freeze−thaw cycles (p < 0.05); as the number of freeze−thaw cycles increased, the available nitrogen content of the soil showed a trend of increasing and then slowly decreasing, but the overall trend showed an increase. In the third freeze−thaw cycle, the available nitrogen content of the 0–15 cm soil reached its maximum value of 181.75 mg/kg, a significant increase. It is important to note that this evaluation is based on objective data and not subjective interpretation. The nitrogen content of the 15–30 cm soil gradually decreased and then stabilized after the third freeze−thaw cycle. Compared to the control group, the available nitrogen content rose slowly after the freeze−thaw cycle and reached a maximum value of 162 mg/kg in the eighth freeze−thaw cycle, an increase of 7.46%.

3.2. Effect of Freeze−Thaw Temperature Difference on Available Nitrogen Content in the Soil of Different Crops

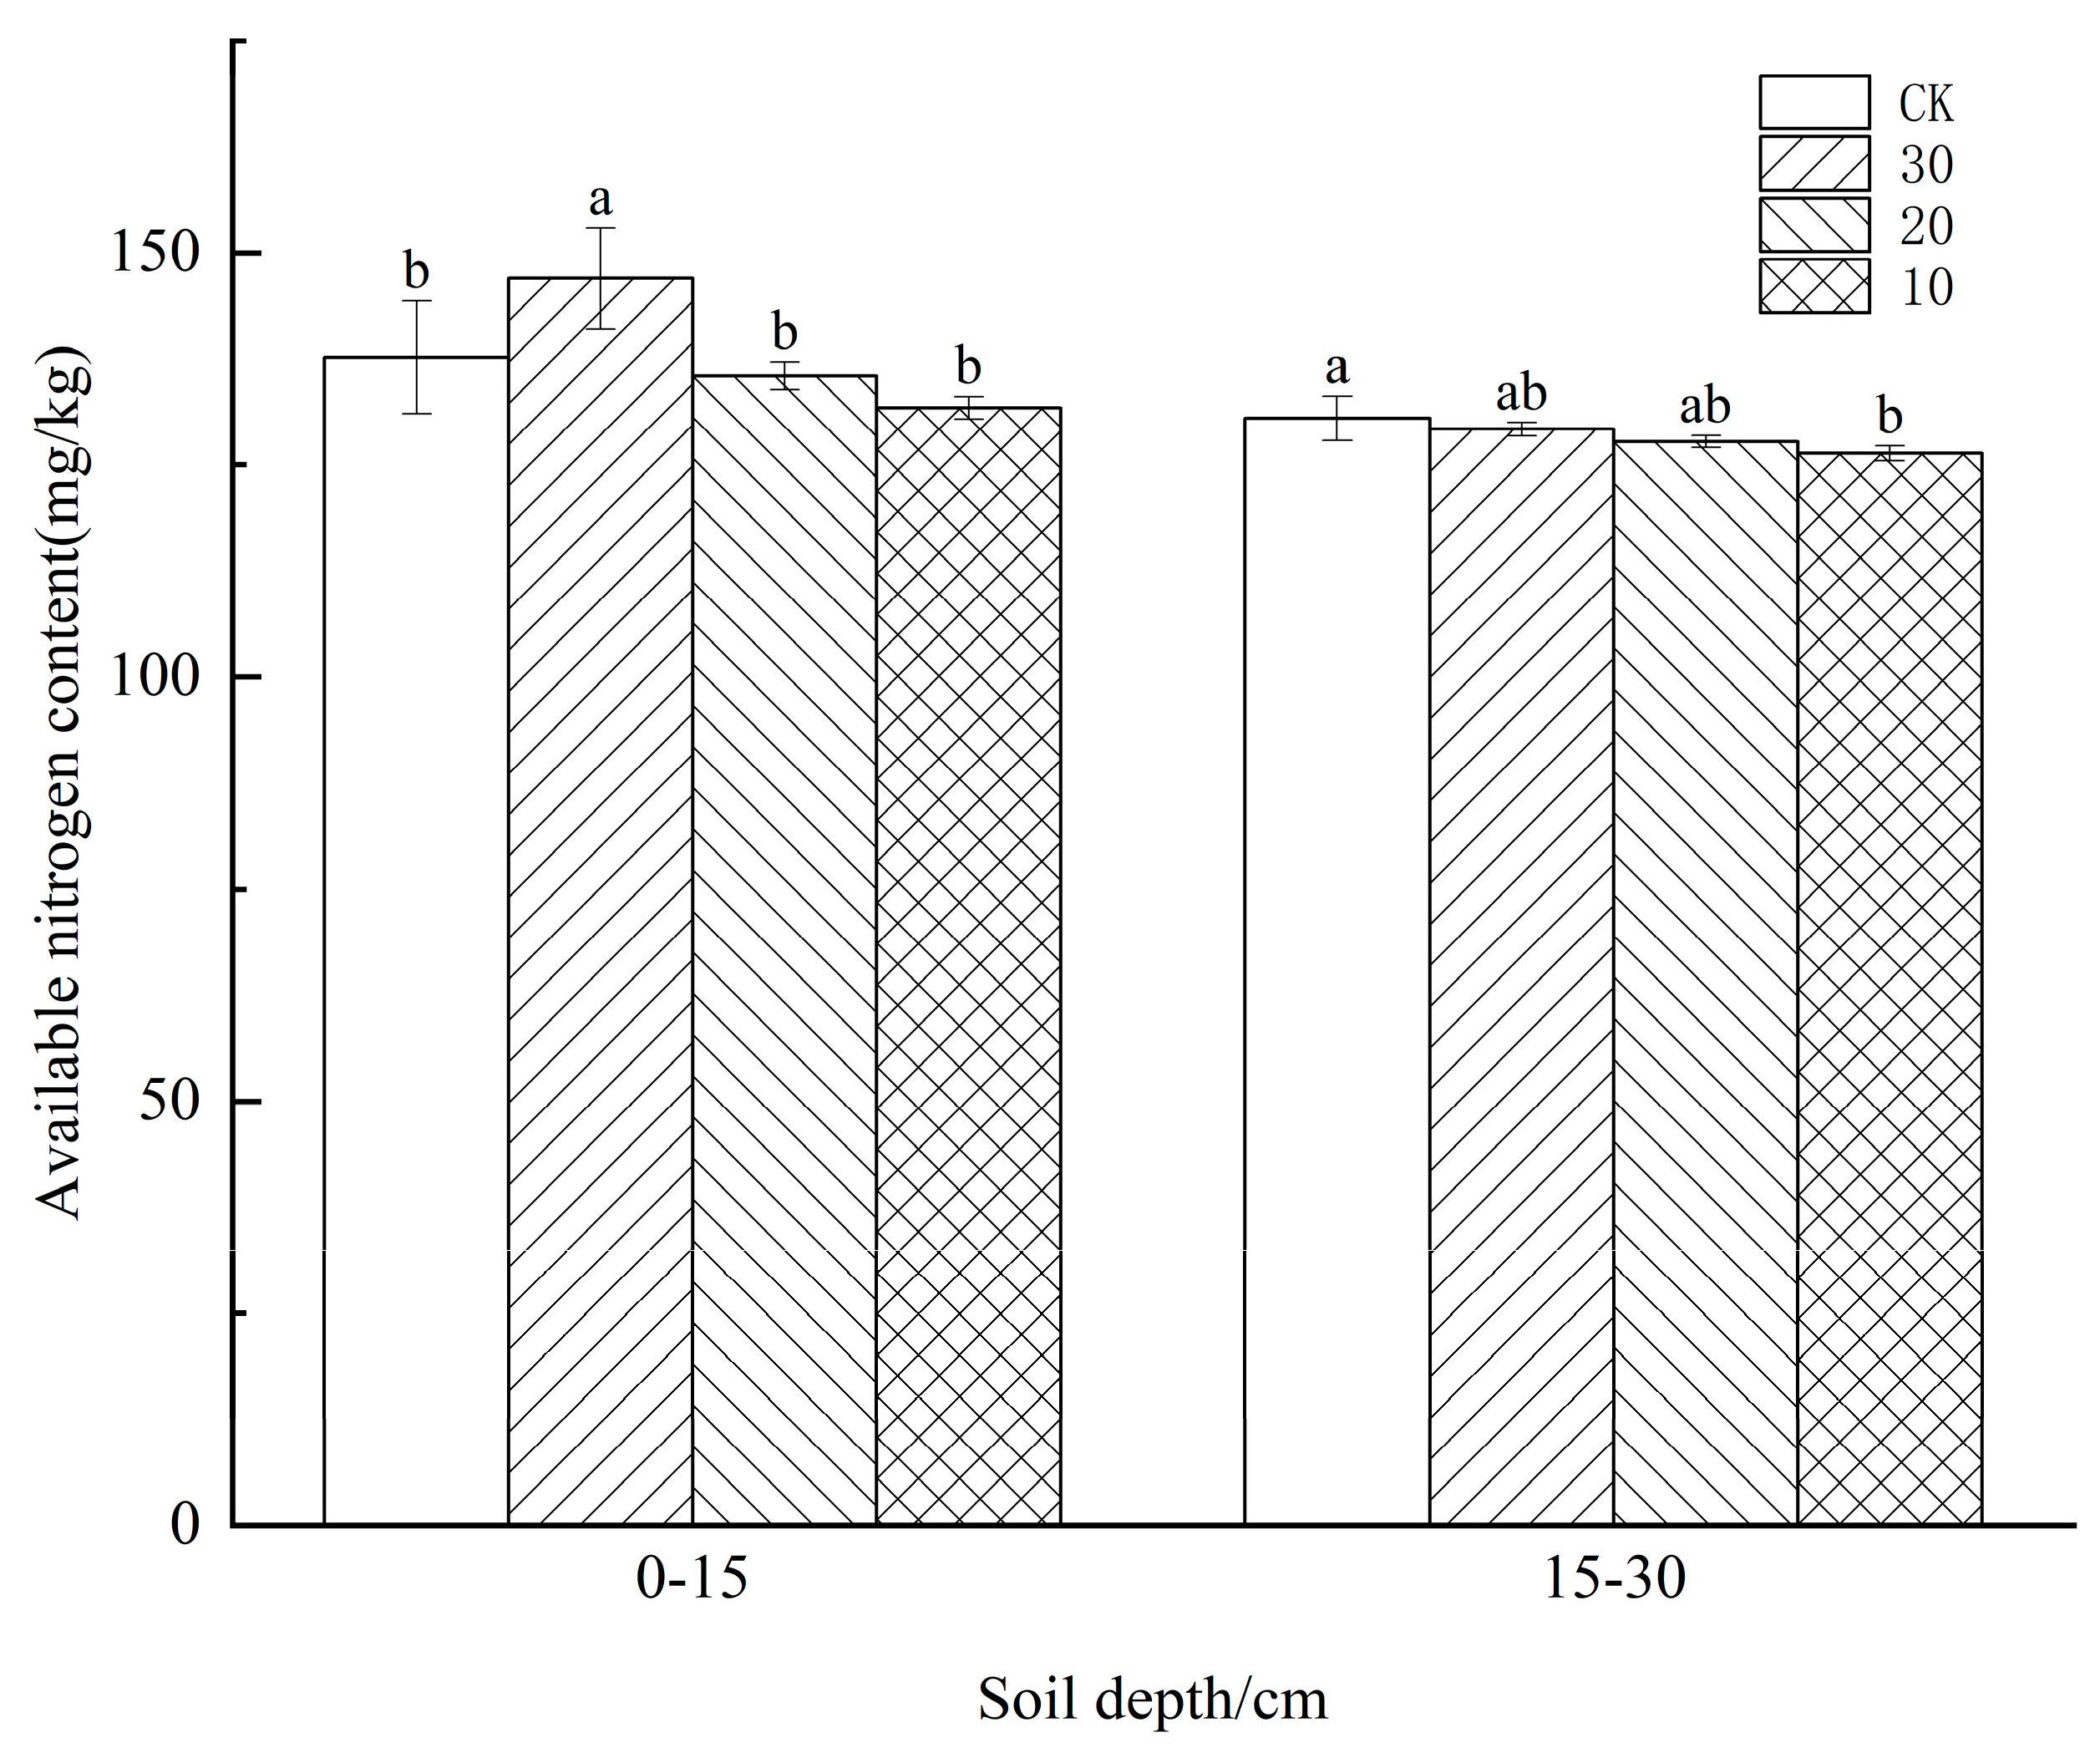
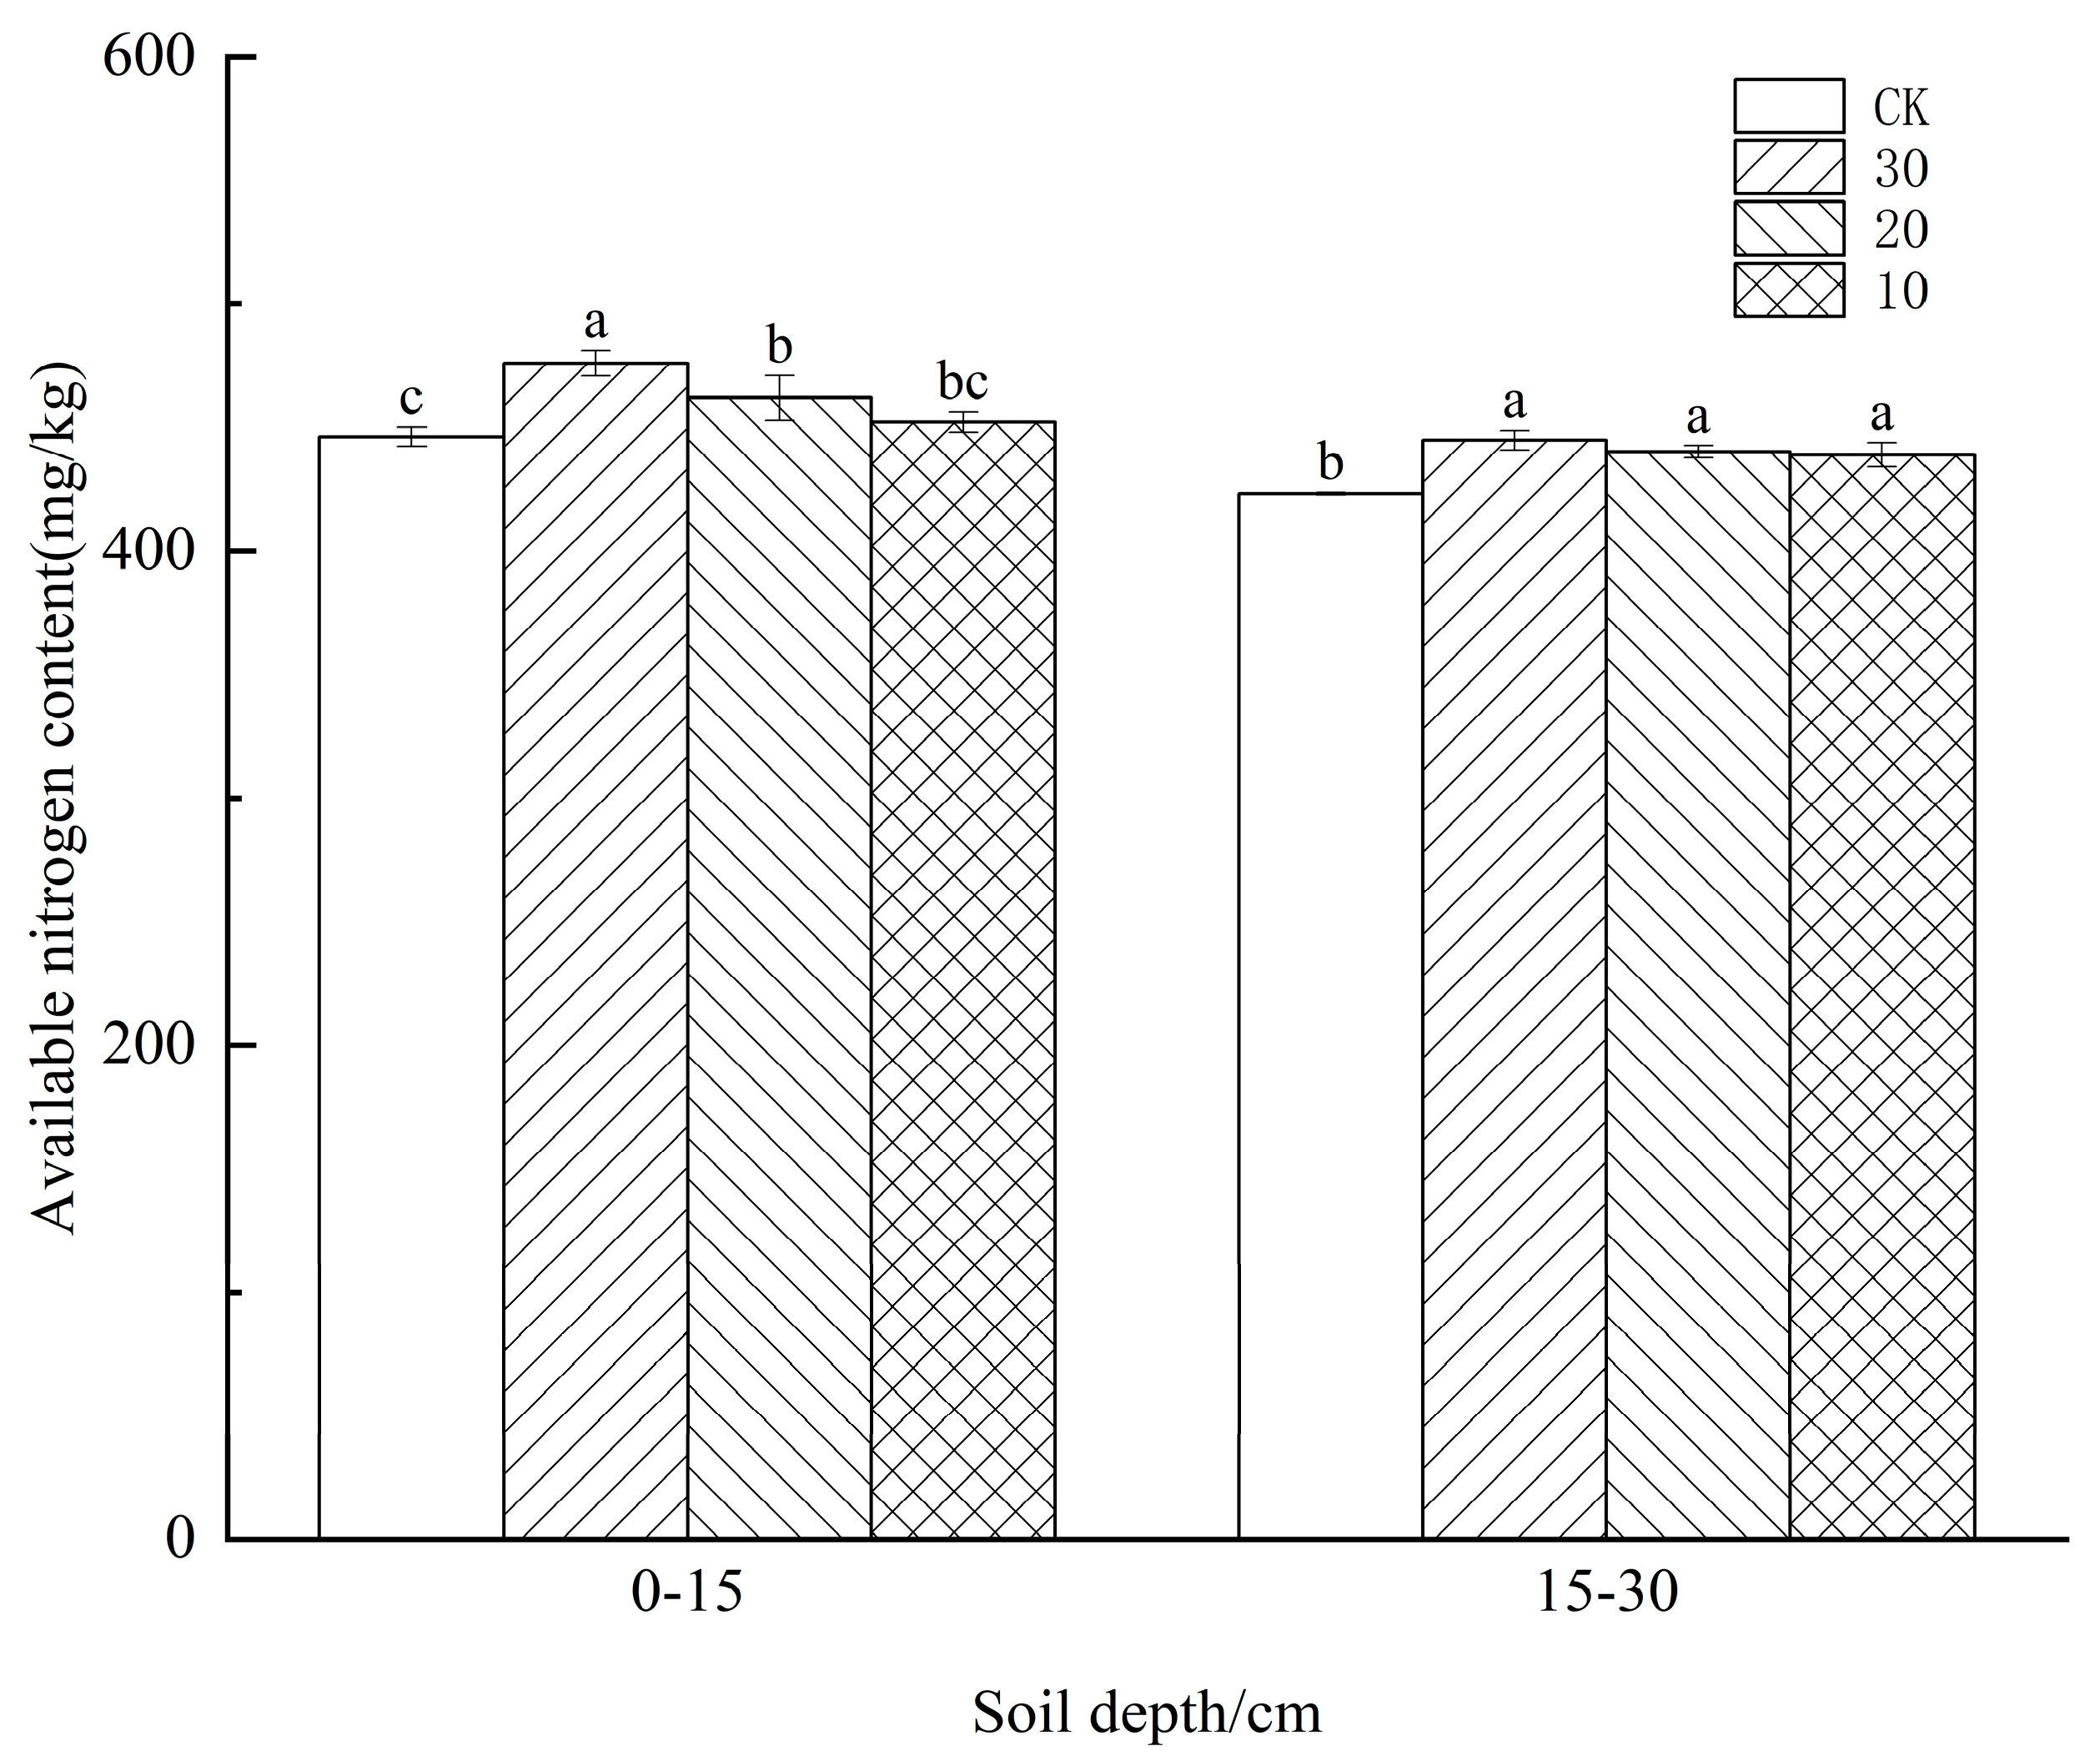
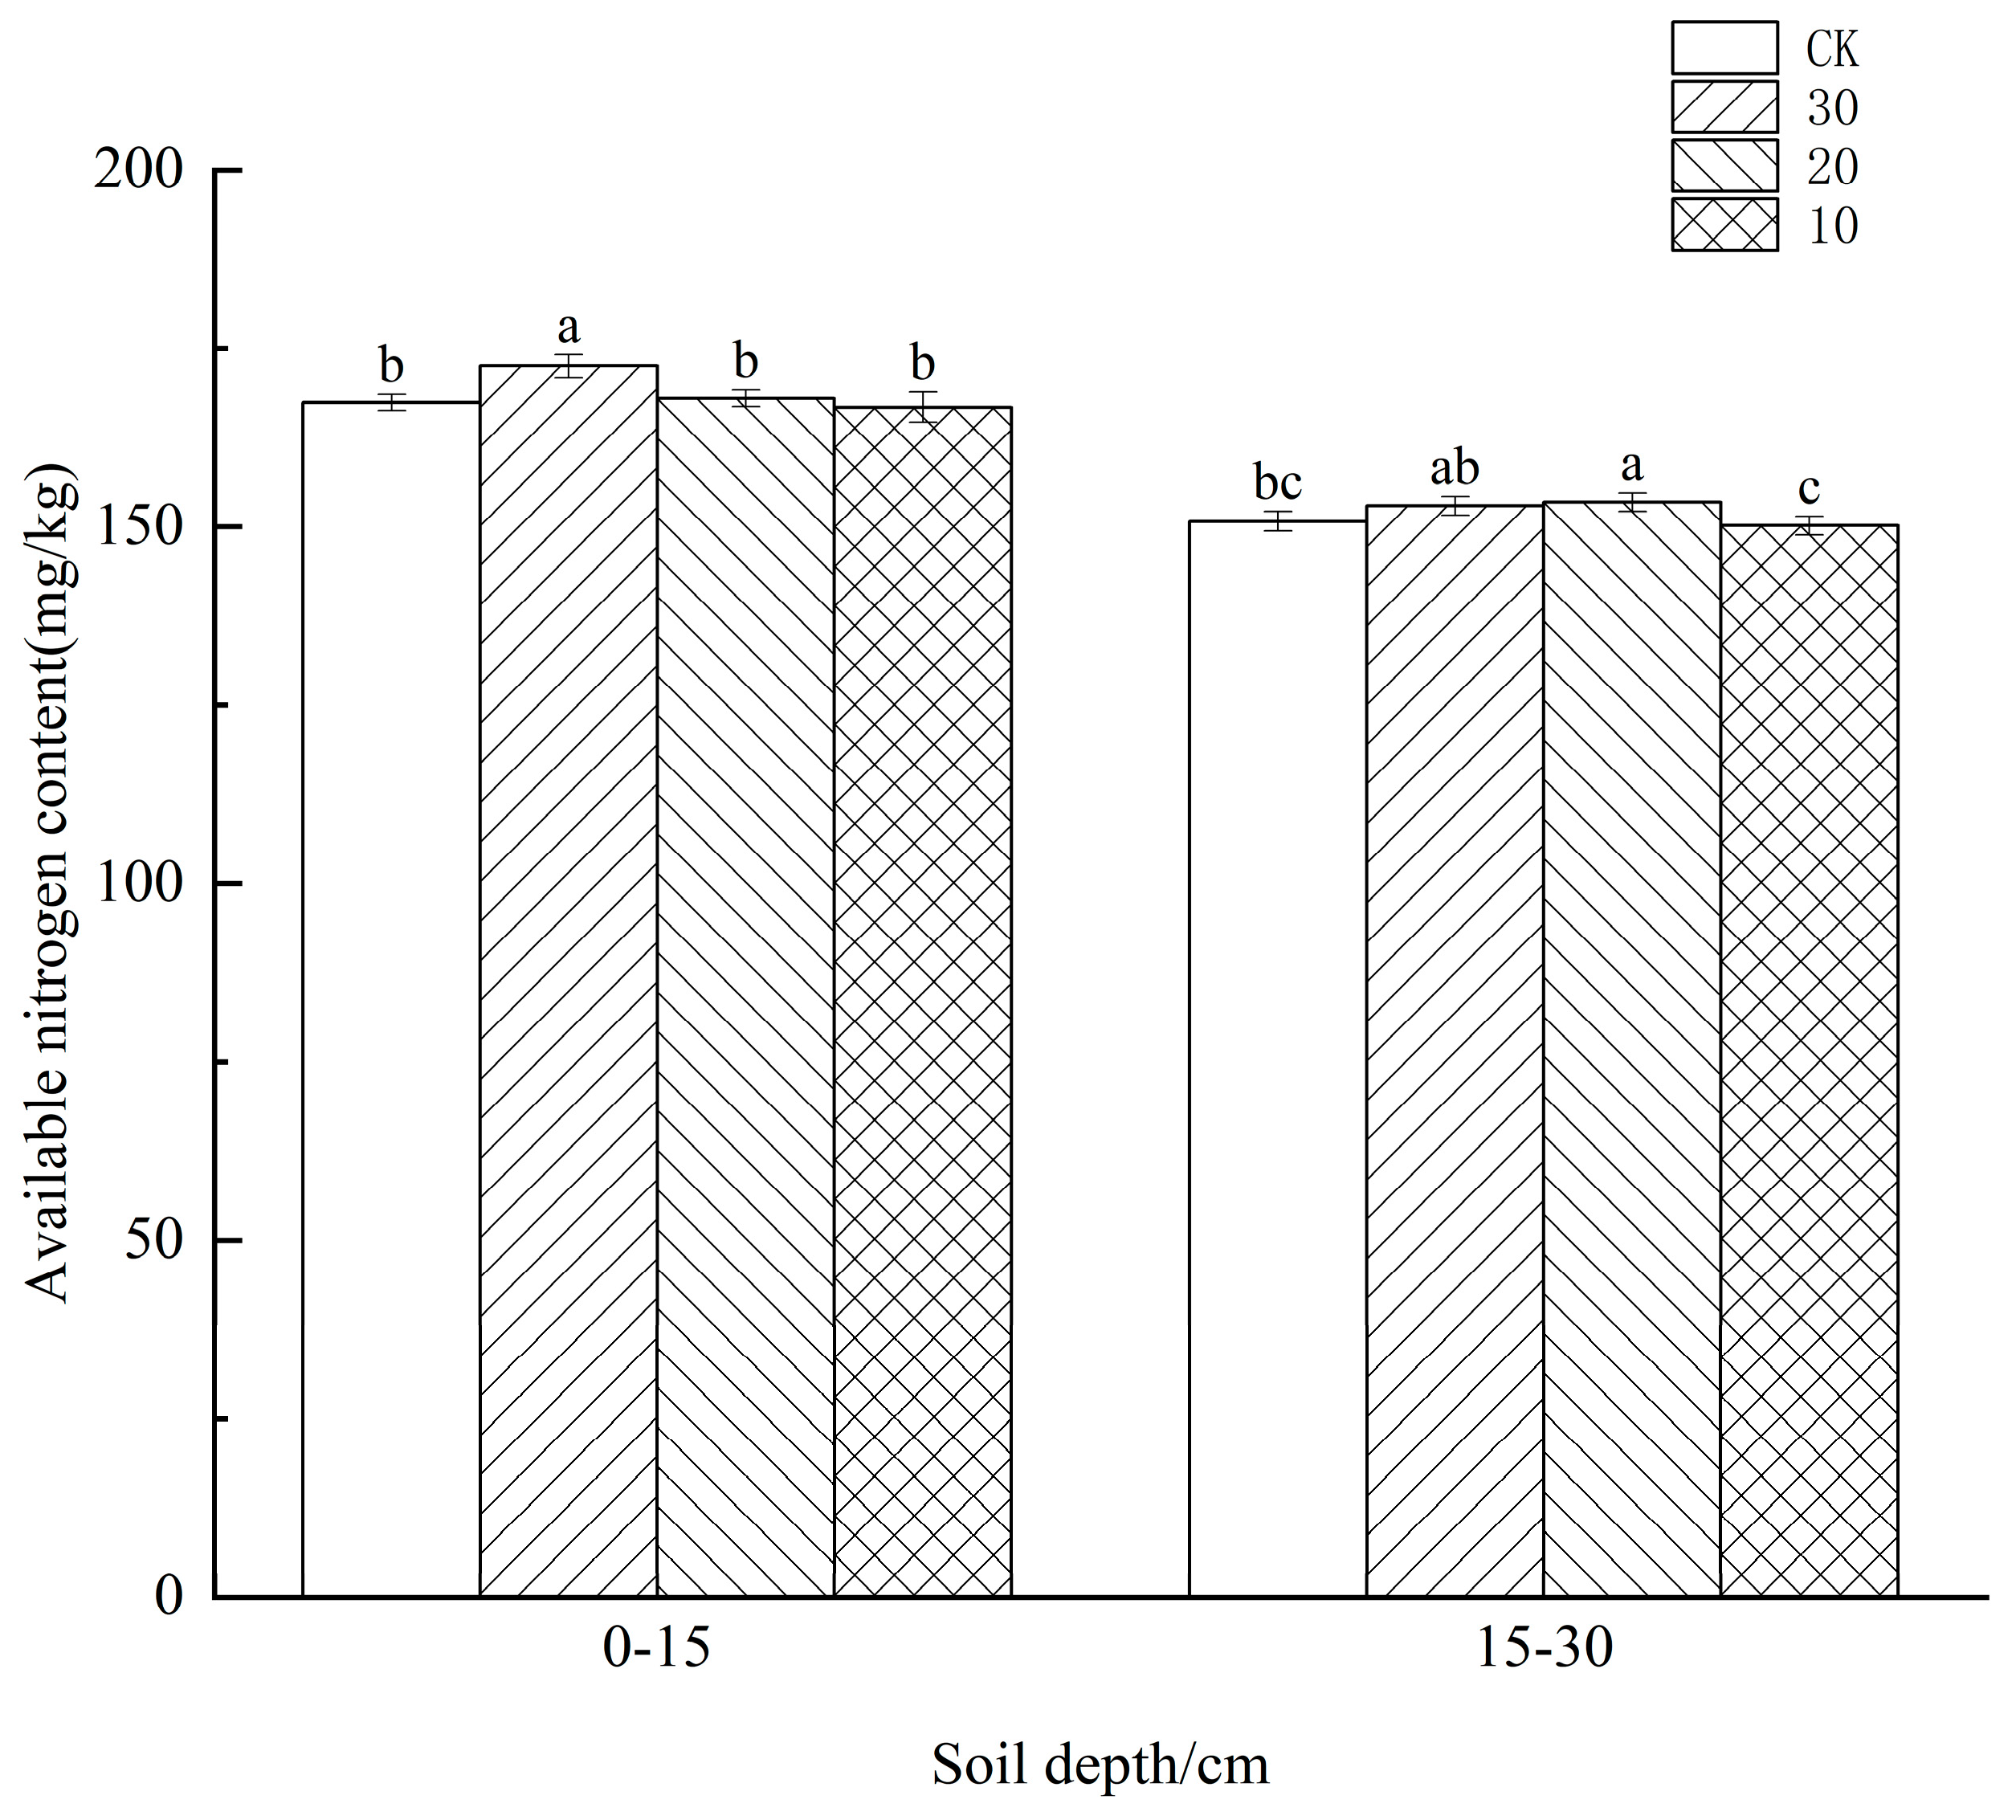
According to the results of the ANOVA analysis presented in Figure 5, the soil’s available nitrogen concentration in the 0–15 cm and 15–30 cm layers of the corn field was significantly affected by changes in the temperature difference between freezing and thawing (p < 0.05). The soil’s available nitrogen content in the 15–30 cm layer did not show any significant changes overall. The maximum soil available nitrogen concentration of 147 mg/kg was observed in the 0–15 cm layer at a temperature difference of 30 °C, while the soil’s available nitrogen content varied less at 10 °C and 20 °C. At a temperature difference of 30 °C, the available nitrogen concentration in the soil at 0–15 cm reached a maximum of 147 mg/kg, and the available nitrogen content of the soil varied less at 10 °C and 20 °C. As shown in Figure 6 and Figure 7, ANOVA analysis revealed that the freeze−thaw temperature difference significantly affected the available nitrogen concentration of the 0–15 cm and 15–30 cm soil layers in vegetable and paddy soils (p < 0.05), and the overall available nitrogen concentrations of the 0–15 cm and 15–30 cm layers of vegetable soil and the 0–15 cm layer of paddy soil reached the highest values when the freeze−thaw temperature difference was 30 °C. At freeze−thaw temperature differences of 10 °C and 20 °C, the available nitrogen content of the soil changed less. The available nitrogen concentrations of the 0–15 cm and 15–30 cm vegetable soils and the 0–15 cm paddy soil all reached the highest values at the freeze−thaw temperature difference of 30 °C, with increases of 6.67%, 5.13%, and 3.04%, respectively, compared with the soils at 10 °C. There were no significant changes in the 15–30 cm layer of paddy soil associated with the temperature difference between freezing and thawing.

3.3. Effects of Freeze−Thaw Periods on Available Nitrogen Content in the Soil of Different Crops

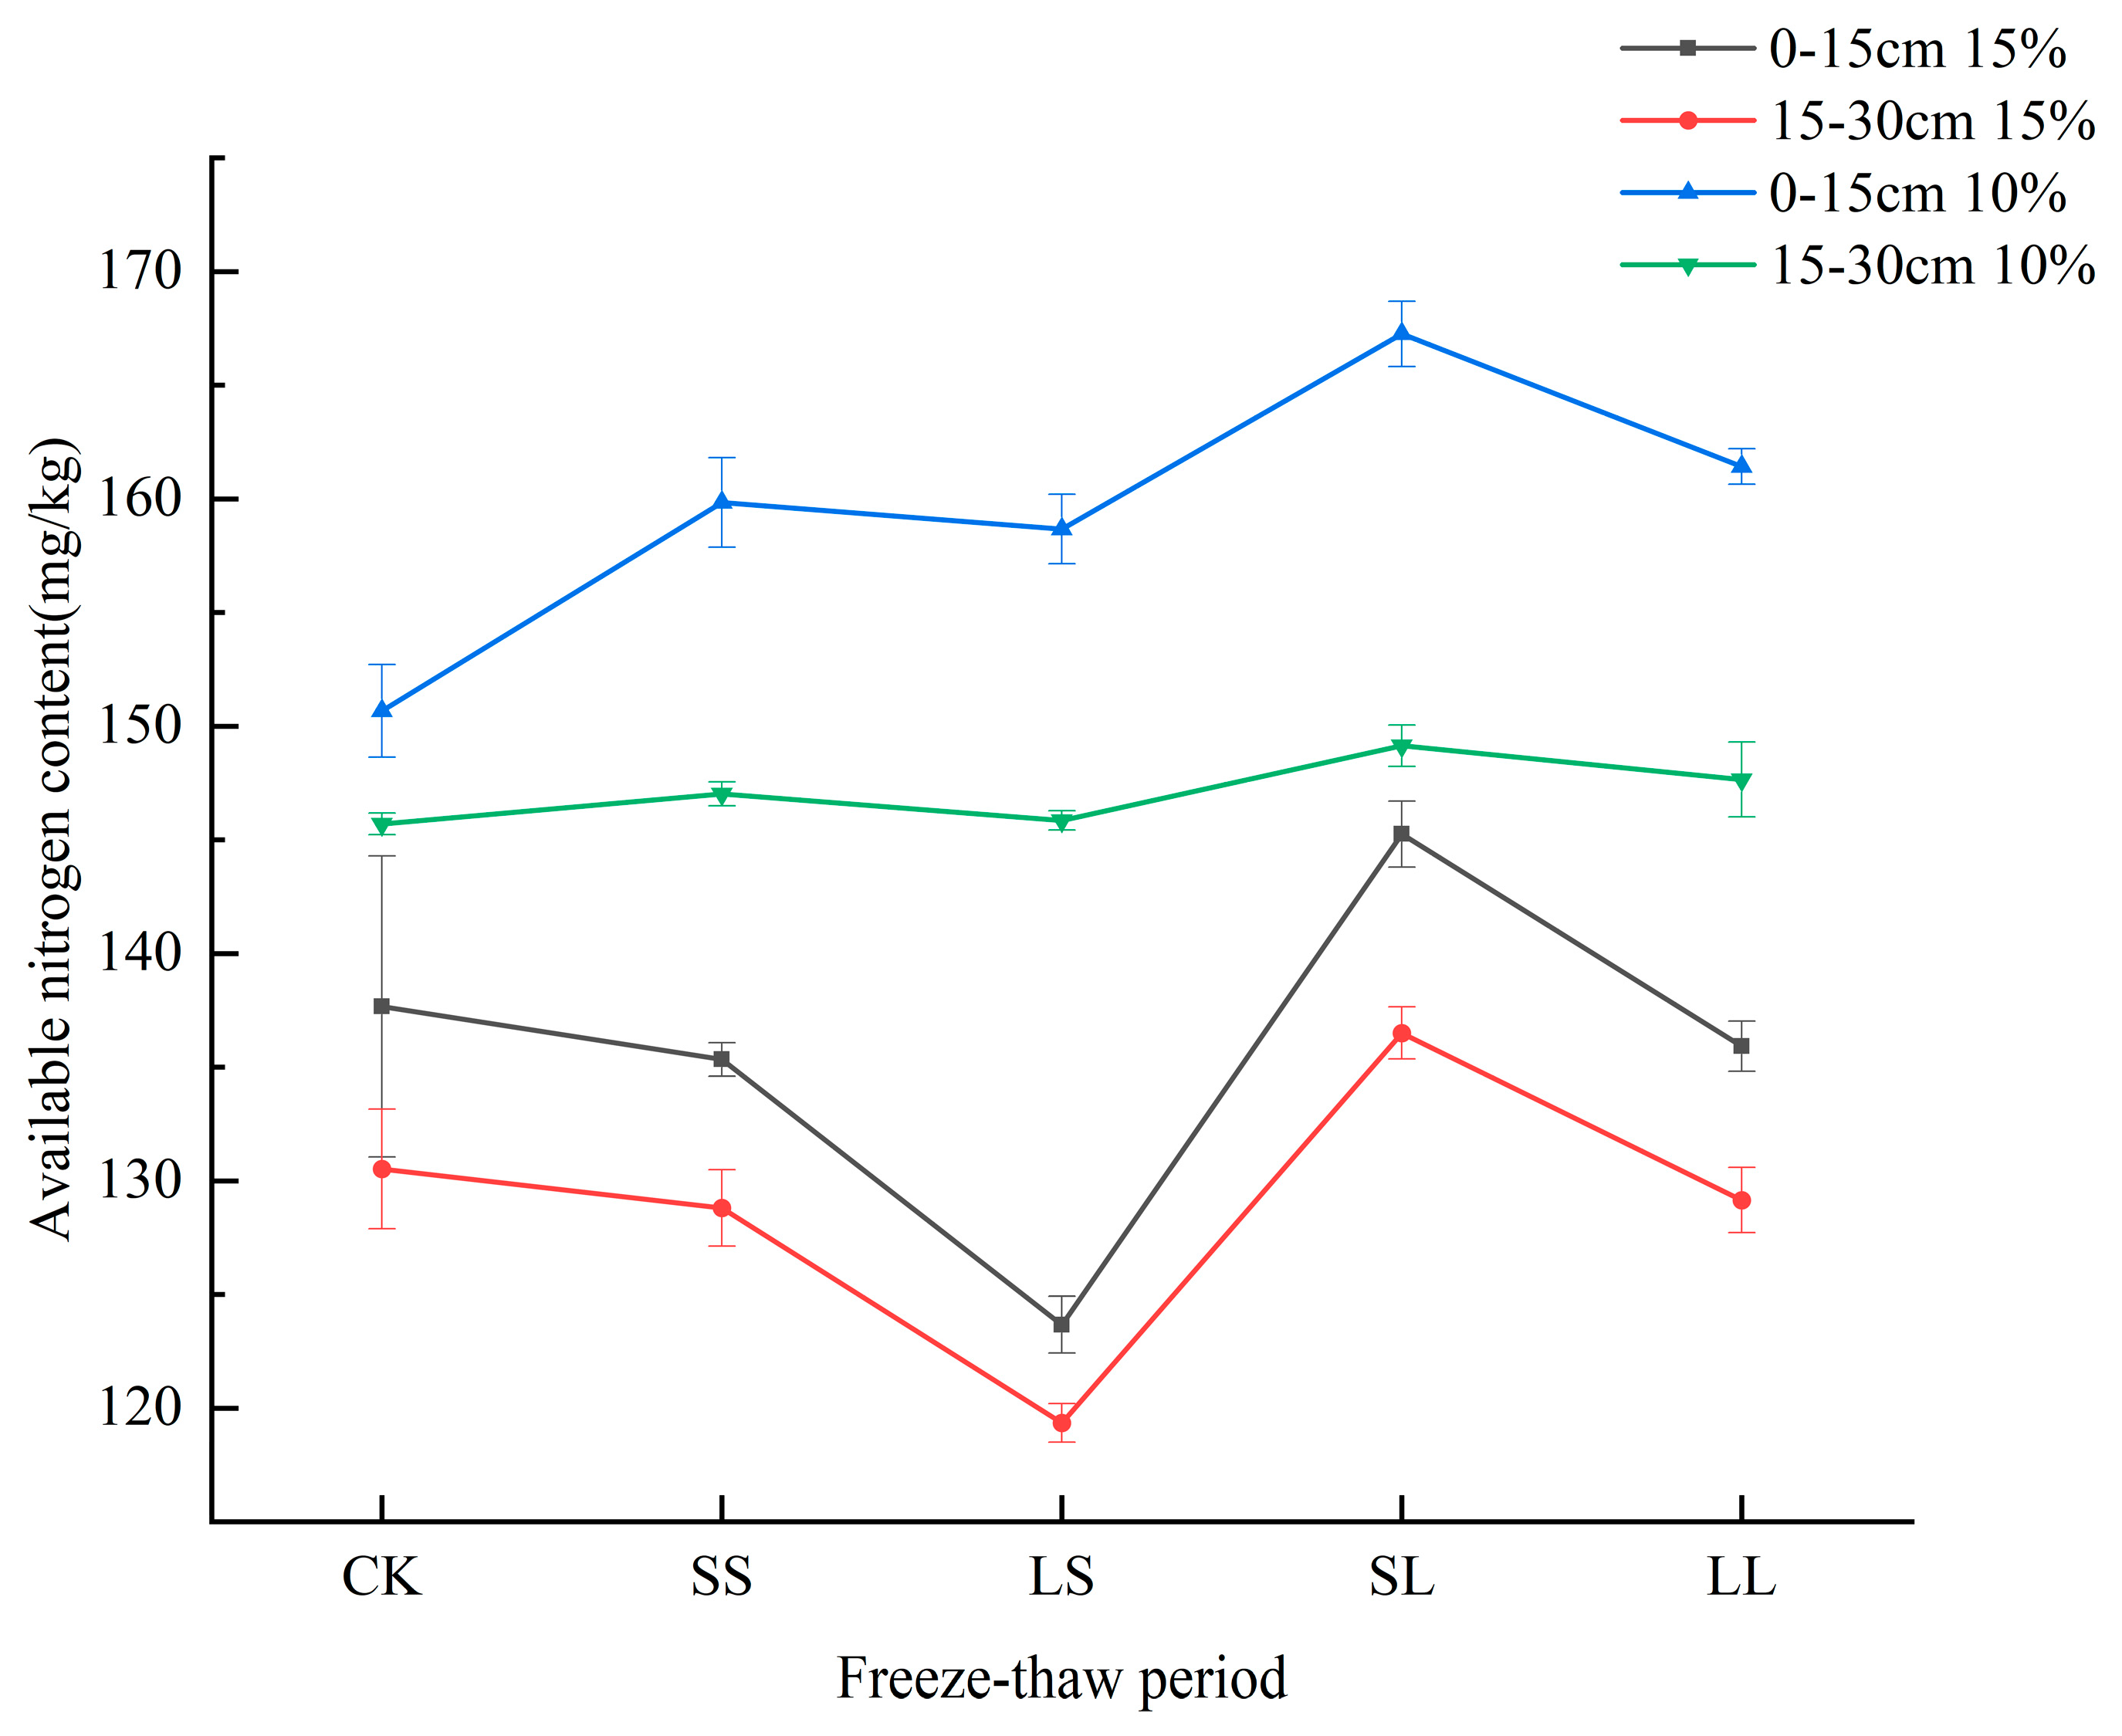
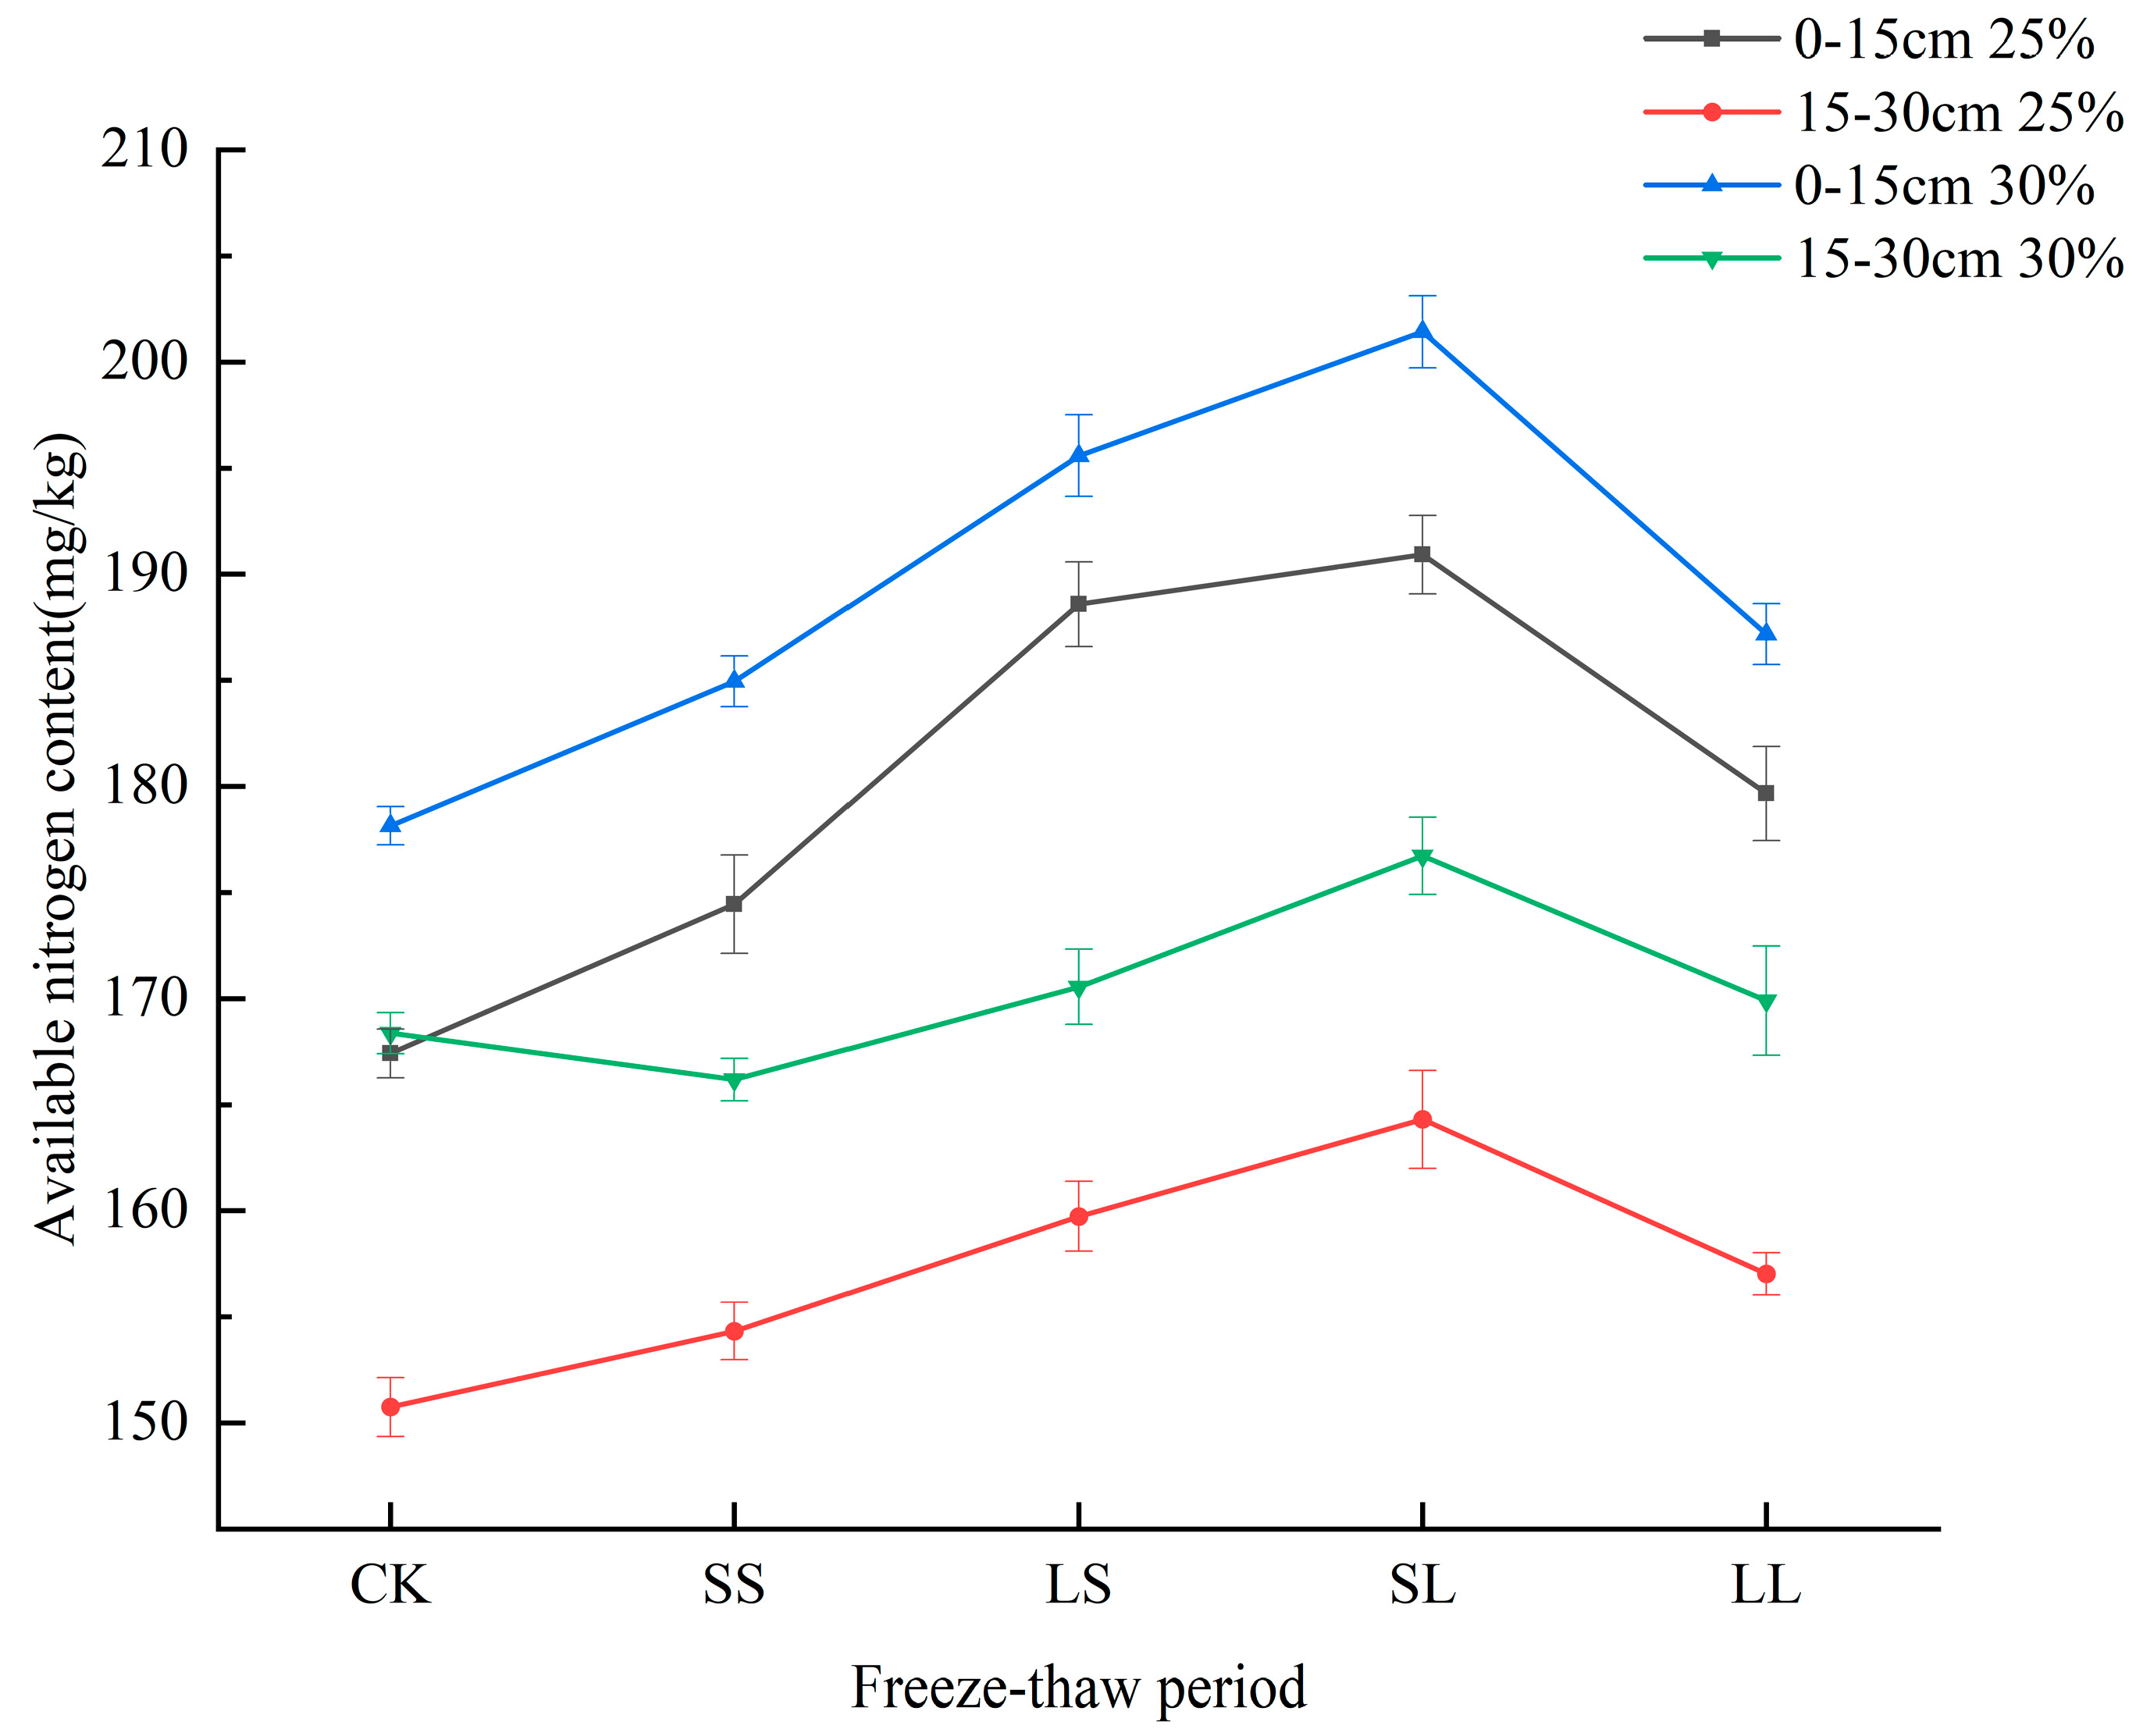
From Figure 8, Figure 9 and Figure 10, analysis of variance (ANOVA) revealed a significant effect of different freeze−thaw periods on soil available nitrogen concentration in the 0–15 cm and 15–30 cm layers of corn soil, vegetable soil, and paddy soil (p < 0.05). In the freeze−thaw-period simulation test, the orders of change in the magnitude of soil available nitrogen content in the 0–15 cm and 15–30 cm corn soil and paddy soil with different water contents were SL > LL > SS > LS and SL > LS > LL > SS, respectively. Vegetable soils with different levels of water content from the 0–15 cm and 15–30 cm layers reached their maximum values under LS, followed by SS. The available nitrogen content of the 0–15 cm and 15–30 cm corn-soil layers with 10% water content increased by 11% and 2.36%, respectively, under SL treatment compared to the control, while the available nitrogen content of 0–15 cm and 15–30 cm corn-soil layers with 15% water content increased by 5.51% and 4.6%, respectively, under SL treatment compared to the control. The available nitrogen content of the 0–15 cm and 15–30 cm layers of paddy soil with 25% water content increased by 14.04% and 9%, respectively, and the available nitrogen content of the 0–15 cm and 15–30 cm layers of paddy soil with 30% water content increased by 13.07% and 0.62%, respectively, under SL treatment compared to the control group. The available nitrogen content of the 0–15 cm and 15–30 cm layers of vegetable soil with 15% water content increased by 6.07% and 5.65%, respectively, under LS treatment compared to the control, while the available nitrogen content of the 0–15 cm and 15–30 cm layers of vegetable soil with 20% water content increased by 6.41% and 5.06%, respectively, under LS treatment compared to the control. The available nitrogen contents of different layers of the three soils under low-water-content conditions changed more significantly than did that of the control, reaching their maximum values under different treatments. The available nitrogen content was higher under low-water-content conditions for both corn and vegetable soil under all treatment conditions, while the opposite was true for paddy soil.

4. Discussion

4.1. Effect of Freeze−Thaw Frequency on Available Nitrogen Content in the Soil of Different Crops

After 13 freeze−thaw cycles, the available nitrogen content in the 0–15 cm and 15–30 cm layers of corn and paddy soils increased overall. This is consistent with the findings of Fitzhugh et al. [20], who observed that ice crystals formed during freeze−thaw cycles cause frost expansion, which destroys soil aggregates, microbial cells, and plant roots, leading to the release of nitrogen [21,22]. At the beginning of the freeze−thaw cycle, the corn field experiences a significant decrease in its available nitrogen content. This is due to the sudden drop in soil temperature, which causes the water in the surrounding area to freeze, leading to anoxia. This condition promotes denitrification of the soil, leading to nitrogen loss [23]. Variation in the nitrogen dynamics in the 0–15 cm soil layer of the corn field was large because the addition of straw to the topsoil also affects the dynamics of nitrogen [24]. The available nitrogen concentration of the soil of the cabbage field appeared to be reduced compared with that of the control group after an increase in the number of freeze−thaw cycles. The nitrification of different types of agricultural soils varies [25]. Cabbage, as a plant, has a higher capacity for ammonium and nitrate uptake [26]. During the freeze−thaw cycles, the available nitrogen contents of the three soils varied greatly at the start of the cycles. The available nitrogen contents showed weak variation with an increase in the number of freeze−thaw cycles, which is consistent with the findings of Zhou et al. [27]. At the start of the freeze−thaw cycle, soil microorganisms enter freezing conditions and die in large numbers. The dead microorganisms can then be used as nutrients to promote soil mineralization [28]. As the number of freeze−thaw cycles increases, more microorganisms adapt to the changing conditions, resulting in a gradual reduction in the number of dead microorganisms. The maximum available nitrogen content in the 0–15 cm and 15–30 cm layers of the corn, vegetable, and paddy soils was observed under varying numbers of freeze−thaw cycles. This suggests that the release of available nitrogen content is influenced by different crop types and varying soil moisture contents under the influence of freeze−thaw cycles.

4.2. Effect of Freeze−Thaw Temperature Difference on Available Nitrogen Content in the Soil of Different Crops

In this study, the available nitrogen content of three different soil layers increased with the increase in the freeze−thaw temperature difference. Paddy soil was less affected by the freeze−thaw temperature difference than were the other two soils. The moisture content of paddy soil is relatively high, and soil frost heave changes the size and stability of aggregates under conditions of large temperature difference between freezing and thawing. This further affects the nitrification process of the soil. The freeze−thaw process also changes the activity of microbial enzymes and the cleavage of microbial cells. The inorganic nitrogen released after cracking will also increase the content of soil available nitrogen, a point that further supports the findings of Ron Vaz et al. [29]. The strength of soil nitrogen mineralization varies among soils with different water contents and at different freezing temperatures. Neilsen et al. [30] found that soil nitrogen mineralization was enhanced at −13 °C, while there was no significant change at −3 °C. Gilliam et al. [31] suggested that relatively moderate freezing temperatures inhibited nitrogen mineralization in the soil, induced growth in nitrogen-assimilating microbial communities, and increased microbial nitrogen content to some extent [22]. It has been shown that soil-freezing temperatures below −5 °C cause more pronounced plant-root damage, releasing substrates that favor soil nitrification and thus increasing available nitrogen content [32,33]. The study found that the highest available nitrogen content in the shallow surface soil layer was achieved when the maximum freeze−thaw temperature difference was 30 °C. The mid-soil layer, on the other hand, showed a smaller change in available nitrogen concentration with differences in freeze−thaw temperature. The surface soil is relatively rich in fertilizer due to the decomposition of organic matter and plant and animal remains and due to nitrogen residues within the plant in the surface soil layer.

4.3. Effects of Freeze−Thaw Periods on Soil Available Nitrogen Content of Different Crops

Different freeze−thaw-period simulation experiments were set up, and the experiments with different periods simulated the changes in soil freeze−thaw cycles in early spring and late fall, as well as seasonally. The soil available nitrogen content of both corn and paddy soils reached the highest value with short-term freezing and long-term thawing, while the soil available nitrogen concentration of vegetable soils reached the highest value with long-term freezing and short-term thawing, which may be related to the higher initial nitrogen content of vegetable soils, the relatively high nitrogen content of soil microbial biomass, and lysis of microbial cells under long-term freezing, which in turn affects the nitrification reaction of the soil to promote the increase in the available nitrogen content of the soil. This shows that the effect of freezing and thawing on soil available nitrogen content is affected by multiple factors such as the intensity of temperature difference between freezing and thawing, the number of freeze−thaw cycles, the freezing and thawing periods, soil type, water content, and vegetation cover [22] and shows that there are also differences between regions [34]. Both corn soils and paddy soils reached their highest levels of soil available nitrogen under SL conditions, and Grogan et al. [8] found that short-term freezing had the greatest effect on soil amino nitrogen, which is a component of available nitrogen. The content of available nitrogen was also relatively high in corn soil under LL conditions, indicating that after freezing and thawing, long-term thawing process allows more time for nutrients to be used for soil mineralization reactions than does short-term thawing. In addition, the available nitrogen content of the vegetable plots was higher in SS and LS conditions than in SL and LL, probably due to the fact that part of the nitrogen was simultaneously denitrified during the long melting process and part of the nitrogen underwent loss in the form of gas [35]. The changes in available nitrogen content of corn and vegetable soil were more pronounced under low-water-content conditions, while the available nitrogen content of paddy soil was higher under high-water-content conditions, which may be due to the fact that, for different crop soils, the rate of mineralization of soil increases with increasing water content within a certain range of water content, while beyond this range, the mineralization of soil decreases with increasing water content [36]. This affects the fraction of available nitrogen in the soil produced by mineralization that can be taken up and utilized by plants. Different crop soils are also affected by surface apoplastic plants with different carbon-to-nitrogen ratios and different effects on soil nitrogen mineralization [37,38]. Risk’s results also indicate that the internal response of soil during freeze−thaw alternation is influenced by the interaction of freeze−thaw frequency, freeze−thaw temperature difference, soil depth, and physical and chemical properties [39].

5. Conclusions

In this study, 0–15 cm and 15–30 cm soils from three different crops of were selected to determine the changes in the available nitrogen content of the soils under different freeze−thaw times, freeze−thaw temperature differences, and freeze−thaw periods using the alkaline-dissolution diffusion method. The following conclusions were reached. (1) The frequency of freeze−thaw cycles had a significant effect (p < 0.05) on the available nitrogen content of different layers of corn, vegetable and paddy soils, and the available nitrogen content of corn, vegetable and paddy soils of different depths reached the maximum value under different freezing and thawing treatments. The available nitrogen content declined slowly as the number of freeze−thaw cycles continued to increase. (2) Under different freeze−thaw temperature differences, the available nitrogen content of the soil layers from different depths of the three soils increased with the increase in the freeze−thaw temperature difference and reached the highest value at 30 °C. The change in the surface soil was relatively obvious, a finding related to the addition of residual plants to the surface layer. There was no significant change in soil available nitrogen content at freeze−thaw temperature differences of 10 °C and 20 °C. (3) In simulation tests with different freeze−thaw periods, the available nitrogen content of corn and paddy soil layers from different depths varied consistently, reaching the highest values under conditions of short-term freezing and long-term melting. The available nitrogen content of different depths of vegetable soil was higher under the conditions of long-term freezing with short-term melting and short-term freezing with short-term melting. Changes in available nitrogen content under different soil-water-content conditions differed under the treatments of the freeze−thaw-period simulation experiment. Experimental studies have found that the available nitrogen content of different crop soils responds differently to freezing and thawing, information that can be used to rationally formulate nitrogen-fertilizer-application plans according to the nitrogen-supply capacity of different crop soils. Nitrogen fertilizer application directly affects crop yield; therefore, the study of changes in soil nitrogen content in the Northeast under freeze−thaw conditions has a positive effect on agricultural production as well as on the prevention and control of agricultural pollution from surface runoff [40]. In summary, different crop soils in cold regions can be properly maintained with using the natural decomposition of vegetation residues to ensure soil fertility.

Author Contributions

Conceptualization, Q.W. and M.C.; methodology, X.Y.; software, Q.W.; validation, M.C., X.Y. and Y.L.; formal analysis, Y.L.; investigation, M.C.; resources, M.C.; data curation, M.C.; writing—original draft preparation, Q.W.; writing—review and editing, X.Y. and Y.L.; visualization, Q.W. and X.Y. All authors have read and agreed to the published version of the manuscript.

Funding

This research was funded by University Nursing Program for Young Scholars with Creative Talents in Heilongjiang Province Project, grant number is “UNPYSCT-2020012”.

Data Availability Statement

The data presented in this study are available on request from the corresponding author.

Conflicts of Interest

The authors declare no conflicts of interest.

References

  1. Sun, D.; Yang, X.; Wang, C.; Hao, X.; Hong, J.; Lin, X. Dynamics of available and enzymatically hydrolysable soil phosphorus fractions during repeated freeze-thaw cycles. Geoderma 2019, 345, 1–4. [Google Scholar] [CrossRef]
  2. Song, L.; Zang, S.; Lin, L.; Lu, B.; Jiao, Y.; Sun, C.; Wang, H. The interaction between vegetation types and intensities of freeze-thaw cycles during the autumn freezing affected in-situ soil N2O emissions in the permafrost peatlands of the Great Hinggan Mountains, Northeastern China. Atmos. Environ. X 2022, 14, 100175. [Google Scholar] [CrossRef]
  3. Edwards, L.M. The effect of alternate freezing and thawing on aggregate stability and aggregate size distribution of some Prince Edward Island soils. J. Soil Sci. 1991, 42, 193–204. [Google Scholar] [CrossRef]
  4. Kang, K.H.; Shin, H.S.; Park, H. Characterization of humic substances present in landfill leachates with different landfill ages and its implications. Water Res. 2002, 36, 4023–4032. [Google Scholar] [CrossRef]
  5. Wood, P.M. Autotrophic and heterotrophic mechanisms for ammonia oxidation. Soil Use Manag. 1990, 6, 78–79. [Google Scholar] [CrossRef]
  6. Perfect, E.; Williams, P.J. Thermally induced water migration in frozen soils. Cold Reg. Sci. Technol. 1980, 3, 101–109. [Google Scholar] [CrossRef]
  7. Schadt, C.W.; Martin, A.P.; Lipson, D.A.; Schmidt, S.K. Seasonal dynamics of previously unknown fungal lineages in tundra soils. Science 2003, 301, 1359–1361. [Google Scholar] [CrossRef]
  8. Grogan, P.; Michelsen, A.; Ambus, P.; Jonasson, S. Freeze-thaw regime effects on carbon and nitrogen dynamics in sub-arctic heath tundra mesocosms. Soil Biol. Biochem. 2004, 36, 641–654. [Google Scholar] [CrossRef]
  9. Shen, Q.; Wang, X.; Qu, F.; Xiao, Z.; Zhang, X.; Zhang, S. Responses of soil total phosphorus to freeze and thaw cycles in a Mollisol watershed. Geoderma 2020, 376, 114571. [Google Scholar] [CrossRef]
  10. Brooks, P.D.; Williams, M.W.; Schmidt, S.K. Inorganic Nitrogen and Microbial Biomass Dynamics before and during Spring Snowmelt. Biogeochemistry 1998, 43, 1–15. [Google Scholar] [CrossRef]
  11. Elliott, A.C.; Henry, H. Freeze-thaw cycle amplitude and freezing rate effects on extractable nitrogen in a temperate old field soil. Biol. Fertil. Soils 2009, 45, 469–476. [Google Scholar] [CrossRef]
  12. Deelstra, J.; Kvaernø, S.H.; Granlund, K.; Sileika, A.S.; Gaigalis, K.; Kyllmar, K.; Vagstad, N. Runoff and nutrient losses during winter periods in cold climates--requirements to nutrient simulation models. J. Environ. Monit. JEM 2009, 11, 602–609. [Google Scholar] [CrossRef]
  13. Ouyang, W.; Xu, X.; Hao, Z.; Gao, X. Effects of soil moisture content on upland nitrogen loss. J. Hydrol. 2017, 546, 71–80. [Google Scholar] [CrossRef]
  14. Kämäri, M.; Huttunen, I.; Valkama, P.; Huttunen, M.; Korppoo, M.; Tattari, S.; Lotsari, E. Modelling inter- and intra-annual variation of riverine nitrogen/nitrate losses from snowmelt-affected basins under agricultural and mixed land use captured with high-frequency monitoring. Catena 2019, 176, 227–244. [Google Scholar] [CrossRef]
  15. Cheng, Y.; Li, P.; Xu, G.; Wang, X.; Li, Z.; Cheng, S.; Huang, M. Effects of dynamic factors of erosion on soil nitrogen and phosphorus loss under freeze-thaw conditions. Geoderma 2021, 390, 114972. [Google Scholar] [CrossRef]
  16. Costa, D.; Pomeroy, J.W.; Brown, T.; Baulch, H.; Elliott, J.; Macrae, M. Advances in the simulation of nutrient dynamics in cold climate agricultural basins: Developing new nitrogen and phosphorus modules for the Cold Regions Hydrological Modelling Platform. J. Hydrol. 2021, 603, 126901. [Google Scholar] [CrossRef]
  17. Juan, Y.H.; Liu, Y.; Gong, L.; Sun, W.T. Response of nitrogen transformation properties to freezing-thawing cycles in farmland soils. Jiangsu Agric. Sci. 2019, 47, 282–285. [Google Scholar]
  18. Qi, Y.; Hu, Y. Spatial-temporal Variation and Driving Forces of Water Yield in Harbin City. Bull. Soil Water Conserv. 2023, 43, 294–303. [Google Scholar]
  19. Zhang, Y. Soil, Water and Plant Physicochemical Analysis Course, 1st ed.; China Forestry Publishing House: Beijing, China, 2011; pp. 59–61. [Google Scholar]
  20. Fitzhugh, R.D.; Driscoll, C.T.; Groffman, P.M.; Tierney, G.L.; Fahey, T.J.; Hardy, J.P. Effects of soil freezing disturbance on soil solution nitrogen, phosphorus, and carbon chemistry in a northern hardwood ecosystem. Biogeochemistry 2001, 56, 215–238. [Google Scholar] [CrossRef]
  21. Deluca, T.H.; Keeney, D.R.; Mccarty, G.W. Effect of freeze-thaw events on mineralization of soil nitrogen. Biol. Fertil. Soils 1992, 14, 116–120. [Google Scholar] [CrossRef]
  22. Zhang, X.; Bai, W.; Gilliam, F.S.; Wang, Q.; Han, X. Effects of in situ freezing on soil net nitrogen mineralization and net nitrification in fertilized grassland of northern china. Grass Forage Sci. 2011, 66, 391–401. [Google Scholar] [CrossRef]
  23. van Bochove, E.; Jones, H.G.; Bertrand, N.; Prévost, D. Winter fluxes of greenhouses gases from snow-covered agricultural soil: Intraannual and interannual variations. Glob. Biogeochem. Cycles 2000, 14, 113–115. [Google Scholar] [CrossRef]
  24. Yao, Y.; Gao, B.; Zhang, M.; Inyang, M.; Zimmerman, A.R. Effect of biochar amendment on sorption and leaching of nitrate, ammonium, and phosphate in a sandy soil. Chemosphere 2012, 89, 1467–1471. [Google Scholar] [CrossRef] [PubMed]
  25. Cheng, W.; Tsuruta, H.; Chen, G.; Yagi, K. N20 and NO production in various Chinese agricultural soils by nitrification. Soil Biol. Biochem. 2004, 36, 953–963. [Google Scholar] [CrossRef]
  26. Tian, X.H.; Li, S.X. Uptake capacity of several vegetable crops to nitrate and ammonium. J. Plant Nutr. Fertil. 2000, 6, 194–201. [Google Scholar]
  27. Zhou, W.M.; Chen, H.; Zhou, L.; Lewis, B.J.; Ye, Y.; Tian, J.; Li, G.; Dai, L. Effect of freezing-thawing on nitrogen mineralization in vegetation soils of four landscape zones of Changbai Mountain. Ann. For. Sci. 2011, 68, 943–951. [Google Scholar] [CrossRef]
  28. Yu, X.F.; Zou, Y.C.; Jiang, M.; Lu, X.G.; Wang, G.P. Response of soil constituents to freeze-thaw cycles in wetland soil solution. Soil Biol. Biochem. 2011, 43, 1308–1320. [Google Scholar] [CrossRef]
  29. Vaz, M.; Edwards, A.; Shand, C.; Cresser, M. Changes in the chemistry of soil solution and acetic-acid extractable P following different types of freeze/thaw episodes. Eur. J. Soil Sci. 1994, 45, 353–359. [Google Scholar] [CrossRef]
  30. Nielsen, C.; Groffman, P.; Hamburg, S.; Driscoll, C.; Fahey, T.; Hardy, J. Freezing effects on carbon and nitrogen cycling in northern hardwood forest soils. Soil Sci. Soc. Am. J. 2001, 65, 1723–1730. [Google Scholar] [CrossRef]
  31. Gilliam, F.S.; Cook, A.; Lyter, S. Effects of experimental freezing on soil nitrogen dynamics in soils from a net nitrification gradient in a nitrogen saturated hardwood forest ecosystem. Can. J. For. Res. 2010, 40, 436–444. [Google Scholar] [CrossRef]
  32. Edwards, A.C.; Scalenghe, R.; Freppaz, M. Changes in the seasonal snow cover of alpine regions and its effect on soil processes: A review. Quat. Int. 2007, 162–163, 172–181. [Google Scholar] [CrossRef]
  33. Groffman, P.M.; Driscoll, C.T.; Fahey, T.J.; Hardy, J.P.; Fitzhugh, R.D.; Tierney, G.L. Colder soils in a warmer world: A snow manipulation study in a northern hardwood forest ecosystem. Biogeochemistry 2001, 56, 135–150. [Google Scholar] [CrossRef]
  34. Schimel, J.P.; Clein, J.S. Microbial response to freeze-thaw cycles in tundra and taiga soils. Soil Biol. Biochem. 1996, 28, 1061–1066. [Google Scholar] [CrossRef]
  35. Burton, D.L.; Beauchamp, E.G. Profile nitrous oxide and carbon dioxide concentrations in a soil subject to freezing. Soil Sci. Soc. Am. J. 1994, 58, 115–122. [Google Scholar] [CrossRef]
  36. Chen, F.S.; Yu, K.; Gan, L.; Liu, Y.; Hu, X.F.; Ge, G. Effects of temperature, moisture and forest succession on nitrogen mineralization in hillside red soils in mid-subtropical region, China. Chin. J. Appl. Ecol. 2009, 20, 1529–1535. [Google Scholar]
  37. Christopher, S.; Shibata, H.; Ozawa, M.; Nakagawa, Y.; Mitchell, M. The effect of soil freezing on N cycling: Comparison of two headwater subcatchments with different vegetation and snowpack conditions in the northern hokkaido island of japan. Biogeochemistry 2008, 88, 15–30. [Google Scholar] [CrossRef]
  38. Lovett, G.M.; Mitchell, M.J. Sugar maple and nitrogen cycling in the forests of eastern north america. Front. Ecol. Environ. 2004, 2, 81–88. [Google Scholar] [CrossRef]
  39. Risk, N.; Snider, D.; Wagner-Riddle, C. Mechanisms leading to enhanced soil nitrous oxide fluxes induced by freeze-thaw cycles. Can. J. Soil Sci. 2013, 93, 401–414. [Google Scholar] [CrossRef]
  40. Ahmad, Z.U.; Sakib, S.; Gang, D.D. Nonpoint Source Pollution. Water Environ. Res. 2016, 88, 1594–1619. [Google Scholar] [CrossRef]
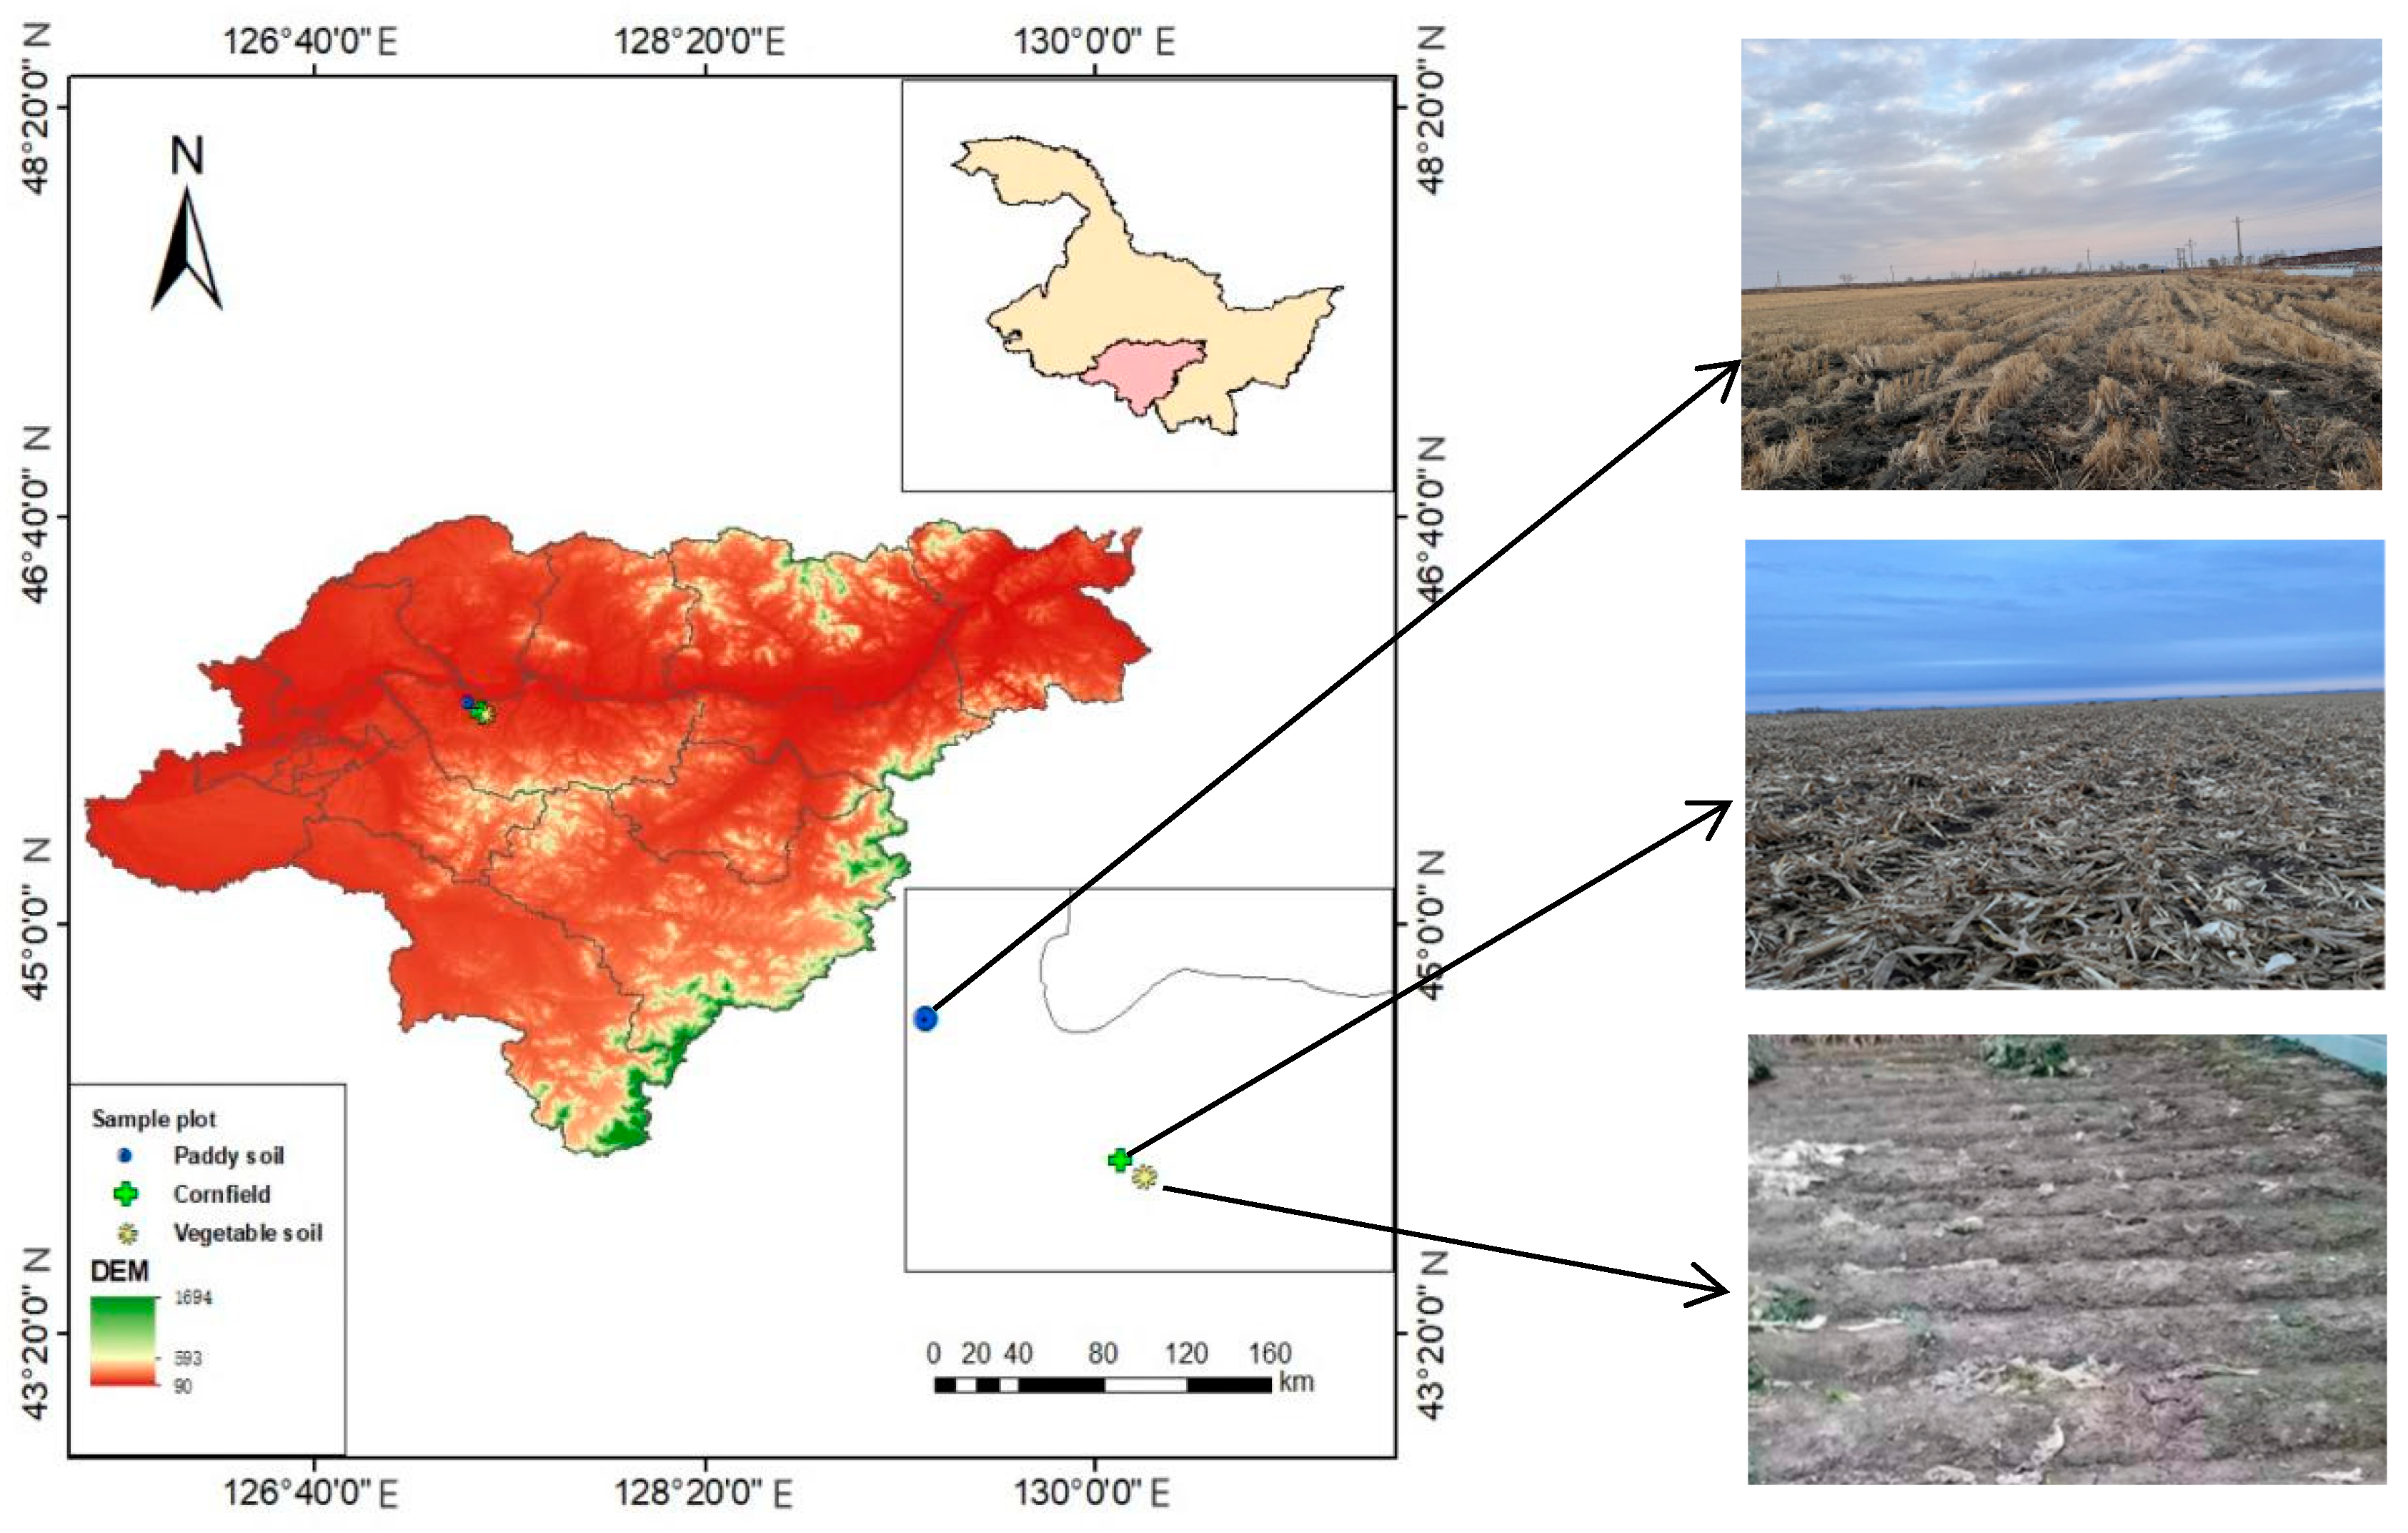
Figure 1. Overview of the research area in Harbin, Heilongjiang Province.
Water 16 02348 g001
Figure 2. Changes in available nitrogen content in corn soil under different freeze−thaw times.
Water 16 02348 g002
Figure 3. Changes in available nitrogen content in vegetable soil under different freezing and thawing times.
Water 16 02348 g003
Figure 4. Changes in available nitrogen content in paddy soil under different freeze−thaw times.
Water 16 02348 g004
Figure 5. Changes in available nitrogen content in corn soil under different freeze−thaw temperature differences.
Water 16 02348 g005
Figure 6. Changes in available nitrogen content in vegetable soil under different freeze−thaw temperature differences.
Water 16 02348 g006
Figure 7. Changes in available nitrogen content in paddy soil under different freeze−thaw temperature differences.
Water 16 02348 g007
Figure 8. Changes in available nitrogen content in corn soil under different freeze−thaw periods.
Water 16 02348 g008
Figure 9. Changes in available nitrogen content in vegetable soil under different freeze−thaw periods.
Water 16 02348 g009
Figure 10. Changes in available nitrogen content in paddy soil under different freeze−thaw periods.
Water 16 02348 g010
Table 1. Basic information of soil samples.
DatePlant Species Grown in SoilLongitudeLatitudeDepth (cm)Soil Density (g/cm3)Soil Moisture Content (%)Initial Available Nitrogen Content in Soil (mg/kg)
4 November 2023Paddy127°19′5″45°54′35″0–151.5426.15138.02
15–301.6729.07130.94
Vegetable127°23′7″45°51′48″0–150.6815.60450.19
15–300.7317.13424.07
Corn127°22′39″45°52′4″0–150.9613.00169.28
15–301.0215.09149.83
Table 2. Test conditions setting.
Processing FactorsLevels
Soil typesCorn soil, vegetable soil, paddy soil
Soil depths0–15 cm, 15–30 cm
Freeze−thaw timesUnfrozen and thawed CK
−20 °C freezing for 24 h, 15 °C thawing for 24 h
1 time, 3 times, 6 times, 8 times, 10 times, 13 times
Freeze−thaw temperature differencesUnfrozen and thawed CK
Freezing at −5 °C for 12 h, melting at 5 °C for 12 h; temperature difference 10 °C
Freezing at −10 °C for 12 h, melting at 10 °C for 12 h; temperature difference 20 °C
Freezing at −15 °C for 12 h, melting at 15 °C for 12 h; temperature difference 30 °C
Freeze−thaw periodsUnfrozen and thawed CK
Freezing at −20 °C, melting at 15 °C
SS, SL, LS, LL
0–12 h is short-term, 12 h–5 days is long-term
Soil water content of corn soil is 10% and 15%
Soil water content of vegetable soil is 15% and 20%
Soil water content of paddy soil is 25% and 30%
Disclaimer/Publisher’s Note: The statements, opinions and data contained in all publications are solely those of the individual author(s) and contributor(s) and not of MDPI and/or the editor(s). MDPI and/or the editor(s) disclaim responsibility for any injury to people or property resulting from any ideas, methods, instructions or products referred to in the content.