
Effects of Stocking Density of Filter-Feeding Fishes on Water Quality and Bacterial Community in Rice–Crayfish Polyculture System


Abstract
1. Introduction
2. Materials and Methods
2.1. Experiment Design and Management
2.2. Sample Collection and Analysis
2.3. DNA Extraction, PCR Amplification and Sequencing
2.4. Statistical Analysis
3. Results
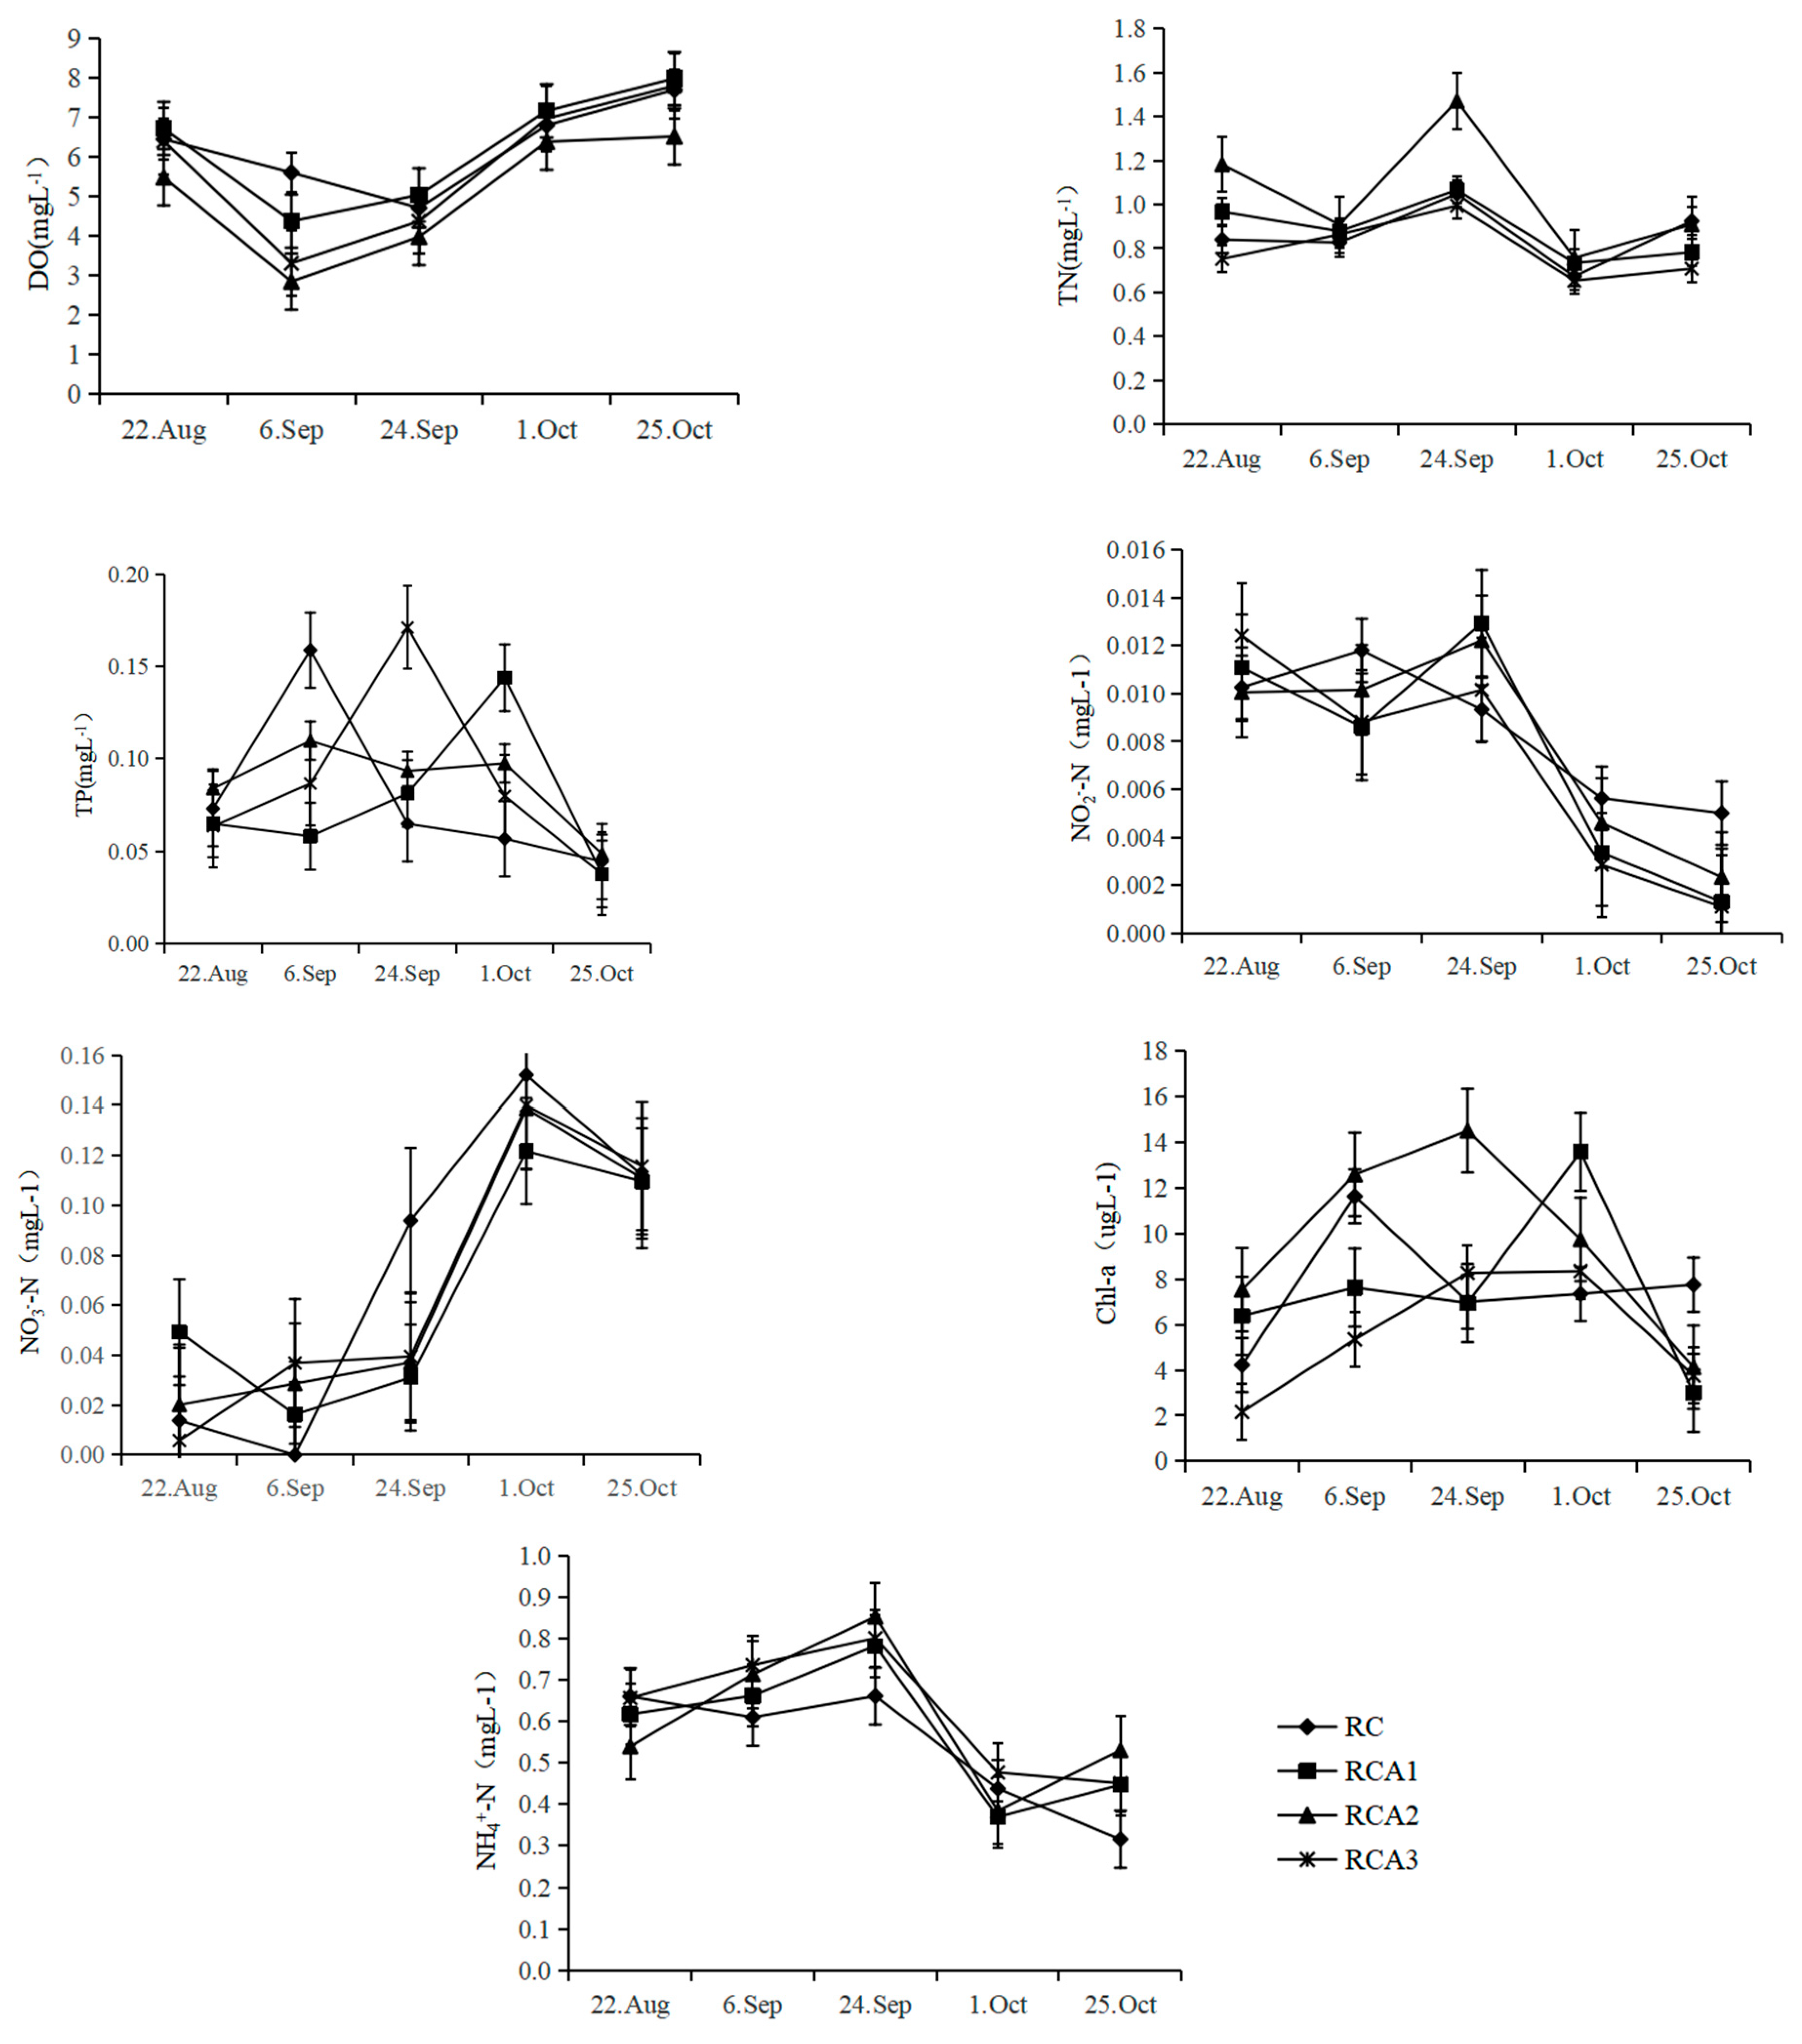
3.1. Water Quality
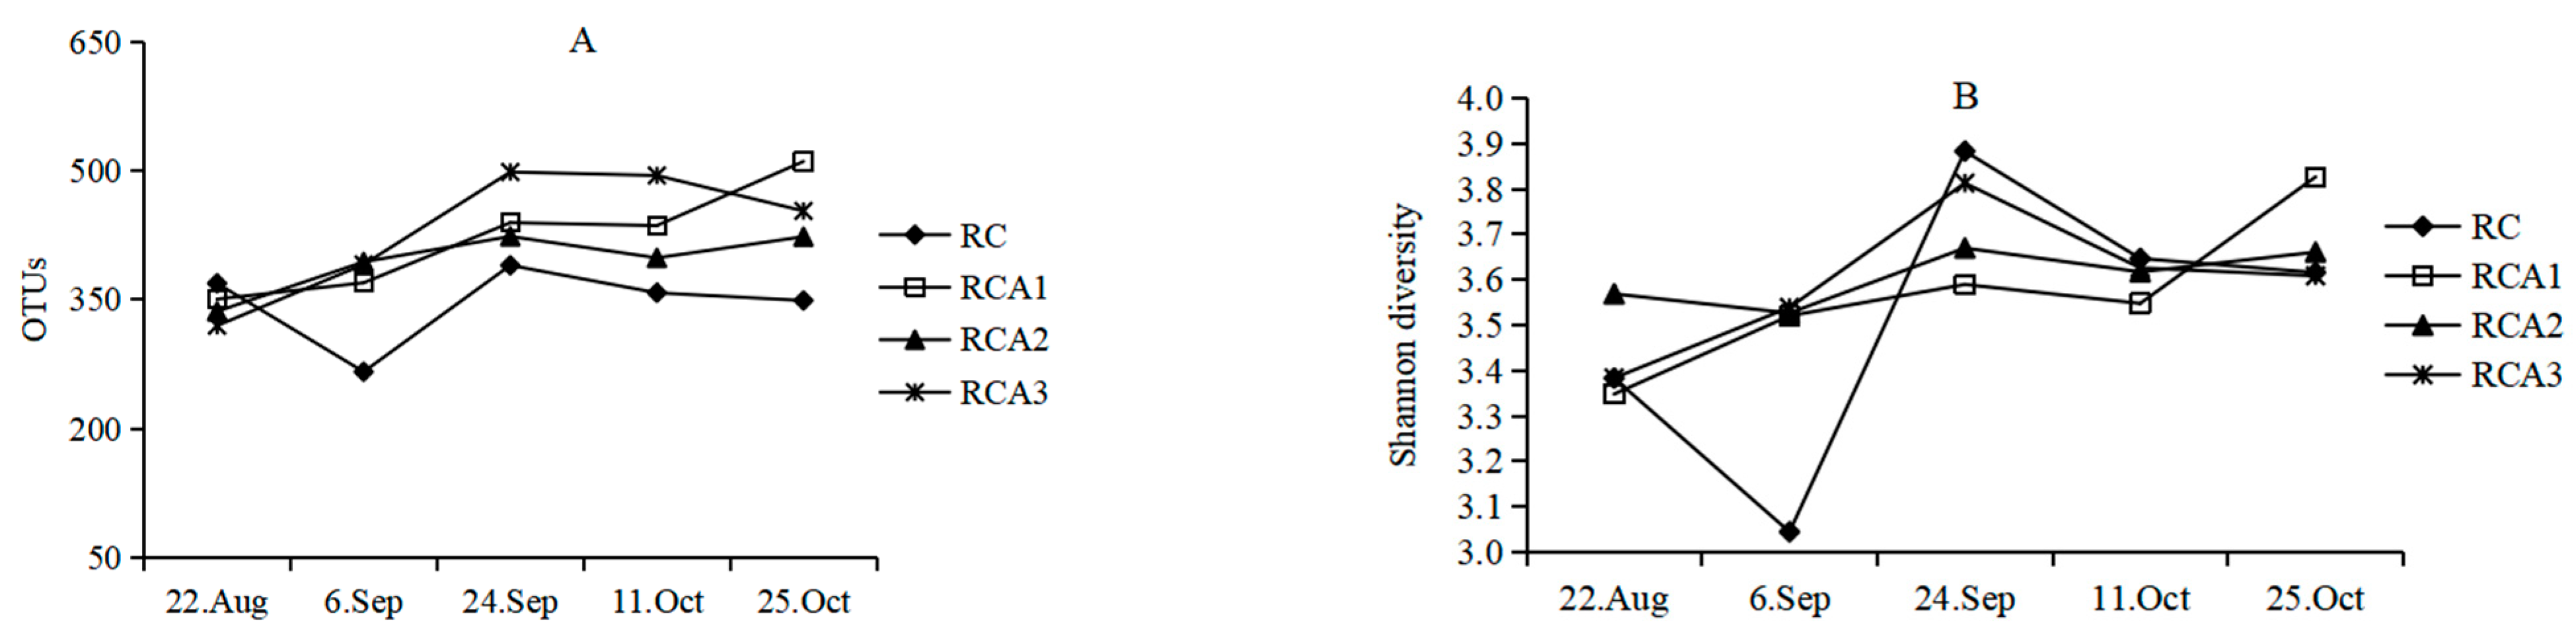
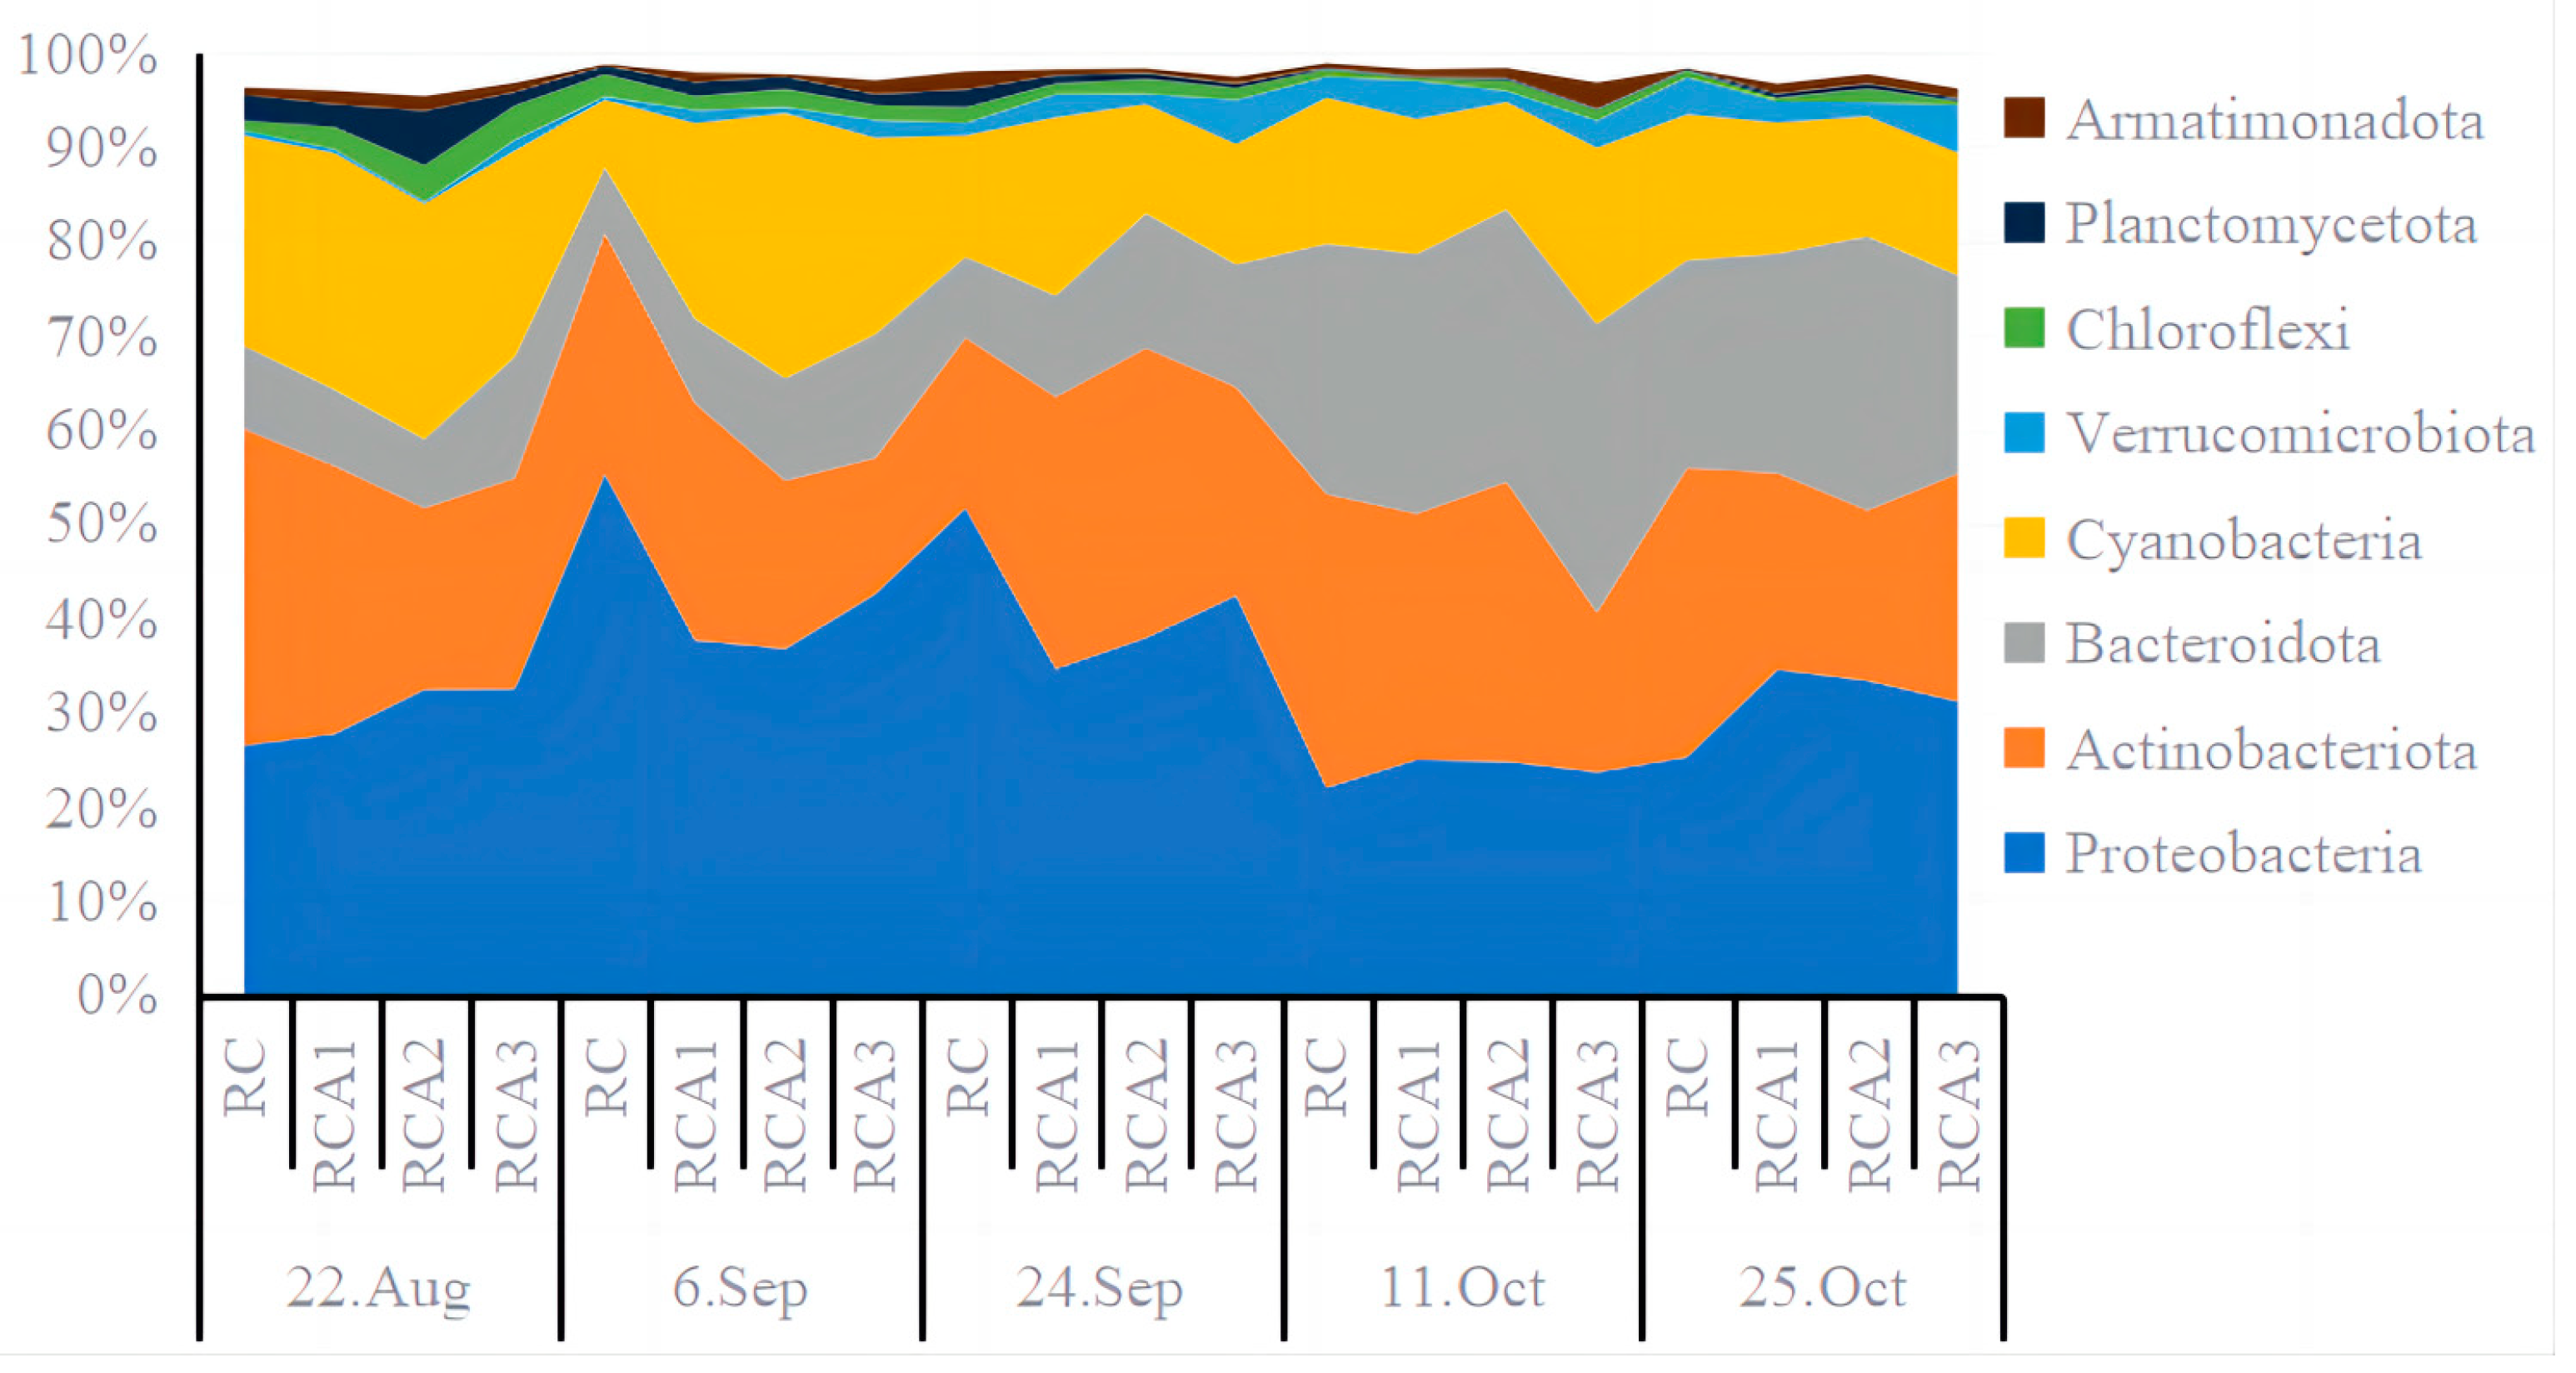
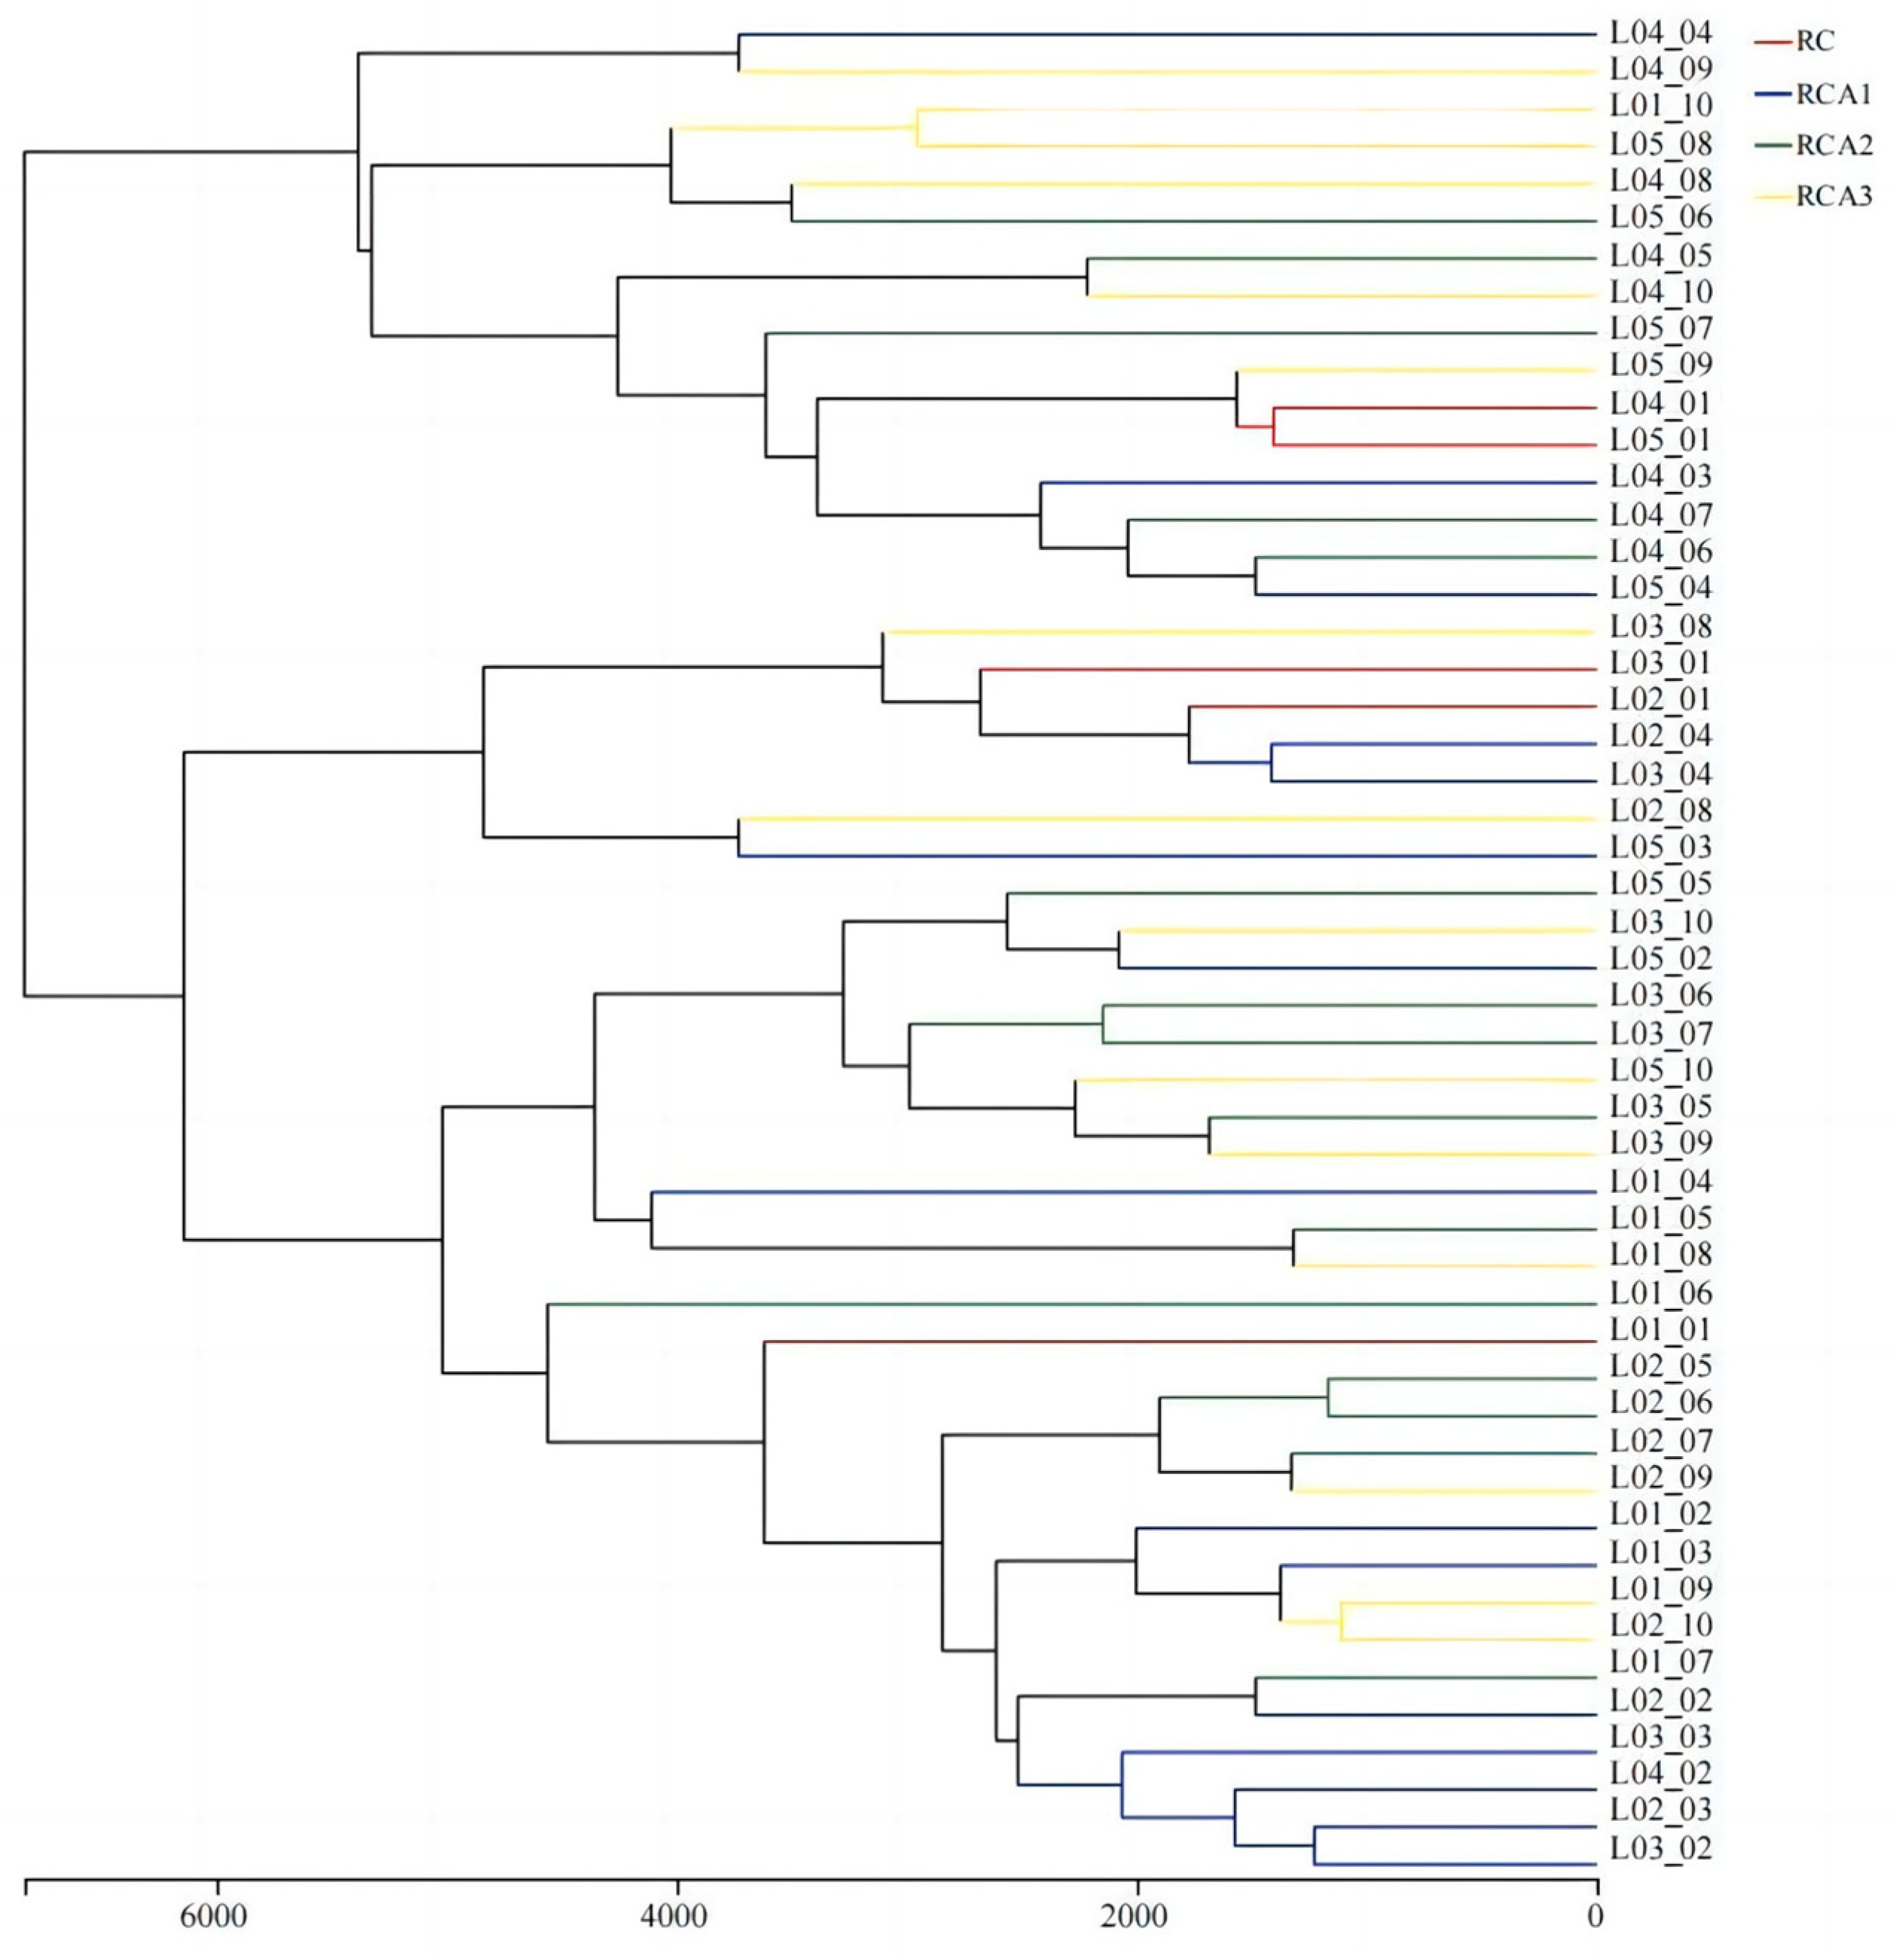
3.2. Bacterial Community Structures
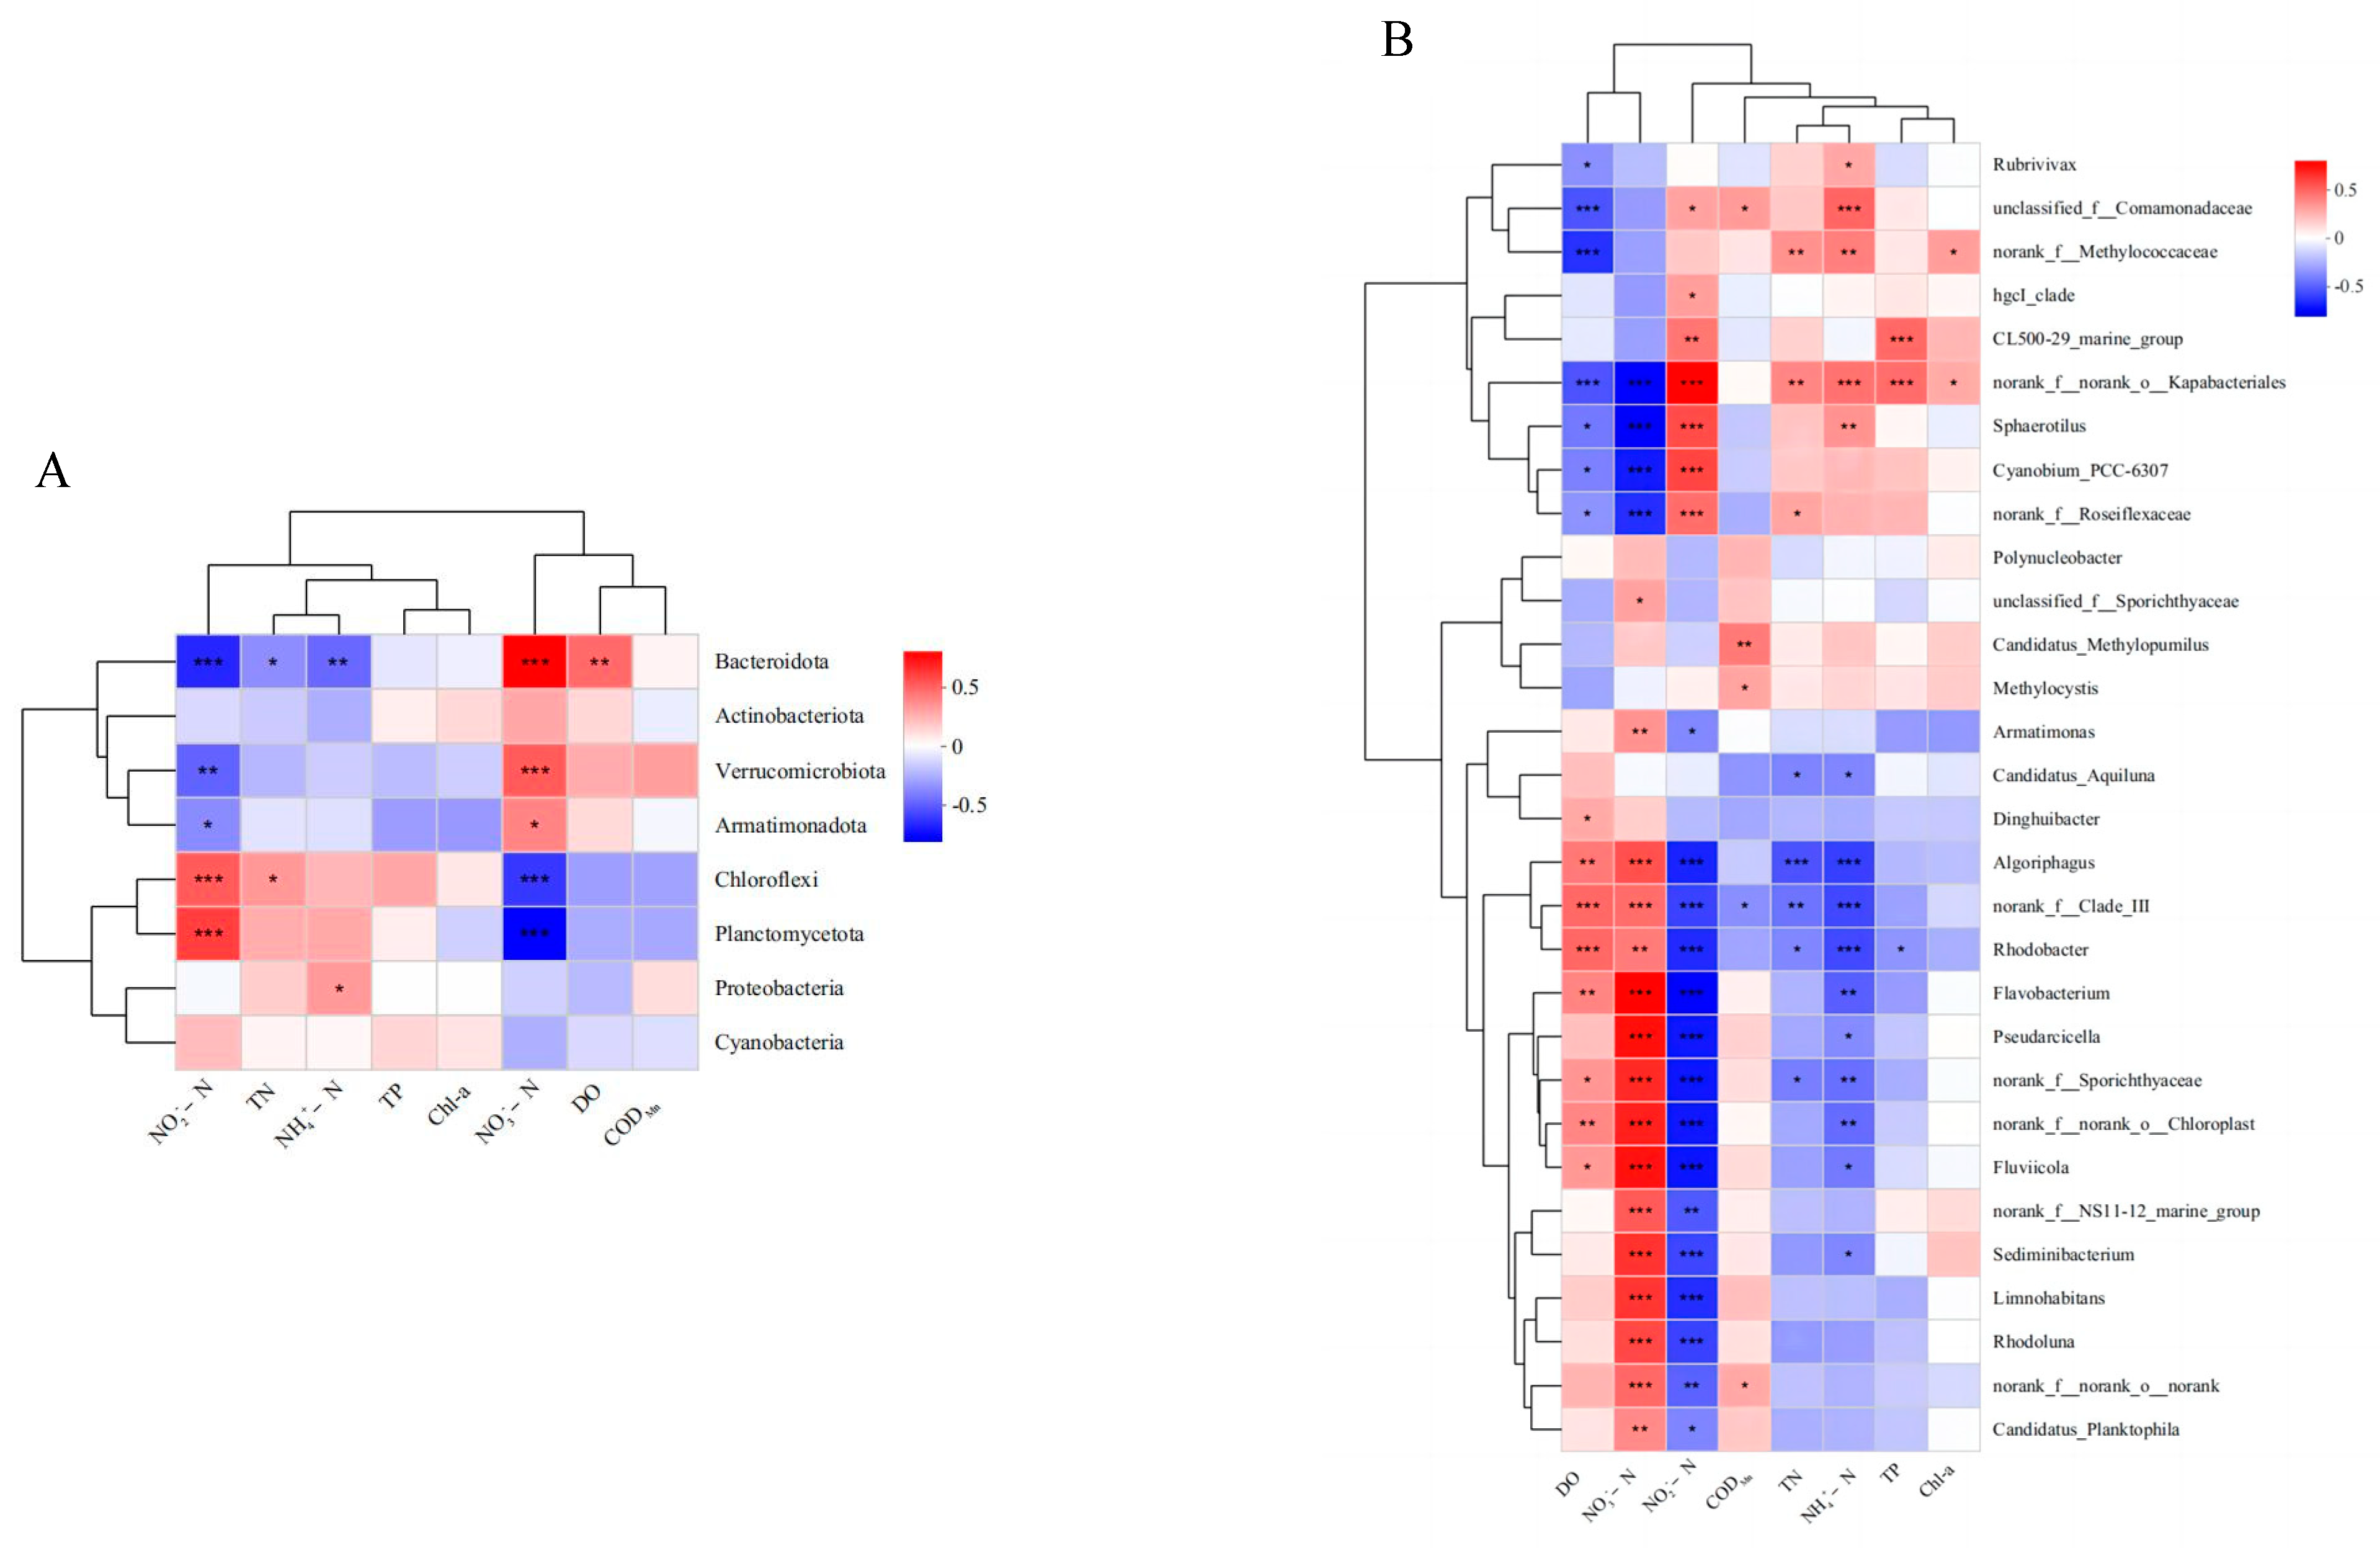
3.3. Correlation Analysis of Water Quality and Bacterial Community
4. Discussion
4.1. Effects of Bighead Carp of Different Densities Cocultured with Rice–Crayfish on Water Environmental Factors
4.2. Effects of Bighead Carp Coculture with Different Densities on Bacterial Community in Water
5. Conclusions
Author Contributions
Funding
Data Availability Statement
Conflicts of Interest
References
- Meng, S.L.; Hu, G.D.; Li, D.D.; Qiu, L.P.; Song, C.; Fan, L.M.; Zheng, Y.; Wu, W.; Chen, J.C.; Bing, X.W. Research Progress of Rice-Fish Integrated Farming. Agric. Biotechnol. 2018, 7, 129–135. [Google Scholar]
- NFTEC. Report for Chinese rice-fish coculture industry development (2018). China Fish. 2019, 1, 20–27. (In Chinese) [Google Scholar]
- NFTEC. Report for Chinese rice-fish cocultue industry development (2020). China Fish. 2020, 1, 13–19. (In Chinese) [Google Scholar]
- Yu, X.J.; Hao, X.J.; Yang, L.K.; Dang, Z.Q.; Wang, X.G.; Zhang, Y.H.; Zhang, X. Report for Chinese crayfish industry development (2023). China Fish. 2023, 7, 26–31. (In Chinese) [Google Scholar]
- Xing, Y.Z.; Cheng, L.; Zheng, L.; Wu, H.M.; Tan, Q.Y.; Wang, X.; Tian, Q. Brownification increases the abundance of microorganisms related to carbon and nitrogen cycling in shallow lakes. Environ. Res. 2024, 257. [Google Scholar] [CrossRef]
- Zhao, X.G.; Luo, H.; Liu, Q.G.; Zhao, L.J.; Cai, L.R.; Dai, L.L.; Zhang, Z. Influence of the cultured Odontobutis obscurus to the microbial community structure and diversity in rice-fish system. Freshw. Fish. 2017, 47, 8–14. (In Chinese) [Google Scholar]
- Zhang, Y.Y.; Zhao, L.J.; Li, H.; Zhu, W.J. Study on microbial diversity of water in rice-crayfish-eel coculture system. J. Henan Agric. Sci. 2022, 51, 139–146. [Google Scholar]
- Zhang, Y.Y.; Li, H.; Jia, T.; Peng, X.L.; Zhao, L.J. Effects of Integrated Aquaculture Model of Rice-Shrimp-Eel on Water Environment. Fish. Sci. 2022, 41, 860–867. [Google Scholar]
- Lin, Q.Q.; Chen, Q.H.; Peng, L.G.; Xiao, L.J.; Lei, L.M.; Jeppesen, E. Do bigheaded carp act as a phosphorus source for phytoplankton in (sub) tropical Chinese reservoirs? Water Res. 2020, 180, 115841. [Google Scholar] [CrossRef] [PubMed]
- Xie, P.; Liu, J.K. Practical success of biomanipulation using filter-feeding fish to control cyanobacteria blooms: A synthesis of decades of research and application in a subtropical hypereutrophic lake. Sci. World J. 2001, 1, 337–356. [Google Scholar] [CrossRef]
- Guo, L.; Wang, Q.; Xie, P.; Tao, M.; Zhang, J.; Niu, Y.; Ma, Z. A nonclassical biomanipulation experiment in Gonghu Bay of Lake Taihu: Control of Microcystis blooms using silver and bighead carp. Aquacult. Res. 2015, 46, 2211–2224. [Google Scholar] [CrossRef]
- Zhang, Z.; Shi, Y.; Zhang, J.; Liu, Q. Experimental observation on the effects of bighead carp (Hypophthalmichthys nobilis) on the plankton and water quality in ponds. Environ. Sci. Pollut. Res. 2022, 29, 56658–56675. [Google Scholar] [CrossRef] [PubMed]
- Kou, X.M.; Hang, G.M.; Wu, L.M.; Wang, S.H.; Zhang, J.J.; Tang, H.J.; Yang, X.X.; Wang, S.G.; Zhang, M.M.; Xu, R.; et al. Effects of crayfish density on rice growth, crayfish growth, and nitrogen and phosphorus utilization in the rice-crayfish culture. J. Yangzhou Univ. (Agric. Life Sci. Ed.) 2020, 41, 22–27. [Google Scholar]
- Zeng, X.Y.; Li, S.W.; Leng, Y.; Kang, X.H. Structural and functional responses of bacterial and fungal communities to multiple heavy metal exposure in arid loess. Sci. Total Environ. 2020, 723, 138081. [Google Scholar] [CrossRef]
- Tang, Y.T.; Zhao, L.J.; Cheng, Y.X.; Yang, Y.; Sun, Y.F.; Liu, Q.G. Control of cyanobacterial blooms in different polyculture patterns of filter feeders and effects of these patterns on water quality and microbial community in aquacultural ponds. Aquaculture 2021, 542, 736913. [Google Scholar] [CrossRef]
- Wu, R.S.; Zhou, B.S.; Randall, D.J.; Woo, N.Y.; Lam, P.K. Aquatic hypoxia is an endocrine disruptor and impairs fish reproduction. Environ. Sci. Technol. 2003, 37, 1137–1141. [Google Scholar] [CrossRef] [PubMed]
- Lopes, R.B.; Ribeiro, J.S.; Neves, S.C.B.; Lameira, L.F.; Moura, L.S.; Santana, M.B.; Taube, P.S. Dissolved oxygen, organic matter and nutrients in fish systems combined with bio-addition of friendly microorganisms. Res. Soc. Dev. 2022, 11, e26111427382. [Google Scholar] [CrossRef]
- Chen, J.; Xu, H.; Zhan, X.; Xu, D.; Zhu, G.W.; Zhu, M.Y.; Ji, P.F.; Kang, L.J. Influence of Nutrient Pulse Input on Nitrogen and Phosphorus Concentrations and Algal Growth in the Sediment-Water System of Lake Taihu. Environ. Sci. 2020, 41, 2671–2678. [Google Scholar]
- Liu, J.H.; Li, Y.; Shen, D.F.; Qiao, R.T.; Wang, H.Z. Relationship of Biogenic Substances in Sediments with Phytoplankton and Submerged Macrophytes in Shallow Lakes. J. Hydrol. 2024, 45, 19–27. [Google Scholar]
- Nie, M.; Li, Z.L. Bioprocess of nitrite accumulation in water-a review. Chin. J. Biotechnol. 2020, 36, 1493–1503. [Google Scholar]
- Wang, X.D.; Li, E.; Xu, C.; Qin, J.G.; Wang, S.F.; Chen, X.F.; Cai, Y.; Chen, K.; Gan, L.; Yu, N.; et al. Growth, body composition, ammonia tolerance and hepatopancreas histology of white shrimp Litopenaeusvannameifed diets containing different carbohydrate sources at low salinity. Aquacult. Res. 2014, 47, 1932–1943. [Google Scholar] [CrossRef]
- Qin, F.; Shen, T.; Yang, H.X.; Qian, J.C.; Zou, D.; Li, J.L.; Liu, H.; Zhang, Y.Y.; Song, X.H. Dietary nano cerium oxide promotes growth, relieves ammonia nitrogen stress, and improves immunity in crab (Eriocheir sinensis). Fish Shellfish. Immunol. 2019, 92, 367–376. [Google Scholar] [CrossRef] [PubMed]
- Chen, J.Z.; Zang, X.L.; Meng, S.L.; Qu, J.H.; Hu, G.D.; Song, C.; Fan, L.M.; Qiu, L.P. Effect of nitrite nitrogen stress on the activities of nonspecific immune enzymes in serum of tilapia (gift oreochromisniloticus). Ecol. Environ. Sci. 2012, 5, 109–113. (In Chinese) [Google Scholar]
- Silva, F.; Lima, F.; Vale, D.; Mvce, S. High levels of total ammonia nitrogen as NH4+ are stressful and harmful to the growth of nile tilapia juveniles. Acta Sci. Biol. Sci. 2013, 35, 475–481. [Google Scholar] [CrossRef]
- Dodds, W.K.; Carney, E.; Angelo, R.T. Determining Ecoregional Reference Conditions for Nutrients, Secchi Depth and Chlorophyll a in Kansas Lakes and Reservoirs. Lake Reserv. Manag. 2006, 22, 151–159. [Google Scholar] [CrossRef]
- Howarth, R.W.; Marino, R. Nitrogen as the limiting nutrient for eutrophication in coastal marine ecosystems: Evolving views over three decades. Limnol. Oceanogr. 2006, 51, 364–376. [Google Scholar] [CrossRef]
- Zhang, X.; Xie, P.; Huang, X.P. A review of nontraditional biomanipulation. Sci. World J. 2008, 8, 1184–1196. [Google Scholar] [CrossRef] [PubMed]
- Liang, Z.; Soranno, P.A.; Wagner, T. The role of phosphorus and nitrogen on chlorophyll a: Evidence from hundreds of lakes. Water Res. 2020, 185, 116236. [Google Scholar] [CrossRef] [PubMed]
- Hui, C.; Li, Y.; Zhang, W.; Zhang, C.; Niu, L.; Wang, L.; Zhang, H. Modelling structure and dynamics of microbial community in aquatic ecosystems: The importance of hydrodynamic processes. J. Hydrol. 2022, 605, 598–603. [Google Scholar] [CrossRef]
- Caporaso, J.G.; Lauber, C.L.; Walters, W.A.; Lyons, D.B.; Huntley, J.; Fierer, N.; Owens, S.M.; Betley, J.; Fraser, L.; Bauer, M.; et al. Ultra-high-throughput microbial community analysis on the illumine hiseq and miseq platforms. ISME J. 2012, 6, 1621–1624. [Google Scholar] [CrossRef]
- Dang, H.Y.; Lovell, C.R. Microbial surface colonization and biofilm development in marine environments. Microbiol. Mol. Biol. Rev. 2016, 80, 91–138. [Google Scholar] [CrossRef]
- Han, P.P.; Shen, S.G.; Jia, S.R.; Wang, H.Y.; Zhong, C.; Tan, Z.L.; Lv, H.X. Comparison of bacterial community structures of terrestrial cyanobacterium Nostoc flflagelliforme in three different regions of China using PCR-DGGE analysis. World J. Microbiol. Biotechnol. 2015, 31, 1061–1069. [Google Scholar] [CrossRef] [PubMed]
- Mullowney, M.W.; Hwang, C.H.; Newsome, A.G.; Wei, X.; Tanouye, U.; Wan, B. Diazaanthracene antibiotics from a freshwater-derived actinomycete with selective antibacterial activity toward Mycobacterium tuberculosis. ACS Infect. Dis. 2015, 1, 168–174. [Google Scholar] [CrossRef] [PubMed]
- Sun, W.; Zhang, F.; He, L.; Loganathan, K.; Li, Z. Actinomycetes from the South China Sea sponges: Isolation, diversity, and potential for aromatic polyketides discovery. Front. Microbiol. 2015, 6, 1048. [Google Scholar] [CrossRef] [PubMed]
- Kenza, B.; Abdoulaye, S.; Ilham, M.; Karim, L.; Yedir, O.; Mohamed, H.; Lamfeddal, K. Multifunctional role of Actinobacteria in agricultural production sustainability: A review. Microbiol. Res. 2022, 261, 127059. [Google Scholar] [CrossRef]
- Kaisa, K.; Jenni, H.; Lars, P. Spatially differing bacterial communities in water columns of the northern Baltic Sea. FEMS Microbiol. Ecol. 2011, 1, 99–110. [Google Scholar]
- Gerber, N.N.; Lechevalier, H.A. Geosmin, an earthly-smelling substance isolated from actinomycetes. Appl. Microbiol. 1965, 13, 935–938. [Google Scholar] [CrossRef] [PubMed]
- Song, X.N.; Zhang, J.L.; Peng, C.R.; Li, D.H. Replacing nitrogen fertilizer with nitrogen-fixing cyanobacteria reduced nitrogen leaching in red soil paddy fields. Agric. Ecosyst. Environ. 2021, 312, 107320. [Google Scholar] [CrossRef]
- Liang, X.; Zhu, Y.; Liu, H.Y.; Xie, Z.M.; Li, G.B.; Li, D.H.; Liang, Y.T.; Peng, C.R. Nitrogen-fixing cyanobacteria enhance microbial carbon utilization by modulating the microbial community composition in paddy soils of the Mollisols region. Sci. Total Environ. 2024, 925, 172609. [Google Scholar] [CrossRef]
- Zeglin, L.H. Stream microbial diversity in response to environmental changes: Review and synthesis of existing research. Front. Microbiol. 2015, 6, 454. [Google Scholar] [CrossRef] [PubMed]
- Fernandez, D.R.; Emiliano, B.H. Simulating Microbial Functional Diversity Dynamics in Agricultural Soils: An Individual Based Modeling Approach. Adv. Biosci. Biotechnol. 2022, 13, 159–174. [Google Scholar] [CrossRef]


| Groups | Area | Procambarus clarkii | Aristichthys nobilis | ||
|---|---|---|---|---|---|
| Number Density | Weight Density | Number Density | Weight Density | ||
| m2 | ind./m2 | g/m2 | ind./m2 | g/m2 | |
| RC (Rice–Crayfish) | 200 | 5 | 12.53 ± 0.03 | - | - |
| RCA1 (Rice–Crayfish–Aristichthys nobilis 1) | 200 | 5 | 12.54 ± 0.02 | 2.5 | 18.75 ± 0.89 |
| RCA2 (Rice–Crayfish–Aristichthys nobilis 2) | 200 | 5 | 12.52 ± 0.04 | 5 | 37.50 ± 1.11 |
| RCA3 (Rice–Crayfish–Aristichthys nobilis 3) | 200 | 5 | 12.56 ± 0.02 | 7.5 | 56.25 ± 2.32 |
| Groups | Simpson Index | Ace Index | Chao Index | Pielou Index | Phyla | Class | Order | Family | Genus | Species |
|---|---|---|---|---|---|---|---|---|---|---|
| RC | 0.075 ± 0.008 | 546.25 ± 66.01 | 491.21 ± 56.11 | 0.66 ± 0.03 | 35 | 92 | 218 | 361 | 623 | 983 |
| RCA1 | 0.065 ± 0.004 | 633.16 ± 79.45 | 579.83 ± 92.43 | 0.65 ± 0.02 | 45 | 132 | 303 | 502 | 915 | 1595 |
| RCA2 | 0.069 ± 0.005 | 597.56 ± 77.91 | 537.97 ± 71.66 | 0.66 ± 0.04 | 44 | 128 | 294 | 488 | 877 | 1522 |
| RCA3 | 0.074 ± 0.007 | 585.47 ± 72.24 | 566.44 ± 95.67 | 0.64 ± 0.02 | 43 | 130 | 302 | 496 | 912 | 1594 |
Disclaimer/Publisher’s Note: The statements, opinions and data contained in all publications are solely those of the individual author(s) and contributor(s) and not of MDPI and/or the editor(s). MDPI and/or the editor(s) disclaim responsibility for any injury to people or property resulting from any ideas, methods, instructions or products referred to in the content. |
© 2024 by the authors. Licensee MDPI, Basel, Switzerland. This article is an open access article distributed under the terms and conditions of the Creative Commons Attribution (CC BY) license (https://creativecommons.org/licenses/by/4.0/).
Share and Cite
Zhang, Y.; Zhao, L.; Duan, J.; Tang, Y.; Lv, J. Effects of Stocking Density of Filter-Feeding Fishes on Water Quality and Bacterial Community in Rice–Crayfish Polyculture System. Water 2024, 16, 2296. https://doi.org/10.3390/w16162296
Zhang Y, Zhao L, Duan J, Tang Y, Lv J. Effects of Stocking Density of Filter-Feeding Fishes on Water Quality and Bacterial Community in Rice–Crayfish Polyculture System. Water. 2024; 16(16):2296. https://doi.org/10.3390/w16162296
Chicago/Turabian StyleZhang, Yuanyuan, Liangjie Zhao, Jiaoyang Duan, Yongtao Tang, and Jun Lv. 2024. "Effects of Stocking Density of Filter-Feeding Fishes on Water Quality and Bacterial Community in Rice–Crayfish Polyculture System" Water 16, no. 16: 2296. https://doi.org/10.3390/w16162296
APA StyleZhang, Y., Zhao, L., Duan, J., Tang, Y., & Lv, J. (2024). Effects of Stocking Density of Filter-Feeding Fishes on Water Quality and Bacterial Community in Rice–Crayfish Polyculture System. Water, 16(16), 2296. https://doi.org/10.3390/w16162296