Abstract
Based on field hydro-meteorological observations and sediment sampling data, this study analyzes sediment transport under normal conditions in the Fanshi offshore wind farm project area in Yangjiang, China. It was found that sediment transport in the engineering sea area is relatively stable, and seabed sediments are not easily mobilized. By building a tidal current–sediment mathematical model, the impact of wind farm construction on the erosion and deposition environment in the surrounding sea areas was studied. It was found that areas with significant accumulation are mainly located near the pile foundations of wind turbines. Furthermore, considering ocean dynamics, geological conditions, and wave–current interactions, different local erosion empirical formulas were used to calculate local erosion depth and range. The results show that Han Haiqian’s formula and the HEC-18 formula, which consider wave velocity, are very close and more suitable for the actual conditions of this project. As turbine pile diameters increase, local scour depths and ranges also increase. This study preliminarily analyzes the basic scour characteristics of deep-sea wind turbines off the western coast of Guangdong Province, offering important design parameters for the construction of this project, and also providing a systematic and scientific method for studying local scour at turbine pile foundations. This has great reference value for deep-sea wind farm construction projects.
1. Introduction
With the continuous development of human society, the pressure on traditional energy sources is becoming increasingly severe. Offshore wind power and other sustainable clean energy sources are gradually becoming viable alternatives. However, the construction of offshore wind farms faces a series of engineering challenges, particularly under the influence of complex marine hydrological and meteorological conditions. Scour holes may appear around the pile foundations of wind turbines, leading to a decrease in overall stiffness and storm resistance capacity, which can cause foundation structure tilting and affect the stability of wind turbine foundations [1,2]. In response, researchers have proposed multiple solutions for protecting the foundations of offshore wind turbines from scour, and have developed design principles and evaluation methods for the effectiveness of scour protection measures [3].
The erosion of offshore wind turbine foundations involves large-scale erosion caused by bed morphological changes and the local erosion of pile foundations caused by sea currents and wave-induced vortex structures. Large-scale erosion is mainly caused by extreme sea conditions, such as storm tides and giant waves, which result in bed deformation. Local erosion of pile foundations is primarily caused by sea currents and wave-induced vortex structures, generating flow structures around the pile foundations, including downward water flow in front of the pile, surface surges in front of the pile, and large-scale vortex systems. Under this flow structure, when the flow velocity is lower than the bed sediment mobilization velocity, there is no sediment movement on the bed surface, and the pile foundation erosion pit has no upstream sediment supply, known as clear water erosion. When the flow velocity exceeds the mobilization velocity, the bed sediment is in motion, and sediment from upstream falls into the scour hole, known as bedload erosion [4,5]. When the sediment supply rate and scour rate in the erosion pit are nearly equal, this condition is called equilibrium erosion.
Local scour around pile columns is generally divided into large-diameter pile column scour and small-diameter pile column scour [6]. The distinction between large and small diameters is usually based on the ratio of pile column width to wavelength (D/L), with a value greater than 0.15 considered large diameter and less considered small diameter. The scour mechanisms of the two are fundamentally different. Large-diameter pile column local scour is closely related to wave reflection, while small-diameter wind turbine pile columns are surrounded by large wakes and horseshoe vortices, which can cause local unbalanced sediment transport over a certain period, resulting in severe scour around the pile foundation.
The maximum scour depth of local scour on piles is a crucial parameter for pile design. Initially, research on local scour primarily focused on inland bridge piers. However, with the construction of estuary and bay bridges, researchers have also directed their attention towards pier scour under tidal action. Furthermore, the development of offshore wind power has emerged as a new focal point in studying scour on wind turbine foundation piles subjected to combined wave and current actions. Presently, investigations into local scour of wind turbine foundation piles predominantly rely on field observation data [7,8,9], physical model tests [10,11,12,13,14,15], empirical formulas [16,17], and numerical simulations [18,19,20,21,22]. In recent years, some scholars have begun utilizing machine learning and artificial intelligence techniques to predict local scouring in pile foundations [23].
However, local scouring of pile foundations is a complex problem involving multiple factors such as hydrodynamics, sediment characteristics, and pile diameter [6]. Existing empirical formulas based on experimental data have limitations in their usage conditions. These limitations primarily arise from two aspects: (1) there is a greater abundance of research results on local scouring of pile foundations under river dynamics (unidirectional flow), while fewer studies have been conducted on the effects of coastal marine dynamics (tidal currents and waves) [20]; (2) some studies only consider the influence of tidal currents on the depth of local scouring while neglecting the effect of waves. When wave action cannot be ignored, significant discrepancies exist between calculated results and measured values [24]. Therefore, studying local scouring of offshore wind farm pile foundations necessitates combining field observation data with various methods such as empirical formula calculations and numerical simulations.
This article is based on research conducted at the Yangjiang Fanshi offshore wind farm project in western Guangdong. It utilizes field hydrological and meteorological observations (including tidal level, sea current, suspended sediment, and waves) and sediment sampling data to analyze sediment transport status under normal conditions in the project sea area. Critical transition water depth and sediment initiation flow velocity calculation formulas are employed for this analysis. Additionally, a tidal flow–sediment mathematical model is used to calculate large-scale seabed erosion caused by engineering construction. Furthermore, a local erosion empirical formula is applied to compute the local erosion depth of pile foundations and determine the range of erosion pits to investigate the impact of the hydrodynamic environment on offshore wind turbines. This study aims to provide a systematic and scientifically guided approach for studying the local erosion of pile foundations for wind turbine units.
In contrast to previous studies that primarily focused on local scour at pile foundations under extreme weather conditions, this study will comprehensively analyze both large-scale scour and local scour states of pile foundations under normal and extreme weather conditions using a more systematic and comprehensive research approach. The enhanced formulas proposed by Han Haijian and the HEC-18 formula will expand the applicability range of empirical formulas for local scour, better addressing the complex sea conditions encountered in actual engineering construction.
2. Materials and Methods
2.1. Fundamental Data
The Yangjiang Fanshi Offshore Wind Farm Project is located in the southern sea area of Nanpeng Island, Yangjiang City. It boasts a total installed capacity of 2000 MW and spans an approximate area of 320 km2, with water depths ranging from 38 m to 53 m. The wind farm includes a 220 kV offshore booster station and an onshore control center, situated approximately 55 km from Hailing Island. From September to October 2018, comprehensive tidal hydrological observations were conducted near the project site by the South China Sea Survey Technology Center of the State Oceanic Administration. These observations included measurements of tide level, current velocity, current direction, and suspended sediment concentration, as well as sediment sampling. Additionally, annual monitoring was carried out from 1 March 2019 to 29 February 2020, to record tide levels, ocean currents, and waves. The acquired fundamental data provide reliable support for this study. During the data collection process, tidal levels were monitored using an RBR duo-type water level meter at 10 min intervals, while continuous measurements of current were taken using a SeaGuard RCM-type current meter with a sampling interval of 1 min. Sediment concentration and grain size were analyzed using a Malvern Mastersizer 3000 laser particle analyzer. The vertical average of sediment concentration and grain size was determined by collecting surface, mid-depth, and bottom water samples every hour. Wave parameters such as significant wave height (Hs), maximum wave height (Hmax), and spectral peak period (Tp) were obtained using a 400 kHz AWAC manufactured by Nortek at hourly intervals. The collected data were comprehensive and reliable, providing strong support for the study.
2.2. Critical Transition Water Depth under Wave-Induced Conditions
The critical water depth for wave-induced sediment transport on the seabed is determined by factors such as wave height, period, and the particle size of the bottom sediment. To calculate the critical water depths for surface displacement (h1) and total displacement (h2) of seabed sediments under wave action, Sato’s formula [25,26] can be employed. The formula for determining the critical water depth for surface transport is as follows:
Formula for critical depth of surface displacement:
Formula for total displacement of critical depth:
h1 and h2 represent the critical water depth of surface and total migration, respectively, H0 and L0 are the wave height and wavelength (m) of deep water, D50 is the median grain size (m) of sediment, and H and L represent the wave height and wavelength (m) of h1 and h2, respectively.
2.3. Initiating Flow Velocity under Wave Action
To investigate local scour, the first step is to determine the critical velocity required for sediment initiation. When the flow velocity surpasses this critical threshold and the seabed consists of loose sediments, it leads to localized erosion around pile foundations. The methods proposed by Wang Shangyi from Tianjin University, Zhang Ruijin from the Wuhan Institute of Water Conservancy and Electric Power, and Dou Guoren from the Nanjing Hydraulic Research Institute are utilized for calculating and cross-validating this critical velocity.
(1). Wang Shangyi’s formula (Tianjin University) [27]
Here, is the flow velocity at water depth , is the median particle size, hc is the water depth at sediment initiation, , is the porosity of the bed surface, and is the porosity of the limit sediment concentration, .
(2). Zhang Rui-jin formula (Wuhan Institute of Water Conservancy and Electric Power) [27]
Here, is the average vertical velocity, h is the water depth, is the median diameter, and and denote the density of sediment and water, respectively. At depth hc, the velocity is as follows:
In the formula, is an exponent of 0.14.
(3). Dou Guoren Formula (Nanjing Hydraulic Research Institute) [28]
where is the water depth, is the median diameter, is the gravitational acceleration, is the bed roughness, and is the bed roughness; when ≤ 0.5 mm, = 0.5 mm. When > 0.5 mm, = . The thickness of the viscous underlayer δ = 0.213 × 10⁻⁴ cm on a smooth bed surface, and the coefficient of adhesion .
The velocity at depth is as follows:
In the formula, is the calibration parameter; .
2.4. Hydrodynamic and Sediment Model
The hydrodynamic model of tidal currents is formulated by solving the continuity equation and water flow momentum governing equation. The continuity equation governing water flow is derived from the principle of mass conservation, which posits that matter cannot be created or destroyed within a closed system. Simply put, the inflow of water into a control volume equals its outflow. The momentum equation for water flow delineates the relationship between changes in water flow and the external forces acting upon it, applying the principle of momentum conservation to natural water flow motion.
The continuity equation of fluid flow:
The horizontal momentum equations in the X and Y directions are as follows:
In the aforementioned equations, t represents time; x and y represent Cartesian coordinates; denotes total water depth; represents water level; signifies still water depth; u and v denote velocity components in the x and y directions, respectively; f is the coefficient for Coriolis force; , is Earth’s rotational angular velocity; corresponds to local latitude; g stands for gravitational acceleration; denotes local atmospheric pressure; represents water density; and , , are radiative stress components. S is the source item. denotes flow velocity from the source. Shear stress encompasses viscous stress, eddy viscosity stress, and convective gradient stress. Surface wind stress is denoted by and . Riverbed shear stress is represented by and .
The hydrodynamic model employs the MIKE 21 module for computation. This module discretizes Equations (8)–(10) utilizing the finite volume method. The model’s initial conditions are configured as a steady flow field, and the shore boundary is set with a non-penetrable sliding condition. The open boundary in the offshore area is influenced by the astronomical tide forecasted by the global tidal model (FES2012). With a resolution of (1/16)°, the global tidal model (FES2012) encompasses eight principal constituents, M2, S2, K1, O1, N2, P1, K2, and Q1, along with three shallow water constituents, M4, M6, and MS4, that essentially capture the true astronomical tide process in deep offshore waters.
The construction project has modified the local hydrodynamic conditions and sediment distribution, resulting in alterations to the seabed morphology. If the seabed was initially in a state of equilibrium prior to project implementation, the reduction in water velocity caused by certain areas of the project would diminish its sediment transport capacity, leading to sediment deposition. Based on this principle, it is feasible to estimate both the thickness of sedimentation and final seabed topography following project completion. The forecast for the post-construction seabed morphology is determined using a semi-empirical and semi-theoretical formula that considers changes in flow field [29].
While ∆t→∞, the magnitude of the ultimate equilibrium state of scouring and silting of the seabed can be obtained.
Here
In the formula, , , , and are the scour and deposition amplitude, dry bulk density of deposited sediment, sediment deposition probability and suspended sediment deposition velocity, respectively and , respectively, calculate the water depth before and after the implementation of the project and , respectively, calculate the flow velocity before and after the project is implemented; and are the sediment concentration of water flow before and after the implementation of the project, respectively; and is the sediment carrying capacity of the flow before the implementation of the project. According to the hydrologic test, the average sediment concentration is around 0.0024 kg/, and the median suspended sediment diameter d50 is 0.023 mm. The sedimentation rate is 0.67, the dry bulk density is calculated by , and the suspended sediment velocity is calculated by , where is 2.65.
2.5. Calculation of Local Erosion under the Combined Action of Wave and Current Flow
The suspension of sediments on the seabed is intensified by wave action and, when combined with a slow and constant water flow, it significantly enhances sediment transport capacity compared to wave action alone. However, the erosion mechanism resulting from wave–current coupling remains unclear [30,31]. Currently, most studies on local erosion under wave–current coupling still rely on empirical formulas. Among these formulas, Han Haiqian’s formula [32] and Wang Runkai’s formula [33,34] provide calculation conditions that are more consistent with actual engineering situations. Additionally, the local erosion formula for riverbed bridge abutments in the Hydraulic Engineering Circular No. 18 (HEC-18), which is a guidance report prepared by the National Highway Administration of the United States [35], was revised and used for comparative calculations.
(1). Han Haiqian Formula
Han Haiqian studied the scouring of bridge piers at several bridges over the Hangzhou Bay under strong tidal currents and proposed a formula for tidal scouring of bridge piers:
In the formula, hb is the maximum local scour depth (m) of the pier under the action of tidal current; h is the maximum full tide depth (m); B is the average water-blocking width (m) under the condition of the maximum water depth; d50 is the median grain size (m) of the sediment on the sea bed; Fr is the FROUDE number corresponding to the maximum tidal velocity, Fr = u/(gh)0.5; u is the maximum tidal velocity (m/s); k1 is the Horizontal Arrangement Coefficient of foundation pile, 1.0 for strip and 0.862 for plum; and k2 is the Vertical Arrangement Coefficient of foundation pile, 1.0 for straight pile and 1.176 for oblique pile.
However, Formula (13) may lead to underestimated local scour calculations when wave action is not taken into account [20]. According to the “Hydrological Code for Ports and Waterways”, the average flow velocity of wave water particles can be calculated using Formula (14), which can then be added to the tidal flow velocity to obtain the flow velocity under wave–current coupling.
In the formula, is the average velocity (m/s) of the wave water mass point; H is the wave height (m); C is the wave velocity, ; k is the wave number, k = 2π/L; L is the wavelength (m); and T is the period (s).
(2). Wang Rukai Formula
Numerous domestic and international studies have consistently demonstrated that the scour phenomenon surrounding pile foundations and other isolated structures, under the combined influence of waves and currents, is significantly more severe compared to their individual effects. In 1982, Wang Rukai conducted experimental investigations at the Marine Engineering Laboratory of Texas A&M University in the United States. Employing dimensional analysis techniques, he successfully derived an empirical relationship between the relative scour depths hb/hp [34].
In the formula, is the final scour depth without considering the general scour depth, β is a comprehensive parameter reflecting the dynamic factors of wave flow and the diameter of the sediment and pipe, V is the velocity of flow, T is the period of the wave, and C is the velocity of the wave.
(3). The Hydraulic Engineering Circular No. 18 (HEC-18) Formula
This method was adopted to estimate the scour depth at a bridge pier in bridge design in the United States, which is also known as the CSU (Colorado State University) method recommended in the HEC-18 [35]:
In the formula, h is the water depth, B is the calculated width of the bridge pier, hs is the local scour depth of the bridge pier, K1 is the pier shape coefficient, K2 is the coefficient for water flow angle correction, is the attack angle, l is the dimension of the pier along the flow direction, K3 is the correction factor of the riverbed condition, and is the Froude number upstream of the pier, .
However, Equation (17) does not consider the influence of wave action on local scour; Equation (14) is also used to calculate the average velocity of wave water quality points, and then superimpose the tidal flow velocity to obtain the velocity under the wave–current coupling.
(4). Scour Pit Area
The area of the scour hole can be expressed in terms of the scour radius and can be calculated by the following formula:
In the formula, r is the maximum scour radius, d is the maximum scour diameter, a is the pile diameter, hs is the maximum scour depth, and angle φ refers to the sediment rest angle, generally taking 32°.
3. Results and Discussion
Using the theoretical methods and technical means described above, this study calculates the critical scour depth under wave action and the starting flow velocity under wave–current action. By building a hydrodynamic–sediment mathematical model, it calculates large-scale erosion in the project area. Additionally, by using different wave–current coupling local erosion empirical formulas, it calculates the depth and scope of the scour pits around the pile foundations.
3.1. Critical Transition Water Depth under Wave-Induced Conditions
According to the surface sediment sampling analysis conducted in October 2018 [36], the project sea area exhibits the highest content of TS (fine- and sand-sized sediment) in its surface sediment, with an average value of 42.70%. The second highest content is ST (sand-sized sediment), accounting for 40.29% of the total composition. Additionally, YT (clay-sized sediment) represents the third highest content at 17.00%, while TS(G) (fine- and sand-sized sediment containing gravel) has the lowest presence, comprising only 0.52%. The median grain size distribution ranges from 0.0086 mm to 0.0896 mm, with an average value of 0.0327 mm.
Using Equations (1) and (2), the critical water depths for sediment mobilization in different wave classes within the engineering area were determined, as presented in Table 1. Considering that the water depth exceeds 40 m in this specific location, it is evident from the table that a minimum wave height of approximately 5.5 m is required for surface transport to occur, while a minimum wave height of around 7.3 m is necessary for full transport.

Table 1.
Critical threshold depth of sediment for different wave levels in sea area.
The frequency distribution of wave heights observed in the project area over a full year (March 2019 to February 2020) is presented in Table 2 [37,38]. It can be observed from the table that the occurrence rates of annual maximum wave height (Hmax) and H1/10 exceeding 5.5 m in the observation area are 0.44% and 0.08%, respectively. Moreover, the occurrence rates of H1/10 exceeding 7.3 m are approximately 0.08% and 0.015%.

Table 2.
Distribution frequency of wave height in observed sea area.
These findings indicate that large waves have the potential to induce sediment movement on the seabed within the project area, while extremely large waves may result in the complete displacement of surface sediments. Notably, occurrences of large waves are often associated with typhoon events. For example, during Typhoon Wepa (July 2019), a maximum wave height close to 10.5 m was recorded during our full-year observation period for this project area. Under normal circumstances, there is a low probability of encountering large waves within this region, leading to relatively inactive sediment movement on the seabed. Additionally, due to its location in a deep-water zone, the wave motion exhibits symmetry, and sediment movement primarily manifests as a symmetrical back-and-forth motion, hence significant displacement may not ultimately occur.
3.2. Initiating Flow Velocity under Wave Action
According to the sampling results of the surface sediments in the project area from October 2018, Figure 1 illustrates the station locations for surface sediment sampling. The starting flow velocities at each measurement point were calculated using Equations (3)–(7) and converted to a depth of 4 m above the seabed. The calculation results are presented in Table 3.
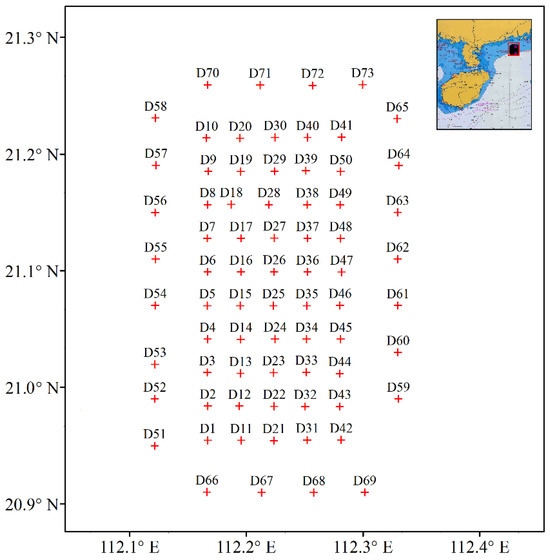
Figure 1.
Layout of surface sediment sampling stations.

Table 3.
The results of calculating the incipient flow velocity of the sediment at each station by the three formulas.
Figure 2 depicts the starting flow velocities at each measurement point on the seabed based on data from Table 3. It is evident from Figure 2 and Table 3 that there are significant differences among the starting flow velocities calculated by the three different formulas. Wang Shangyi’s formula yields the smallest range of flow velocity (61 cm/s to 162 cm/s), Zhang Ruiqin’s formula produces a moderate range (92 cm/s to 286 cm/s), while Dou Guoren’s formula gives the largest range (191 cm/s to 615 cm/s). According to tests, Dou’s formula exhibits greater amplitude fluctuations in seabed starting flow velocity curves under varying water depths, followed by Zhang with slight deviation, whereas Wang demonstrates minimal deviation. This discrepancy arises primarily due to the average flow velocity calculations employed by Formulas (5) through (7), where significant variations may occur when water depths become too deep. Additionally, these three formulas adopt different assumptions regarding flow velocity distribution when deriving relationships between near-bottom flow velocity and average flow velocity; moreover, more than two unknown coefficients are involved during the derivation process, leading to certain disparities in calculation outcomes.
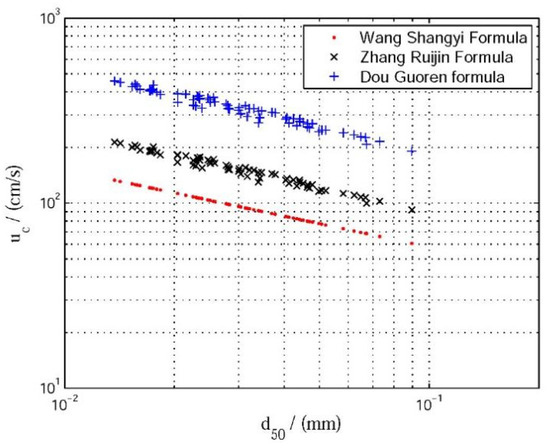
Figure 2.
Three formulas to calculate the incipient flow velocity of sediment at each station.
Based on the statistical analysis of starting flow velocities at surface sediment stations D1 to D50 in the wind power project area, we conservatively estimate that the starting flow velocity in the project sea area ranges from 61 cm/s to 162 cm/s. By comparing this estimation with the frequency distribution of each flow velocity interval observed annually on the seabed [37,38] (refer to Table 4), it is evident that all three formulas yield higher values than the measured seabed current speed at the annual observation station. Consequently, under normal circumstances, sediment within this project sea area remains relatively stable.

Table 4.
Annual bottom velocity distribution frequency in the observed sea area.
3.3. Hydrodynamic and Sediment Model
The hydrodynamic model employs a triangular unstructured grid, refined near the shoreline and within the wind power project area. The model encompasses a total of 275,703 grid points, comprising 138,520 nodes. To accurately represent the location of the wind turbine foundation, an equivalent wetted area approach is used to simplify the grid in its vicinity. The minimum spatial step length in the model is set at 0.11 m, and Figure 3 illustrates the local grid arrangement within the project area.
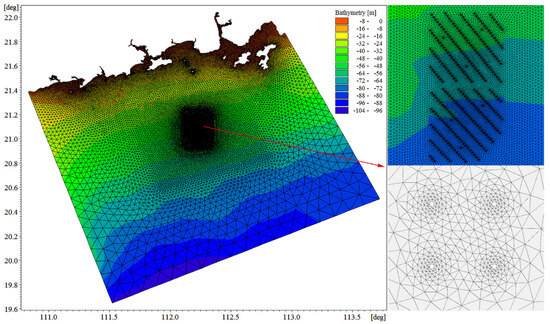
Figure 3.
Calculation range and grid layout.
(1). Validation
The South China Sea Survey Technology Center of the State Oceanic Administration conducted tidal hydrographic observations near the project area from 9 to 10 September 2018. The precise station locations are depicted in Figure 4, with specific coordinates provided in Table 5. Utilizing the tidal observation data acquired during high tide, this study validates the established tidal–sediment mathematical model by examining temporal variations in tidal levels, flow velocities, flow directions, and sediment concentrations.
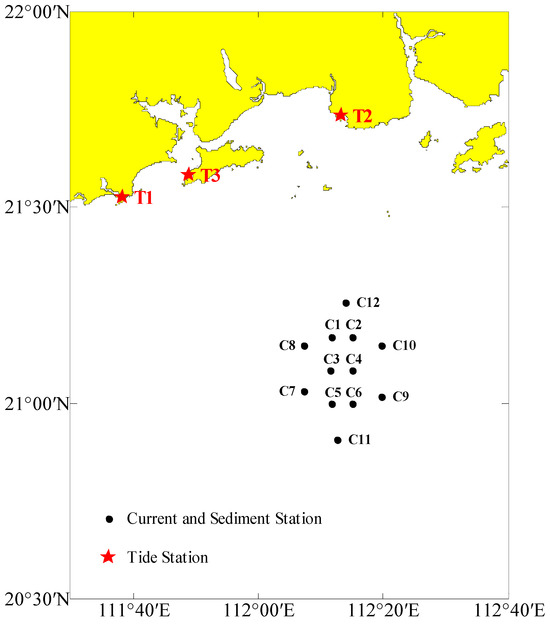
Figure 4.
Schematic diagram of the hydrological observation station for the Yangjiang Offshore Wind Power Project.

Table 5.
The coordinates of high tide station (WGS-84 coordinates).
The validation of tidal levels from 9 to 10 September 2018 is depicted in Figure 5. It can be observed from the figure that the tidal processes, including high and low tides of simulated and measured values, exhibit substantial consistency. The maximum error in calculated tidal levels at various points is less than 0.10 m. These validation results demonstrate that the mathematical model effectively simulates the propagation process of tidal waves within the engineering area, closely resembling real-world conditions, and accurately captures key characteristics related to wave propagation and deformation within marine environments.

Figure 5.
Verification of high tide levels.
The results of the tidal current verification are presented in Figure 6 and Figure 7, revealing that the calculated maximum and average tidal current velocities for both rising and falling tides exhibit substantial agreement with the measured values. The simulated flow direction also demonstrates general consistency with the observed data. With only a few exceptions, the computed errors in maximum and average tidal current velocities at various locations are all below 20%, indicating a high level of accuracy during verification.
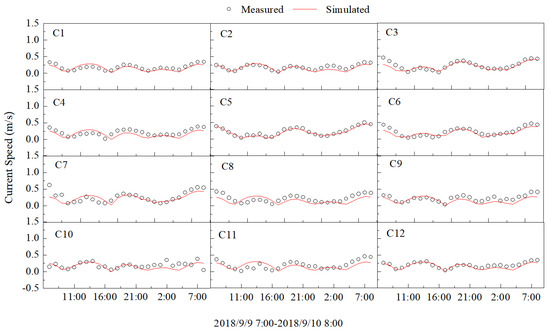
Figure 6.
Verification of large tidal current speed at C1 to C12 stations (unit: m/s).
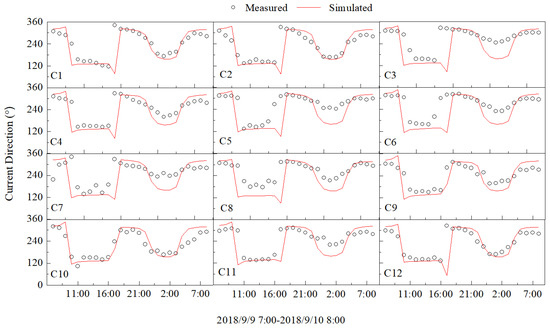
Figure 7.
Verification of large tidal current direction at C1 to C12 stations (unit: °).
The validation results of the aforementioned models demonstrate good agreement between the computed and measured tide and current speed and direction data. This indicates that the control boundary conditions and hydraulic resistance parameters used in the model are accurate. Moreover, both physical and computational parameters adopted are reasonably chosen. Therefore, the calculation method is deemed reliable for simulating tidal wave motion characteristics near the project site, accurately reproducing natural flow fields and reflecting the hydrodynamic features of the project area. Consequently, this model can be employed for further investigation of project schemes.
The temporal variation process of sediment content was validated, as depicted in Figure 8. From the figure, it can be inferred that the computed values closely align with the measured values and effectively capture the peak and trough processes of sediment content fluctuations corresponding to tide levels. The validation results demonstrate that the selected sediment parameters are reasonably chosen and aptly reflect the spatial distribution of sediment content within the marine region.
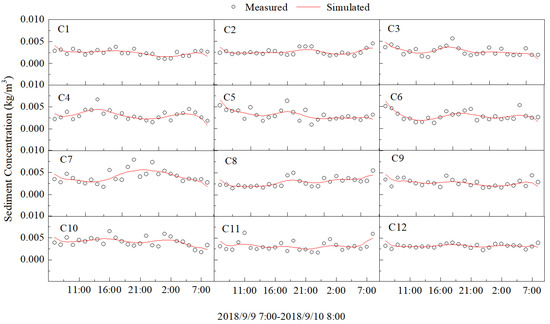
Figure 8.
Verification of suspended sediment concentration in tidewater (unit: kg/m3).
(2). Scour conditions
According to the design scheme of this project, the substation for the Fanshi Offshore Wind Power Project has a pile diameter of 2.8 m, while the wind turbine has a pile diameter of 3.0 m. The hydraulic parameters used for scour calculation are obtained from specialized studies on tidal–current analysis [39] and wave mathematical modeling [40]. In consideration of unfavorable scenarios, H1% is taken into account for wave height determination. Sediment data from the October 2018 sediment sampling results in the project area are utilized.
The erosion state of the project area after implementation is primarily concentrated around the pile foundation, with minimal impact on the surrounding marine environment, as depicted in Figure 9. For a single pile foundation, sedimentation occurs mainly in front and behind (in the direction of tidal currents), while scouring predominantly takes place on both sides (perpendicular to tidal currents). The sediment belt exhibits a northwest–southeast orientation. Once sedimentation and erosion reach equilibrium, the amplitude of sedimentation in front of and behind the pile foundation measures approximately 0.05 m, with a maximum amplitude reaching 0.2 m at the forefront edge of the pile foundation. Scouring amplitudes on both sides generally range around 0.05 m.
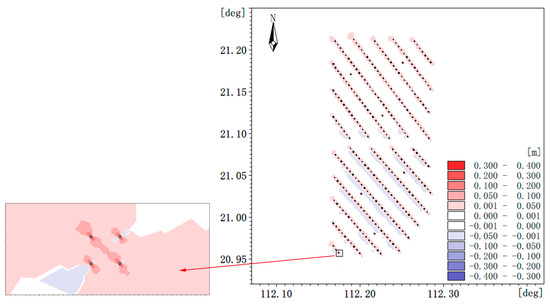
Figure 9.
Topographic erosion and deposition changes after the balance of erosion (-) and deposition (+).
3.4. Calculation of Local Erosion under the Combined Action of Wave and Current Flow
Using the formulas of Han Haiqian, Wang Rukai, and the HEC-18, this study calculates the maximum possible local scour depth and diameter for piles with diameters of 2.8 m and 3.0 m, considering the combined effects of waves and currents at different return periods. The results are presented in Table 6.

Table 6.
Maximum possible local scour depth and local scour diameter of pile foundation.
Comparing the erosion depth and diameter calculated by the three formulas under identical conditions, it is evident that the HEC-18 formula yields smaller results, the revised HEC-18 and Han Haiqian’s formulas produce moderate outcomes, and Wang Rukai’s formula generates larger values. The primary reason for this discrepancy is that the HEC-18 formula is primarily designed to calculate sediment deposition and erosion around river bridge piers without considering wave effects. Wang Rukai’s formula is a local erosion model that takes into account various factors from experimental data on isolated pile erosion depths under combined waves and currents. It applies to fine sand or medium-coarse sand with low viscosity but may not be suitable for engineering sea areas where surface sediments are mainly composed of fine sand. By incorporating water droplet flow velocity in waves, the revised HEC-18 and Han Haiqian’s formulas can estimate local erosion around small-diameter cylinders subjected to combined waves and currents. According to Table 6, the revised HEC-18 and Han Haiqian’s formulas provide more accurate predictions consistent with actual project scenarios.
According to the calculation results presented in Table 6, it is evident that both the local scour depth and scour diameter of the pile column increase proportionally with the pile diameter. Furthermore, a larger return period of wave–current combination leads to a greater local scour depth and scour diameter. When applying Han Haiqian’s formula for calculating the 50-year wave–current combination condition, it is determined that for a 2.8 m pile foundation, the maximum potential values for scour depth and scour diameter are estimated at 7.4 m and 26.5 m, respectively; similarly, for a 3.0 m pile foundation, these values are projected as 7.6 m and 27.2 m, correspondingly.
In summary, this paper initially examines the sediment movement state in a typical engineering sea area and subsequently investigates the long-term, large-scale erosion morphology resulting from engineering construction. However, as the long-term, large-scale erosion morphology fails to capture sudden scour and deposition near pile foundations during extreme weather conditions, this study further forecasts local scour depth and erosion range near pile foundations using various empirical formulas for extreme weather conditions. In comparison with previous research on seabed scour and deposition in wind farm construction, which primarily focused on local scour near pile foundations during extreme weather conditions, often employing less applicable empirical formulas, this study systematically and comprehensively investigates sediment movement states from normal to extreme weather conditions and from large-scale erosion in engineering sea areas to local scour near pile foundations. The research methodology and findings are more systematic and comprehensive. Additionally, the enhanced Han Haijian formula and HEC-18 formula not only expand the applicability of domestic and international empirical formulas for local scour but also better align with complex sea conditions encountered in actual engineering construction. Furthermore, cross-checking calculation results obtained from different empirical formulas enhances their reliability. We contend that numerical models and empirical formulas have the potential to significantly conserve human and material resources, expeditiously assessing the impact of engineering construction on the surrounding environment. However, it is imperative to validate the calculation results with field observation data. Next, we will validate our findings regarding extreme weather-related local scour near pile foundations by integrating the relevant literature with actual field data to bolster the credibility of our research outcomes. Overall, this study will offer scientific guidance for future wind farm construction—a matter of significant importance for ensuring offshore wind farm safety.
4. Conclusions
The present study employs various methodologies, including data analysis, mathematical model calculations, and empirical formula calculations, to comprehensively evaluate the dynamic conditions, sediment distribution, bed evolution, and stability of the engineering area. Furthermore, it assesses the impacts of project construction on both surrounding marine water dynamics and local scour pits of pile foundations. The key findings are as follows:
(1) Sediment Movement and Wave Impact
The sediment movement in the sea area is primarily influenced by the combined action of waves and currents. The average median grain size of surface sediments in the engineering area is approximately 0.0327 mm, with concentrations mainly ranging from 0.0086 mm to 0.0896 mm. By comparing the frequency distribution of annual observed wave heights with calculated results for the critical water depth required for sediment mobilization across different wave classes, it can be inferred that large waves have some impact on submarine sediment movement within the project area. However, this occurs with a low probability, mostly during tropical cyclones. Under normal conditions, waves generally exert minimal influence on seabed sediment movement. Waves exceeding a height of 5.5 m can mobilize submarine sediments within the project area through interaction with currents and residual currents; waves surpassing a height of 7.3 m can induce layered lateral movement of submarine sediments. Based on calculations for starting flow velocity under current action and considering annual tidal current observations at the project site, it is concluded that sediment requires a starting flow velocity above 61 cm/s within the wind power project zone. However, maximum actual measured flow velocities from annual observations are lower than this threshold value, indicating that under normal circumstances, seabed sediments remain relatively stable within the project area.
(2) Impact of Wind Farm Construction on Large-Scale Erosion
By developing a tidal–sediment mathematical model, we investigated the impact of wind power farm construction on large-scale erosion in the surrounding sea area. The results demonstrate excellent agreement between the computed tidal levels, flow velocities, and directions in our model and the measured data. Moreover, the computed suspended sediment content closely approximates the measured values, effectively capturing variations in sediment content with tidal level. These findings indicate that the tidal–sediment model accurately represents hydrodynamic characteristics and sediment distribution near the project site. Following the implementation of the project, erosion primarily occurs near pile foundations within the project area while having minimal influence on adjacent sea areas. For individual pile foundations, sedimentation predominantly occurs at their front and back (in line with rising and falling tidal currents), whereas it mainly concentrates on their sides (perpendicular to rising and falling tidal currents). Sediment deposition forms a northwest–southeast belt pattern. Once equilibrium is reached between erosion and deposition processes, sediment accumulates to approximately 0.05 m both in front of and behind each pile foundation, reaching a maximum accumulation of 0.2 m at its leading edge. Erosion amplitudes on either side of each pile foundation generally measure around 0.05 m.
(3) Calculation of Local Scour
By considering the combined effects of waves and currents and taking into account the marine hydrodynamic and geological conditions specific to the offshore wind farm, we employed the Han Haiqian formula, Wang Rukai formula, and HEC-18 formula to calculate local scouring of pile columns. Our findings revealed that results obtained from the HEC-18 formula were relatively smaller, while those derived from the revised HEC-18 and Han Haiqian formulas were moderate, and those from the Wang Rukai formula were larger. Among these methods, it was determined that the revised HEC-18 formula and Han Haiqian formula, which incorporates water velocity induced by waves, are more suitable for accurately representing actual project conditions. Utilizing the Han Haiqian formula to calculate a 50-year wave–current combination scenario resulted in maximum potential scour depths of 7.4 m with a corresponding scour diameter of 26.5 m for a 2.8 m pile foundation, whereas for a 3.0 m pile foundation, maximum possible scour depths reached 7.6 m with an associated scour diameter of 27.2 m.
In conclusion, this study is grounded in field hydrological and meteorological observations, as well as sediment sampling data. It utilizes methodologies including data analysis, mathematical model calculations, and empirical formula computations. Initially, it examines the sediment movement state under normal project area conditions before investigating the project’s impact on the surrounding sea’s erosion and sedimentation environment. Furthermore, it calculates the local scour depth and range of the wind turbine foundation. The research findings offer preliminary insights into the scour characteristics of wind turbine foundations in the deep sea off Guangdong West Coast, providing crucial design parameters for project construction. Additionally, it presents a systematic and scientifically guided approach to studying local scour of wind turbine piles with significant implications for deep-sea wind power engineering construction and pile scour protection.
Author Contributions
Conceptualization, W.W., Y.C. (Yonggang Cao) and C.Z.; methodology, Y.C. (Yonggang Cao), S.L. (Shizhi Liao) and C.Z.; validation, Y.C. (Yonggang Cao), Y.C. (Yizhan Chen), S.L. (Shizhi Liao) and C.Z.; formal analysis, Y.C. (Yonggang Cao) and S.L. (Shizhi Liao); investigation, Y.C. (Yizhan Chen) and C.L.; resources, W.W. and Y.C. (Yonggang Cao); writing—original draft preparation, Y.C. (Yonggang Cao), S.L. (Shizhi Liao) and C.Z.; writing—review and editing, Y.C. (Yonggang Cao), C.Z., X.L. and S.L. (Shizhi Liao); visualization, Y.C. (Yonggang Cao), C.Z. and S.L. (Shizhi Liao); supervision, Y.C. (Yonggang Cao) and S.L. (Shihao Luo). All authors have read and agreed to the published version of the manuscript.
Funding
This research was funded by the Director’s Foundation of the South China Sea Bureau of Ministry of Natural Resources (No. 230101).
Data Availability Statement
Data are contained within the article.
Acknowledgments
This work is part of the Hydrological observation and marine environment status investigation of CGNPC Yangjiang Fanshi No. 1 and Fanshi No. 2 offshore wind farm projects, which are financed by the South China Sea Marine Survey Center, Ministry of Natural Resources.
Conflicts of Interest
The authors declare that they have no conflicts of interest.
References
- Guan, D.; Zhang, J.; Zhao, J.; Li, J. Research progress on scouring of offshore wind power single pile foundation in complicated dynamic environment. J. Ocean. Dev. Manag. 2018, 35, 46–49. [Google Scholar]
- Basack, S.; Goswami, G.; Dai, Z.-H.; Baruah, P. Failure-mechanism and design techniques of offshore wind turbine pile foundation: Review and research directions. Sustainability 2022, 14, 12666. [Google Scholar] [CrossRef]
- Gao, D.; Pan, X.; Liang, B.; Yang, B.; Wu, G.; Wang, Z. A Review and Design Principle of Fixed-Bottom Foundation Scour Protection Schemes for Offshore Wind Energy. J. Mar. Sci. Eng. 2024, 12, 660. [Google Scholar] [CrossRef]
- Yang, Q.; Liu, H.; Pan, G.; Sun, P. Research progress of local scouring of offshore wind power single pile foundation. J. Sediment. Res. 2019, 44, 74–81. [Google Scholar]
- Guo, J.; Jiang, B. Research progress and key issues of bridge foundation scour in the past 30 years. J. China Highw. 2020, 33, 1–16. [Google Scholar]
- Shang, J.; Zhao, Y. Study on Local Scour Depth Calculation of Wind Turbine Foundation Piles in Intertidal Zone. Wind Energy 2016, 11, 3. [Google Scholar]
- Pan, D.; Li, J.; Zhou, C.; Wang, J. Research on local scouring characteristics of pile foundation of an offshore wind power plant in Zhanjiang. J. Coast. Eng. 2020, 39, 271–278. [Google Scholar]
- Høgedal, M.; Hald, T. Scour assessment and design for scour for monopile foundations for offshore wind turbines. Proc. Cph. Offshore Wind 2005, 1–10. [Google Scholar]
- Whitehouse, R.J.S.; Harris, J.; Sutherland, J.; Rees, J. An Assessment of Field Data for Scour at Offshore Wind Turbine Foundations. In Proceedings of the 4th International Conference on Scour and Erosion, Tokyo, Japan, 5–7 November 2008; pp. 329–335. [Google Scholar]
- Zhou, Y.; Zhou, G. Research on local scour around pier under the action of irregular waves. J. Sediment. Res. 2007, 5, 17–23. [Google Scholar]
- Qi, Y.; Lu, P.; Zeng, C.; Chen, K. Experimental study on local scour of offshore wind power pile foundation. J. Water Resour. Water Transp. Eng. 2015, 6, 60–67. [Google Scholar]
- Liu, C.; Sun, W.; Zhang, J.; Zhang, P.; Huang, W. Experimental study on scouring of single pile foundation structure of offshore wind farm. J. Acta Sol. Energy 2016, 37, 316–321. [Google Scholar]
- Cheng, Y.; Tang, W.; Li, D.; Huang, X.; Xia, B. Experimental study on local scour around piles on slope sandy seabed under wave action. J. Progress. Water Sci. 2018, 29, 260–268. [Google Scholar]
- Ren, H.; Liu, B.; Liu, X.; Guo, H.; Chen, C. Experimental study on local scour of three-barrel suction pile foundation for offshore wind power in Shapa Yangjiang. People’s Pearl River 2022, 5, 43. [Google Scholar]
- Xu, S.; Zhang, J.; Li, M. Experimental study on local scour of offshore wind turbine monopile foundation under bidirectional flow. Acta Hydrodyn. Sin. A 2021, 36, 7. [Google Scholar] [CrossRef]
- Zhu, Z.; Yu, P. A Comparative Study on the Calculation of the Local Scouring depth of bridge piers in Chinese and American standards. J. China Highw. 2016, 29, 36–43. [Google Scholar]
- Wu, H. Research on calculation method of local scour of pile foundation of offshore wind farm. J. Water Conserv. Technol. 2018, 01, 37–39+43. [Google Scholar]
- Du, S.; Dai, G.; Gao, L.; Wang, Z.; Zhu, M. Prediction of local scour depth of single pile foundation of offshore wind turbine under wave and current action. J. Southeast Univ. (Nat. Sci. Ed.) 2020, 50, 616–622. [Google Scholar]
- Yang, J.; Zhu, C.; Cai, L.; Wang, W. Numerical simulation of local scour of pile foundation of different structures in offshore wind farms. J. People’s Yangtze River 2020, 51, 151–157. [Google Scholar]
- Ou, W.; Lin, P.; Yang, X. Numerical Simulation Analysis of Scour at Offshore Wind Turbine Foundation. Guangdong Civil. Eng. Archit. 2023, 30, 16–20. [Google Scholar]
- Liu, Q.; Wang, Z.; Zhang, N.; Zhao, H.; Liu, L.; Huang, K.; Chen, X. Local Scour Mechanism of Offshore Wind Power Pile Foundation Based on CFD-DEM. J. Mar. Sci. Eng. 2022, 10, 1724. [Google Scholar] [CrossRef]
- Menéndez-Vicente, C.; López-Querol, S.; Bhattacharya, S.; Simons, R. Numerical study on the effects of scour on monopile foundations for Offshore Wind Turbines: The case of Robin Rigg wind farm. Soil. Dyn. Earthq. Eng. 2023, 167, 107803. [Google Scholar] [CrossRef]
- Guan, D.W.; Xie, Y.X.; Chiew, Y.M.; Ding, F.; Ferradosa, T.F.; Hong, J. Estimation of local scour around monopile foundations for offshore structures using machine learning models. Ocean. Eng. 2024, 296, 116951. [Google Scholar] [CrossRef]
- Wang, W.; Yang, J.; Li, R. Calculation of Local Scour at Wind Turbine Piles in Offshore Wind Farms. Waterw. Ports 2012, 33, 57–60. [Google Scholar]
- Japan Harbor Association. Design Standards for Port Structures (1968); People’s Traffic Publishing House: Beijing, China, 1979. [Google Scholar]
- Port Bureau of Japan Transport Ministry; Port Technology Association. Technical Standards for Port Facilities in Japan (1980); People’s Traffic Publishing House: Beijing, China, 1983. [Google Scholar]
- Bai, Y. Mechanics of Sediment Transport in River; Tianjin University Press: Tianjin, China, 2011. [Google Scholar]
- Zhang, R. River Sediment Dynamics; China Water Resources and Hydropower Press: Beijing, China, 2014. [Google Scholar]
- Li, Z.; Gao, H. Study on the Plane Layout of Piers 21~23 in Zhenghai Port Area. Zhejiang Water Sci. Technol. 2012, 2, 14–17. [Google Scholar]
- Li, J.; Guo, Y.; Lian, J.; Wang, H. Mechanisms, assessments, countermeasures, and prospects for offshore wind turbine foundation scour research. Ocean. Eng. 2023, 281, 114893. [Google Scholar] [CrossRef]
- Guan, D.W.; Xie, Y.X.; Yao, Z.S.; Chiew, Y.M.; Zhang, J.S.; Zheng, J.H. Local scour at offshore windfarm monopile foundations: A review. Water Sci. Eng. 2022, 15, 29–39. [Google Scholar] [CrossRef]
- Han, H.Q.; Xiong, S.L.; Sun, Z.L. Local scour equation at bridge piers under tidal current action. J. Sediment. Res. 2016, 1, 8–13. [Google Scholar]
- Wang, R.K.; Herbich, J.B. Combined Current and Wave Produced Scour Around a Single Pile; Texas Engineering Experiment Station: Dallas, TX, USA, 1983. [Google Scholar]
- Wang, R. The scouring and silting problem of Shenxiangou (pile 11) oil port construction. J. Coast. Eng. 1985, 2, 32–38. [Google Scholar]
- Richardson, E.V.; Davis, S.R. Evaluating Scour at Bridges, United States; Federal Highway Administration: Washington, DC, USA, 2001. [Google Scholar]
- Cao, Y.; Chen, Z.; Liao, S.; Zhang, Y. Hydrological Observation and Marine Environment Status Survey of CGNPC Yangjiang Fanshi No. 1 and Fanshi No. 2 Offshore Wind Farm Project Autumn Comprehensive Hydrological Observation and Analysis; R. Guangzhou, South China Sea Survey Technology Center, State Oceanic Administration: Guangzhou, China, 2019. [Google Scholar]
- Cao, Y.; Chen, Z.; Liao, S.; Zhang, Y. Hydrological Observation and Marine Environment Status Survey of CGNPC Yangjiang Fanshi No. 1 and Fanshi No. 2 Offshore Wind Farm Project Annual Tide Level, Ocean Current, Wave Observation and Analysis; R. Guangzhou, South China Sea Survey Technology Center, State Oceanic Administration: Guangzhou, China, 2020. [Google Scholar]
- Cao, Y.; Chen, Z.; Liao, S.; Chen, Y. Hydrological Observation and Marine Environment Status Investigation of CGNPC Yangjiang Fanshi No. 1 and Fanshi No. 2 Offshore Wind Farm Projects Sediment and Seabed Stability Analysis; R. Guangzhou, South China Sea Survey Technology Center, State Oceanic Administration: Guangzhou, China, 2020. [Google Scholar]
- Cao, Y.; Huang, Y.; Chen, Z.; Chen, Y. Hydrological Observation and Marine Environment Status Survey of CGNPC Yangjiang Fanshi No. 1 and Fanshi No. 2 Offshore Wind Farm Project Tidal and Current Analysis; R. Guangzhou, South China Sea Survey Technology Center, State Oceanic Administration: Guangzhou, China, 2020. [Google Scholar]
- Cao, Y.; Liao, S.; Chen, Z. Hydrological Observation and Marine Environment Status Survey of CGNPC Yangjiang Fanshi No. 1 and Fanshi No. 2 Offshore Wind Farm Project Wave Mathematical Models Research; R. Guangzhou, South China Sea Survey Technology Center, State Oceanic Administration: Guangzhou, China, 2020. [Google Scholar]
Disclaimer/Publisher’s Note: The statements, opinions and data contained in all publications are solely those of the individual author(s) and contributor(s) and not of MDPI and/or the editor(s). MDPI and/or the editor(s) disclaim responsibility for any injury to people or property resulting from any ideas, methods, instructions or products referred to in the content. |
© 2024 by the authors. Licensee MDPI, Basel, Switzerland. This article is an open access article distributed under the terms and conditions of the Creative Commons Attribution (CC BY) license (https://creativecommons.org/licenses/by/4.0/).