
Chemical Speciation and Preservation of Phosphorus in Sediments along the Southern Coast of Zhoushan Island

 ,
, 
 ,
,  , and
, and
Abstract
1. Introduction
2. Materials and Methods
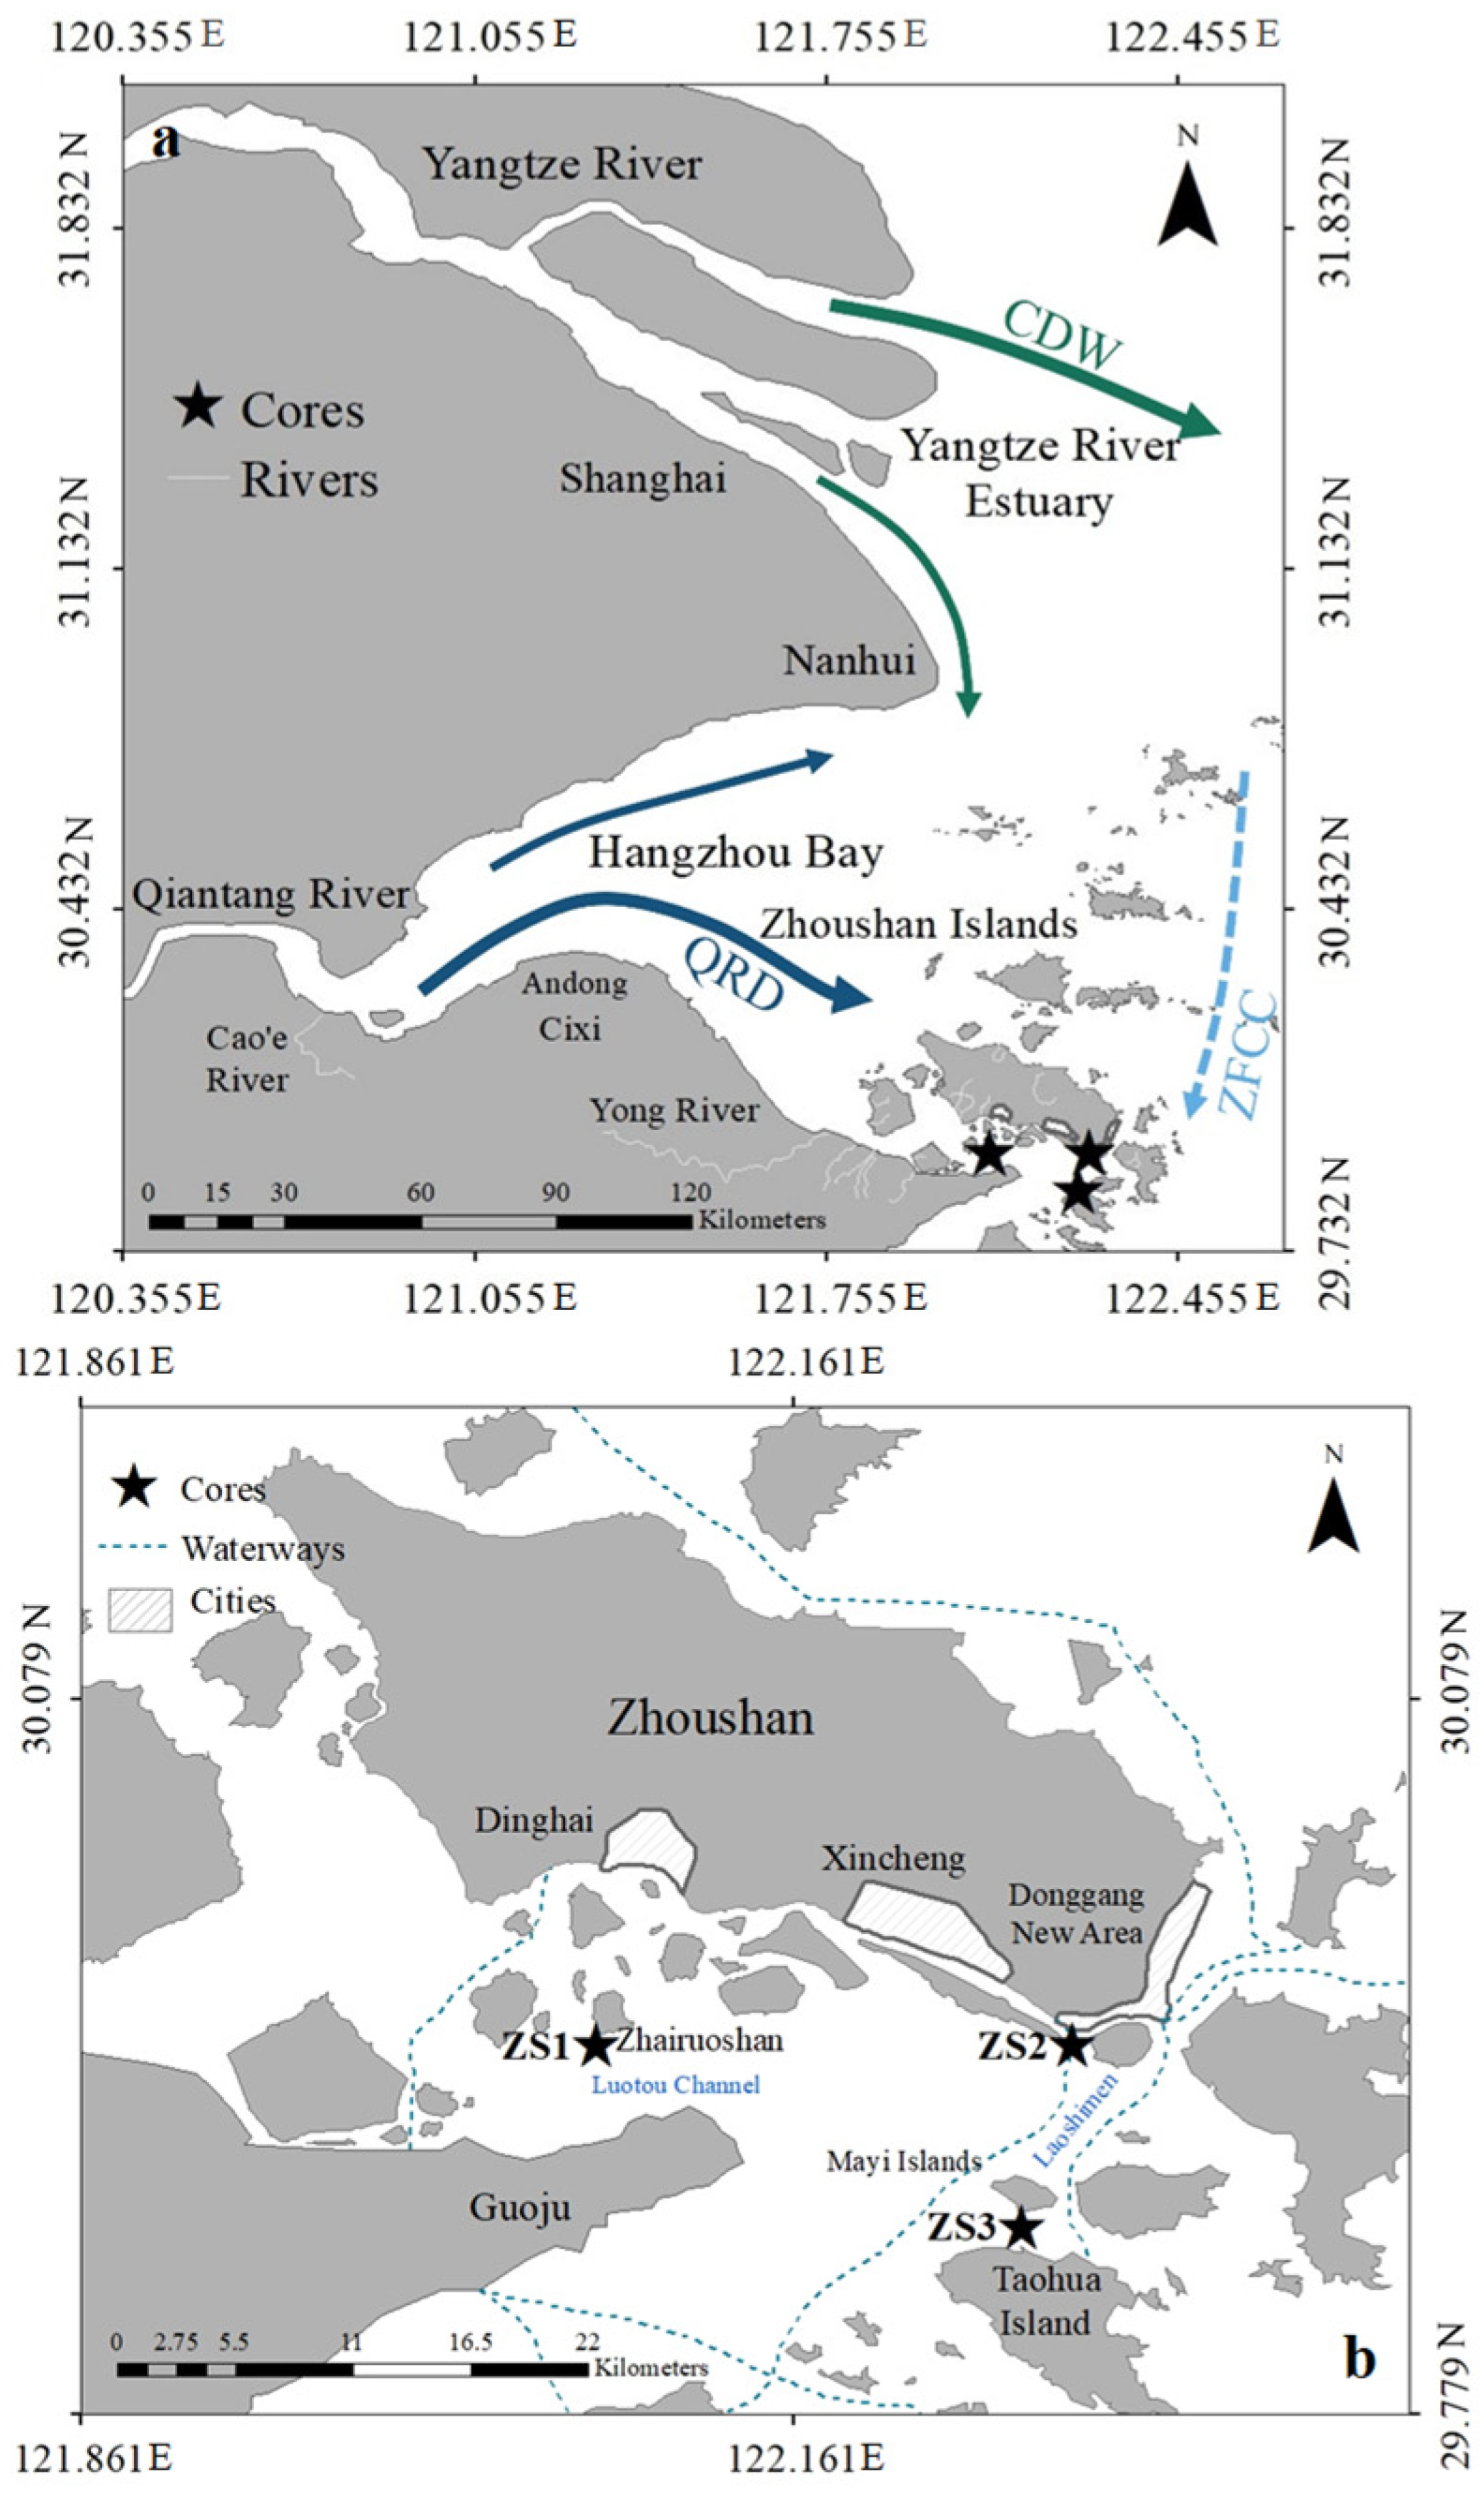
2.1. Sediment Sampling
2.2. 210Pb Dating
2.3. Particle Size Determination
2.4. Bulk Elemental Composition
2.5. Sequential P Extraction
3. Results
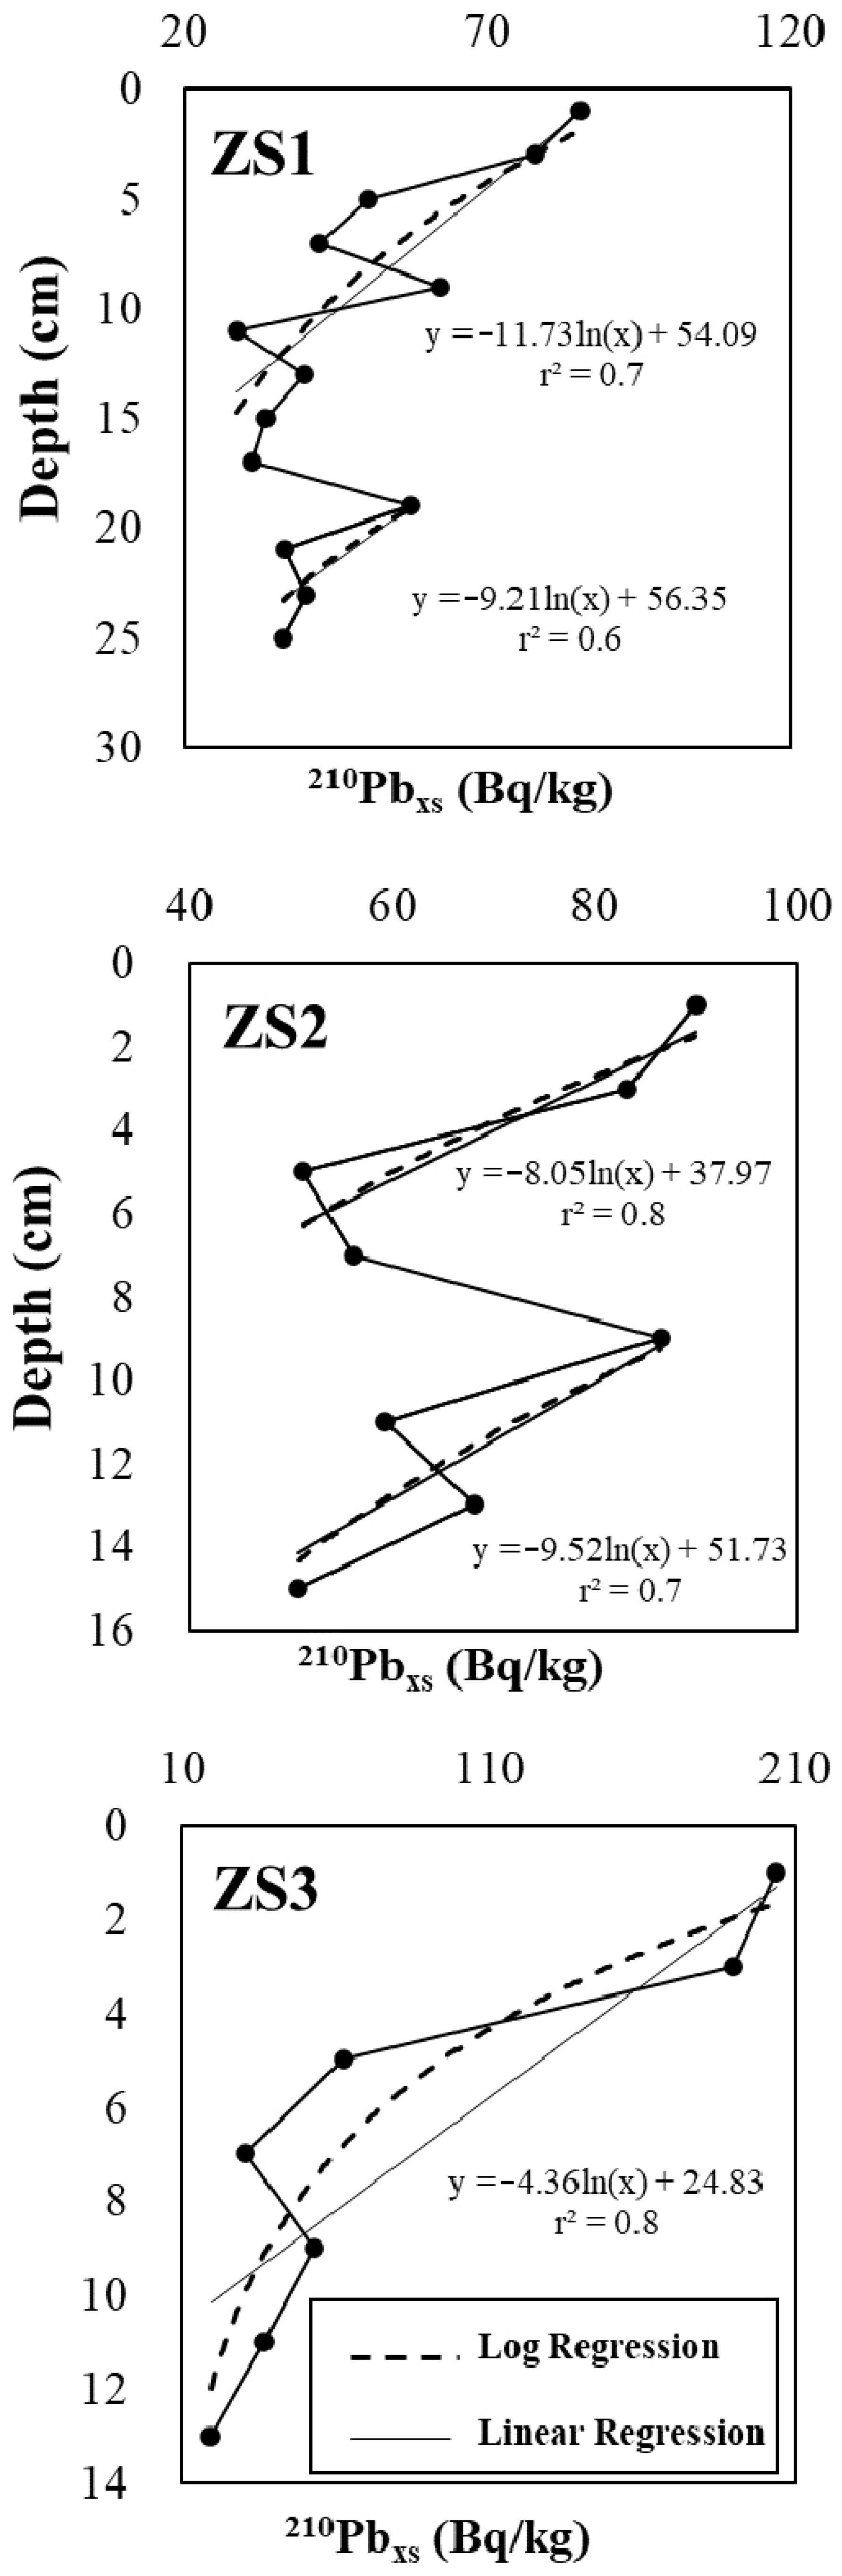
3.1. Sedimentation Rates
3.2. Particle Size
3.3. TOC Contents
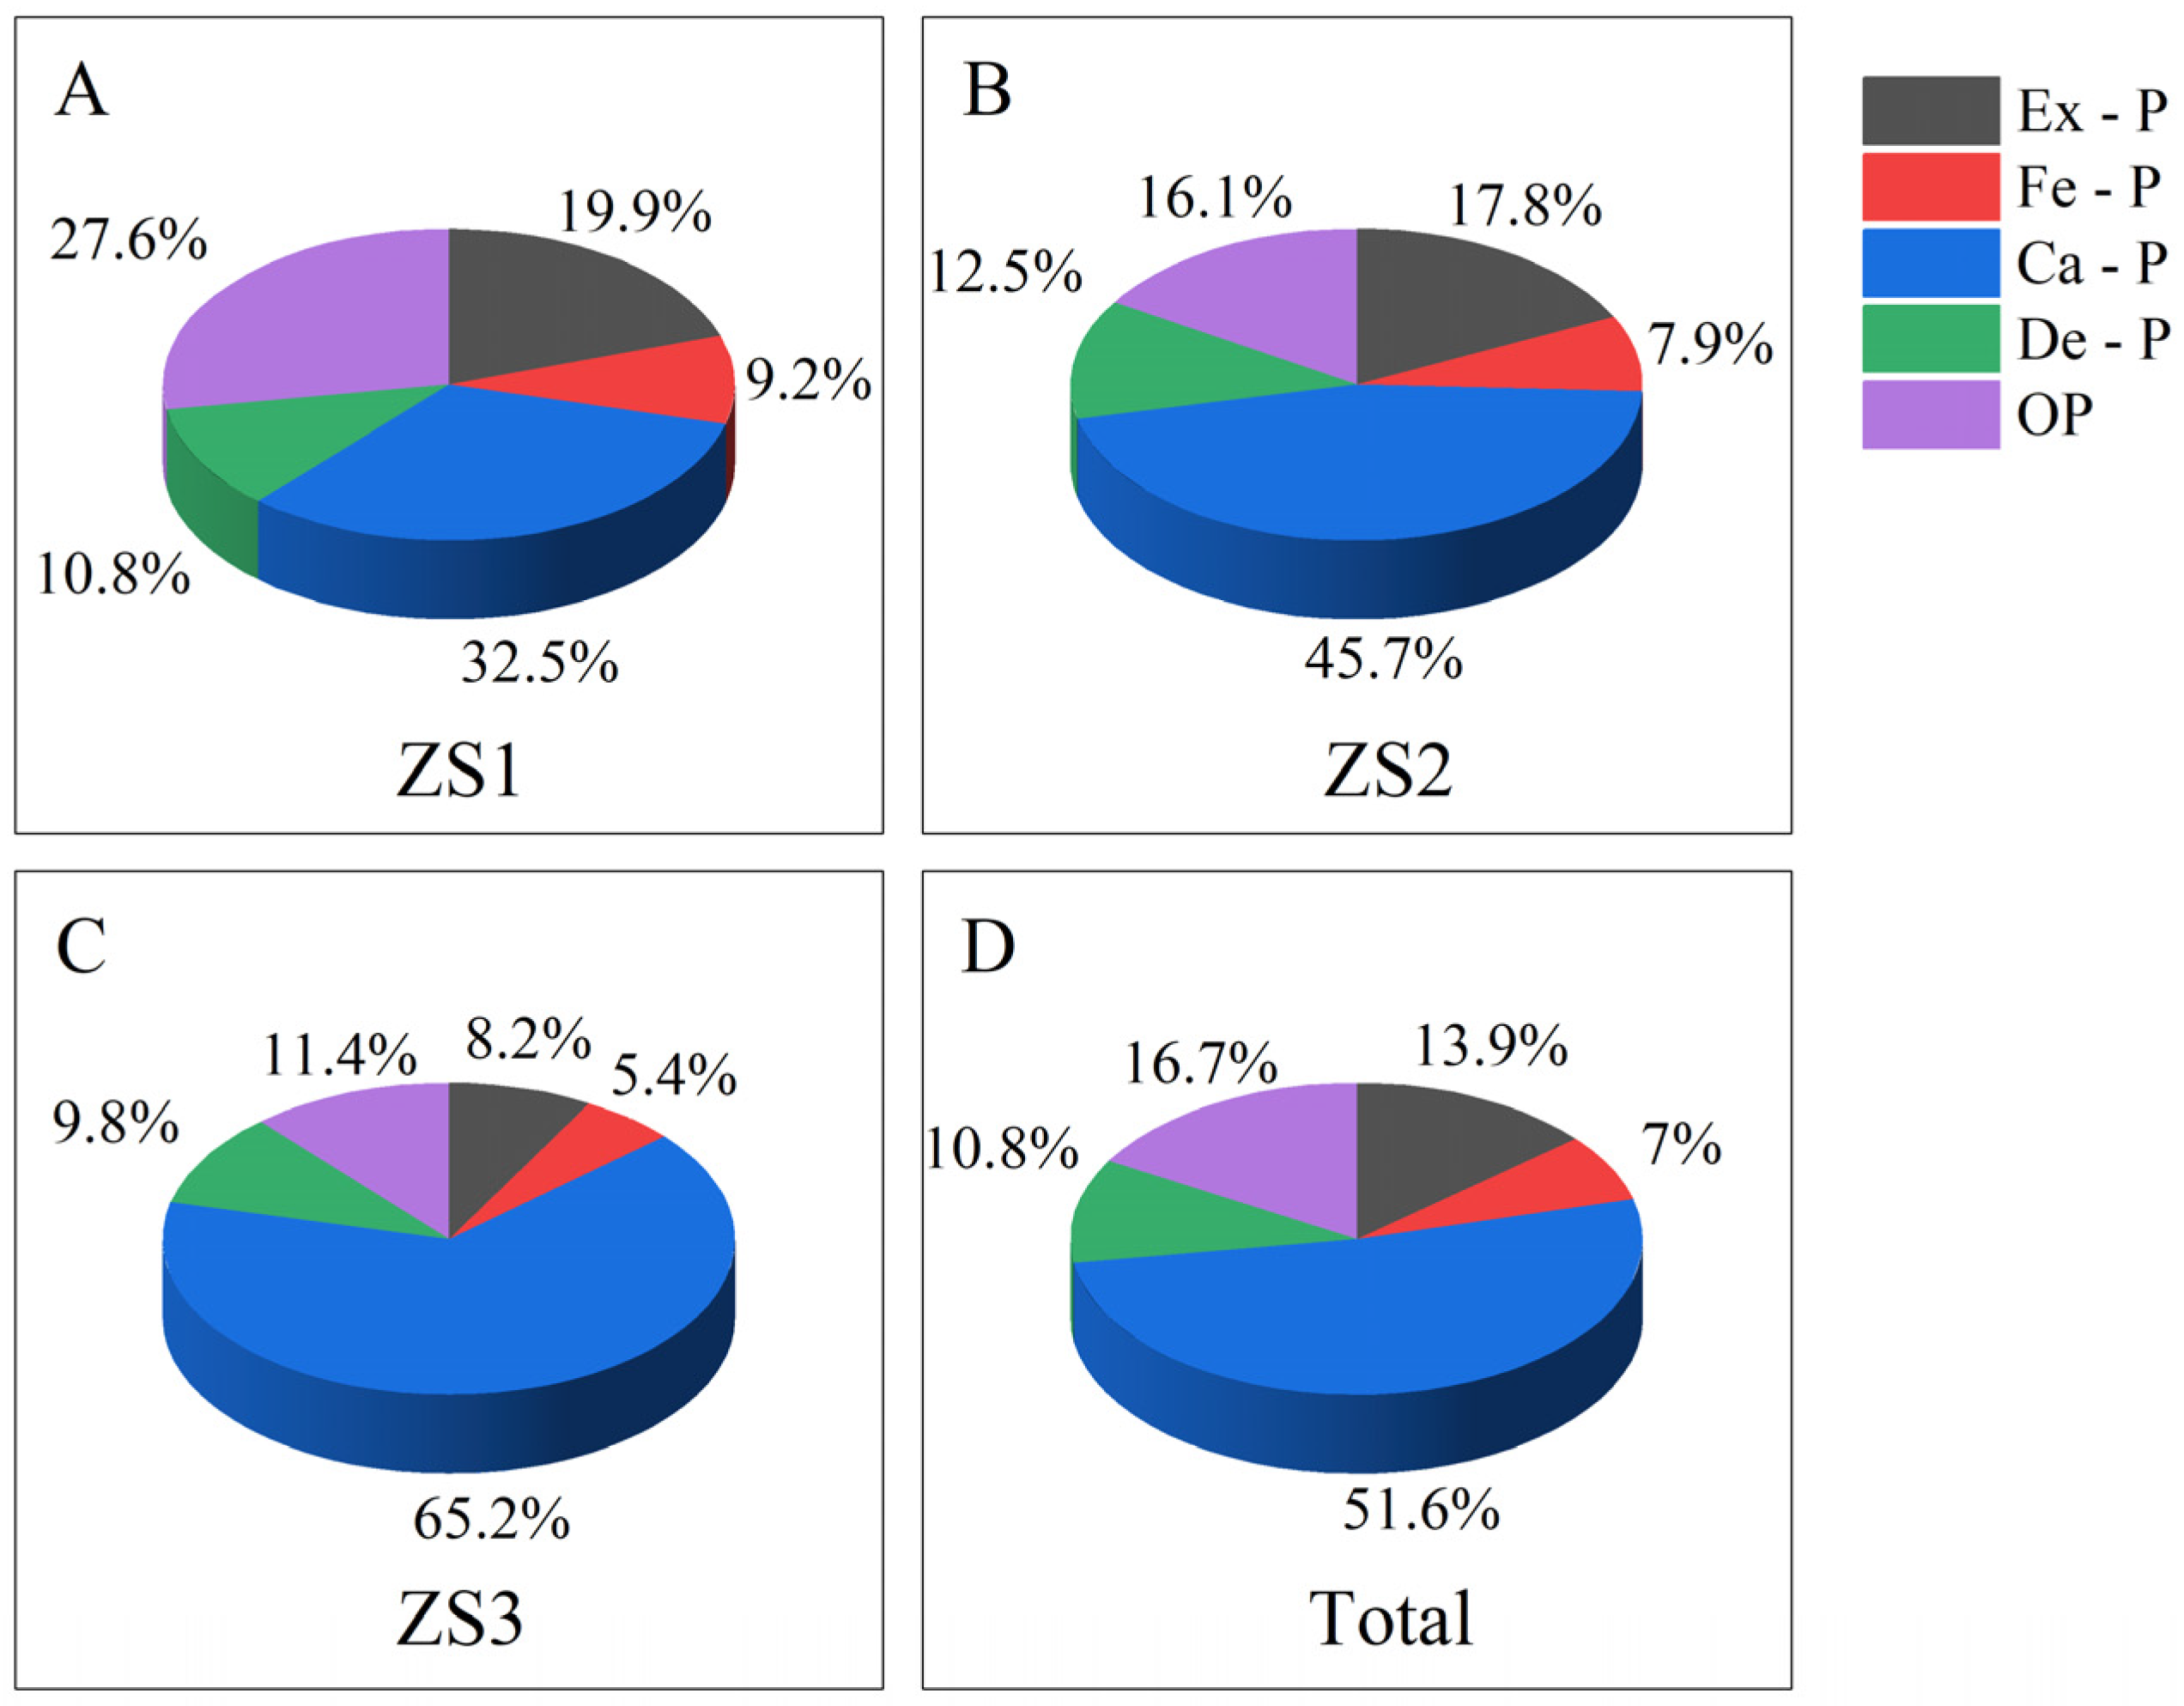
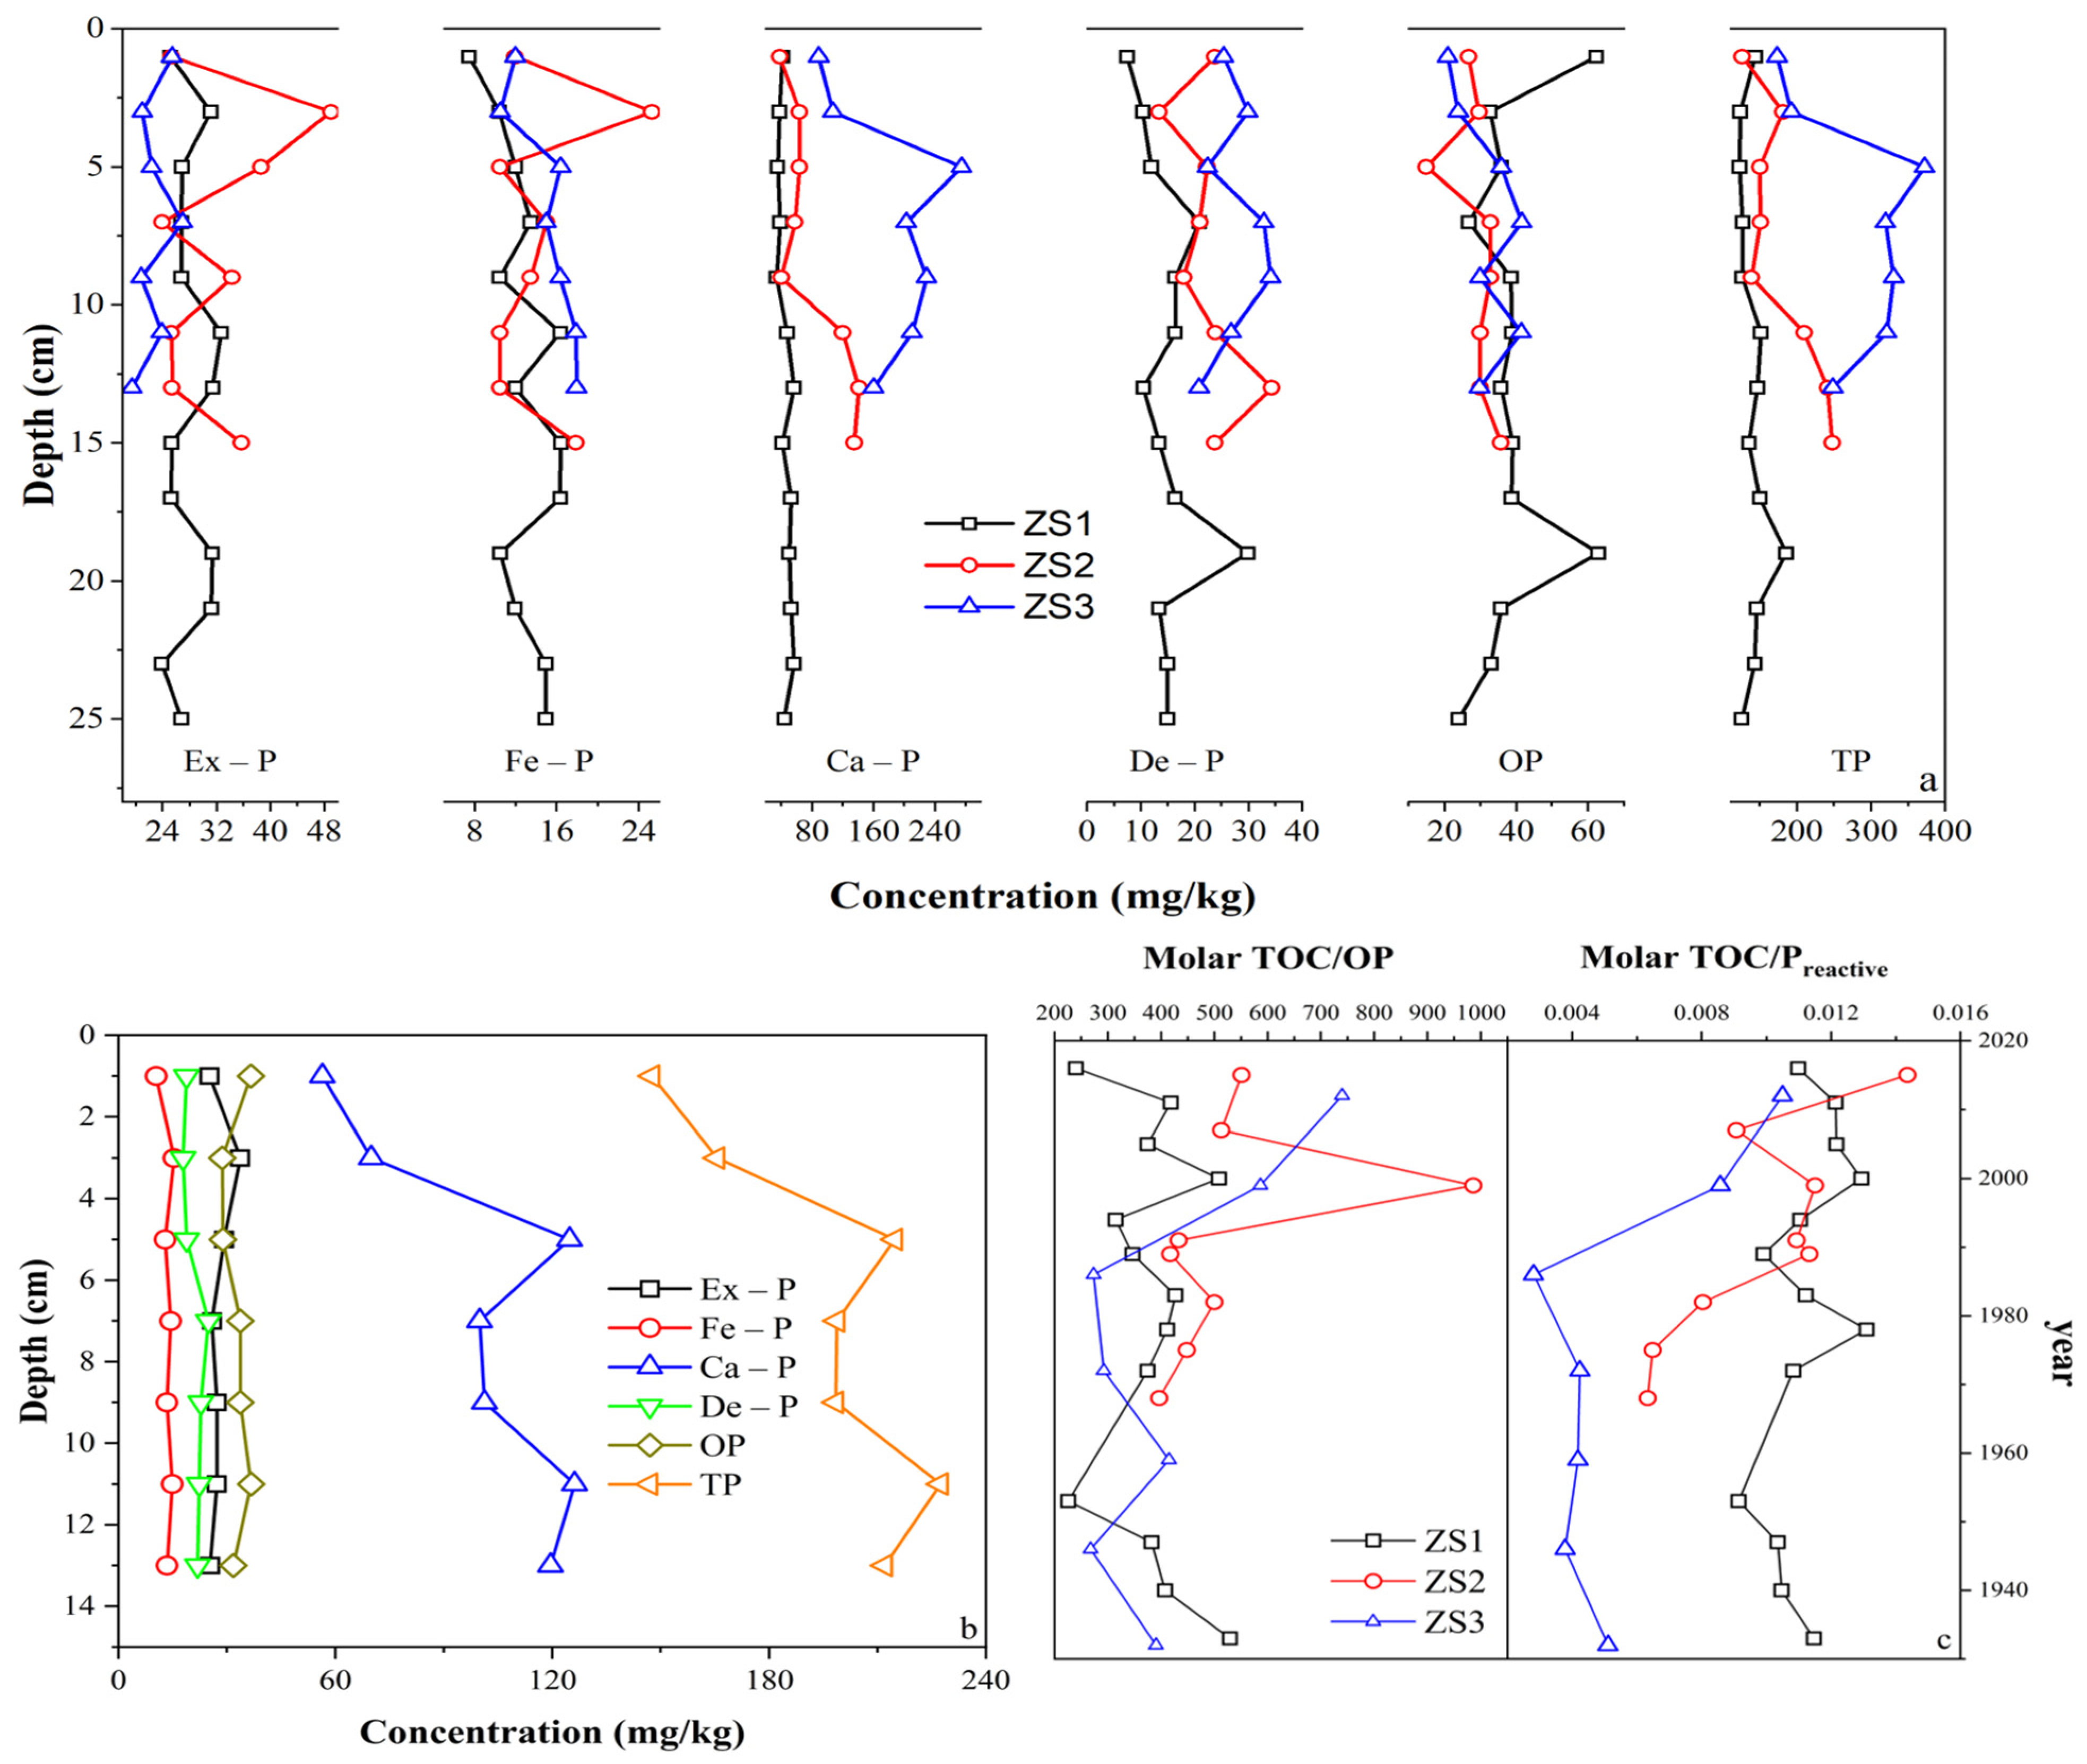
3.4. Sedimentary P Forms
4. Discussion
4.1. Sources of Sedimentary P Species
4.2. Transformation of Sedimentary P Species
4.3. Impacts of Climate Change and Human Activities on P Dynamics
5. Conclusions
Author Contributions
Funding
Data Availability Statement
Acknowledgments
Conflicts of Interest
Appendix A

| (A) ZS1 | |||||||||||||
| Concentration (mg kg−1) | TOC (%) | Particle Size (μm) | TOC/OP | OC/Preactive | |||||||||
| Depth (cm) | Year | Ex-P | Fe-P | Ca-P | De-P | OP | IP | BAP | TP | ||||
| −1 | 2016 | 25.15 | 7.44 | 41.4 | 7.44 | 62.33 | 81.42 | 94.92 | 143.75 | 0.58 | 16.04 | 240 | 0.011 |
| −3 | 2011 | 31.09 | 10.4 | 38.48 | 10.4 | 32.7 | 90.37 | 74.19 | 123.07 | 0.53 | 17.09 | 418 | 0.012 |
| −5 | 2005 | 26.83 | 11.95 | 35.75 | 11.95 | 35.83 | 86.48 | 74.61 | 122.31 | 0.52 | 18.85 | 375 | 0.012 |
| −7 | 2000 | 26.78 | 13.42 | 38.66 | 20.84 | 26.89 | 99.69 | 67.09 | 126.58 | 0.53 | 16.58 | 509 | 0.013 |
| −9 | 1994 | 26.73 | 10.43 | 34.14 | 16.36 | 38.52 | 87.65 | 75.68 | 126.17 | 0.47 | 18.64 | 315 | 0.011 |
| −11 | 1989 | 32.67 | 16.36 | 47.5 | 16.36 | 38.78 | 112.89 | 87.81 | 151.67 | 0.52 | 17.19 | 346 | 0.010 |
| −13 | 1983 | 31.39 | 11.99 | 56.75 | 10.5 | 35.66 | 110.63 | 79.04 | 146.29 | 0.59 | 14.70 | 427 | 0.011 |
| −15 | 1978 | 25.26 | 16.37 | 41.58 | 13.4 | 38.92 | 96.6 | 80.55 | 135.52 | 0.62 | 16.80 | 411 | 0.013 |
| −17 | 1972 | 25.2 | 16.32 | 53.3 | 16.32 | 38.59 | 111.15 | 80.11 | 149.74 | 0.56 | 16.54 | 375 | 0.011 |
| −19 | 1953 | 31.34 | 10.48 | 50.71 | 29.85 | 62.83 | 122.37 | 104.65 | 185.2 | 0.55 | 17.49 | 226 | 0.009 |
| −21 | 1947 | 31.15 | 11.9 | 53.37 | 13.38 | 35.78 | 109.8 | 78.83 | 145.57 | 0.53 | 18.25 | 382 | 0.010 |
| −23 | 1940 | 23.82 | 14.91 | 56.49 | 14.91 | 32.95 | 110.13 | 71.68 | 143.07 | 0.52 | 17.24 | 407 | 0.010 |
| −25 | 1933 | 26.79 | 14.91 | 44.62 | 14.91 | 23.9 | 101.23 | 65.6 | 125.13 | 0.49 | 33.07 | 529 | 0.011 |
| (B) ZS2 | |||||||||||||
| Concentration (mg kg−1) | TOC (%) | Particle Size (μm) | TOC/OP | OC/Preactive | |||||||||
| Depth (cm) | Year | Ex-P | Fe-P | Ca-P | De-P | OP | IP | BAP | TP | ||||
| −1 | 2016 | 25.25 | 11.91 | 38.59 | 23.77 | 26.69 | 99.53 | 63.85 | 126.22 | 0.57 | 27.25 | 551 | 0.014 |
| −3 | 2011 | 49.03 | 25.28 | 63.87 | 13.41 | 29.68 | 151.59 | 103.99 | 181.27 | 0.59 | 26.44 | 513 | 0.009 |
| −5 | 2005 | 38.64 | 10.44 | 63.87 | 22.32 | 14.92 | 135.27 | 64 | 150.18 | 0.57 | 26.53 | 986 | 0.012 |
| −7 | 2000 | 23.9 | 14.96 | 58.19 | 20.92 | 32.78 | 117.97 | 71.64 | 150.75 | 0.55 | 28.84 | 433 | 0.011 |
| −9 | 1994 | 34.29 | 13.45 | 40.24 | 17.92 | 32.78 | 105.9 | 80.52 | 138.68 | 0.53 | 26.51 | 417 | 0.011 |
| −11 | 1989 | 25.32 | 10.46 | 120.46 | 23.84 | 29.94 | 180.08 | 65.72 | 210.02 | 0.58 | 26.01 | 500 | 0.008 |
| −13 | 1983 | 25.33 | 10.46 | 141.32 | 34.26 | 29.94 | 211.38 | 65.73 | 241.32 | 0.52 | 25.10 | 448 | 0.006 |
| −15 | 1978 | 35.63 | 17.84 | 134.97 | 23.77 | 35.78 | 212.19 | 89.25 | 247.96 | 0.55 | 26.27 | 397 | 0.006 |
| (C) ZS3 | |||||||||||||
| Concentration (mg kg−1) | TOC (%) | Particle Size (μm) | TOC/OP | OC/Preactive | |||||||||
| Depth (cm) | Year | Ex-P | Fe-P | Ca-P | De-P | OP | IP | BAP | TP | ||||
| −1 | 2016 | 25.34 | 11.95 | 89.3 | 25.34 | 20.93 | 151.93 | 58.22 | 172.86 | 0.6 | 18.15 | 740 | 0.010 |
| −3 | 2011 | 20.92 | 10.49 | 107.38 | 29.87 | 23.76 | 168.66 | 55.17 | 192.42 | 0.54 | 22.31 | 587 | 0.009 |
| −5 | 2005 | 22.34 | 16.4 | 274.89 | 22.34 | 35.86 | 335.96 | 74.6 | 371.82 | 0.38 | 31.94 | 273 | 0.003 |
| −7 | 2000 | 26.9 | 14.97 | 202.9 | 32.87 | 41.51 | 277.64 | 83.38 | 319.14 | 0.47 | 25.55 | 292 | 0.004 |
| −9 | 1994 | 20.78 | 16.34 | 229.5 | 34.1 | 29.87 | 300.71 | 66.99 | 330.58 | 0.48 | 23.30 | 415 | 0.004 |
| −11 | 1989 | 23.79 | 17.85 | 210.67 | 26.75 | 41.42 | 279.06 | 83.06 | 320.48 | 0.43 | 23.49 | 268 | 0.004 |
| −13 | 1983 | 19.37 | 17.89 | 160.56 | 20.86 | 29.72 | 218.68 | 66.98 | 248.41 | 0.45 | 29.20 | 391 | 0.005 |
| P Species | Concentration (mg kg−1) | ||
|---|---|---|---|
| ZS1 | ZS2 | ZS3 | |
| Ex-P | 28.02 (23.82–32.67) | 32.18 (23.90–49.03) | 22.78 (19.37–26.90) |
| Fe-P | 12.84 (7.44–16.37) | 14.35 (10.44–25.28) | 15.13 (10.49–17.89) |
| Ca-P | 45.60 (34.14–56.75) | 82.69 (38.59–141.32) | 182.17 (89.30–274.89) |
| De-P | 15.12 (7.44–29.85) | 22.53 (13.41–34.26) | 27.45 (20.86–34.10) |
| OP | 38.74 (23.90–62.83) | 29.06 (14.92–35.78) | 31.87 (20.93–41.51) |
| IP | 101.57 (81.47–122.37) | 151.74 (99.53–212.19) | 247.52 (151.93–335.96) |
| TP | 140.31 (122.31–185.20) | 180.80 (126.22–247.96) | 279.39 (172.86–371.82) |
| IP (%) | 72% (57–81%) | 84% (76–90%) | 89% (87–91%) |
| OP (%) | 28% (19–43%) | 16% (10–24%) | 11% (9–13%) |
| (A) ZS1 | ||||||||||||
| Ex-P | Fe-P | Ca-P | De-P | OP | IP | TP | ||||||
| Ex-P | Pearson correlation | 1 | ||||||||||
| Significance | ||||||||||||
| N | 13 | |||||||||||
| Fe-P | Pearson correlation | −0.162 | 1 | |||||||||
| Significance | 0.597 | |||||||||||
| N | 13 | 13 | ||||||||||
| Ca-P | Pearson correlation | 0.2 | 0.312 | 1 | ||||||||
| Significance | 0.512 | 0.299 | ||||||||||
| N | 13 | 13 | 13 | |||||||||
| De-P | Pearson correlation | 0.191 | 0.152 | 0.132 | 1 | |||||||
| Significance | 0.532 | 0.621 | 0.668 | |||||||||
| N | 13 | 13 | 13 | 13 | ||||||||
| IP | Pearson correlation | 0.421 | 0.453 | 0.816 | 0.613 | 1 | ||||||
| Significance | 0.152 | 0.12 | 0.001 | 0.026 | ||||||||
| N | 13 | 13 | 13 | 13 | 13 | |||||||
| OP | Pearson correlation | 0.084 | −0.541 | 0.066 | 0.216 | 0.037 | 1 | |||||
| Significance | 0.786 | 0.056 | 0.83 | 0.478 | 0.904 | |||||||
| N | 13 | 13 | 13 | 13 | 13 | 13 | ||||||
| TP | Pearson correlation | 0.359 | −0.035 | 0.632 | 0.586 | 0.745 | 0.694 | 1 | ||||
| Significance | 0.228 | 0.911 | 0.021 | 0.035 | 0.003 | 0.008 | ||||||
| N | 13 | 13 | 13 | 13 | 13 | 13 | 13 | |||||
| (B) ZS2 | ||||||||||||
| Ex-P | Fe-P | Ca-P | De-P | OP | IP | TP | ||||||
| Ex-P | Pearson correlation | 1 | ||||||||||
| Significance | ||||||||||||
| N | 8 | |||||||||||
| Fe-P | Pearson correlation | 0.734 | 1 | |||||||||
| Significance | 0.038 | |||||||||||
| N | 8 | 8 | ||||||||||
| Ca-P | Pearson correlation | −0.189 | −0.172 | 1 | ||||||||
| Significance | 0.654 | 0.765 | ||||||||||
| N | 8 | 8 | 8 | |||||||||
| De-P | Pearson correlation | −0.66 | −0.677 | 0.652 | 1 | |||||||
| Significance | 0.075 | 0.065 | 0.08 | |||||||||
| N | 8 | 8 | 8 | 8 | ||||||||
| IP | Pearson correlation | 0.015 | 0.049 | 0.977 | 0.54 | 1 | ||||||
| Significance | 0.972 | 0.908 | 0 | 0.167 | ||||||||
| N | 8 | 8 | 8 | 8 | 8 | |||||||
| OP | Pearson correlation | −0.194 | 0.367 | 0.29 | −0.034 | 0.272 | 1 | |||||
| Significance | 0.645 | 0.371 | 0.486 | 0.937 | 0.514 | |||||||
| N | 8 | 8 | 8 | 8 | 8 | 8 | ||||||
| TP | Pearson correlation | −0.012 | 0.096 | 0.972 | 0.511 | 0.992 | 0.394 | 1 | ||||
| Significance | 0.978 | 0.821 | 0 | 0.196 | 0 | 0.334 | ||||||
| N | 8 | 8 | 8 | 8 | 8 | 8 | 8 | |||||
| (C) ZS3 | ||||||||||||
| Ex-P | Fe-P | Ca-P | De-P | OP | IP | TP | ||||||
| Ex-P | Pearson correlation | 1 | ||||||||||
| Significance | ||||||||||||
| N | 7 | |||||||||||
| Fe-P | Pearson correlation | −0.21 | 1 | |||||||||
| Significance | 0.651 | |||||||||||
| N | 7 | 7 | ||||||||||
| Ca-P | Pearson correlation | −0.043 | 0.72 | 1 | ||||||||
| Significance | 0.928 | 0.068 | ||||||||||
| N | 7 | 7 | 7 | |||||||||
| De-P | Pearson correlation | 0.282 | −0.273 | 0.045 | 1 | |||||||
| Significance | 0.54 | 0.554 | 0.924 | |||||||||
| N | 7 | 7 | 7 | 7 | ||||||||
| IP | Pearson correlation | 0.01 | 0.708 | 0.997 | 0.116 | 1 | ||||||
| Significance | 0.983 | 0.075 | 0 | 0.804 | ||||||||
| N | 7 | 7 | 7 | 7 | 7 | |||||||
| OP | Pearson correlation | 0.35 | 0.668 | 0.744 | 0.12 | 0.768 | 1 | |||||
| Significance | 0.441 | 0.101 | 0.055 | 0.798 | 0.044 | |||||||
| N | 7 | 7 | 7 | 7 | 7 | 7 | ||||||
| TP | Pearson correlation | 0.046 | 0.72 | 0.992 | 0.119 | 0.998 | 0.81 | 1 | ||||
| Significance | 0.921 | 0.068 | 0 | 0.8 | 0 | 0.027 | ||||||
| N | 7 | 7 | 7 | 7 | 7 | 7 | 7 | |||||
| (D) Results for all cores | ||||||||||||
| All Cores | ||||||||||||
| Fe-P | Ca-P | De-P | OP | IP | BAP | TP | TOC | Particle Size | TOC/OP | TOC/Preactive | ||
| Ex-P | Pearson correlation | 0.292 | −0.36 | −0.295 | −0.0472 | −0.269 | 0.55 | −0.276 | 0.392 | −0.0106 | 0.252 | 0.238 |
| Significance | 0.131 | 0.0599 | 0.127 | 0.812 | 0.166 | 0.00244 | 0.155 | 0.0391 | 0.957 | 0.196 | 0.222 | |
| N | 28 | 28 | 28 | 28 | 28 | 28 | 28 | 28 | 28 | 28 | 28 | |
| Fe-P | Pearson correlation | 0.314 | 0.000632 | −0.135 | 0.371 | 0.33 | 0.352 | −0.201 | 0.336 | −0.126 | −0.364 | |
| Significance | 0.103 | 0.997 | 0.493 | 0.0519 | 0.0864 | 0.0662 | 0.306 | 0.0808 | 0.523 | 0.0568 | ||
| N | 28 | 28 | 28 | 28 | 28 | 28 | 28 | 28 | 28 | 28 | ||
| Ca-P | Pearson correlation | 0.635 | −0.0424 | 0.992 | −0.123 | 0.986 | −0.66 | 0.473 | −0.208 | −0.936 | ||
| Significance | 0.000281 | 0.83 | 3.79 × 10⁻²⁵ | 0.532 | 9.31 × 10⁻²² | 0.000133 | 0.0109 | 0.289 | 2.78 × 10⁻¹³ | |||
| N | 28 | 28 | 28 | 28 | 28 | 28 | 28 | 28 | 28 | |||
| De-P | Pearson correlation | −0.159 | 0.677 | −0.279 | 0.654 | −0.289 | 0.368 | 0.105 | −0.601 | |||
| Significance | 0.42 | 7.71 × 10−05 | 0.15 | 0.00016 | 0.135 | 0.0539 | 0.593 | 0.000714 | ||||
| N | 28 | 28 | 28 | 28 | 28 | 28 | 28 | 28 | ||||
| OP | Pearson correlation | −0.0672 | 0.76 | 0.073 | −0.0432 | −0.399 | −0.809 | −0.111 | ||||
| Significance | 0.734 | 2.66 × 10−06 | 0.712 | 0.827 | 0.0355 | 1.88 × 10−07 | 0.573 | |||||
| N | 28 | 28 | 28 | 28 | 28 | 28 | 28 | |||||
| IP | Pearson correlation | −0.0816 | 0.99 | −0.628 | 0.5 | −0.169 | −0.941 | |||||
| Significance | 0.68 | 9.52 × 10⁻²⁴ | 0.000348 | 0.00677 | 0.389 | 9.04 × 10⁻¹⁴ | ||||||
| N | 28 | 28 | 28 | 28 | 28 | 28 | ||||||
| BAP | Pearson correlation | 0.025 | 0.102 | −0.235 | −0.577 | −0.079 | ||||||
| Significance | 0.899 | 0.604 | 0.228 | 0.00131 | 0.69 | |||||||
| N | 28 | 28 | 28 | 28 | 28 | |||||||
| TP | Pearson correlation | −0.634 | 0.444 | −0.283 | −0.956 | |||||||
| Significance | 0.000295 | 0.018 | 0.145 | 2.01 × 10⁻¹⁵ | ||||||||
| N | 28 | 28 | 28 | 28 | ||||||||
| TOC | Pearson correlation | −0.411 | 0.424 | 0.657 | ||||||||
| Significance | 0.0296 | 0.0247 | 0.000147 | |||||||||
| N | 28 | 28 | 28 | |||||||||
| Particle size | Pearson correlation | 0.193 | −0.427 | |||||||||
| Significance | 0.326 | 0.0235 | ||||||||||
| N | 28 | 28 | ||||||||||
| TOC/OP | Pearson correlation | 0.348 | ||||||||||
| Significance | 0.0696 | |||||||||||
| N | 28 | |||||||||||
References
- Froelich, P.N.; Bender, M.L.; Heath, G.R.; DeVries, T. The Marine Phosphorus Cycle. Am. J. Sci. 1982, 282, 474–511. [Google Scholar] [CrossRef]
- Monbet, P.; Brunskill, G.J.; Zagorskis, I.; Pfitzner, J. Phosphorus Speciation in the Sediment and Mass Balance for the Central Region of the Great Barrier Reef Continental Shelf (Australia). Geochim. Cosmochim. Acta 2007, 71, 2762–2779. [Google Scholar] [CrossRef]
- Zhuang, W.; Gao, X.; Zhang, Y.; Xing, Q.; Tosi, L.; Qin, S. Geochemical Characteristics of Phosphorus in Surface Sediments of Two Major Chinese Mariculture Areas: The Laizhou Bay and the Coastal Waters of the Zhangzi Island. Mar. Pollut. Bull. 2014, 83, 343–351. [Google Scholar] [CrossRef]
- Kang, X.; Song, J.; Yuan, H.; Shi, X.; Yang, W.; Li, X.; Li, N.; Duan, L. Phosphorus Speciation and Its Bioavailability in Sediments of the Jiaozhou Bay. Estuar. Coast. Shelf Sci. 2017, 188, 127–136. [Google Scholar] [CrossRef]
- Van Der Zee, C.; Slomp, C.P.; Van Raaphorst, W. Authigenic P Formation and Reactive P Burial in Sediments of the Nazaré Canyon on the Iberian Margin (NE Atlantic). Mar. Geol. 2002, 185, 379–392. [Google Scholar] [CrossRef]
- Mort, H.P.; Slomp, C.P.; Gustafsson, B.G.; Andersen, T.J. Phosphorus Recycling and Burial in Baltic Sea Sediments with Contrasting Redox Conditions. Geochim. Cosmochim. Acta 2010, 74, 1350–1362. [Google Scholar] [CrossRef]
- Adhikari, P.L.; White, J.R.; Maiti, K.; Nguyen, N. Phosphorus Speciation and Sedimentary Phosphorus Release from the Gulf of Mexico Sediments: Implication for Hypoxia. Estuar. Coast. Shelf Sci. 2015, 164, 77–85. [Google Scholar] [CrossRef]
- Berbel, G.B.B.; Favaro, D.I.T.; Braga, E.S. Impact of Harbour, Industry and Sewage on the Phosphorus Geochemistry of a Subtropical Estuary in Brazil. Mar. Pollut. Bull. 2015, 93, 44–52. [Google Scholar] [CrossRef]
- Acharya, S.S.; Panigrahi, M.K.; Kurian, J.; Gupta, A.K.; Tripathy, S. Speciation of Phosphorus in the Continental Shelf Sediments in the Eastern Arabian Sea. Cont. Shelf Res. 2016, 115, 65–75. [Google Scholar] [CrossRef]
- Puttonen, I.; Kohonen, T.; Mattila, J. Factors Controlling Phosphorus Release from Sediments in Coastal Archipelago Areas. Mar. Pollut. Bull. 2016, 108, 77–86. [Google Scholar] [CrossRef]
- Sudheesh, V.; Movitha, M.; Hatha, A.A.M.; Renjith, K.R.; Resmi, P.; Rahiman, M.; Nair, S.M. Effects of Seasonal Anoxia on the Distribution of Phosphorus Fractions in the Surface Sediments of Southeastern Arabian Sea Shelf. Cont. Shelf Res. 2017, 150, 57–64. [Google Scholar] [CrossRef]
- Ding, D.; Zhang, X.; Yu, J.; Wang, X. Progress in Sedimentary Sources and Palaeoclimate Evolution in Zhejiang-Fujian Mud Area in Holocene. J. Jilin Univ. 2019, 49, 178–195. [Google Scholar]
- Xie, D.; Pan, C.; Wu, X.; Gao, S.; Wang, Z.B. Local Human Activities Overwhelm Decreased Sediment Supply from the Changjiang River: Continued Rapid Accumulation in the Hangzhou Bay-Qiantang Estuary System. Mar. Geol. 2017, 392, 66–77. [Google Scholar] [CrossRef]
- Liu, P.; Yu, Y.; Liu, C. Studies on the Situation of Pollution and Countermeasures of Control of the Oceanic Environment in Zhoushan Fishing Ground—The Largest Fishing Ground in China. Mar. Pollut. Bull. 1991, 23, 288–291. [Google Scholar] [CrossRef]
- Dai, S.B.; Yang, S.L.; Cai, A.M. Impacts of Dams on the Sediment Flux of the Pearl River, Southern China. CATENA 2008, 76, 36–43. [Google Scholar] [CrossRef]
- Zhou, Y.; Huang, X.; Chen, Y.; Zhong, T.; Xu, G.; He, J.; Xu, Y.; Meng, H. The Effect of Land Use Planning (2006–2020) on Construction Land Growth in China. Cities 2017, 68, 37–47. [Google Scholar] [CrossRef]
- Luo, X.X.; Yang, S.L.; Zhang, J. The Impact of the Three Gorges Dam on the Downstream Distribution and Texture of Sediments along the Middle and Lower Yangtze River (Changjiang) and Its Estuary, and Subsequent Sediment Dispersal in the East China Sea. Geomorphology 2012, 179, 126–140. [Google Scholar] [CrossRef]
- Jiang, X.; Lu, B.; He, Y. Response of the Turbidity Maximum Zone to Fluctuations in Sediment Discharge from River to Estuary in the Changjiang Estuary (China). Estuar. Coast. Shelf Sci. 2013, 131, 24–30. [Google Scholar] [CrossRef]
- Xu, G.; Liu, J.; Liu, S.; Wang, Z.; Hu, G.; Kong, X. Modern Muddy Deposit along the Zhejiang Coast in the East China Sea: Response to Large-Scale Human Projects. Cont. Shelf Res. 2016, 130, 68–78. [Google Scholar] [CrossRef]
- Zhang, D.; Liu, X.; Tan, M.; Qian, P.; Si, Y. Flow Field Impact Assessment of a Tidal Farm in the Putuo-Hulu Channel. Ocean Eng. 2020, 208, 107359. [Google Scholar] [CrossRef]
- Cai, L.; Zhou, M.; Liu, J.; Tang, D.; Zuo, J. HY-1C Observations of the Impacts of Islands on Suspended Sediment Distribution in Zhoushan Coastal Waters, China. Remote Sens. 2020, 12, 1766. [Google Scholar] [CrossRef]
- Liu, J.; Zang, J.; Zhao, C.; Yu, Z.; Xu, B.; Li, J.; Ran, X. Phosphorus Speciation, Transformation, and Preservation in the Coastal Area of Rushan Bay. Sci. Total Environ. 2016, 565, 258–270. [Google Scholar] [CrossRef]
- Zheng, L.; Ye, Y.; Zhou, H. Phosphorus Forms in Sediments of the East China Sea and Its Environmental Significance. J. Geogr. Sci. 2004, 14, 113–120. [Google Scholar] [CrossRef]
- Meng, J.; Yao, P.; Yu, Z.; Bianchi, T.S.; Zhao, B.; Pan, H.; Li, D. Speciation, Bioavailability and Preservation of Phosphorus in Surface Sediments of the Changjiang Estuary and Adjacent East China Sea Inner Shelf. Estuar. Coast. Shelf Sci. 2014, 144, 27–38. [Google Scholar] [CrossRef]
- Zhou, F.; Gao, X.; Yuan, H.; Song, J.; Chen, C.-T.A.; Lui, H.-K.; Zhang, Y. Geochemical Forms and Seasonal Variations of Phosphorus in Surface Sediments of the East China Sea Shelf. J. Mar. Syst. 2016, 159, 41–54. [Google Scholar] [CrossRef]
- Yu, Y.; Song, J.; Li, X.; Yuan, H.; Li, N.; Duan, L. Environmental Significance of Biogenic Elements in Surface Sediments of the Changjiang Estuary and Its Adjacent Areas. J. Environ. Sci. 2013, 25, 2185–2195. [Google Scholar] [CrossRef]
- Cong, M.; Jiang, T.; Qi, Y.; Dong, H.; Teng, D.; Lu, S. Phosphorus Forms and Distribution in Zhejiang Coastal Sediment in the East China Sea. Int. J. Sediment Res. 2014, 29, 278–284. [Google Scholar] [CrossRef]
- Yang, B.; Song, G.-D.; Liu, S.-M.; Jin, J. Phosphorus Recycling and Burial in Core Sediments of the East China Sea. Mar. Chem. 2017, 192, 59–72. [Google Scholar] [CrossRef]
- Liu, J.; Krom, M.D.; Ran, X.; Zang, J.; Liu, J.; Yao, Q.; Yu, Z. Sedimentary Phosphorus Cycling and Budget in the Seasonally Hypoxic Coastal Area of Changjiang Estuary. Sci. Total Environ. 2020, 713, 136389. [Google Scholar] [CrossRef] [PubMed]
- Mao, C.; Li, T.; Rao, W.; Tang, Z.; Song, Y.; Wang, S. Chemical Speciation of Phosphorus in Surface Sediments from the Jiangsu Coast, East China: Influences, Provenances and Bioavailabilities. Mar. Pollut. Bull. 2021, 163, 111961. [Google Scholar] [CrossRef] [PubMed]
- Ruttenberg, K.C. Development of a Sequential Extraction Method for Different Forms of Phosphorus in Marine Sediments. Limnol. Oceanogr. 1992, 37, 1460–1482. [Google Scholar] [CrossRef]
- Parker, S.; Chen, X.-G.; Loh, P.S.; He, S.; Jin, A.-M.; Zhao, J.; Li, Z.; Chen, J.; Sun, Y.; Chen, J. Oceanographic and human impacts on the composition of sedimentary organic matter along the southern coast of Zhoushan. J. Mar. Syst. 2022, 227, 103681. [Google Scholar] [CrossRef]
- Loh, P.S.; Huang, X.-R.; Ying, C.-Y.; Hu, J.; Lou, Z.-H.; Chen, X.-G.; He, S.; Jiang, Z.-P.; Jin, A.-M. Sources, distribution and bioavailability of sedimentary phosphorus species in coastal areas off Changjiang Estuary. SN Appl. Sci. 2020, 2, 1280. [Google Scholar] [CrossRef]
- Norton, S.A.; Coolidge, K.; Amirbahman, A.; Bouchard, R.; Kopáček, J.; Reinhardt, R. Speciation of Al, Fe, and P in Recent Sediment from Three Lakes in Maine, USA. Sci. Total Environ. 2008, 404, 276–283. [Google Scholar] [CrossRef]
- Yang, B.; Lan, R.-Z.; Lu, D.-L.; Dan, S.F.; Kang, Z.-J.; Jiang, Q.-C.; Lan, W.-L.; Zhong, Q.-P. Phosphorus Biogeochemical Cycling in Intertidal Surface Sediments from the Maowei Sea in the Northern Beibu Gulf. Reg. Stud. Mar. Sci. 2019, 28, 100624. [Google Scholar] [CrossRef]
- Hiriart-Baer, V.P.; Milne, J.E.; Marvin, C.H. Temporal Trends in Phosphorus and Lacustrine Productivity in Lake Simcoe Inferred from Lake Sediment. J. Great Lakes Res. 2011, 37, 764–771. [Google Scholar] [CrossRef]
- Zhang, Y.; Gao, X.; Wang, C.; Chen, C.-T.A.; Zhou, F.; Yang, Y. Geochemistry of Phosphorus in Sediment Cores from Sishili Bay, China. Mar. Pollut. Bull. 2016, 113, 552–558. [Google Scholar] [CrossRef] [PubMed]
- Ni, J.; Lin, P.; Zhen, Y.; Yao, X.; Guo, L. Distribution, Source and Chemical Speciation of Phosphorus in Surface Sediments of the Central Pacific Ocean. Deep Sea Res. Part I Oceanogr. Res. Pap. 2015, 105, 74–82. [Google Scholar] [CrossRef]
- Sekula-Wood, E.; Benitez-Nelson, C.R.; Bennett, M.A.; Thunell, R. Magnitude and Composition of Sinking Particulate Phosphorus Fluxes in Santa Barbara Basin, California. Glob. Biogeochem. Cycles 2012, 26, 2011GB004180. [Google Scholar] [CrossRef]
- Andrieux-Loyer, F.; Aminot, A. Phosphorus Forms Related to Sediment Grain Size and Geochemical Characteristics in French Coastal Areas. Estuar. Coast. Shelf Sci. 2001, 52, 617–629. [Google Scholar] [CrossRef]
- Souza, G.K.; Kuroshima, K.N.; Abreu, J.G.N.; Manzoni, G.C. Speciation and Distribution of Sedimentary Phosphorus in an Important Mariculture Area, Armação Do Itapocoroy Bay, Southern Brazil. Reg. Stud. Mar. Sci. 2022, 49, 102137. [Google Scholar] [CrossRef]
- Xu, F.; Ji, Z.; Wang, K.; Jin, H.; Loh, P.S. The Distribution of Sedimentary Organic Matter and Implication of Its Transfer from Changjiang Estuary to Hangzhou Bay, China. OJMS 2016, 06, 103–114. [Google Scholar] [CrossRef]
- Alongi, D.M. Carbon Payments for Mangrove Conservation: Ecosystem Constraints and Uncertainties of Sequestration Potential. Environ. Sci. Policy 2011, 14, 462–470. [Google Scholar] [CrossRef]
- Ishii, Y.; Harigae, S.; Tanimoto, S.; Yabe, T.; Yoshida, T.; Taki, K.; Komatsu, N.; Watanabe, K.; Negishi, M.; Tatsumoto, H. Spatial Variation of Phosphorus Fractions in Bottom Sediments and the Potential Contributions to Eutrophication in Shallow Lakes. Limnology 2010, 11, 5–16. [Google Scholar] [CrossRef]
- Nürnberg, G.K. Prediction of Phosphorus Release Rates from Total and Reductant-Soluble Phosphorus in Anoxic Sediments. Can. J. Fish. Aquat. Sci. 1988, 45, 453–462. [Google Scholar] [CrossRef]
- Roy, E.D.; Nguyen, N.T.; Bargu, S.; White, J.R. Internal Loading of Phosphorus from Sediments of Lake Pontchartrain (Louisiana, USA) with Implications for Eutrophication. Hydrobiologia 2012, 684, 69–82. [Google Scholar] [CrossRef]
- Paytan, A.; McLaughlin, K. The Oceanic Phosphorus Cycle. Chem. Rev. 2007, 107, 563–576. [Google Scholar] [CrossRef]
- Coelho, J.P.; Flindt, M.R.; Jensen, H.S.; Lillebø, A.I.; Pardal, M.A. Phosphorus Speciation and Availability in Intertidal Sediments of a Temperate Estuary: Relation to Eutrophication and Annual P-Fluxes. Estuar. Coast. Shelf Sci. 2004, 61, 583–590. [Google Scholar] [CrossRef]
- Oxmann, J.F.; Schwendenmann, L. Authigenic Apatite and Octacalcium Phosphate Formation Due to Adsorption–Precipitation Switching across Estuarine Salinity Gradients. Biogeosciences 2015, 12, 723–738. [Google Scholar] [CrossRef]
- Redfield, A.C.; Ketchum, B.H.; Richards, F.A. The Influence of Organisms on the Composition of Sea-Water. In The Sea, Volume 2: The Composition of Sea-Water; Comparative and Descriptive Oceanography; Harvard University Press: Cambridge, MA, USA, 1963. [Google Scholar]
- Ruttenberg, K.C.; Gofii, M.A. Phosphorus Distribution, C:N:P Ratios, and 613C,, in Arctic, Temperate, and Tropical Coastal Sediments: Tools for Characterizing Bulk Sedimentary Organic Matter. Mar. Geol. 1997, 139, 123–145. [Google Scholar] [CrossRef]
- Zhu, Z.-Y.; Zhang, J.; Wu, Y.; Zhang, Y.-Y.; Lin, J.; Liu, S.-M. Hypoxia off the Changjiang (Yangtze River) Estuary: Oxygen Depletion and Organic Matter Decomposition. Mar. Chem. 2011, 125, 108–116. [Google Scholar] [CrossRef]
- Wu, H.P.; Zeng, G.M.; Liang, J.; Zhang, J.C.; Cai, Q.; Huang, L.; Li, X.D.; Zhu, H.N.; Hu, C.X.; Shen, S. Changes of soil microbial biomass and bacterial community structure in Donting Lake: Impacts of 50,000 dams of Yangtze River. Ecol. Eng. 2013, 57, 72–78. [Google Scholar] [CrossRef]
- Loh, P.S.; Cheng, L.-X.; Yuan, H.-W.; Yang, L.; Lou, Z.-H.; Jin, A.-M.; Chen, X.-G.; Lin, Y.-S.; Chen, C.-T.A. Impacts of human activity and extreme weather events on sedimentary organic matter in the Andong salt marsh, Hangzhou Bay, China. Cont. Shelf Res. 2018, 154, 55–64. [Google Scholar] [CrossRef]
- Liu, Q.; Ding, S.; Chen, X.; Sun, Q.; Chen, M.; Zhang, C. Effects of Temperature on Phosphorus Mobilization in Sediments in Microcosm Experiment and in the Field. Appl. Geochem. 2018, 88, 158–166. [Google Scholar] [CrossRef]
- Tammeorg, O.; Nürnberg, G.K.; Tõnno, I.; Toom, L.; Nõges, P. Spatio-Temporal Variations in Sediment Phosphorus Dynamics in a Large Shallow Lake: Mechanisms and Impacts of Redox-Related Internal Phosphorus Loading. Sci. Total Environ. 2024, 907, 168044. [Google Scholar] [CrossRef] [PubMed]
- Yang, B.; Gao, X.; Zhao, J.; Liu, Y.; Gao, T.; Lui, H.-K.; Huang, T.-H.; Chen, C.-T.A.; Xing, Q. The Influence of Summer Hypoxia on Sedimentary Phosphorus Biogeochemistry in a Coastal Scallop Farming Area, North Yellow Sea. Sci. Total Environ. 2021, 759, 143486. [Google Scholar] [CrossRef] [PubMed]
- Li, H.; Song, C.-L.; Cao, X.-Y.; Zhou, Y.-Y. The Phosphorus Release Pathways and Their Mechanisms Driven by Organic Carbon and Nitrogen in Sediments of Eutrophic Shallow Lakes. Sci. Total Environ. 2016, 572, 280–288. [Google Scholar] [CrossRef] [PubMed]
- Cao, X.; Wang, Y.; He, J.; Luo, X.; Zheng, Z. Phosphorus Mobility among Sediments, Water and Cyanobacteria Enhanced by Cyanobacteria Blooms in Eutrophic Lake Dianchi. Environ. Pollut. 2016, 219, 580–587. [Google Scholar] [CrossRef]
- Wang, J.; Bai, X.; Li, W.; Zhang, P.; Zhang, M.; Wang, H.; Bai, Y. Variations of Sediment Organic Phosphorus and Organic Carbon during the Outbreak and Decline of Algal Blooms in Lake Taihu, China. J. Environ. Sci. 2024, 139, 34–45. [Google Scholar] [CrossRef]

Disclaimer/Publisher’s Note: The statements, opinions and data contained in all publications are solely those of the individual author(s) and contributor(s) and not of MDPI and/or the editor(s). MDPI and/or the editor(s) disclaim responsibility for any injury to people or property resulting from any ideas, methods, instructions or products referred to in the content. |
© 2024 by the authors. Licensee MDPI, Basel, Switzerland. This article is an open access article distributed under the terms and conditions of the Creative Commons Attribution (CC BY) license (https://creativecommons.org/licenses/by/4.0/).
Share and Cite
Loh, P.S.; He, J.; Feng, S.; Wang, Y.; Chen, Z.; Guo, C.; He, S.; Chen, X.-G.; Jin, A.-M.; Sun, Y.; et al. Chemical Speciation and Preservation of Phosphorus in Sediments along the Southern Coast of Zhoushan Island. Water 2024, 16, 2225. https://doi.org/10.3390/w16162225
Loh PS, He J, Feng S, Wang Y, Chen Z, Guo C, He S, Chen X-G, Jin A-M, Sun Y, et al. Chemical Speciation and Preservation of Phosphorus in Sediments along the Southern Coast of Zhoushan Island. Water. 2024; 16(16):2225. https://doi.org/10.3390/w16162225
Chicago/Turabian StyleLoh, Pei Sun, Jianjie He, Shida Feng, Yijin Wang, Zengxuan Chen, Chuanyi Guo, Shuangyan He, Xue-Gang Chen, Ai-Min Jin, Yuxia Sun, and et al. 2024. "Chemical Speciation and Preservation of Phosphorus in Sediments along the Southern Coast of Zhoushan Island" Water 16, no. 16: 2225. https://doi.org/10.3390/w16162225
APA StyleLoh, P. S., He, J., Feng, S., Wang, Y., Chen, Z., Guo, C., He, S., Chen, X.-G., Jin, A.-M., Sun, Y., Chen, J., Zhao, J., Li, Z., & Chen, J. (2024). Chemical Speciation and Preservation of Phosphorus in Sediments along the Southern Coast of Zhoushan Island. Water, 16(16), 2225. https://doi.org/10.3390/w16162225