Article

Evaluating Empirical, Field, and Laboratory Approaches for Estimating the Hydraulic Conductivity in the Kabul Aquifer

by
Alimahdi Mohammaddost
1,2,
Zargham Mohammadi
1,*,
Javad Hussainzadeh
2,
Asadullah Farahmand
3,
Vianney Sivelle
4 and
David Labat
5
1
Department of Earth Sciences, Faculty of Sciences, Shiraz University, Shiraz 7146713565, Iran
2
Department of Geology, Faculty of Sciences, Ferdowsi University of Mashhad, Mashhad 9177948974, Iran
3
Department of Hydrogeology, Ministry of Energy and Water, Kabul 1004, Afghanistan
4
HSM, Univ Montpellier, CNRS, IRD, 34093 Montpellier, France
5
University of Toulouse 3-Department of Geosciences and Environment Toulouse-CNRS-UT3-IRD, 31400 Toulouse, France
*
Author to whom correspondence should be addressed.
Water 2024, 16(15), 2204; https://doi.org/10.3390/w16152204
Submission received: 15 July 2024 / Revised: 30 July 2024 / Accepted: 31 July 2024 / Published: 3 August 2024
(This article belongs to the Section Hydrogeology)

Abstract

:
The evaluation of saturated hydraulic conductivity (Ks) constitutes an invaluable tool for the management and protection of groundwater resources. This study attempted to estimate Ks in the shallow aquifer of Kabul City, Afghanistan, in response to the occurring groundwater crisis caused by overexploitation and a lack of an appropriate monitoring system on pumping wells, based on datasets from well drilling logs, various analytical methods for pumping test analyses, and laboratory-based methodologies. The selection of Ks estimation methods was influenced by data availability and various established equations, including Theis, developed by Cooper–Jacob, Kruger, Zamarin, Zunker, Sauerbrei, and Chapuis, and pre-determined Ks values dedicated to well log segments exhibited the highest correlation coefficients, ranging between 60% and 75%, with the real conditions of the phreatic aquifer system with respect to the drawdown rate map. The results successfully obtained local-specific quantitative Ks value ranges for gravel, sand, silt, clay, and conglomerate. The obtained results fall within the high range of Ks classification, ranging from 30.0 to 139.8 m per day (m/d) on average across various calculation methods. This study proved that the combination of pumping test results, predetermined values derived from empirical and laboratory approaches, geological description, and classified soil materials and analyses constitutes reliable Ks values through cost-effective and accessible results compared with conducting expensive tests in arid and semi-arid areas.

1. Introduction

Saturated hydraulic conductivity (Ks) is one of the most important soil physical characteristics and quantifies the flow of water through porous media under a hydraulic gradient as specified by the Darcy equation for saturated conditions, introduced for the first time in 1956 by Henry Darcy [1,2,3,4,5,6]. A precise determination of this parameter is of great importance in hydrogeological and hydrological studies, designing drainage systems, recharge, and pollutant transport studies. The estimation of hydraulic conductivity Ks is thus crucial for the area, which has a limited groundwater resource and an unfavorable balance between water demands and availability. This parameter serves as a fundamental indicator of the area’s potential to manage its groundwater resources. Accurate characterization and prediction of Ks values usually require an accurate parameterization of soil hydraulic properties (i.e., water retention curve of soil) [7,8,9]. Moreover, although the outcomes of direct measurements such as pumping tests play an important role in assessing hydraulic conductivity, the results often entail substantial costs for groundwater systems, and the process is time-consuming and labor-intensive. However, the field methods are often limited by the lack of precise and detailed parameters of the aquifer system [10]. Hence, considering several methods could be a reliable process to obtain optimum estimates of Ks and quantify its uncertainties to protect and manage the aquifers [11]. Based on the available data on the aquifer system, numerous empirical [12,13,14,15], semi-physical [16], and physical [13] approaches have been introduced.
On one hand, a few low-cost methods based on the well log data and characteristics of soil types and conventional methods such as pumping well tests have been frequently implemented in the literature. The most conventional methods for evaluating unconfined aquifer parameters are Neuman, Theis, and Cooper–Jacob equations based on pumping test data [17,18]. On the other hand, the laboratory approaches are implemented by using soil samples, which frequently include Hazen, Kozeny–Carman, and Terzaghi equations. In addition, a few empirical equations also suggest a correlation between Ks and particle sizes of materials, void ratio, effective porosity, and groundwater temperature. Although the determination of the particle size of unconsolidated sediments is difficult and, subsequently, no reliable porosity and tortuosity data are obtained based on the particle size, most of the empirical equations are still based on these characteristics of soil [19,20]. Furthermore, the literature states that using a large number of equations leads to a positive correlation between Ks values and the scale of measurement. In other words, as the amount and complexity of input parameters of data in computational methods for hydraulic conductivity increase, the resulting values of hydraulic conductivity also tend to be greater, providing a range of uncertainties among the mathematical methods for estimating Ks [21,22].
The groundwater overexploitation and lack of a proper monitoring system on pumping wells, including unknown well constructions and poor estimation of the actual abstracted volume, and, at the same time, the growth of urban sprawl in the shallow aquifer of Kabul, Afghanistan, have caused a crisis in the groundwater system in this region. It seems that evaluating Ks using indirect methods (e.g., empirical equations) constitutes an alternative to helping in the reliable management of the Kabul aquifer and preventing the further degradation of the aquifer system. In this regard, all the available data have been gathered to obtain a reliable dataset. The objectives of this study are (1) estimating and predicting Ks using pumping tests, geological well logs, and grain-sized distribution based on conventional approaches; (2) validating and comparing the results obtained from these methods; and (3) reviewing and suggesting a low-cost and accessible approach to obtain Ks.

2. Study Area

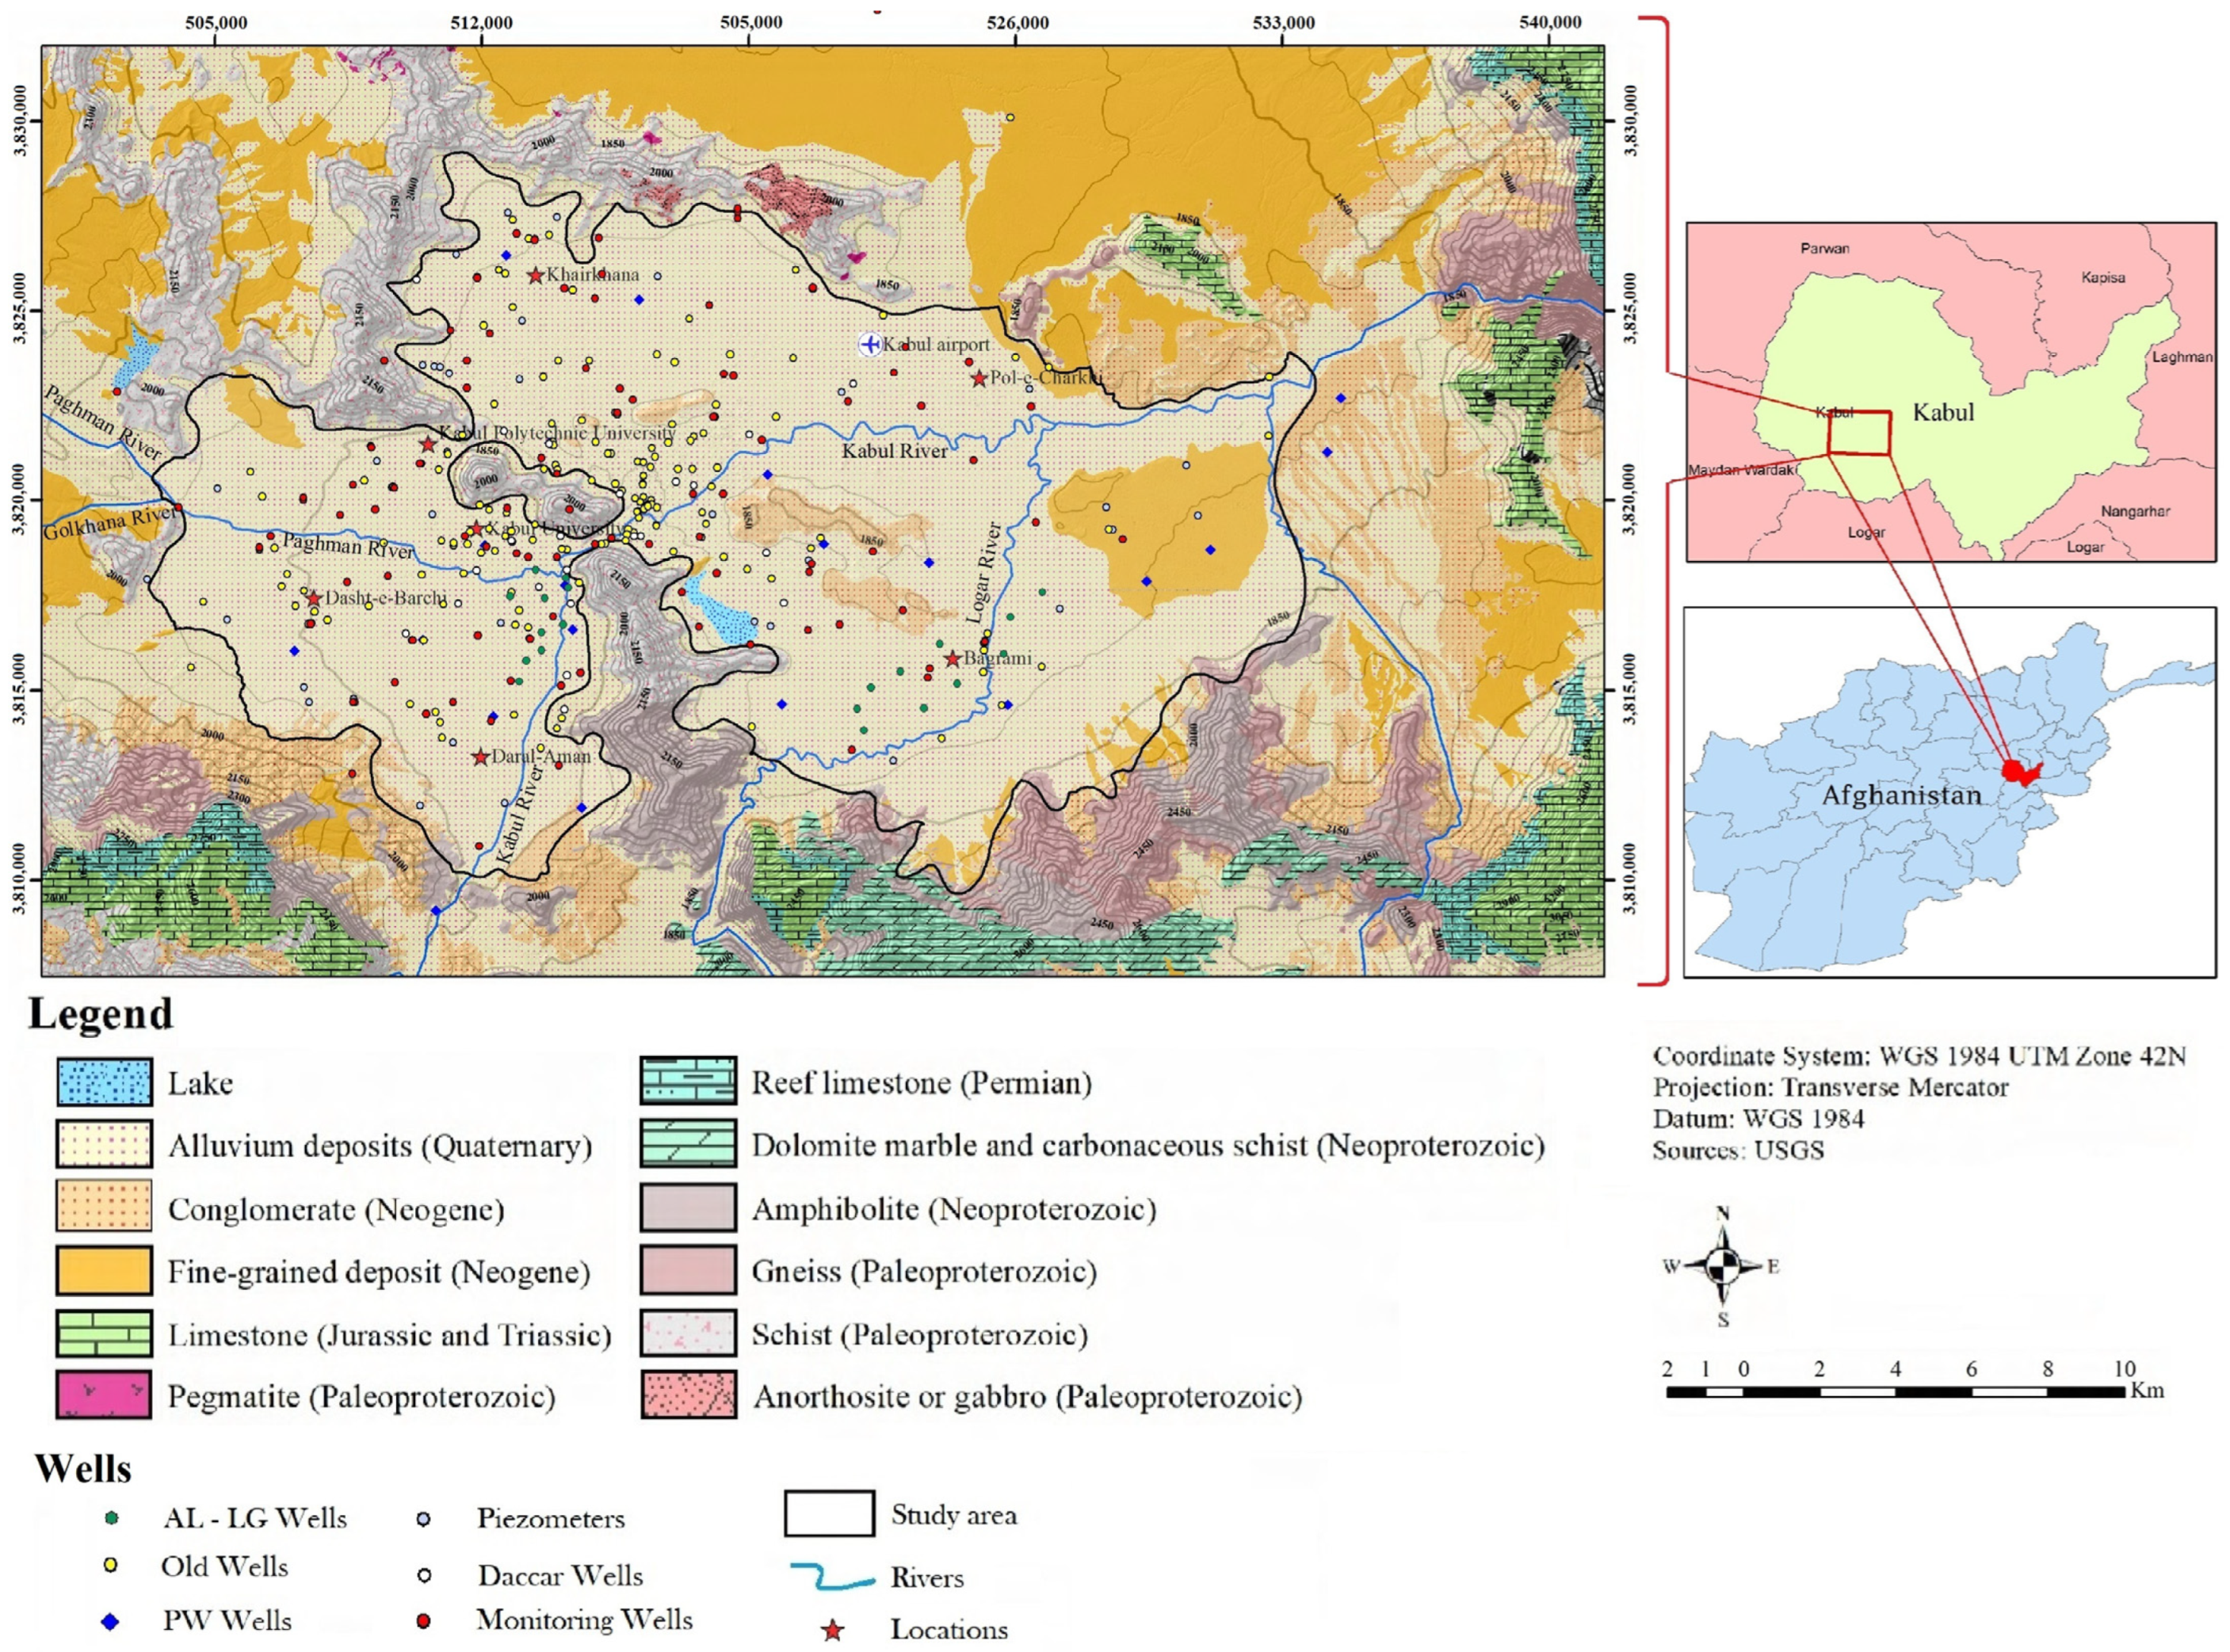
Kabul City is located in the middle part of the Kabul Plain, the capital of Afghanistan, and is between 69°02′08″–69°22′27″ E longitude and 34°25′36″–34°36′13″ N latitude with a 329 km2 coverage (Figure 1). The urban population grew approximately from 1 million in the late 1990s to 5.38 million in the current era. The decrease in fresh water and the consequent decrease in water quality have caused major social and health problems, including increased migration as a result of rising desperation and the occurrence of water-related diseases in recent years [23,24,25,26,27]. The city is split by steep metamorphic mountain ranges into two plains, in which the dividing mountain ranges are the Asmai and Shir Darwaza mountains, the eastern part is bounded by the Kohe Safi mountains, and the western part is surrounded by the Paghman mountains, reaching approximately 2770 m, 3000 m, and 4400 m in altitude, respectively [28,29]. Both plains are filled by Neogene and Quaternary deposits.

2.1. Climate

The study area is characterized by an arid and semi-arid climate, and based on data calculations of four synoptic stations, Naghlo, Payin-i-Qargha, Qala-i-Malek, and Tang-i-Sayedan, the air temperature is in the range of −7 to 32 °C. The winters show a decrease to −7 °C, and the summers a rise to 32 °C. The mean annual precipitation is 330 mm [29].

2.2. Geological and Hydrogeological Setting

The metamorphic mountain ranges include Amphibolite, Gneiss, and Schist types; moreover, sedimentary rocks such as Limestone and Dolomite have also been recognized around the study area [30,31,32]. The expletive sediments have originated from mountain and river sediments, which are generally composed of sand and grain-sized gravel with a mixture of clay and silt, which are covered by slightly loose deposits in the upper part.
Based on previous studies, the geological setting strongly constrains the hydrogeology, where water bodies are associated with distinct geological units over the area; therefore, the sediments have formed a phreatic aquifer (named as an unconfined or shallow aquifer) in the Quaternary age with a thickness of up to 80.0 m and also a deep aquitard (named as a confined or deep aquifer) based on the lower Neogene deposits, and there is an upper Neogene aquiclude, where, lately, Landell Mills represented it as an aquitard (named also as confining layer) between the two aquifers. The thicknesses of three layers are approximately 45.0–80.0 m, 260.0–360.0 m, and 160.0–255.0 m [25,29,33]. After the shallow aquifer, the depth of the upper Neogene varies and starts from 0.1 to 400.0 m from the ground surface, and similarly, the lower Neogene has been recognized to be in the range of 90.0–700.0 m to the metamorphic bedrock from the ground surface. The lowest permeability is related to the upper Neogene layer, which has outcrops in the Bibi Mahro and Kart-e-Now areas. Well, logs, and outcrops have shown that the upper Neogene layer consists of conglomerates, sandstone, mudstone, and consolidated clay. The permeability rates indicate that the upper Neogene has no potential to be an aquifer [25]; hence, in this study, it is considered a confining layer. This study focuses on the shallow aquifer.
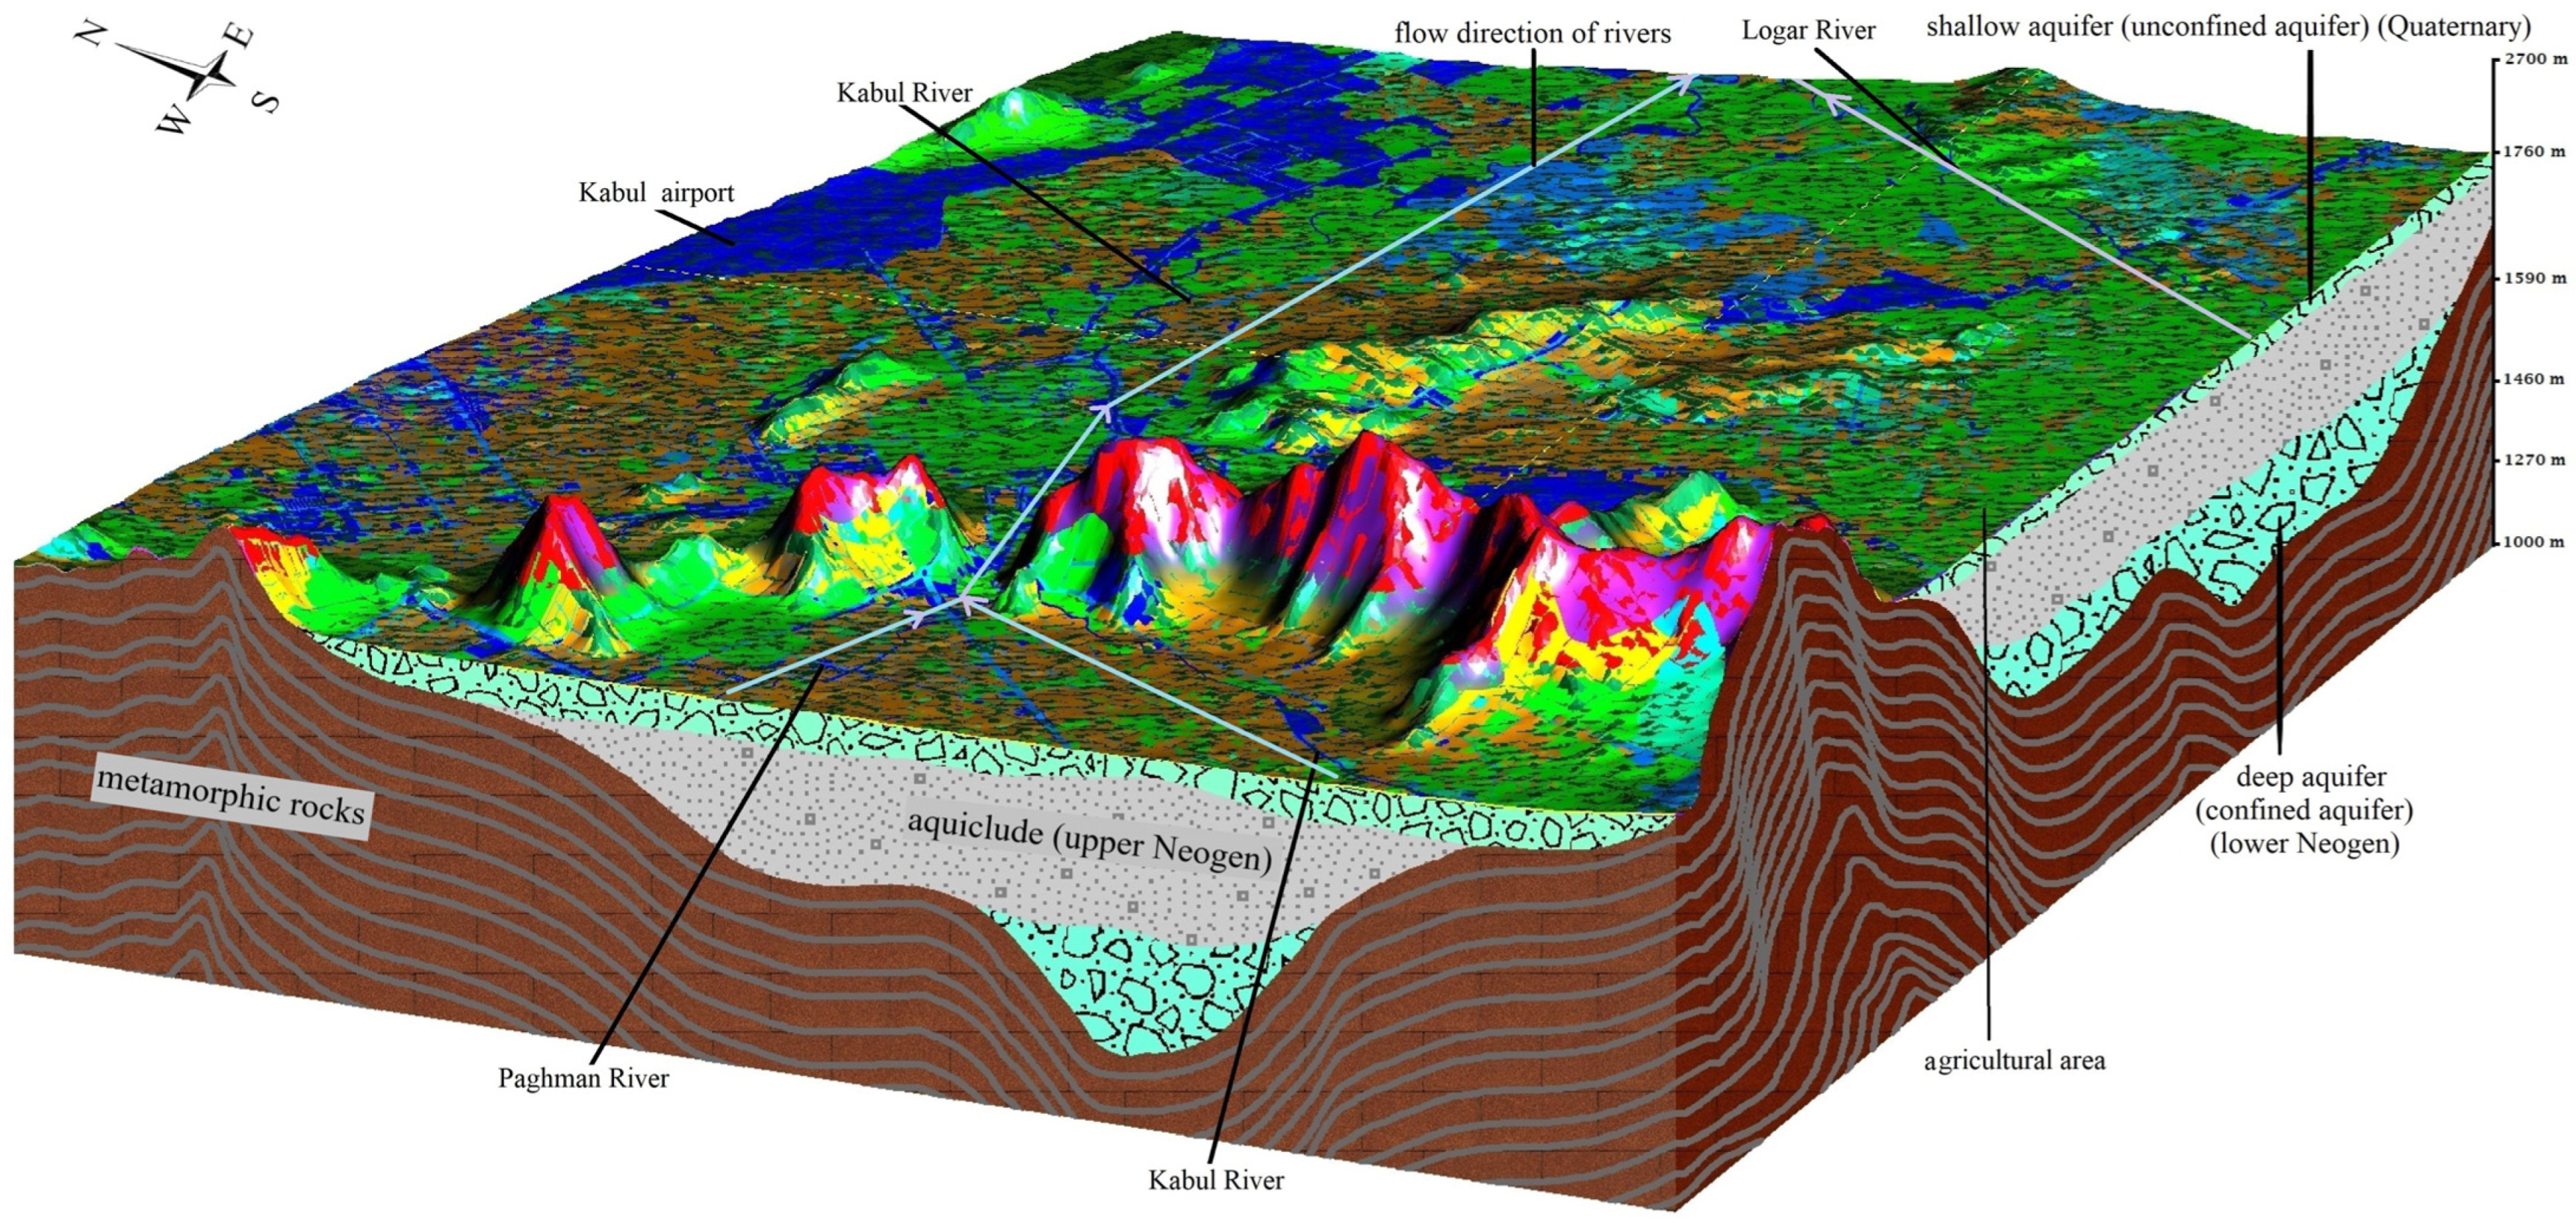
Four rivers are present in the study area: Kabul, Logar, Golkhana, and Paghman Rivers. The general direction of the Paghman River is from the western to the eastern parts the Kabul Plain. The Kabul River first flows north, and then joins Paghman in entering the eastern plain. The Logar River flows from south to east and, together with the Kabul and Paghman Rivers, they form the surface water of the eastern plain of the study area. The riverbeds have the highest permeability and represent the main recharge sources of the shallow aquifer, which has a huge drainage catchment area before entering Kabul City. The fluctuation of the groundwater level and discharge has proved that there is a direct relationship between them (Figure 2). The highest discharge rates of all the rivers are observed in April, whereas the lowest discharge rates are observed in July to September.
Figure 1. The geological map of the study area [30,34].
Water 16 02204 g001
According to Bakh (1971) [35], 84.5% of the recharge rate and, according to the JICA (2011), 85.2% of the shallow aquifer of Kabul are related to the recharge from the rivers. Due to overexploitation, the overall water balance of shallow aquifers is extremely negative [33]. Moreover, the rate of river discharge represents the amount of rainfall during the time period. As Figure 2 shows, the discharge rates of rivers were 6.4 meter3/second (m3/s), 4.3 m3/s, and 2.0 m3/s in 2017, 2018 and 2019 on average, respectively, declining continuously, showing climate changes (appearance of drought period) in the catchment areas of the rivers entering Kabul City. Since the main recharge source of a shallow aquifer is a river, decreasing discharge rate leads to the depletion of the groundwater level. The impact of this cycle, along with overexploitation, has caused a severe drawdown. The drawdown rate in the weighted average hydrograph of the shallow aquifer of Kabul was detected to be up to 7.3 m in 3 years from the water year 2016 to 2019 (Figure 2). The weighted average hydrograph has been calculated from 70 monitoring wells by using the Thiessen polygon method in the GIS environment. Due to the lack of proper monitoring and the urban sprawl, thousands of hand-dug water wells have been installed in the last decades, and most of them have not been detected and monitored yet. Furthermore, it is worth mentioning that the abstracted volume is unknown and cannot be calculated exactly.
Both plains have almost similar general groundwater flow, which is from the west and southwest toward the east. The groundwater temperature varies, changing within the range of 10–26° during the year, and the mean groundwater temperature is considered to be approximately 16 °C all over the study area.

3. Materials and Methods

3.1. Data Used

The available data are described in detail in Table 1 and Figure 1. This study is based on two datasets: (1) descriptive well log data from pumping wells and observation wells and (2) quantitative data from pumping tests, storage capacity of wells, and reported hydraulic conductivity from previous studies. This study has a scope of 362 wells, including 20, 38, 169, 29, 23, and 83 wells, the dataset names for AL-LG, piezometers, old wells, PW, Danish Committee for Aid to Afghan Refugees (DACAAR), and monitoring wells, respectively. To understand the hydrogeological setting of the study area, by using shallow and exploration well logs, a simplified conceptual model has been created (Figure 3). By reclassifying the well log data, the thickness of each class of well logs has been used to obtain a general sight of the Ks values and understand the role of aquifer particle size. As Table 2 illustrates, the aquifer has a complicated matrix, which could have resulted in various Ks values. Moreover, based on the particle size of aquifer media, including 20.5%, 14.8%, and 22.2% of gravel, sand, and silt, respectively, it is expected that the Ks values would be in the medium to high ranges. All data used are provided by the Ministry of Energy and Water (MEW), 2019. The data on AL-LG, piezometric, PW, DACAAR, old, and monitoring wells were collected in 2008–2010, 2018–2019, 2018–2019, 2011, 1980s, and 2007–2020, respectively.
Regarding the classification of wells, three approaches—including field, empirical, and laboratory—were considered, engaging the pumping test and specific capacity data, soil and geological descriptions of wells, and soil analysis from AL-LG and old, PW, AL-LG, old, and piezometric, and AL-LG wells.

3.2. Methodology

To evaluate the saturated hydraulic conductivity Ks, the datasets were classified according to the availability of a pumping test and well log (geological unit and US soil classification) data. Based on the results shown in Table 1, the complete datasets are related to AL and LG wells, where data, including two types of pumping test based on the type of aquifer and two categories of well log data based on laboratory and field observations and also sieve analysis of the wells soil, are available. Hence, all the Ks calculations for the AL and LG wells were performed by considering four steps; the first one consists in the determination of Ks values from constant and step-drawdown pumping test data. The second step is based on comparing pumping test results with the reported Ks values in the literature for the geological units; a value of Ks for each segment of well logs was calculated. The third step was extended by assigning and averaging obtained Ks values from the previous step for each segment of US soil classification (SCU) for well logs. Finally, the fourth step allowed us to obtain Ks values from the sieve analysis based on 15 different methods. In addition to the five calculation methods mentioned (including constant and step-drawdown pumping tests, Ks values from the sieve analysis methods, and Ks values from simplified geological units and each segment of US soil classification (SCU)), this study also compares Ks calculations derived from the aquifer’s storage capacity using old well data (169 wells) and reported Ks values from previous studies (23 DACAAR wells) with the results obtained. The theories and basic details are mentioned in the following section. Figure 4 represents the methodology flowchart of this study.

3.2.1. Field Methods

The solution methods used for calculating Ks in this section are divided into four parts, offering equations for (i) confined and (ii) unconfined aquifers, (iii) recovery data, and (iv) specific capacity data.
This method has been frequently used to calculate hydrogeological parameters of an aquifer, derived from an unsteady flow for a confined aquifer and lately developed for a variable rate pumping test with recovery data (Supplementary Equations (S1)–(S4)) [36]. The step-drawdown pumping test is more suitable for a single-well pumping test under variable discharge rates in a confined aquifer. The most common computation method is the Theis solution, but it is assumed for an unsteady flow in a confined aquifer (Supplementary Equations (S5)–(S8)) [36]. The Cooper–Jacob solution (1946) [37], developed by Birsoy and Summers (1980) [38], allows for estimating the hydrogeological properties of aquifers under variable discharge rates (Supplementary Equations (S9)–(S13)), considered for both constant-rate and step-drawdown rate pumping tests. It is noteworthy that each step of the step-drawdown rate pumping test was engaged as a separate constant rate pumping test.
The solutions for unconfined aquifers are more complex. The Neuman solution has been selected, presenting a homogeneous, anisotropic unconfined aquifer with delayed gravity response (Supplementary Equations (S14)–(S18)) [39,40]. Unlike the Neuman method, the Tartakovsky–Neuman solution for an unconfined aquifer considers non-instantaneous drainage to the saturated zone. Additionally, it has a parameter (kD) that represents an unsaturated medium (Supplementary Equations (S19)–(S27)) [41]. The Theis (1935) and Cooper–Jacob (1946) [36,37] solutions can be used on unconfined aquifers through the correction of drawdown data (Supplementary Equation (S28)) [42].
To calculate storativity and transmissivity (T (L2/T)) from a recovery database on both the Theis and Cooper–Jacob solutions, Birsoy and Summer (1980) [38] proposed that the calculation of residual drawdown after N constant rate steps in a pumping test is useful (Supplementary Equations (S29)–(S35)).
The last equation used in this section is the empirical equation of Razack and Huntley, rearranged and developed by the Theis method, to calculate transmissivity from specific capacity [43,44] (Supplementary Equation (S36)).

3.2.2. Laboratory Methods

Almost all of the laboratory methods’ aim is to quantify hydraulic conductivity, and in this regard, a huge effort has been applied in developing a variety of equations. Most of these efforts have focused on the correlation between the grain size of materials and the Ks value, and due to having unreliable factors or factors with uncertain values and nature and even lack of accurate values, such as grain shape, porosity, and pore-water pressure, it is not surprising that there is a failure run in applying them as a full representation of the Ks value. In other words, the limitations of Ks calculation from grain size have caused the use of a package of methods. Based on the availability and economical methods [2,12,45,46,47,48,49,50,51,52,53,54,55,56,57], Devlin (2015) [58] developed a package on the Microsoft Visual Basic® code based on the reports of Vukovic and Soro (1992), named HydrogeoSieveXL, which works on an Excel environment, including 15 mentioned methods in this part. The HydrogeoSieveXL validity results showed that the Ks values are perfectly matched with those of Vukovic and Soro (1992) and Odong (2013) [50,59]; moreover, Maurya (2018), Cormican et al., (2018), Lin (2021), and Lévy (2022) [60,61,62,63] have successfully applied this package in their studies. The details of the methods are represented in Table S1. In this study, the HydrogeoSieveXL tool was used to obtain a reliable Ks value for the alluvial aquifer and match the results with other methods in Section 3.2.1 and Section 3.2.3 of the methodology.

3.2.3. Empirical Methods

In this case, countless attempts have been made, and the concept of these methods has relied on numerous parameters, such as drawdown rate, particle size, genus of lithological units, and tectonic effects, among others. A database was developed by the StructX website to determine soil properties, particularly Ks values. The data are mainly extracted from the studies of Seth (1998), Lewis et al., (2006), Hwang et al., (2017), Duffield (2019) [64,65,66,67], and the United States Department of Agriculture, Natural Resources Conservation Service (USDA NRCS) (n.d.) [68]. Hence, the section for hydraulic conductivity and permeability of various soil types (structx.com), combined with reported results by Widido et al. (2017) [69], has been used to obtain and allocate Ks value ranges for soil material and, in some cases of geological units, to compare with other mentioned methods.

3.3. Map Generation

Geographic Information Systems (GISs) are essential for spatial analysis, especially in interpolation methods that estimate unknown values from known data points. Among these methods, Inverse Distance Weighting (IDW) is straightforward, while Kriging offers a more sophisticated approach by incorporating both distance and variation among data points. IDW assigns weights to sample points inversely proportional to the distance from the prediction location, influenced by a power parameter [70,71,72]. Kriging, on the other hand, integrates spatial autocorrelation to provide the Best Linear Unbiased Prediction (BLUP), considering both distance and spatial arrangement [73,74,75]. Spatial structuration in Kriging involves understanding spatial relationships between data points, including anisotropy and its orientation, to recognize the range and direction of spatial continuity. This is done by plotting variograms in different directions to identify the direction with the greatest range [76]. The experimental variogram, a core tool in Kriging, represents spatial dependence between sample points by calculating semivariance and modeling variograms. This process involves computing average squared differences between data values at various lag distances and plotting them against the lag distance [77,78], then fitting a theoretical model, such as spherical, exponential, or Gaussian, to represent spatial continuity [79,80]. This paper uses the application of IDW and Kriging methods in GIS to produce Ks maps, focusing on data preparation for geostatistical analysis, spatial structuration, anisotropy, and model fitting to calibrate and validate estimated Ks through various methods that are mentioned in Section 3.2 of Methodology.

4. Results

4.1. Field Method

Pumping tests are commonly regarded as the primary and fundamental method for determining Ks values, yet achieving a consistent and reliable outcome poses a challenge; hence, all methods described in Section 3.2.1 were applied to both step-drawdown and variable rate pumping tests of AL-LG wells. The results obtained have been utilized in subsequent sections with detailed explanations of their application. Despite the shallow aquifer being a phreatic aquifer, the majority of drawdown-time series curves of pumping test data indicate that the phreatic aquifer is treated similarly as a confined aquifer. This observation may be related to the high transmissivity (T) (100–1000 m2/d) [81] of the aquifer media since the drawdown rates, in contrast with aquifer thickness, were negligible in most tests ((maximum drawdown (sM)/saturated thickness (m)) × 100 < 10 [82,83] (also see Supplementary Equation (28)). Therefore, by prioritizing, the involvement of dedicated equations of confined aquifers such as Theis and Cooper–Jacob in obtaining T and Ks for an unconfined aquifer is allowed [36]. Moreover, there are instances where the drawdown–time curves exhibit poor congruence with the curves designated by methods such as Neuman, resulting in outputs that are unsuitable for utilization in subsequent estimations. All pumping tests were performed by a single-well method, with calculations carried out automatically and manually using AQTESOLV and Excel software in versions of 4.5 DEMO and 2013 [58,84,85,86,87], respectively. It is worth mentioning that the Ks calculations through a specific capacity are represented in Section 4.2.2. The boundary conditions used in AQTESOLV were limited to full penetration and a single-well pumping test wizard.

4.1.1. AL-LG Well Results

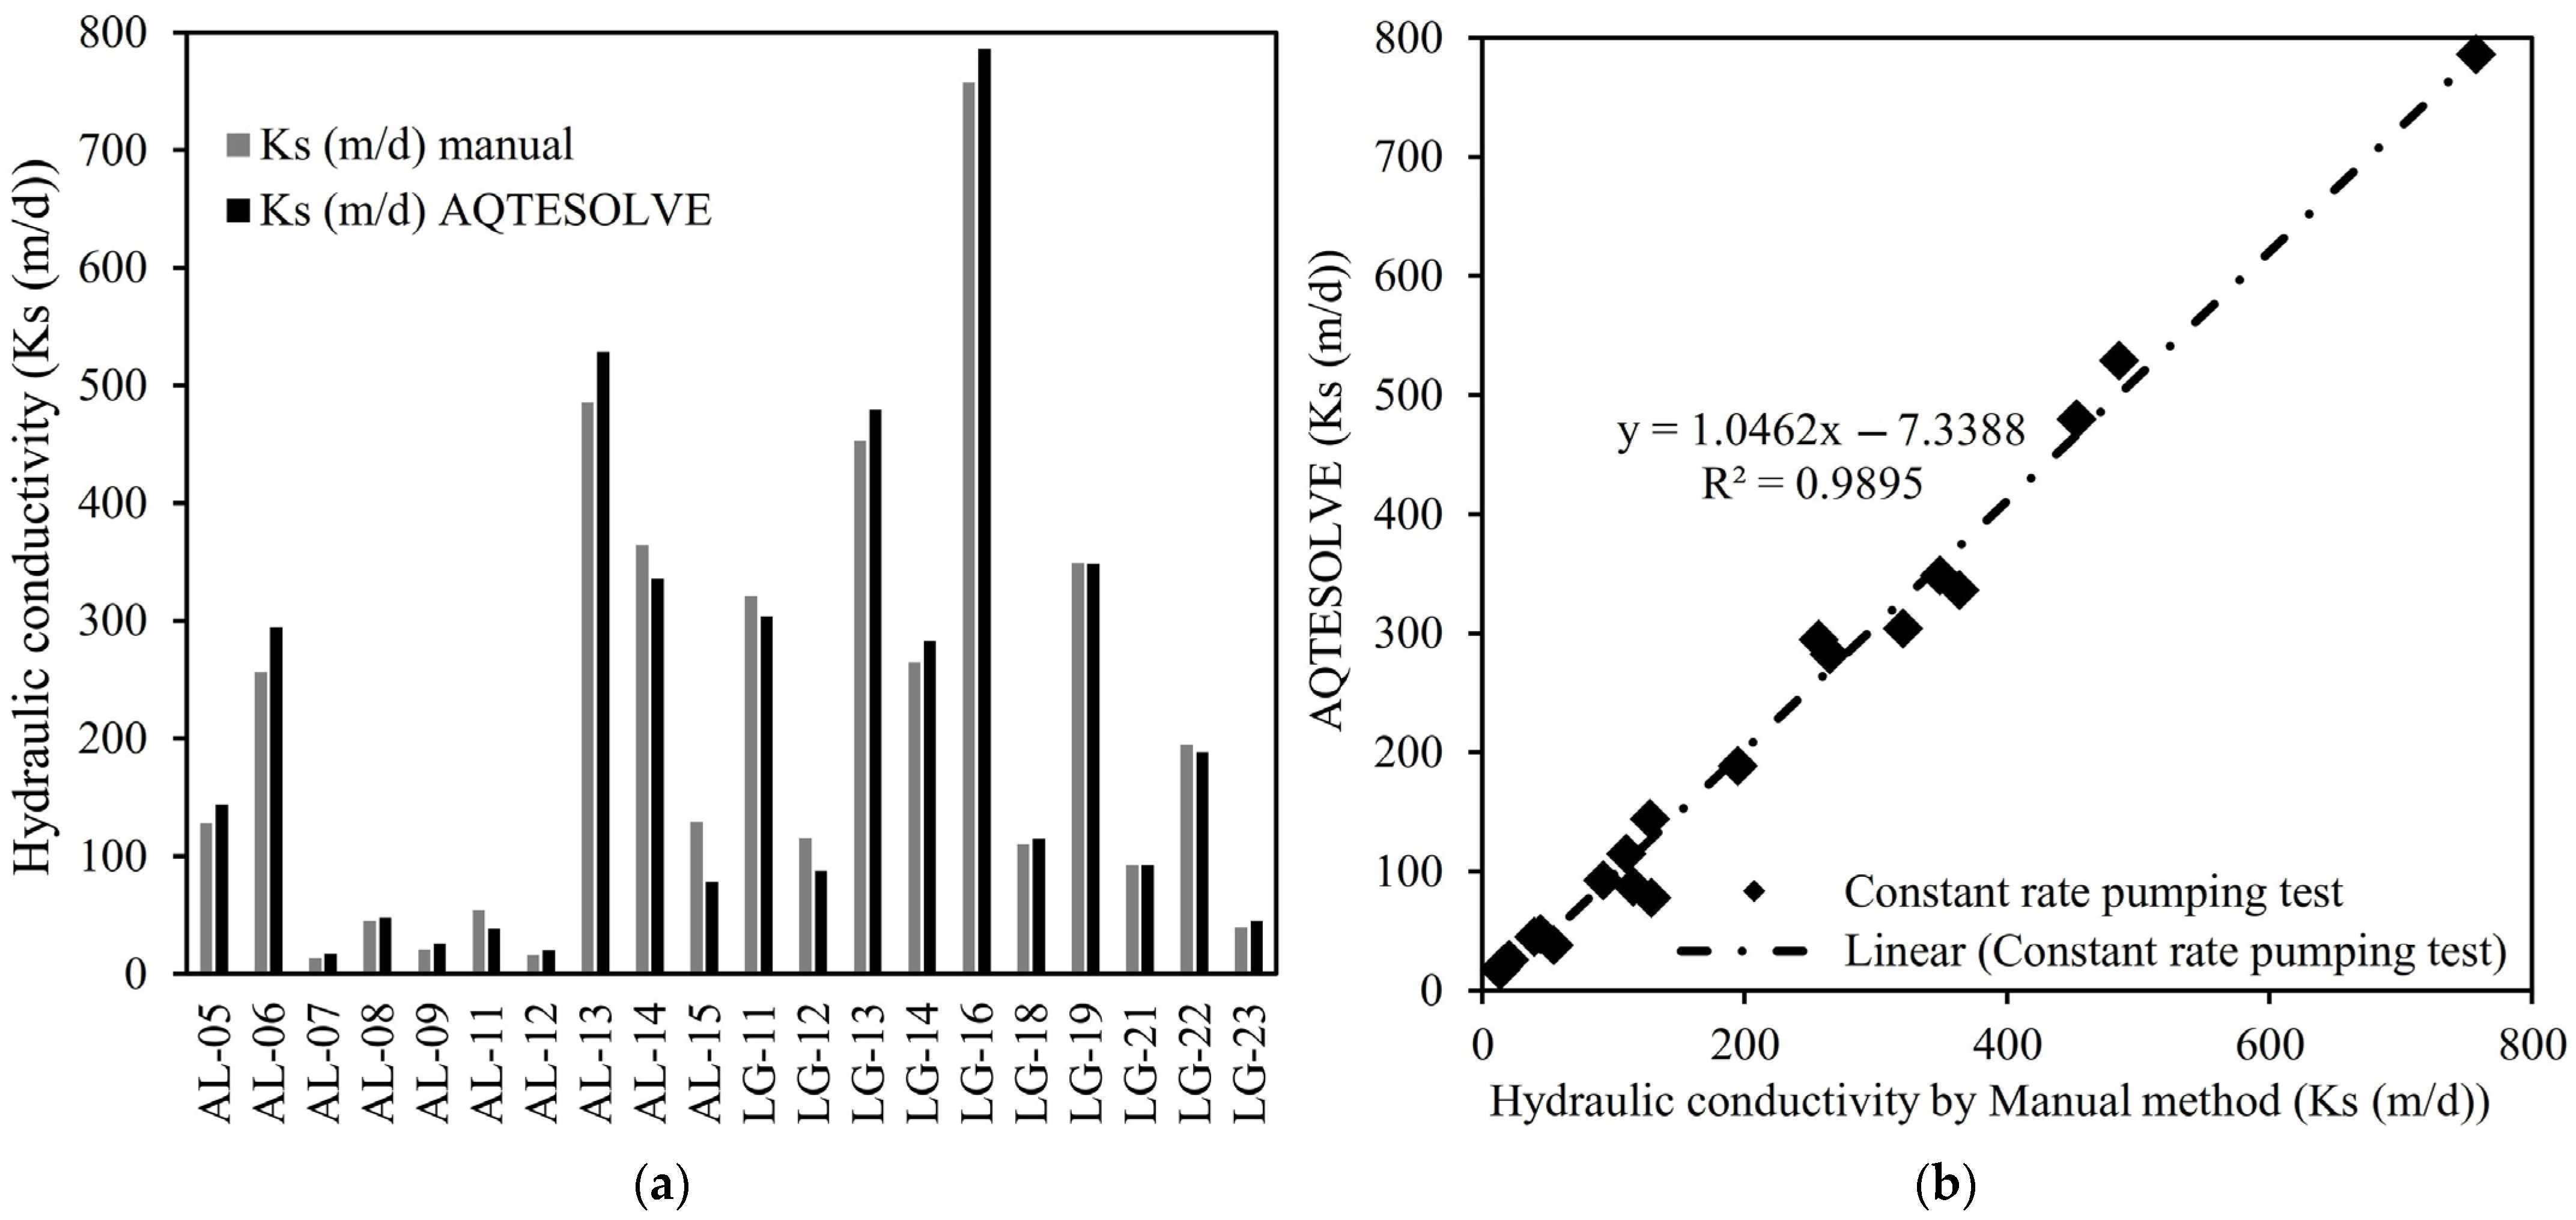
Given the at-hand availability of pertinent data from AL-LG wells, they constitute the primary basis for all comparative analyses. As elucidated by Mohammad Dost et al., (2022) [29], a crucial aspect involves evaluating the accuracy of the employed method compared with prevailing actual conditions. Moreover, while understanding linear equations is often quicker and simpler than another model, they do not always yield highly accurate results. All charts in the paper were tested, and the best validation rate (R-squared) models were chosen. To analyze the validity and accuracy of the AQTESOLV results as the automatic calculation, the linear correlation between Ks values from AQTESOLV and manual calculation by the Cooper–Jacob method for an unconfined aquifer based on constant rate pumping tests was calculated, which is 98.9% (Figure 5b). Consequently, the results obtained from pumping tests can be utilized to validate the outcomes of the next step, the conventional approach for assigning hydraulic conductivity values to geological units within a saturated zone. Moreover, Figure 5a,b show that Ks values are in the ranges of 13.6–786.0 m/d, which indicates the high permeability of the aquifer media. The highest values are associated with the Logar district located alongside the Logar River as the name of LG wells and the highest values of AL wells and the name of Alaudin wells are related to the Kabul riverbed.
According to the objectives of this research, identifying the most suitable analysis and interpretation of the pumping test considering the regional conditions and constraints inherent in each method is imperative. Hence, from among the AL-LG wells, four wells were earmarked as indices for the comparative juxtaposition of the mentioned methods in the methodological section.
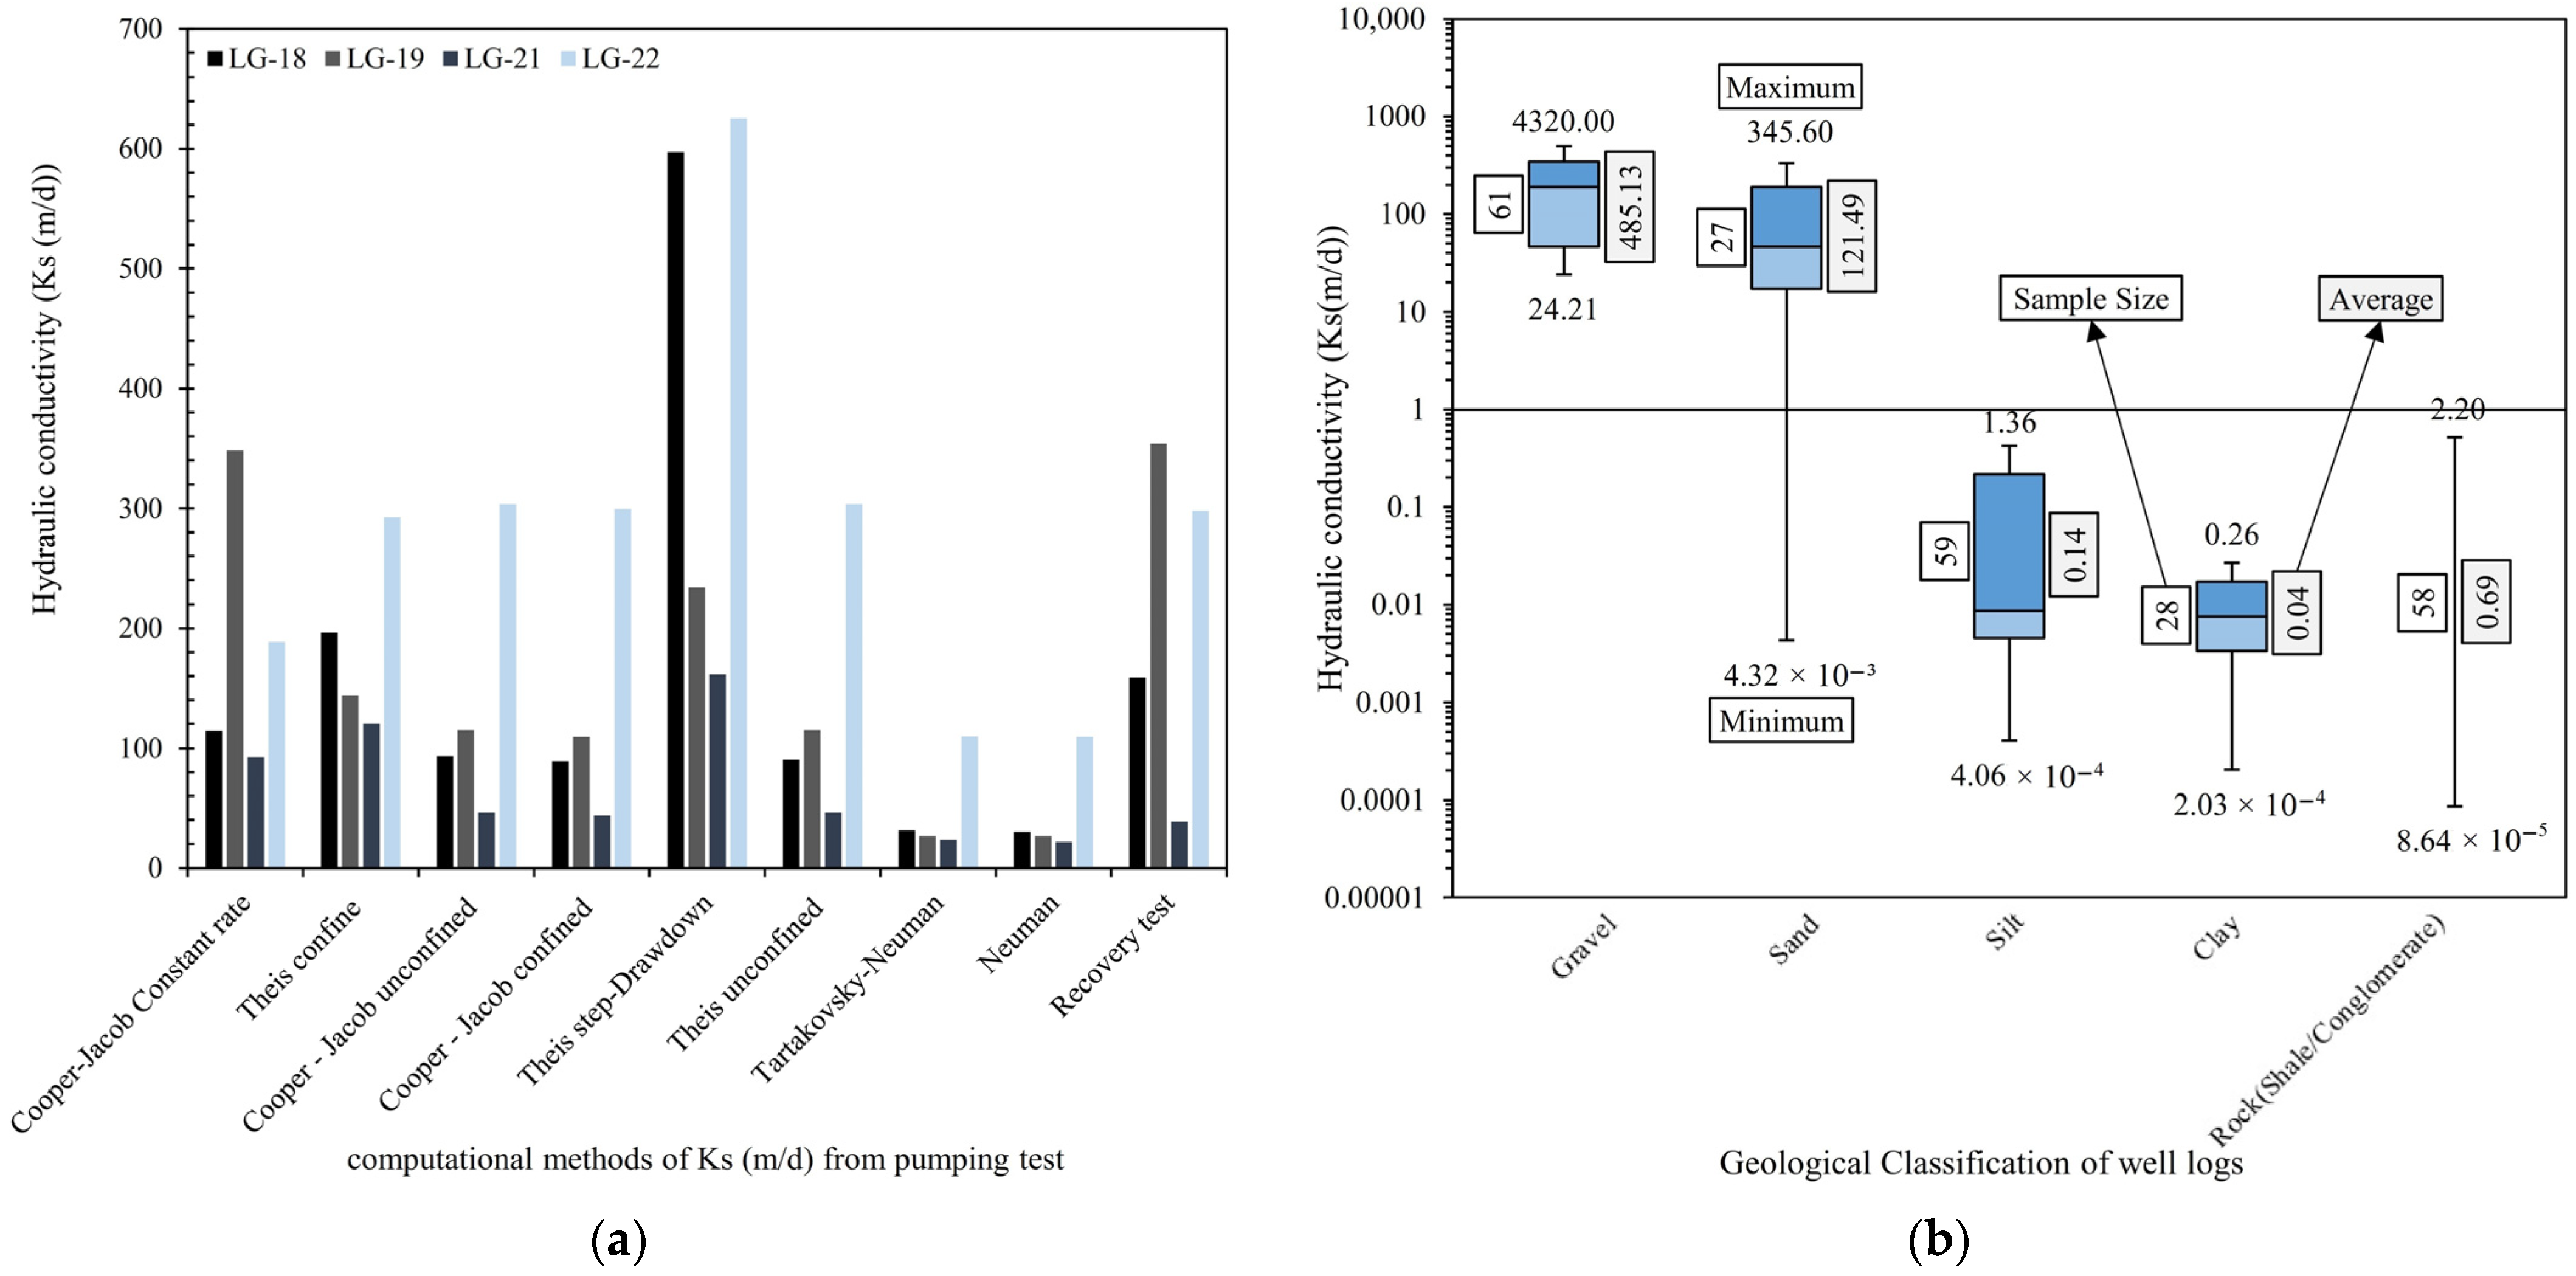
As illustrated in Figure 6a, among nine applied methods, the apical values gained from Theis equation in confined aquifers for the step-drawdown pumping test and the nadir values corresponding to the Tartakovsky–Neuman and Neuman methods in unconfined aquifers deviated from anticipations. The optimal outcomes were affiliated with the Cooper–Jacob method in confined aquifers, employing constant-rate pumping tests, followed by the Theis method in unconfined aquifers from the step-drawdown pumping test and recovery test method. Despite the lack of notable differences in outcomes between both confined and unconfined aquifer environments, the findings suggest that the reliability of results derived from employing these methods is higher in confined aquifers. Moreover, as evident, the hydraulic conductivity and, consequently, the aquifer’s transmissivity are within a high range. Despite the aquifer in the study area being predominantly unconfined, the majority of drawdown–time curves from conducted pumping tests exhibit low drawdown rates and characteristics similar to confined aquifers, thus indicating that the notably high drawdown rates described in the geological section as a result of overexploitation appear entirely logical.
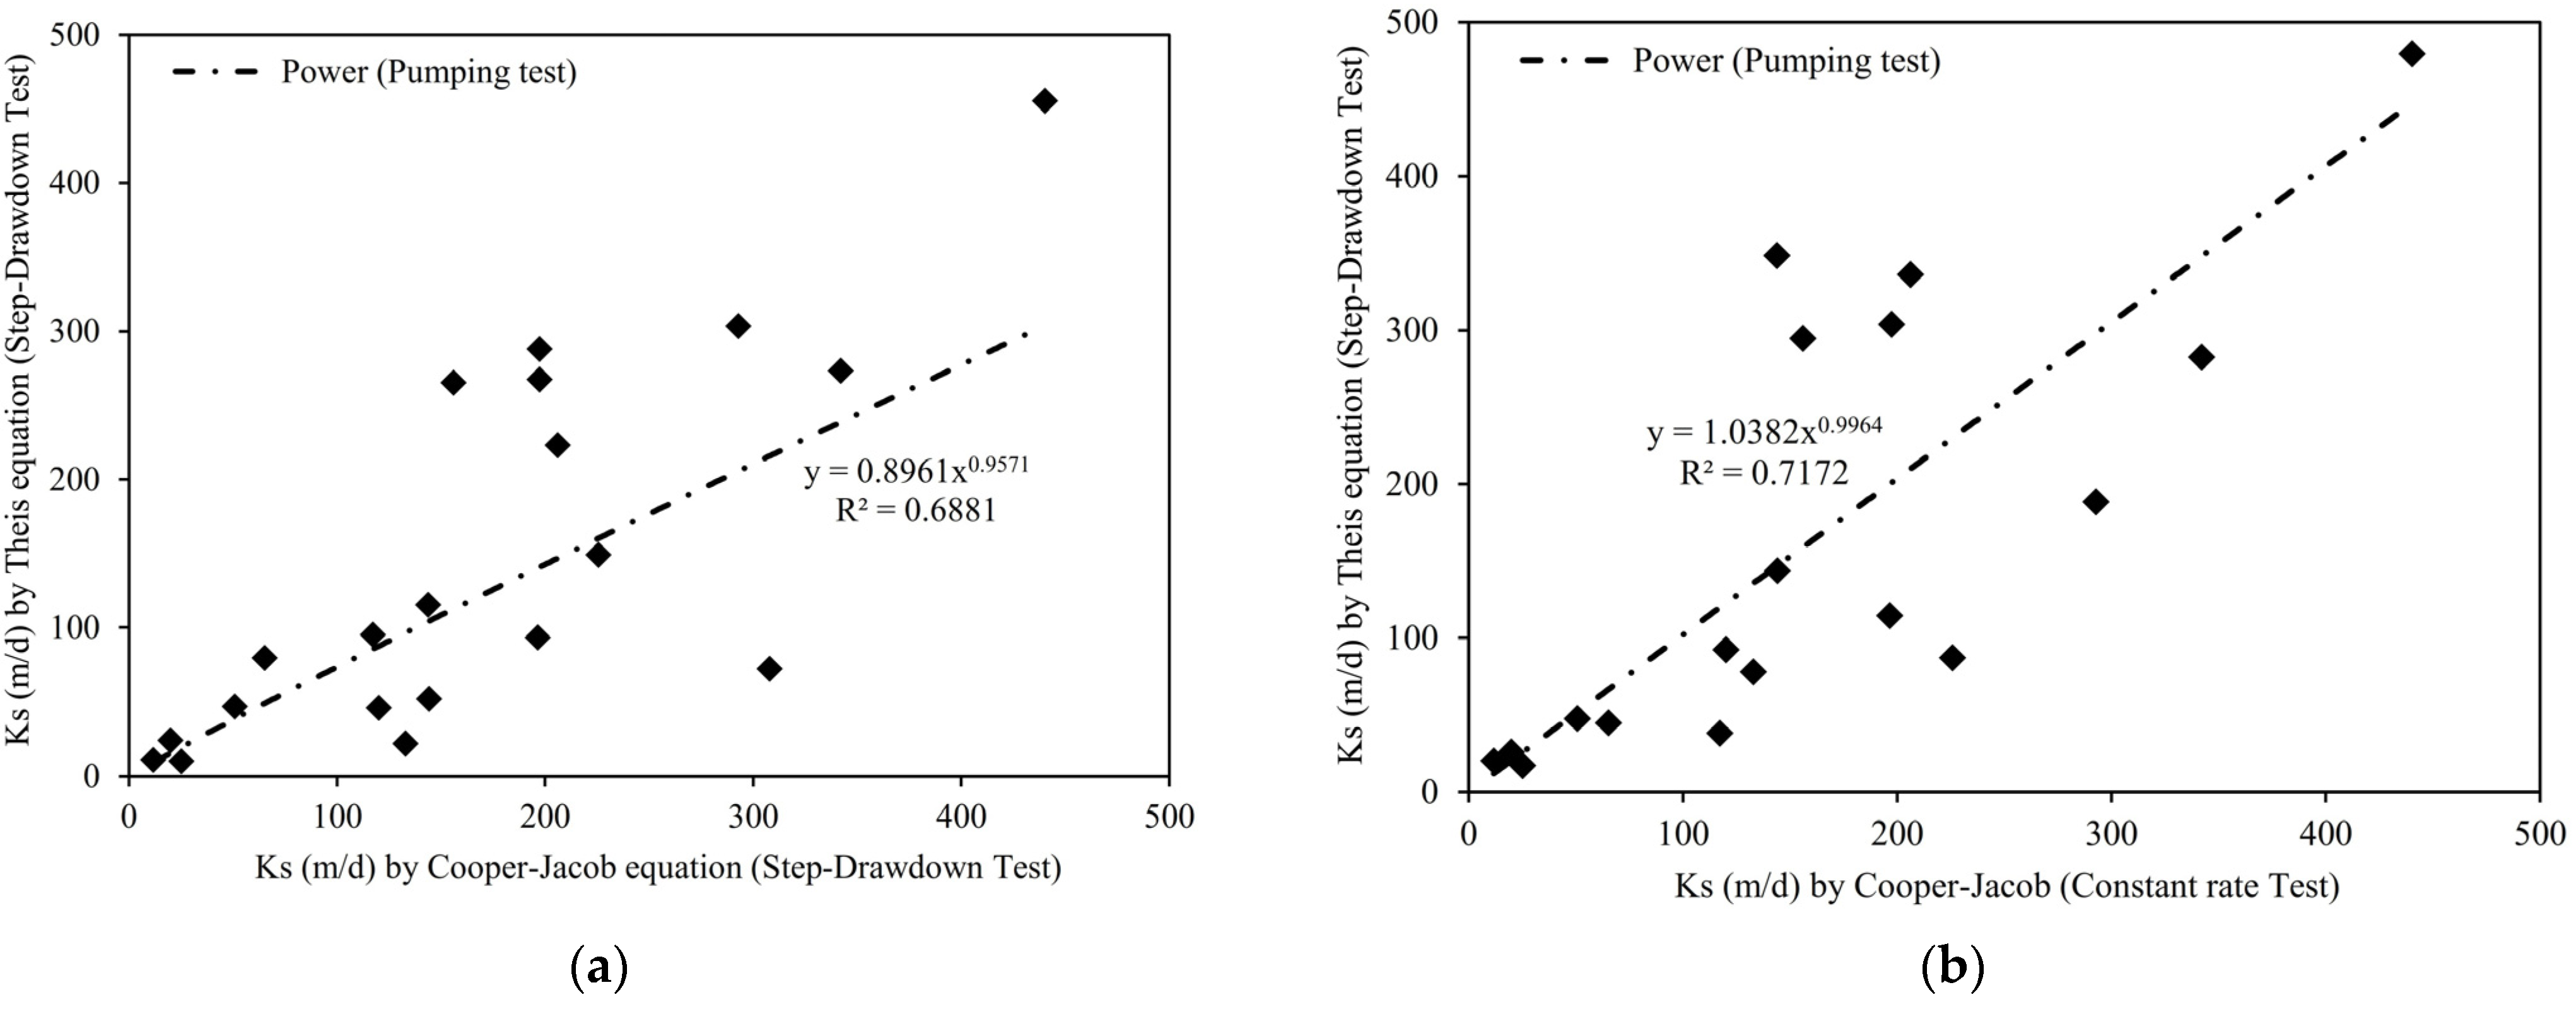
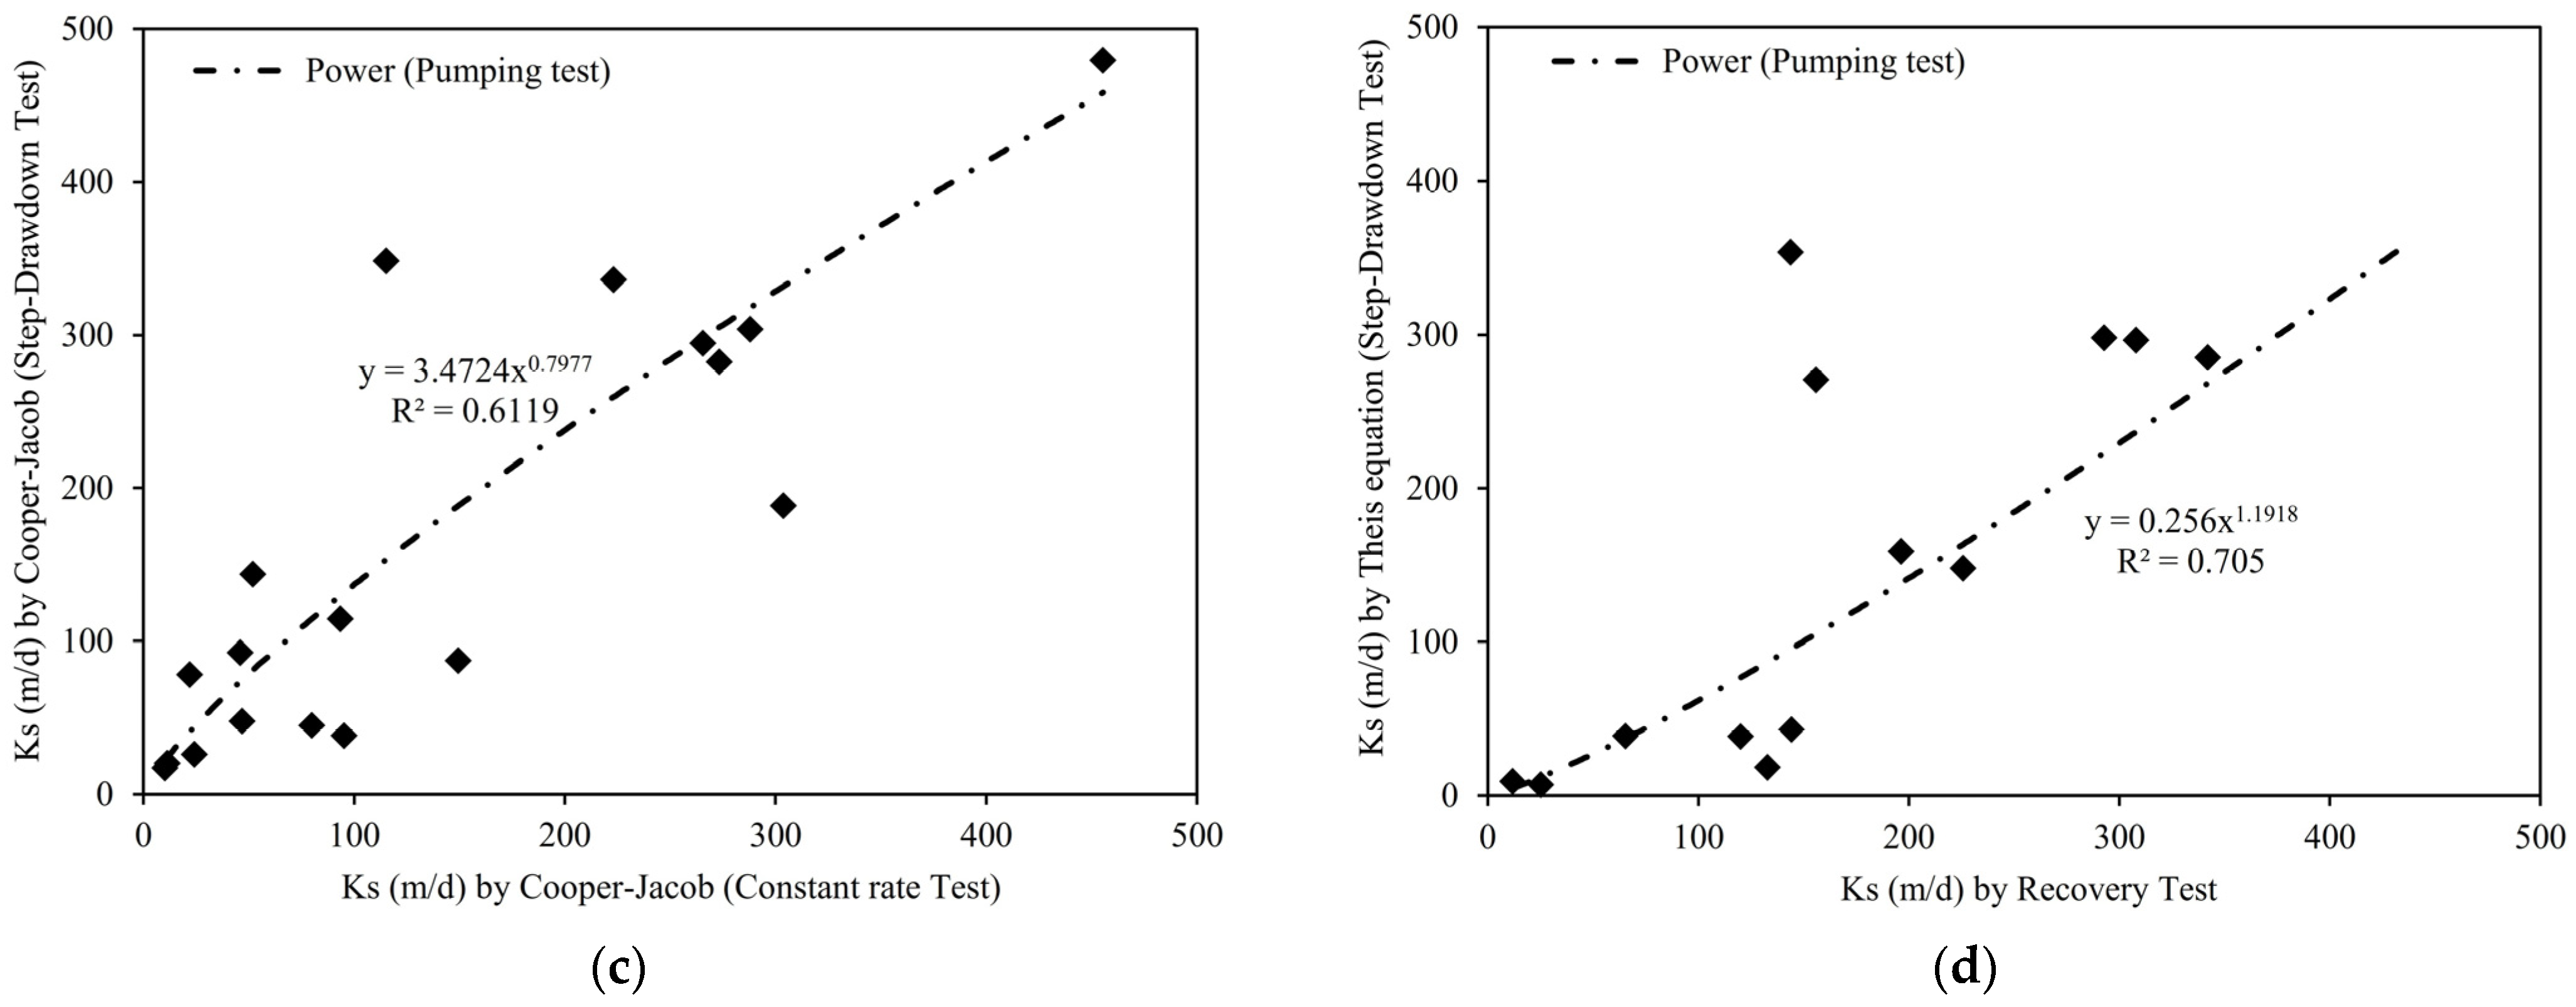
Validation results of the Cooper–Jacob, Theis, and Recovery Test methods across the constant-rate and step-drawdown pumping tests, which demonstrate the highest compatibility with real aquifer conditions, are illustrated in Figure 7a–d. The correlation coefficients lie on a good and 68.8%, 71.7%, 61.1%, and 70.5% ranges for the Theis and Cooper–Jacob methods in the step-drawdown pumping test, Theis with the step-drawdown pumping test and Cooper–Jacob with a constant rate pumping test, Cooper–Jacob with the step-drawdown and constant rate pumping test, and Theis and the Recovery Test method in the step-drawdown pumping test, respectively. These indicate the usability of the considered methods and the raw data analysis methods. Additionally, the obtained correlation equations can be locally applied to estimate the value of one method from another one.

4.2. Empirical Method

In employing the conventional approach, the allocation of Ks values to geological and soil materials can predict overall Ks values across the entire well logs. To determine Ks values for each geological unit and classified soil type, an initial and imperative step involves the calculation of the overall Ks values via pumping tests. Subsequently, in a secondary phase, the assignment of Ks values from the existing literature becomes viable. Hence, as delineated in Section 4.1.1, the computation of the overall Ks values for AL-LG wells has been conducted, and then, calculations for the Ks values of each geological unit and classified soil types were initially performed for AL-LG wells, followed by the application of the obtained results to old, piezometric, and PW wells.

4.2.1. AL-LG Wells Results

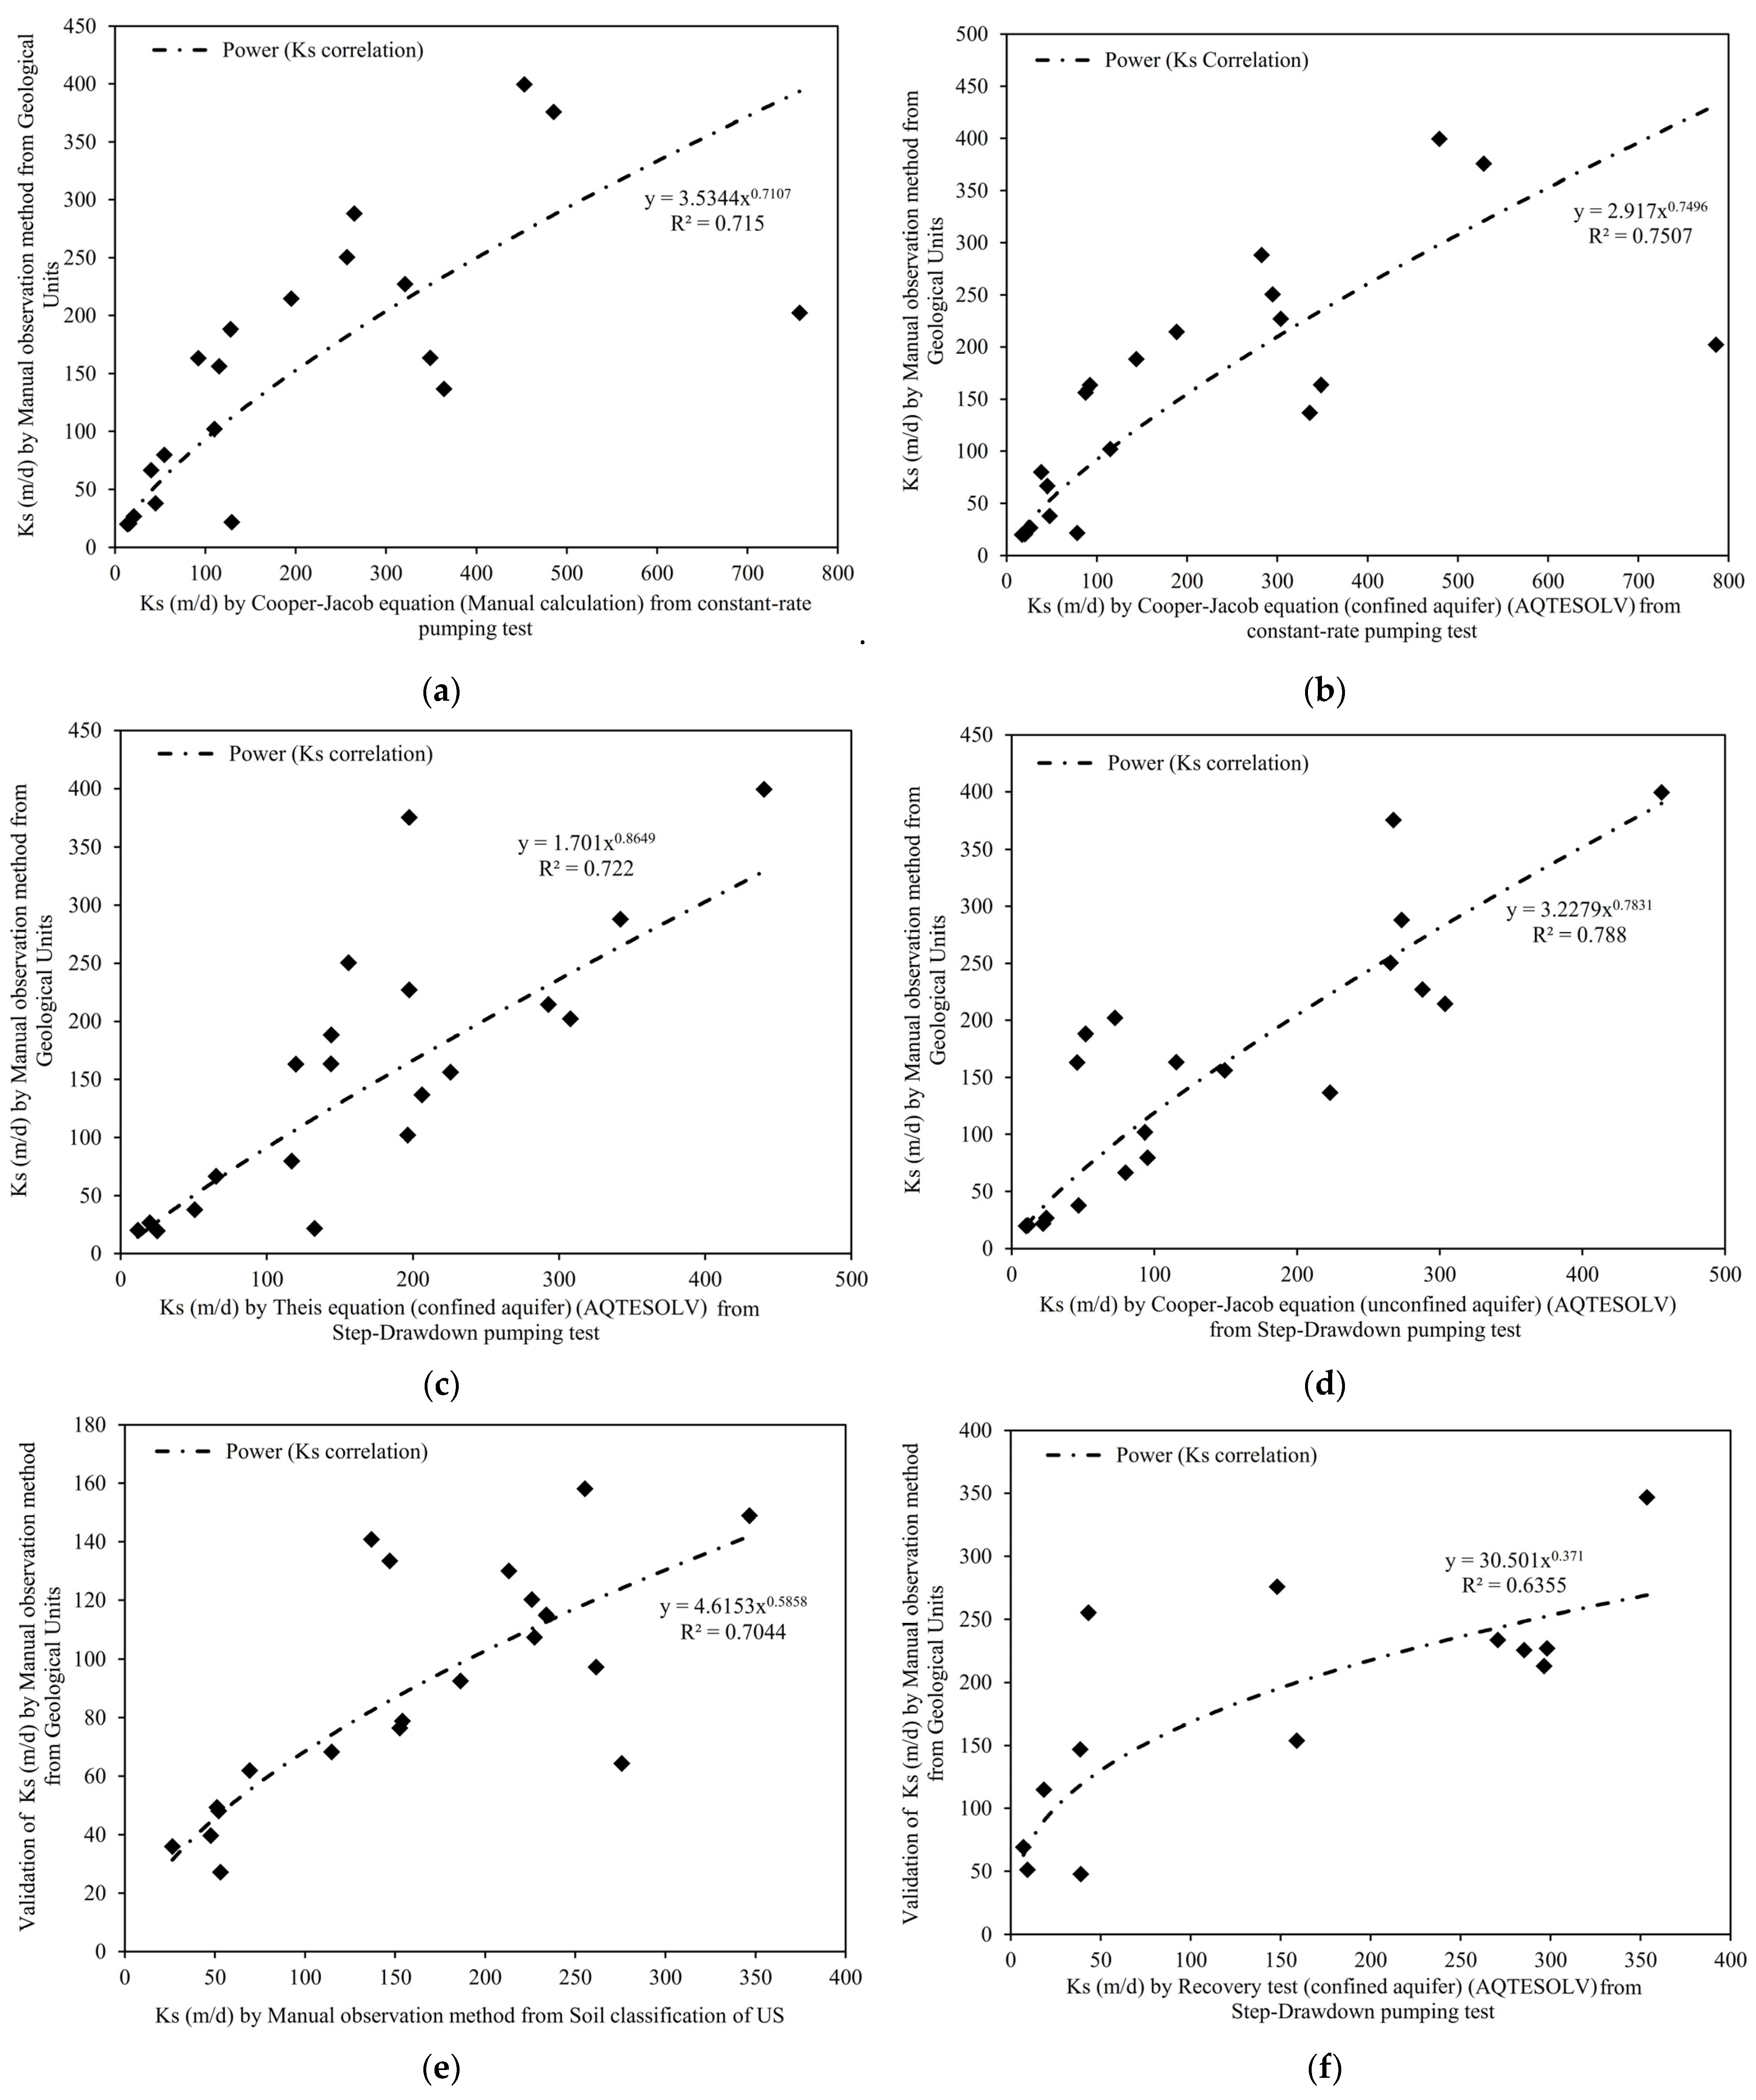
After obtaining the total hydraulic conductivity values for the entire AL-LG well column through pumping tests, by referring to the extant references mentioned in the methodology section, the hydraulic conductivity values for each geological segment of the wells were determined using a thorough expertise manner. Figure 6b delineates five cohorts of alluvial aquifer units in the area, including gravel, sand, silt, clay, and conglomerate, which is hard and porous. For each of them, the proffered maximum, minimum, and average hydraulic conductivity values by reclassifying and averaging the all-same segments related to the well logs have been calculated. Given the preponderance of gravel and sand in the aquifer composition, anticipating high hydraulic conductivity values in the majority of wells is reasonable. The correlation coefficients of AL-LG wells achieved a very good category and 71.5%, 75.0%, 72.2%, and 78.8% ranges for the Cooper–Jacob method in manual and AQTESOLV calculations with a constant rate pumping test, and Theis and Cooper–Jacob methods with the step-drawdown pumping test in contrast with the resulting Ks from reclassifying geological units Ks, respectively (Figure 8a–d). The presented values in Figure 6b were applied to all wells with drilling logs, the results of which are discussed in detail in the subsequent sections.
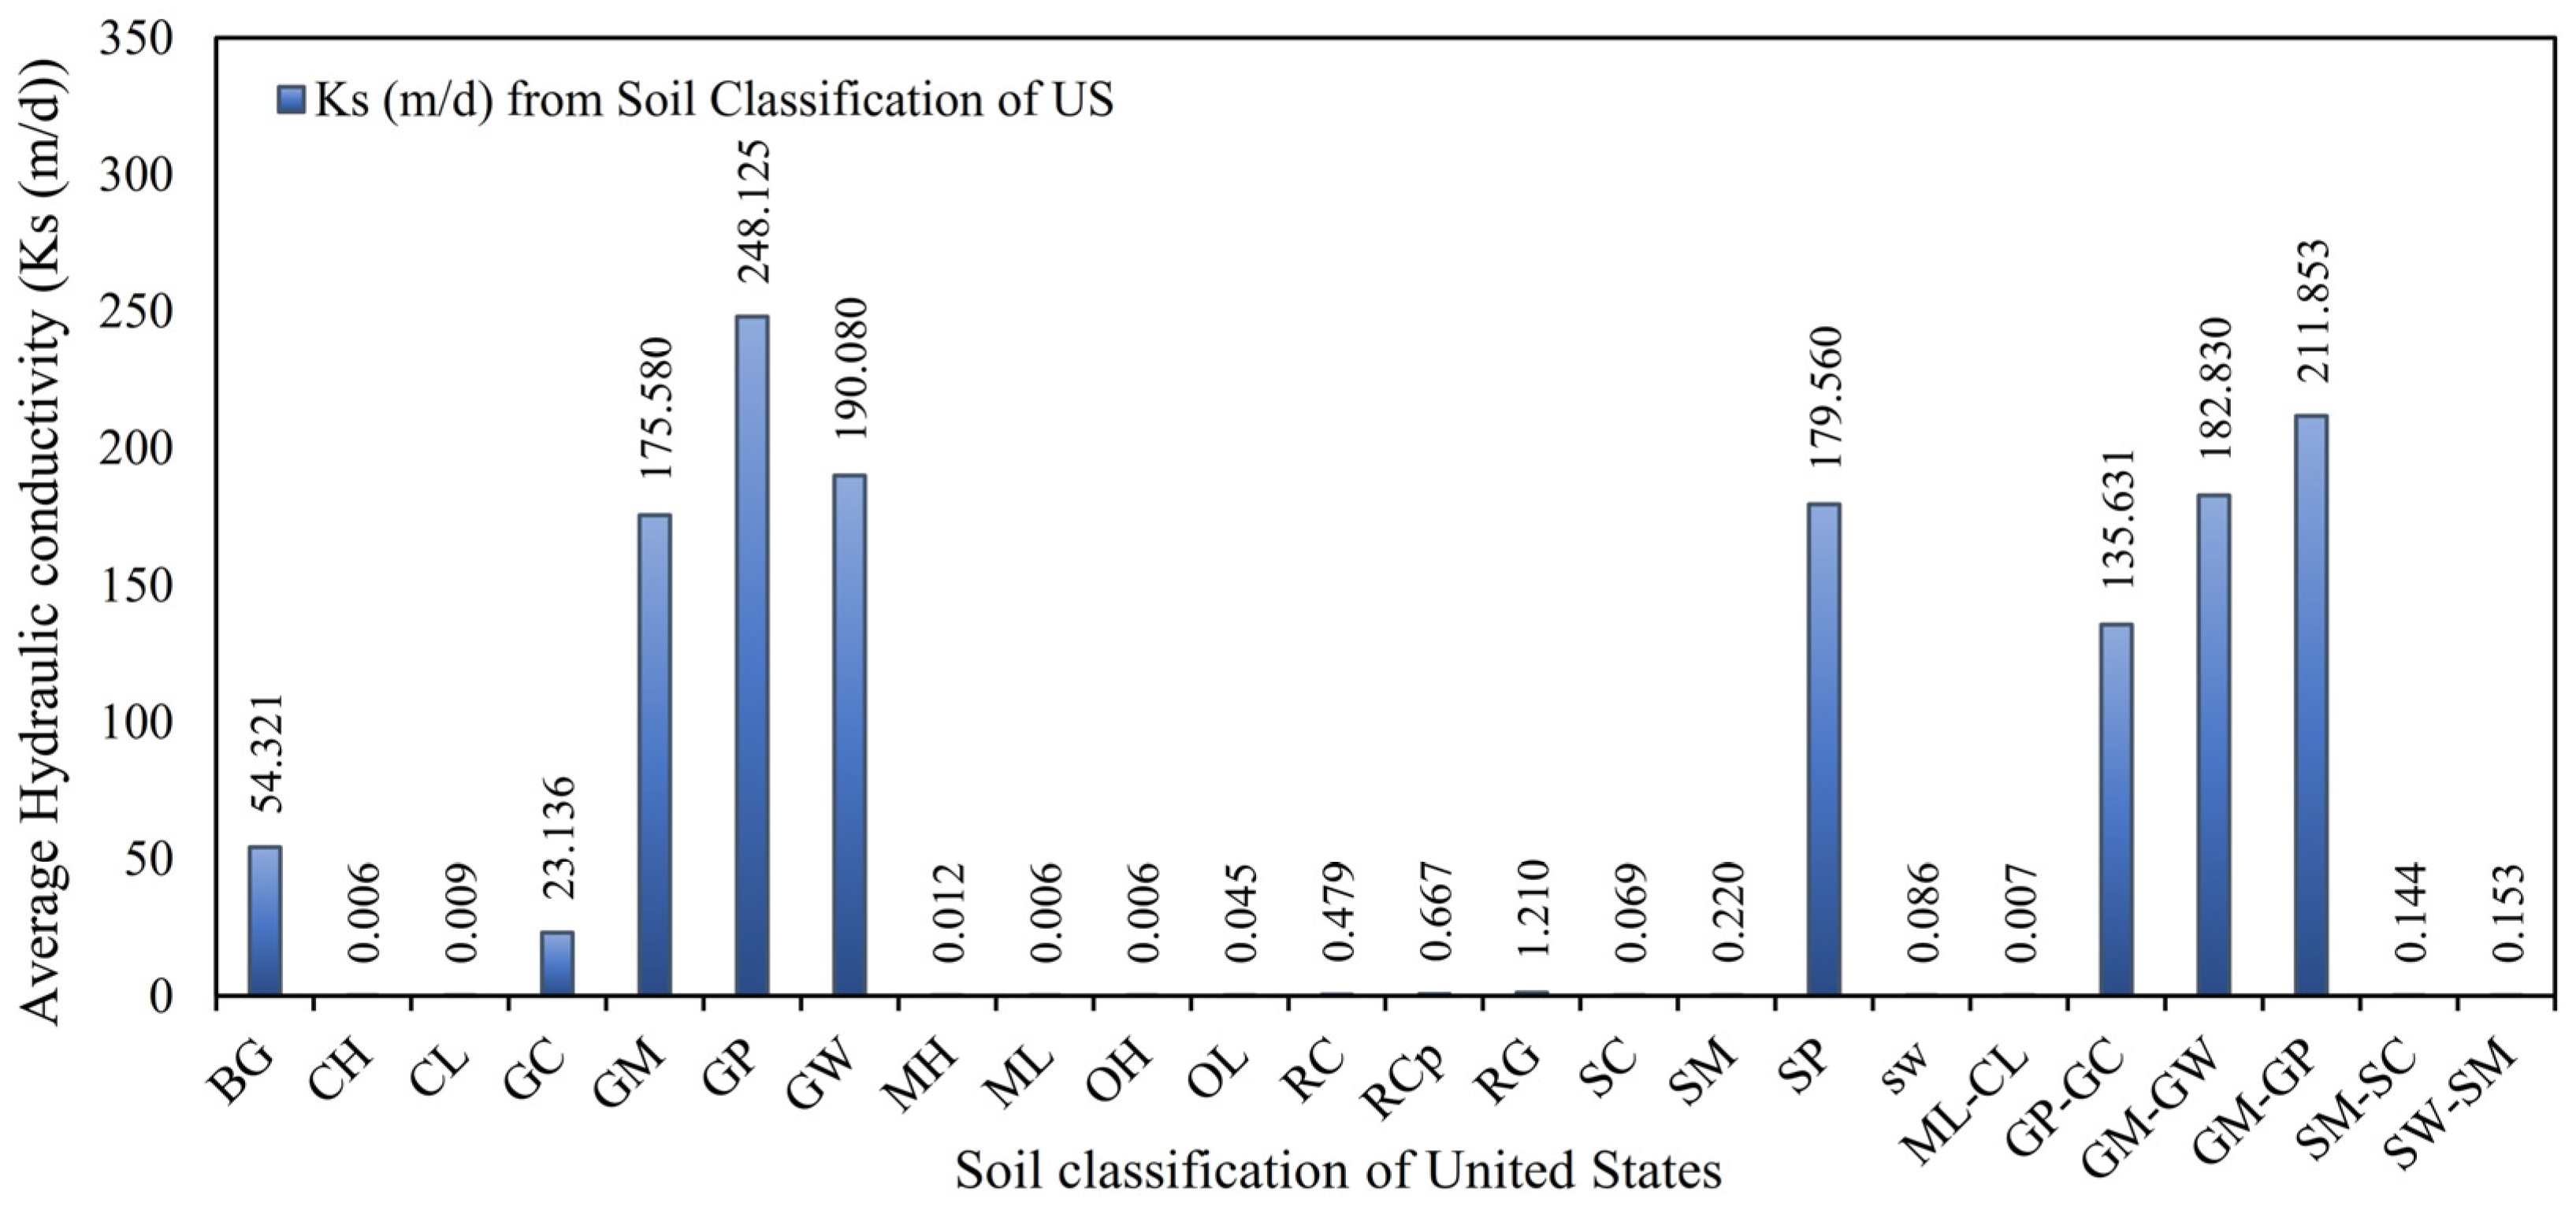
Moreover, as the drilling logs of AL-LG wells also encompassed data on the soil classification of the US, a reclassification was applied alongside the geological reclassification on the alluvial aquifer. As presented in Figure 9, 24 categories for the soil type have been obtained. The range of variations for the reclassification of geological classification and aquifer soil type spans from 0.3 to 485.1 m per day and 0.006 to 248.1, respectively. To determine the validity of derived Ks values from both classifications, the values were meticulously reapplied to the respective AL-LG wells. A correlation rate of 70.4% was obtained between these two types of classification, and a resultant correlation rate for geological classification, vis-à-vis the recovery test, lay on 63.6% (Figure 8e,f). Therefore, the utilization of values derived from this method appears suitable for wells without pumping tests.

4.2.2. Old Well Results

Through the application of a specified numerical range to old well logs in the study area, average hydraulic conductivity (Ks) values for each well were computed. The wells also had specific capacity values documented in old reports. Using the Razack and Huntley (1991) [44] equation, transmissivity (T) and hydraulic conductivity (Ks) were calculated (Figure 10a,b).
Unfortunately, as shown in Figure 10c,d, the correlation coefficients between the geological classification Ks and specific capacity and Ks derived from a specific capacity exhibit notably low values. These differences may stem from hydrogeological changes over the past 40 years, particularly during the last two decades, indicating significant stresses on the aquifer. Consequently, these parameters may not show a correlation due to alterations in the aquifer’s hydrogeological conditions. It is important to note that many of the mentioned old wells either are now dry or have been developed. Therefore, the expected consistency of values under current conditions with those from 40 years ago cannot be guaranteed.
The percentage of gravel across the well column was compared with the transmissivity values obtained from the Razack and Huntley method, the specific capacity of the wells, and Ks values obtained from the geological classification method, showing no significant correlation (Supplementary Figure S1a–d).

4.2.3. Piezometric Well Results

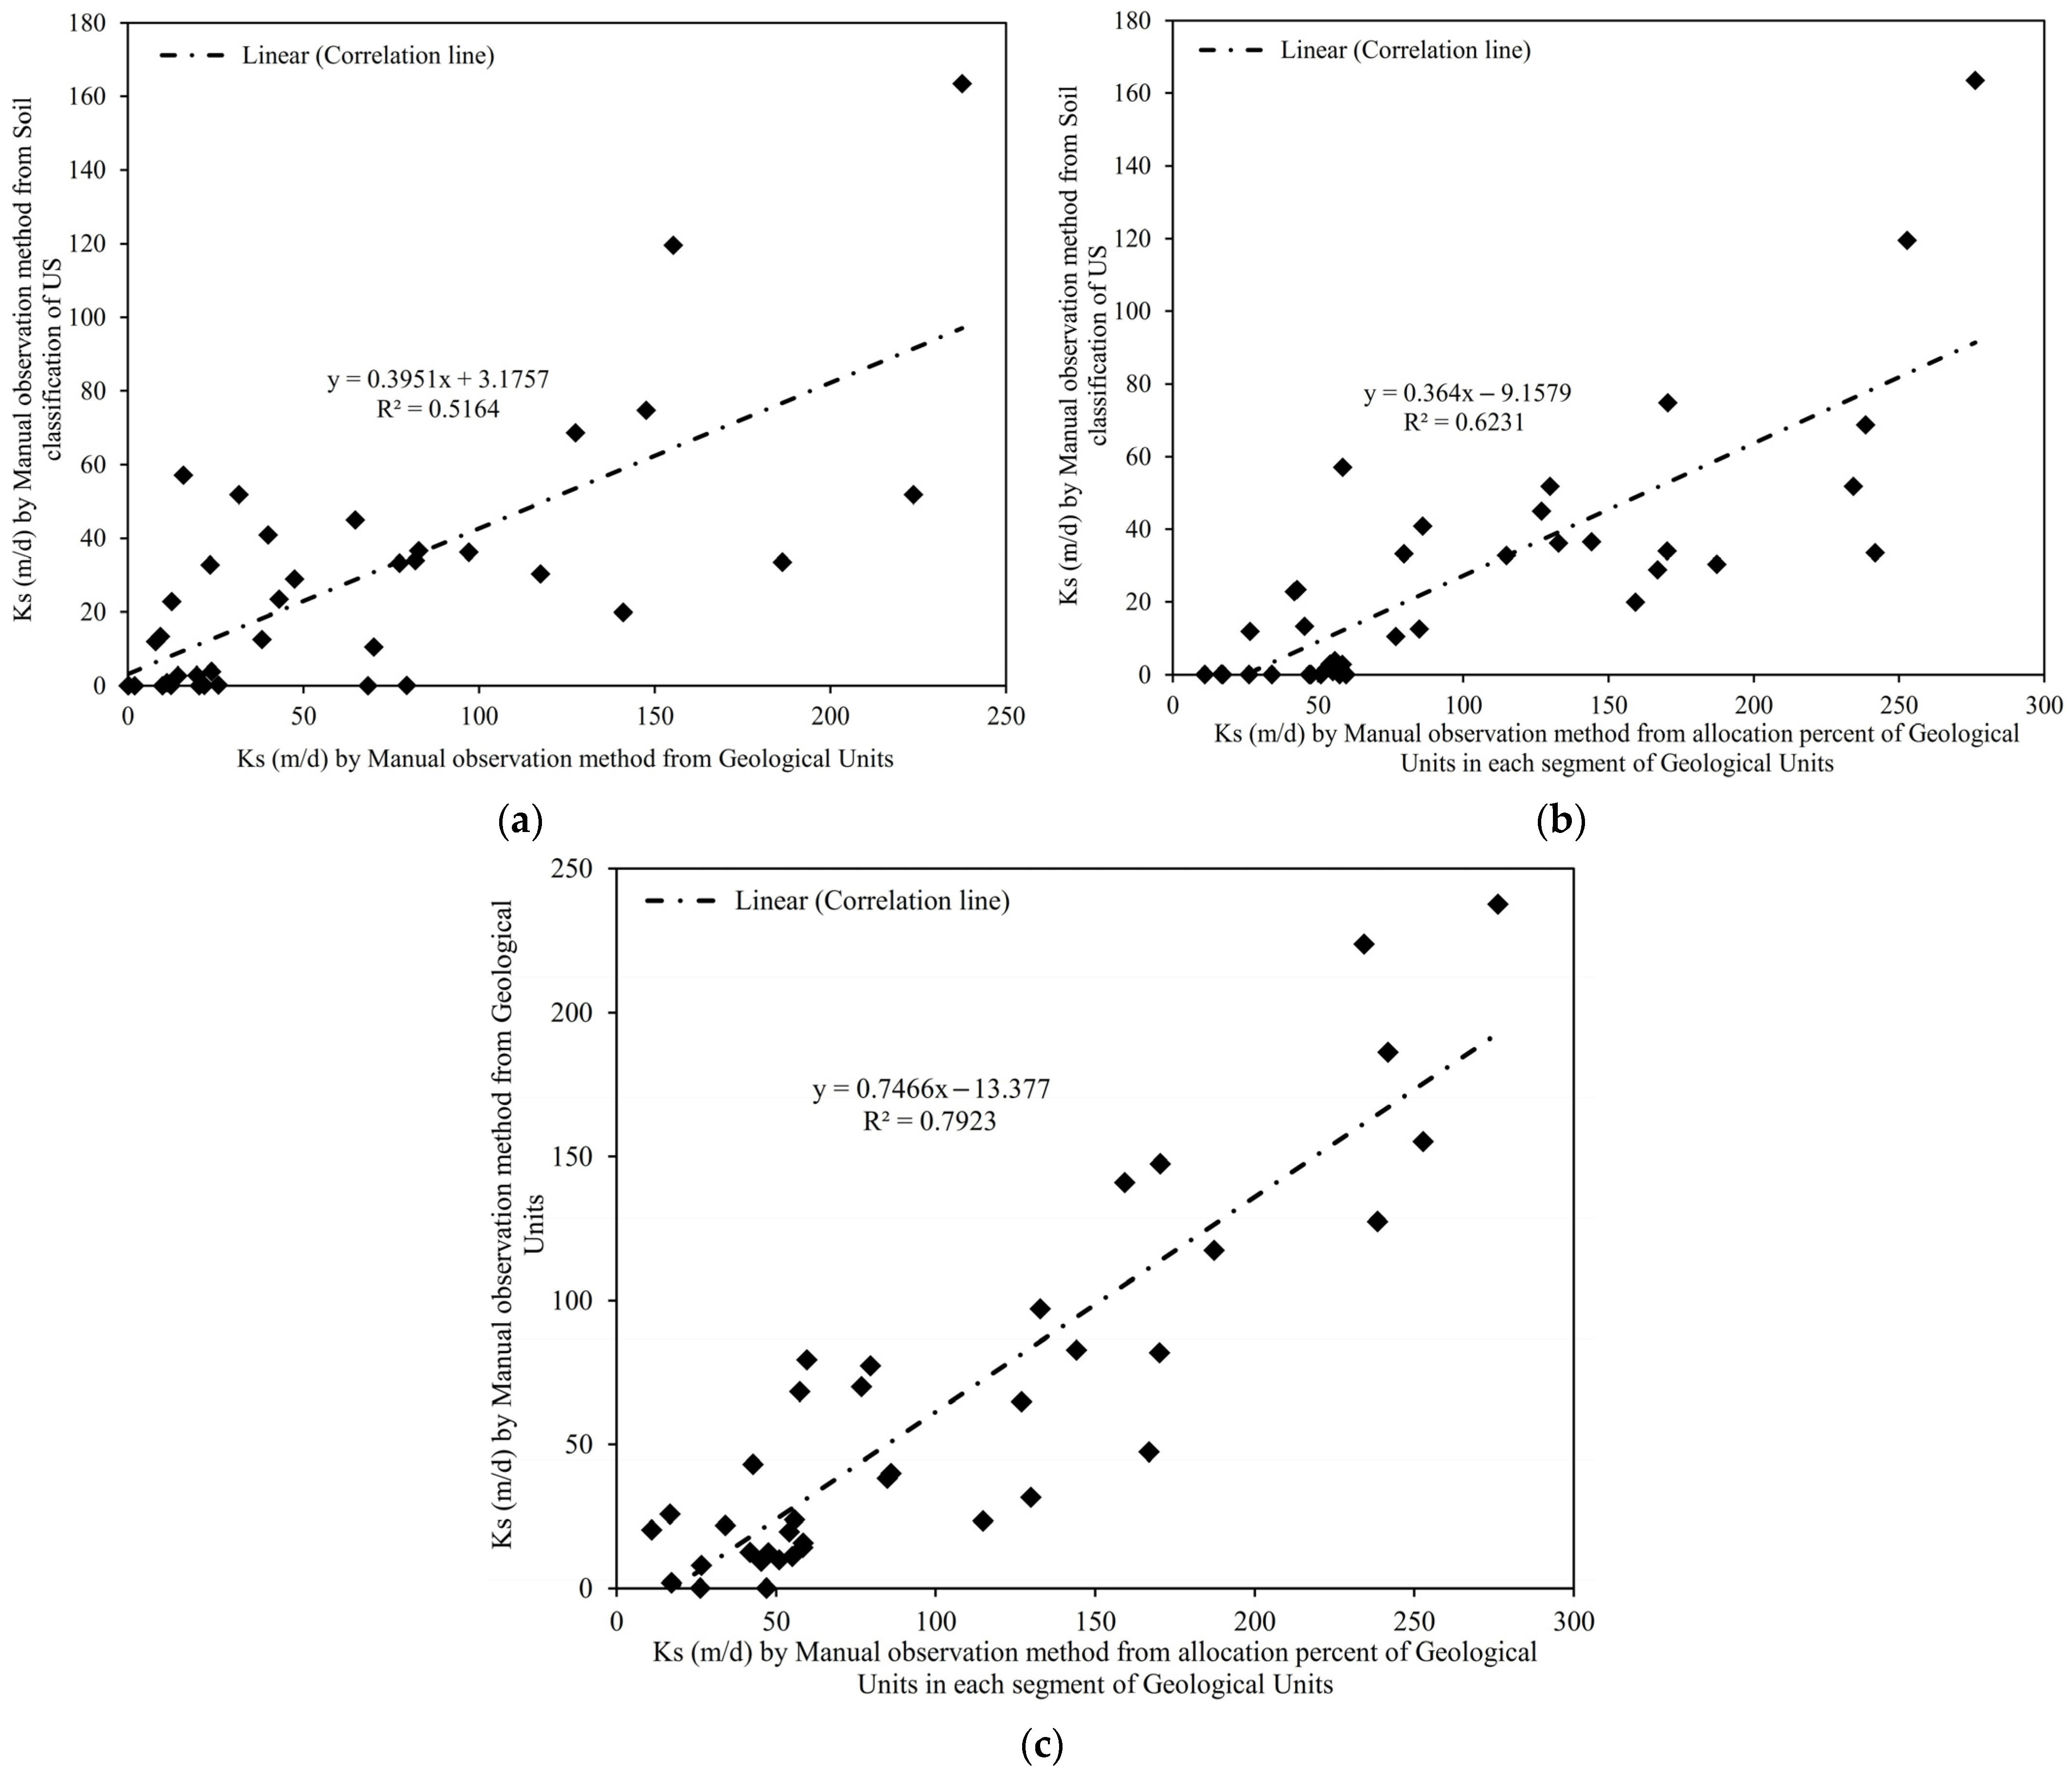
The 2019 piezometric wells in Kabul offer detailed geological and soil data, including gravel, sand, silt, and clay percentages in each well segment, enhancing hydraulic conductivity calculations. To assess the impact of increased detail, hydraulic conductivity was initially calculated using general geological descriptions of each segment from the well drilling logs, then recalculated with the inclusion of percentages for each class in each segment (Figure 11c). Additionally, hydraulic conductivity was determined using US soil classification data. As expected, the validity increased by 10.7% (from 51.6% to 62.3%) compared with the method using general geological descriptions (Figure 11a,b). The correlation between calculations using the expanded data volume and initial calculations was 79.2%, indicating reliable results and improved prediction accuracy with increased data (Figure 11c).
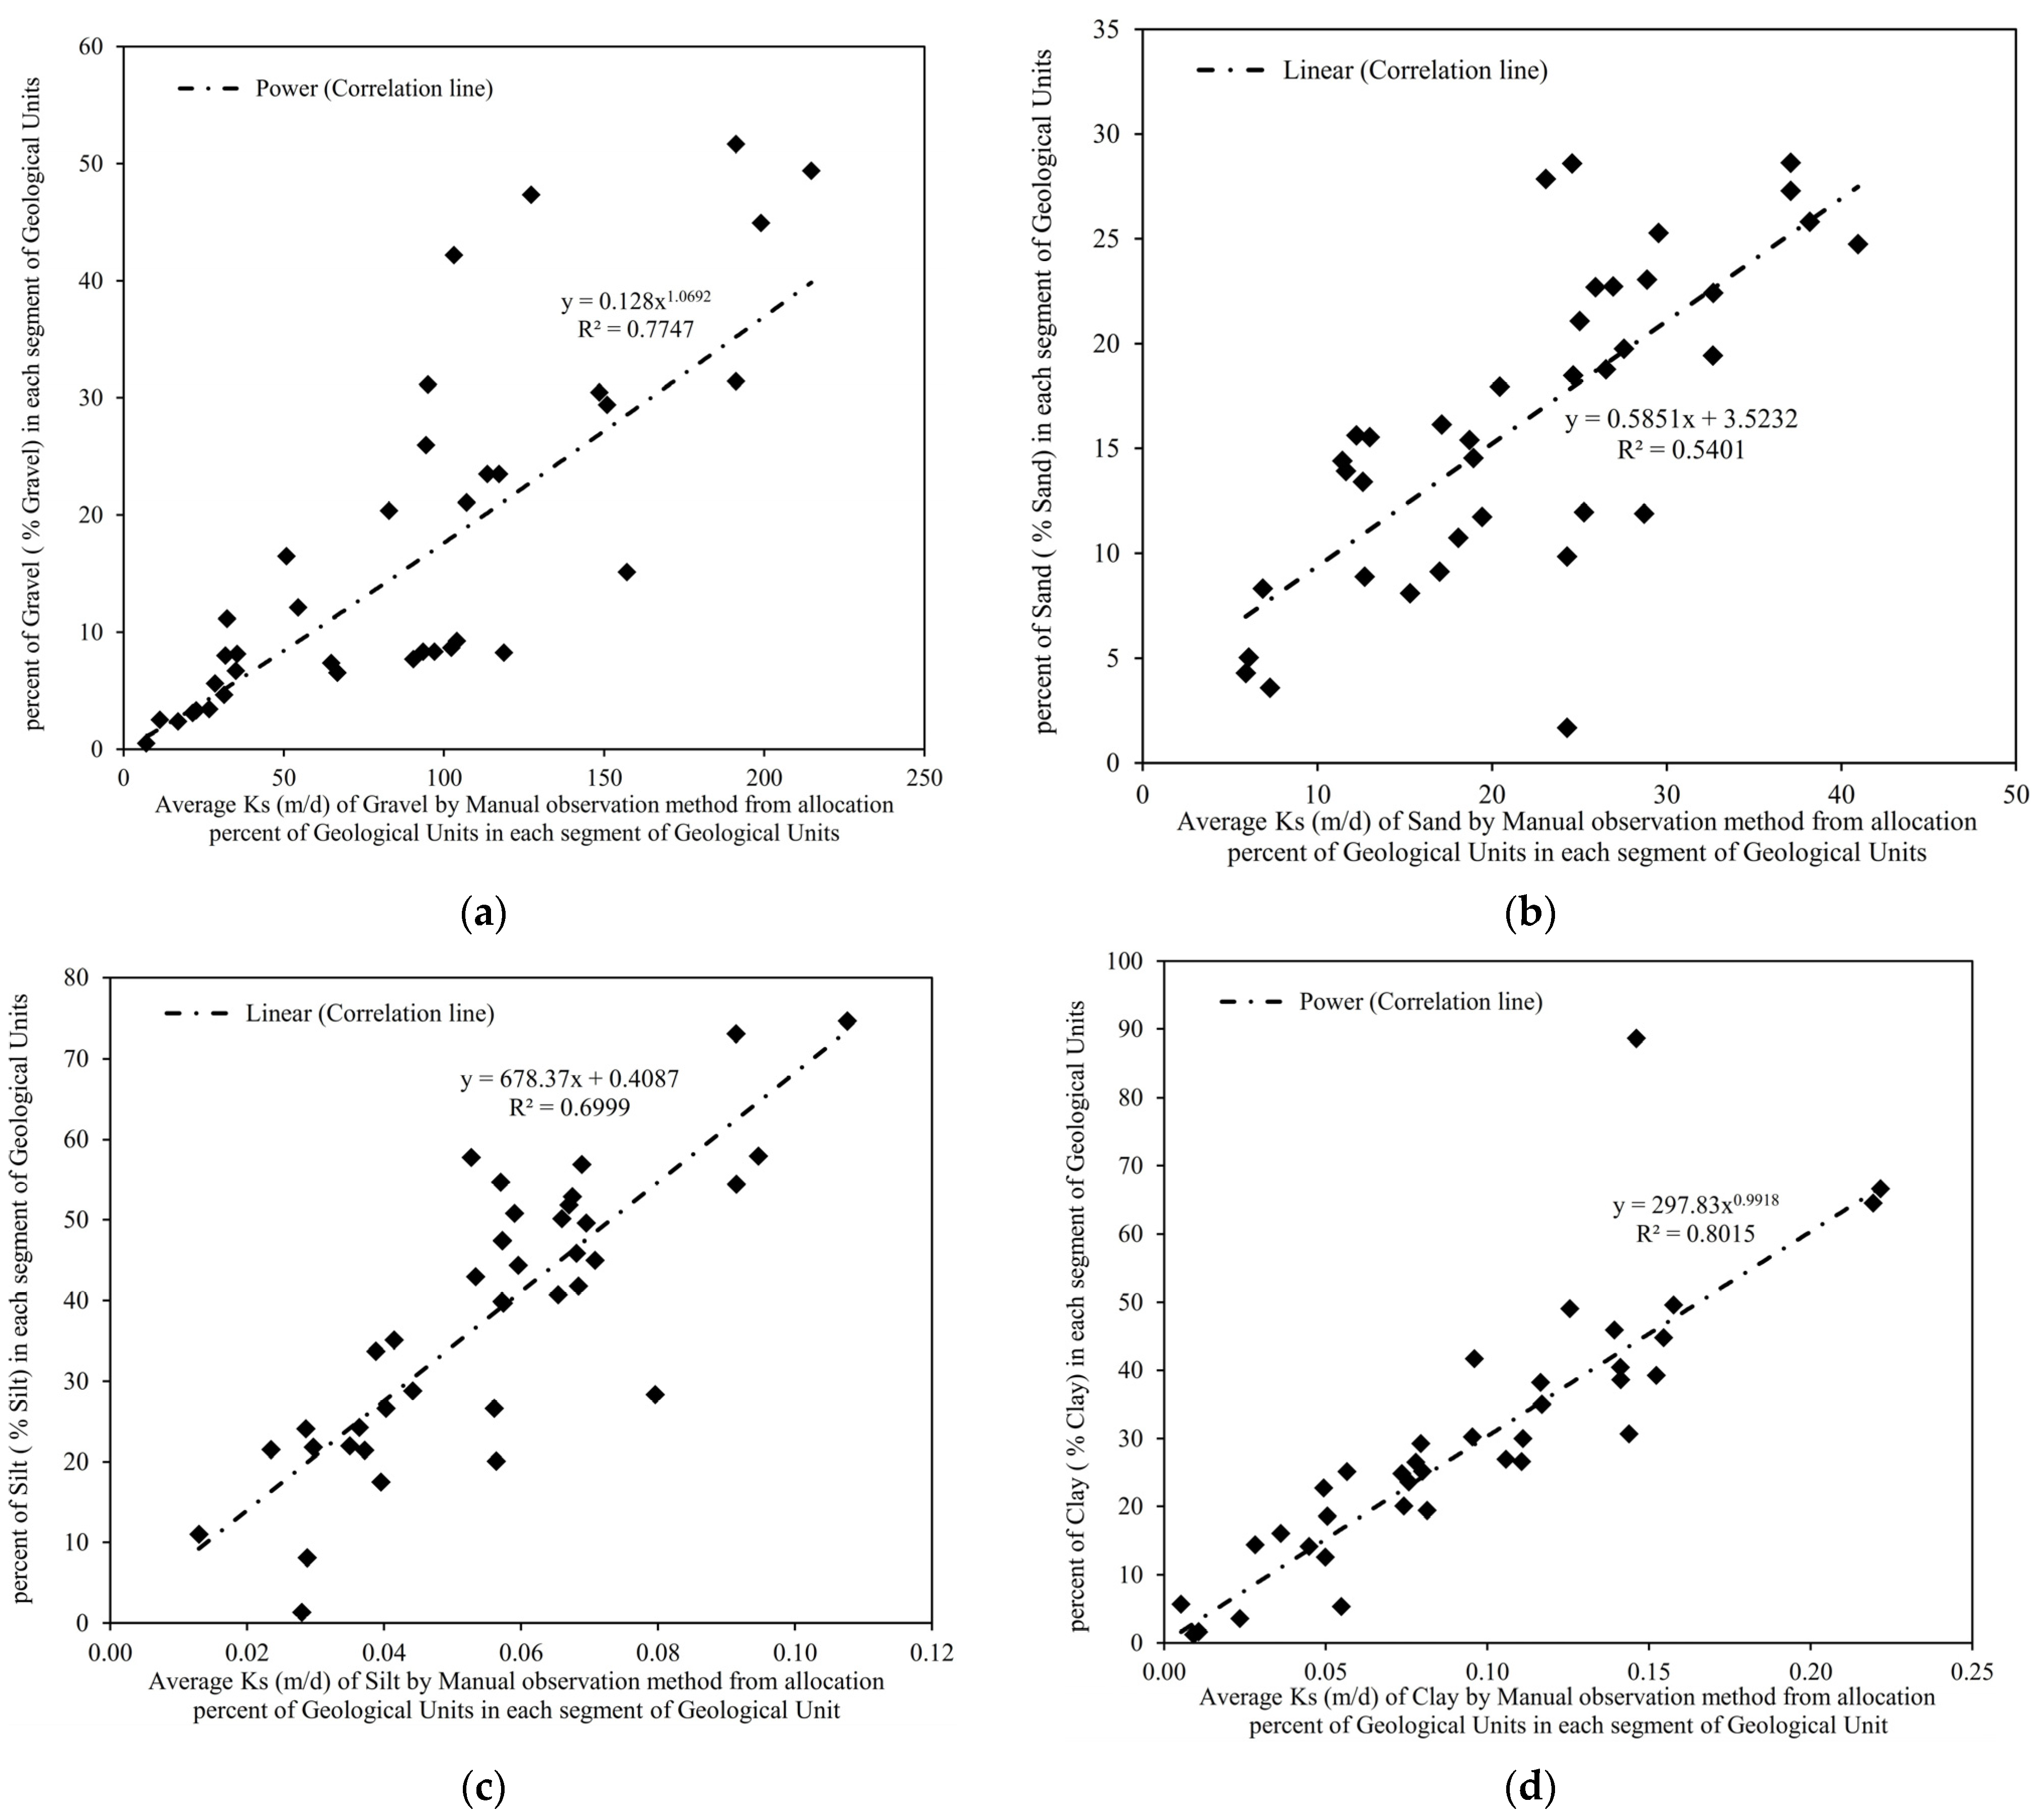
The analysis examined the trend of hydraulic conductivity changes concerning the increase in material percentage in each segment of the geological classification. Furthermore, variations in hydraulic conductivity classes regarding the increase in targeted material percentage across the entire well log were investigated. As shown in Figure 12a–d, an increase in hydraulic conductivity corresponds to an increase in gravel, sand, silt, and clay percentages, with positive correlations of 80.2%, 77.5%, 70.0%, and 54.0%, respectively, falling within the ranges of very good to weak correlation.

4.2.4. PW Wells

After assessing the enhanced accuracy achieved by utilizing detailed data from each drilling log segment in piezometric wells, hydraulic conductivity values from the geological classification of AL-LG wells were applied to the PW wells. It is important to note that the aquifer material in this category mainly comprises gravel, sand, and clay, with a limited presence of conglomerate and silt materials within these wells being more noticeable. Figure 13a illustrates the correlation between the percentage of geological classes across the entire well column and the increase in average hydraulic conductivity of the classes. As evident, the correlation coefficients range from excellent to very good, with values of 93.2%, 92.9%, 85.0%, 75.7%, and 75.1% for conglomerate, sand, gravel, silt, and clay, respectively.
Additionally, the trend of increasing hydraulic conductivity for each material compared with the overall well column is depicted in Figure 13b. As anticipated, the rising trend of hydraulic conductivity correlates at 69.7% for gravel material, indicating a positive association. Conversely, for silt and conglomerate, the increase in hydraulic conductivity is accompanied by correlation coefficients of 95.9% and 75.6%, respectively, suggesting a notably negative impact of these factors on the overall well hydraulic conductivity. Both sand and clay exhibit low correlation coefficients and subtle variations in hydraulic conductivity, but generally, the highest hydraulic conductivity values in the well column are linked to the lowest hydraulic conductivity values of these two materials. Consequently, increased mixing of fine and coarse particles leads to uniformity in the hydraulic conductivity of the entire aquifer media. In PW wells, the increase in hydraulic conductivity aligns with the predominance of gravel compared with other materials, resulting in a simultaneous rise in gravel material conductivity.

4.3. Laboratory Methods

Generally, the derivation of hydraulic conductivity through soil grain size analysis is conducted in the laboratory under saturated conditions. Due to constraints and the lack of suitable tools and laboratory equipment to estimate hydraulic conductivity, reliance on equations derived from previous research was prioritized. Grain size analysis was performed on AL-LG wells, and the raw results were processed through the HydrogeoSieveXL tool version 2.3.9.
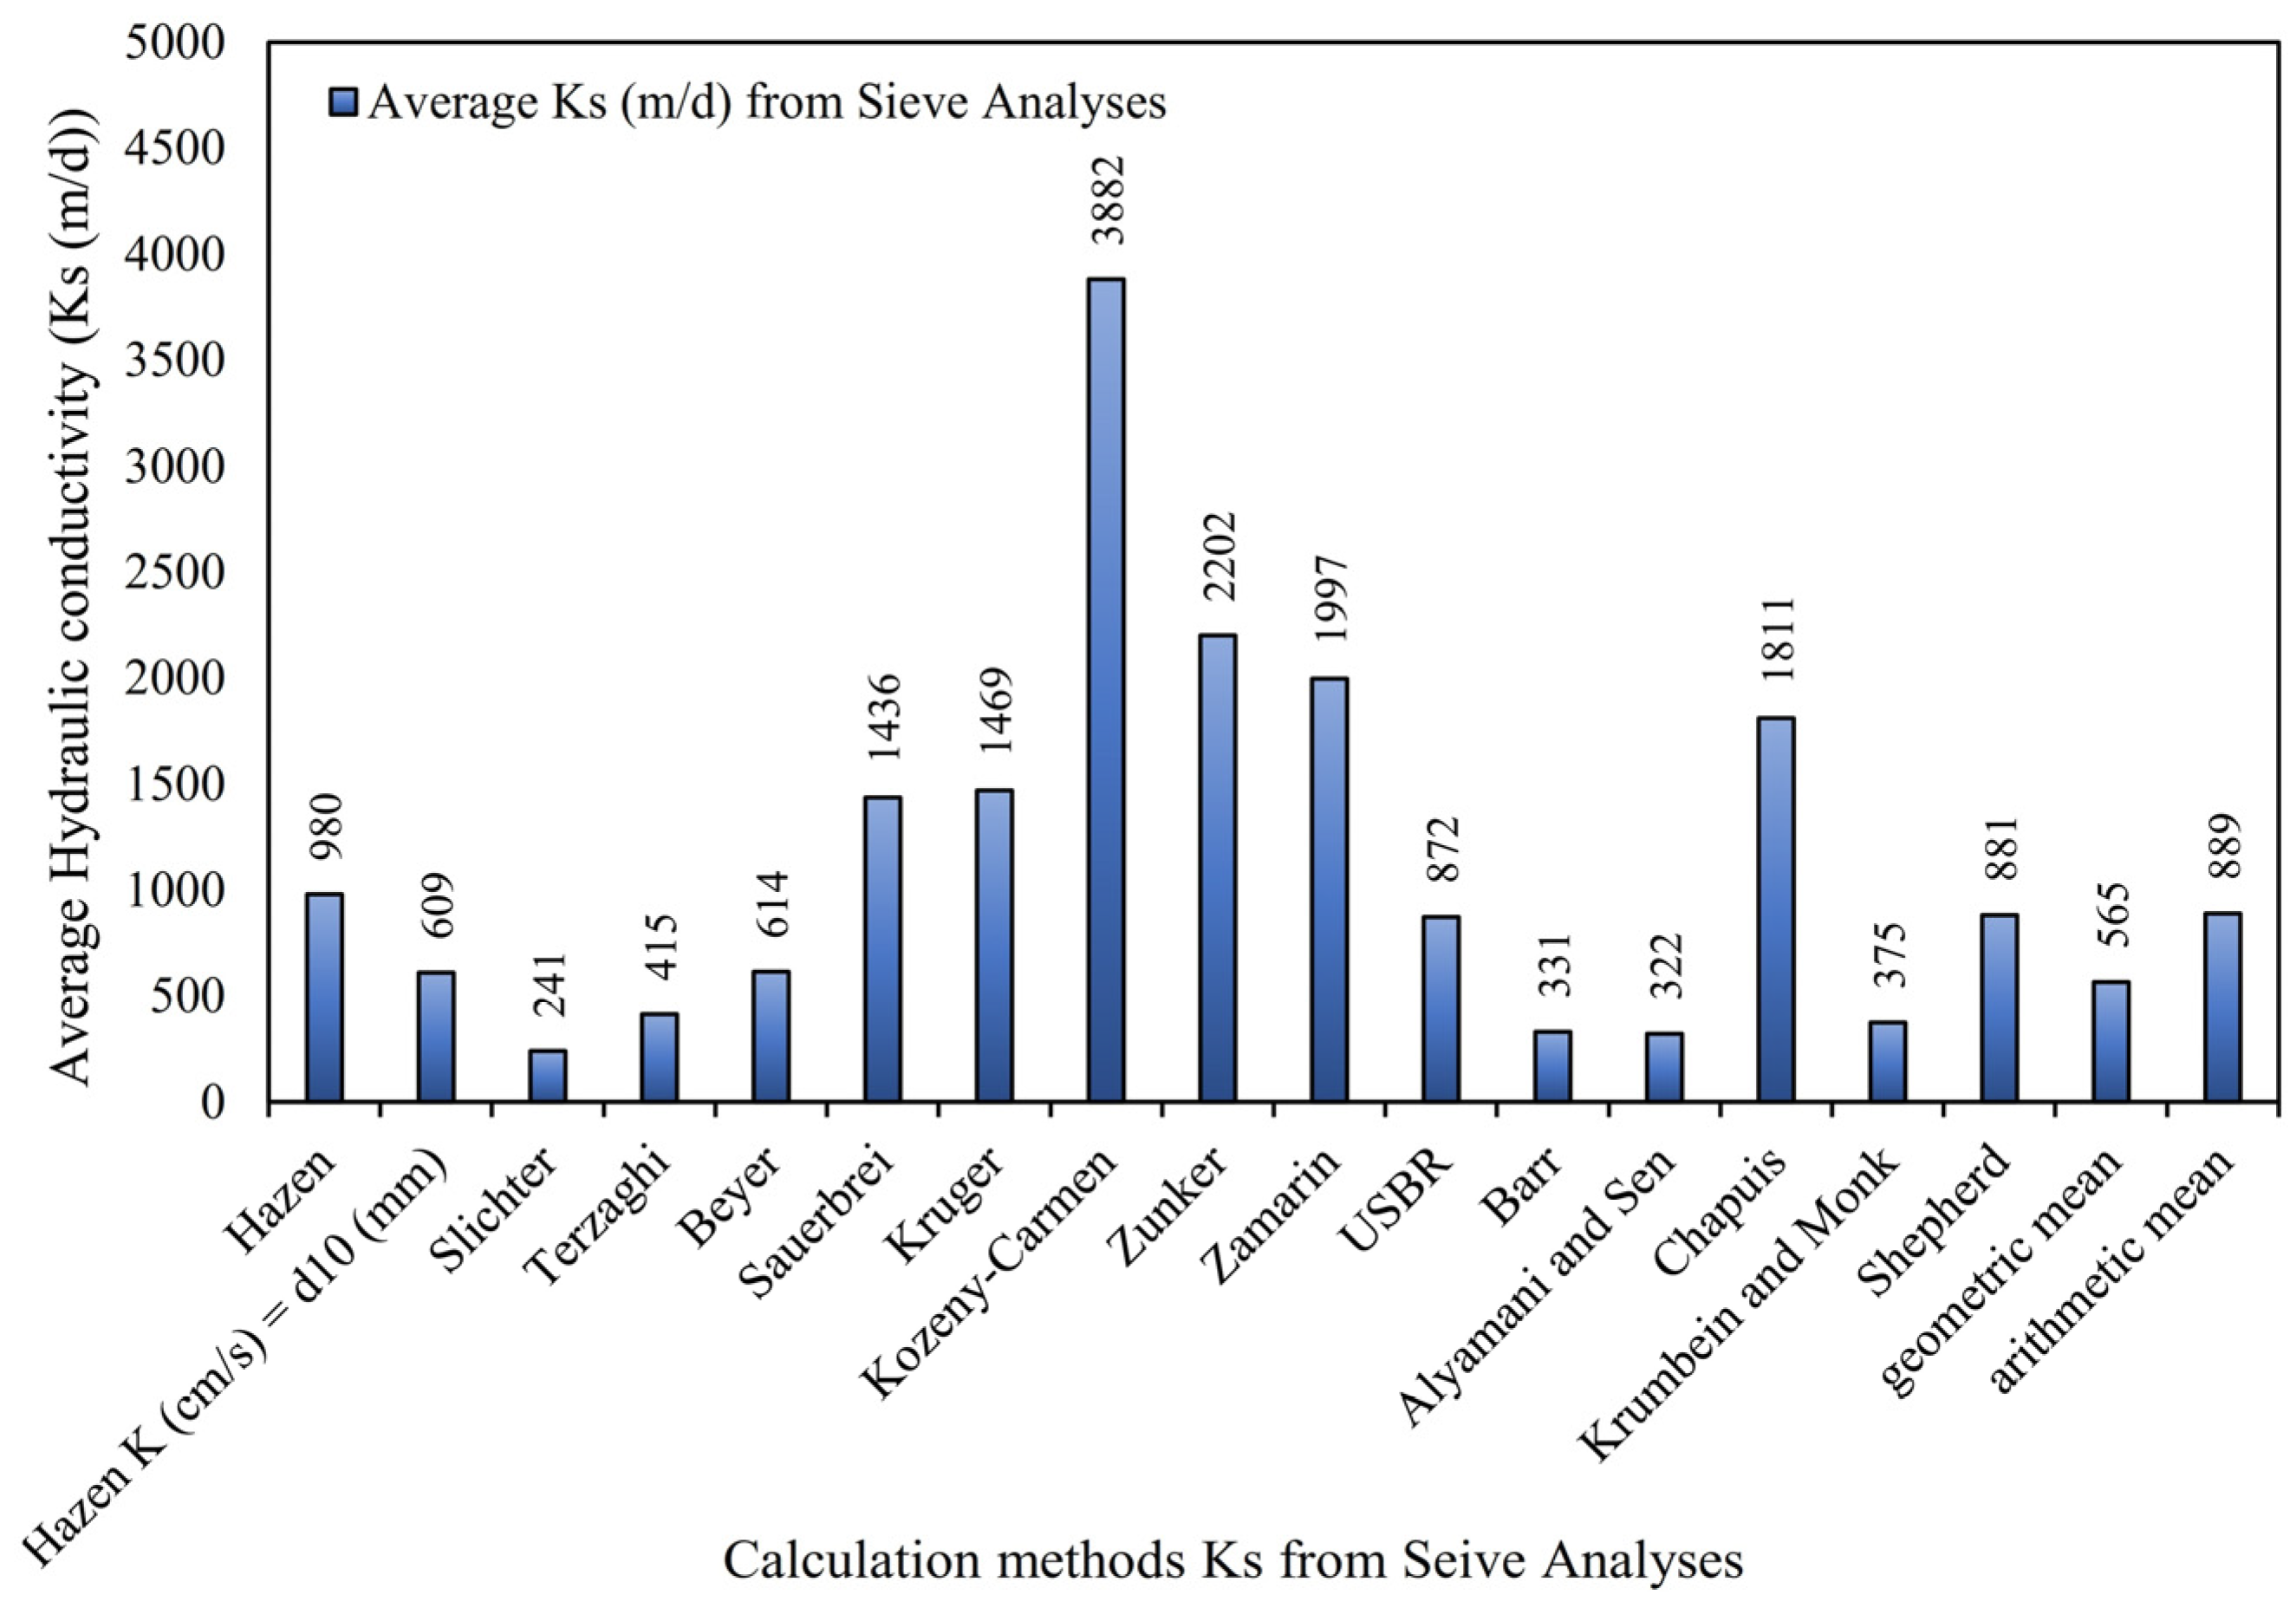
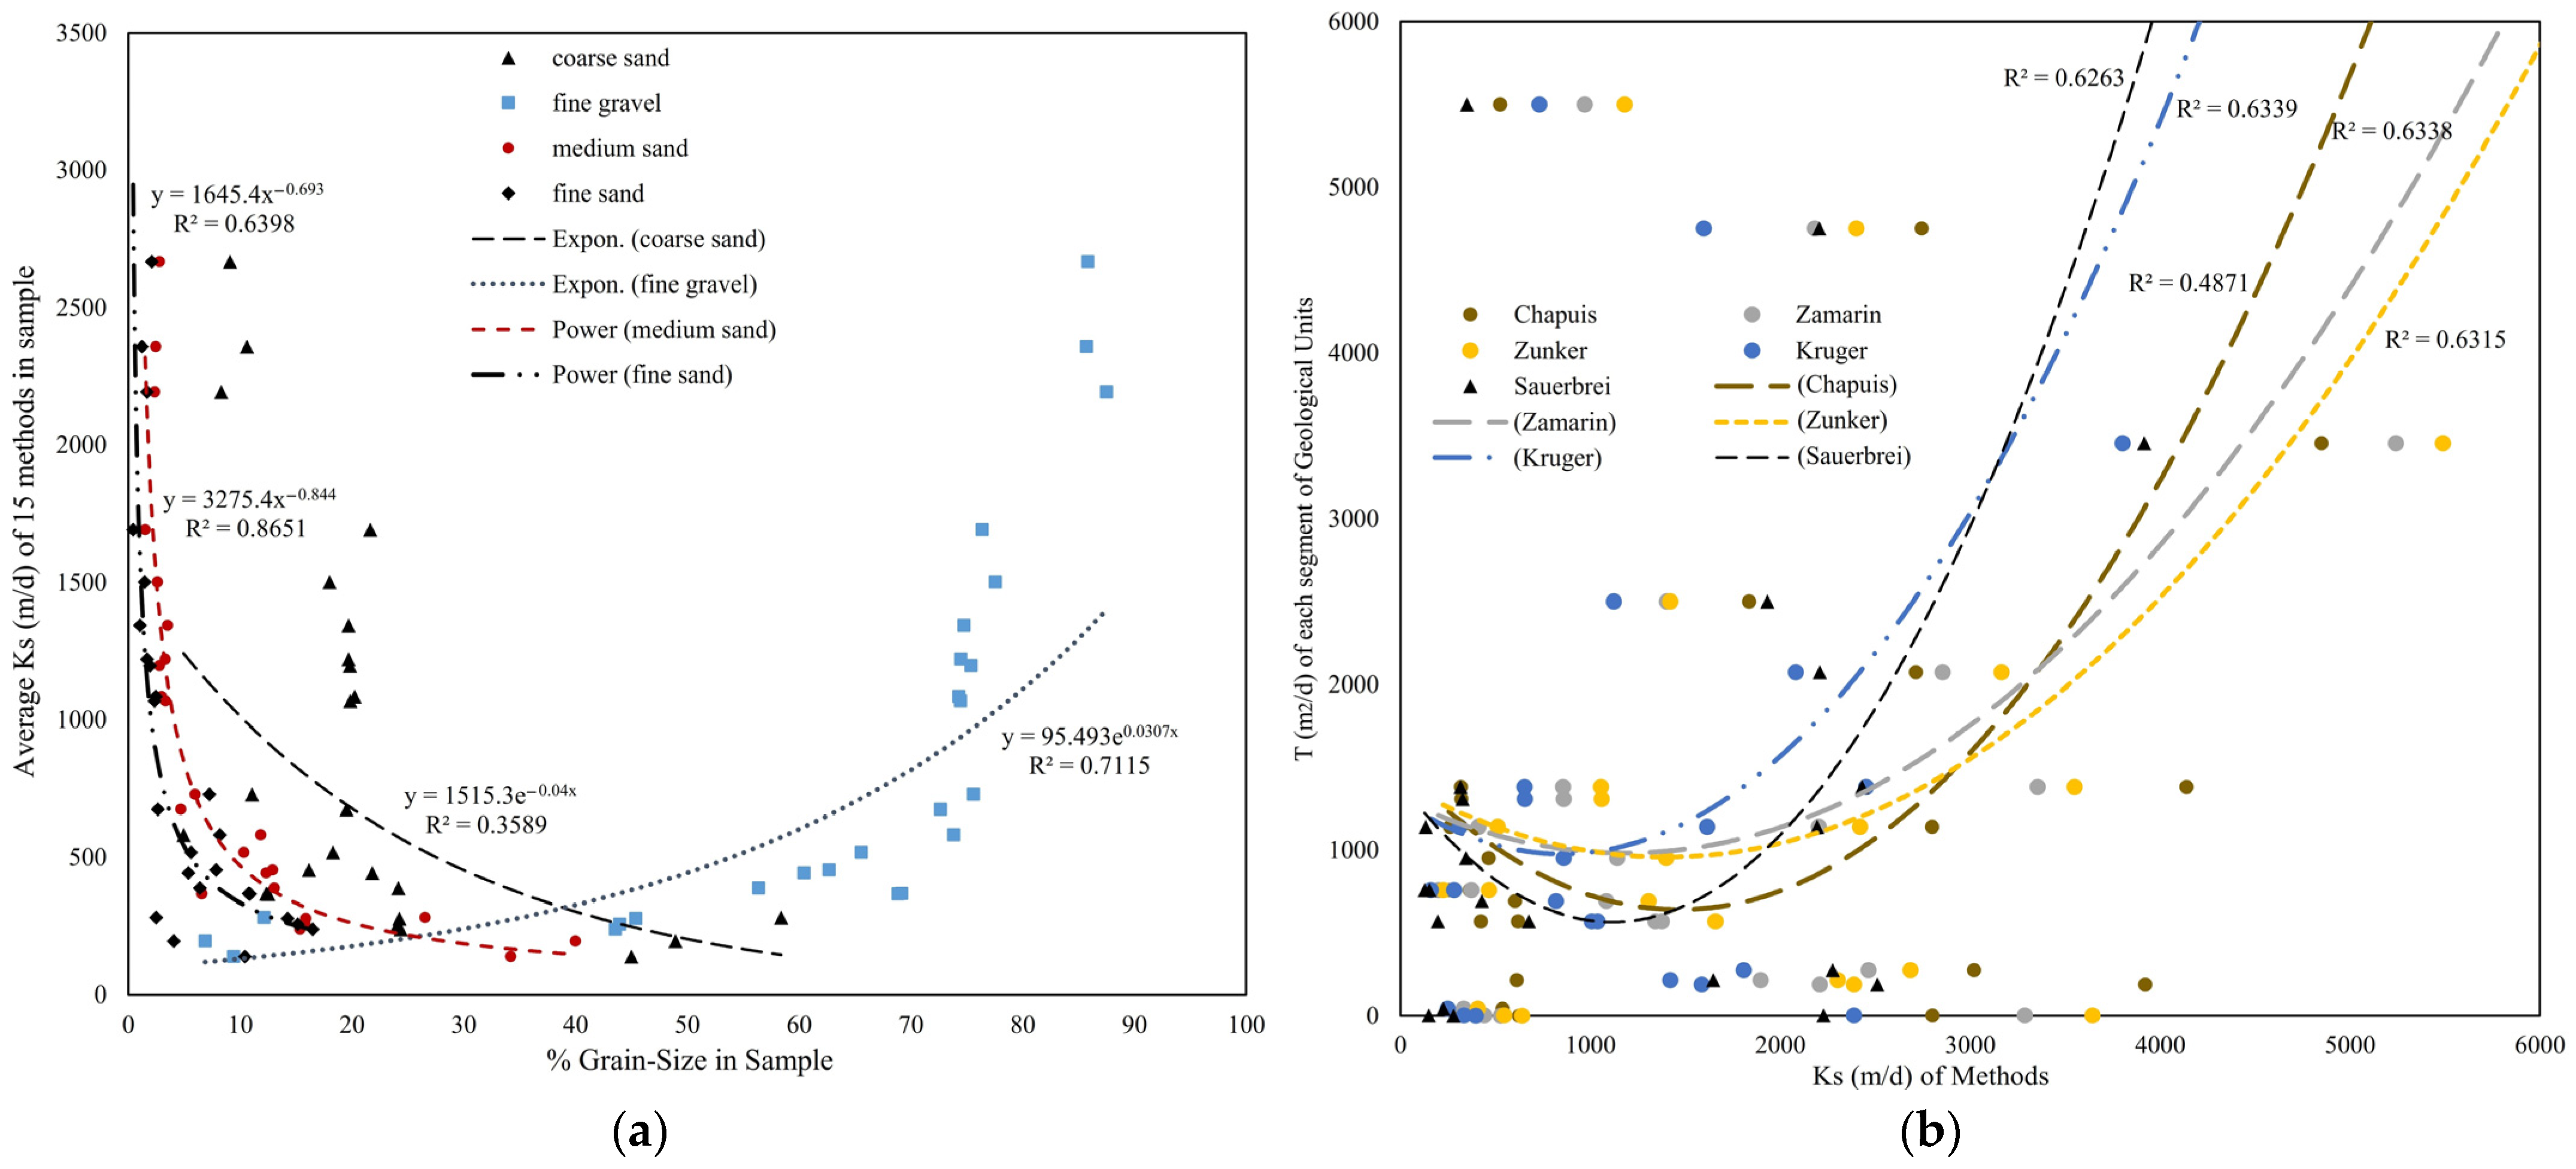
The average results obtained are presented in Figure 14, characterizing higher values due to sampling segments with the highest hydraulic conductivity without considering aquifer thickness; hence, the results are comparable with transmissivity values in the segments based on geological classification. Furthermore, correlation rates were calculated between the average hydraulic conductivity of fine gravel and coarse sand and the overall average hydraulic conductivity derived from the 15 mentioned methods, resulting in 99.5% and 60.6%, respectively. The linear and nearly direct correlation trends of fine gravel suggest the highest impact on the overall Ks, followed by coarse sand. Other particle sizes showed no significant relationship with the overall Ks (Figure 15). The results show that the Kruger, Zamarin, Zunker, Sauerbrei, and Chapuis measurement methods have correlation rates of 63.4%, 63.4%, 63.1%, 62.6%, and 48.7%, respectively, falling within good to acceptable ranges (Figure 16b).
Moreover, the predominant increase in hydraulic conductivity values is related to the percentage of gravel in the samples, demonstrating a positive correlation, despite the negative correlation in other particle sizes. After gravel, the percentage of medium sand exhibits the highest correlation with the decline in hydraulic conductivity, as the reduction in medium sand percentage is associated with an increase in hydraulic conductivity. Although this reduction is not straight and linear, in the high ranges of hydraulic conductivity, it has a steep slope. A similar behavior is noted for fine sand, showing a significant impact at high hydraulic conductivity values. However, the behavior of coarse sand is less clear due to its low correlation and varied percentages across different hydraulic conductivity ranges. In conclusion, the complex interaction of various grain sizes, particularly in sand with different particle sizes, creates heterogeneity in the results. The correlation coefficients between particle size percentage in the samples and hydraulic conductivity range from highest to lowest for medium sand, fine gravel, fine sand, and coarse sand, registering 86.5%, 71.1%, 64.0%, and 35.9%, respectively (Figure 16a).

5. Discussion: Evaluation of the Implemented Methods

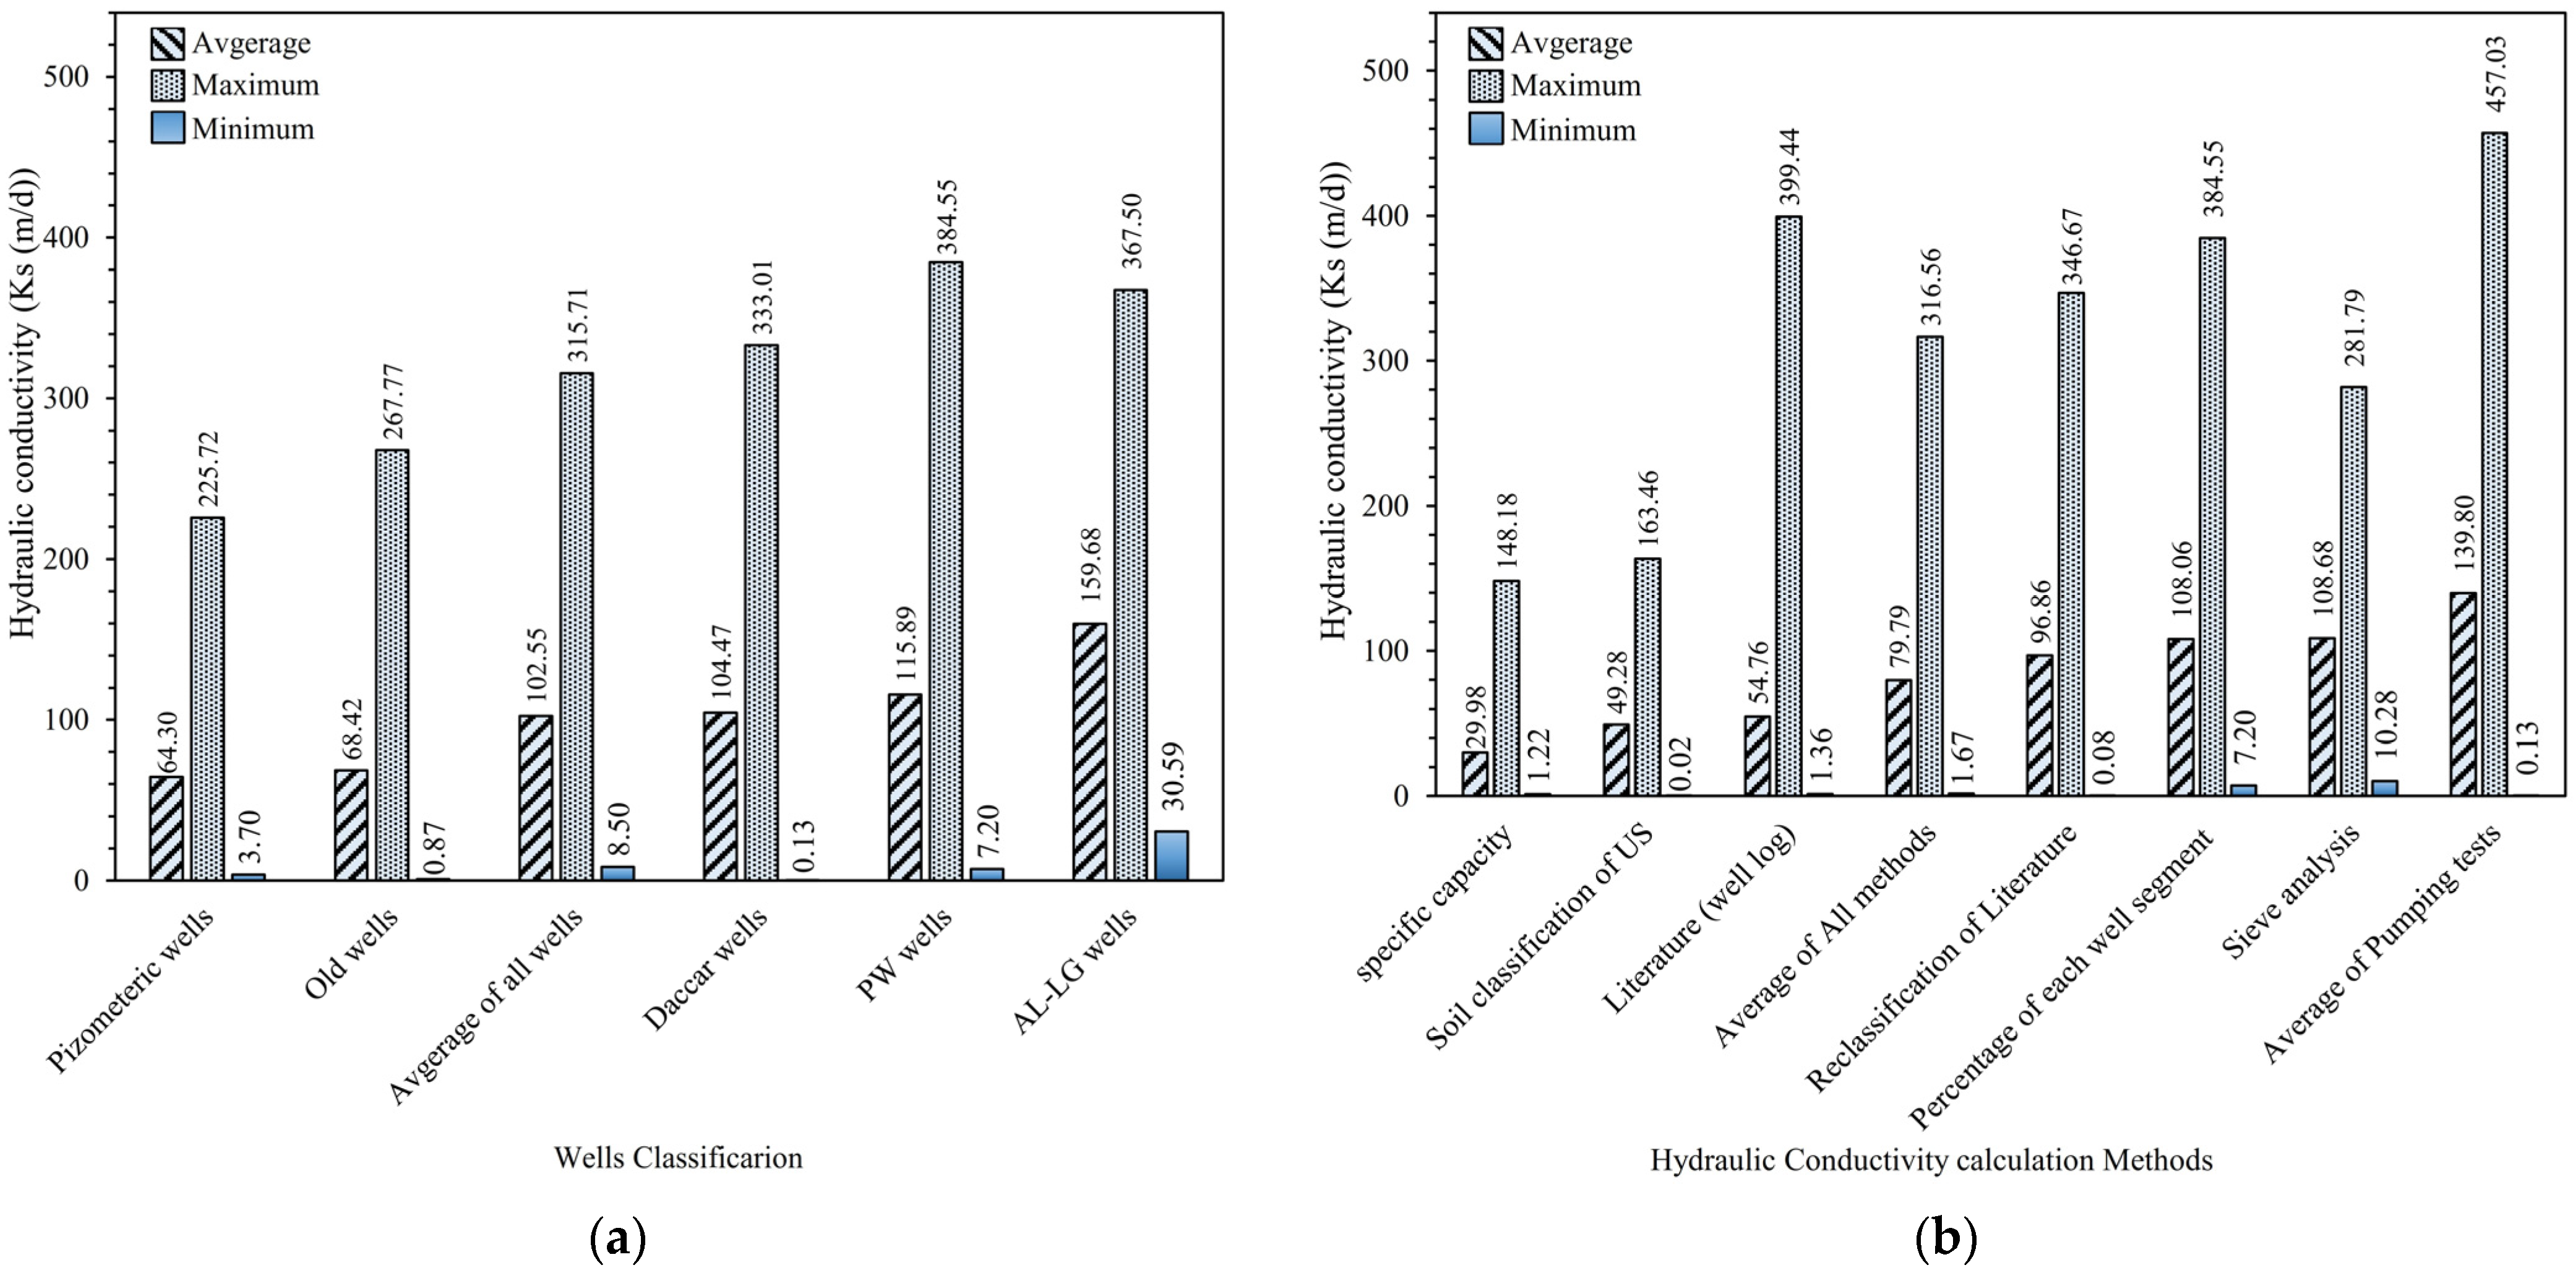
Hydraulic conductivity values were computed for all the mentioned well categories based on different approaches. As delineated in Figure 17a, AL-LG wells exhibit the highest recorded values, followed by PW and subsequently DACAAR wells, with average values of 159.7, 115.9, and 104.5 (m/d), respectively. Due to their strategic positioning within the vicinity of current riverbeds and providing valuable insights into groundwater dynamics, all three categories of wells were selected for hydrogeological investigations. From the perspective of the locational wells’ dispersion, piezometric and old wells, with average Ks values of 64.3 and 68.4 m/d, respectively, exhibit greater spatial dispersion compared with the aforementioned three categories, chosen respectively for monitoring both quantitative and qualitative fluctuations of groundwater and groundwater extraction. Therefore, considering that the infiltration rate and hydraulic conductivity within riverbeds significantly exceed those in other parts of the Kabul City plain, it is natural that the overall hydraulic conductivity in wells near riverbeds is higher than in other wells. Additionally, urbanization and subsequently groundwater extraction from other parts of the aquifer have led to a permanent decline in water levels and aquifer compaction. On the other hand, the homogeneity and isotropy of the shallow phreatic aquifer in the study area are at a very low level, so hydraulic conductivity fluctuations in wells even close to each other are not easily recognized. According to the calculations performed on the wells, the hydraulic conductivity has been obtained in the range of 8.5–315.2 m/d, and the average hydraulic conductivity of all wells in the area is 102.5 m/d (Figure 17a). The range obtained is significantly influenced by the geological setting. In areas where gravel and sand predominate in well logs, Ks values tend to be higher, whereas in areas dominated by other geological formations, Ks values are lower. As indicated by the results (Table 1 and Table 2 and Figure 2 and Figure 18a), the thickness of geological unit diversity in the shallow aquifer predominantly falls within high ranges. Therefore, it seems logical to obtain high ranges of Ks values.
In general, Figure 17b has been created to compare the scale of results obtained from different hydraulic conductivity calculation methods. Following the computation of maximum, minimum, and average values across all wells in the study area, the impact of scaling the raw data entered into the methods becomes apparent when juxtaposed with the hydraulic conductivity values derived from computational methods. In Figure 17b, from left to right, the scale of information and raw data entered into the wells increases. In these wells, two methods for calculating hydraulic conductivity through specific capacity and sieve analysis, respectively, due to the shallowness and high spatial dispersion of the old wells, and soil sampling from segments with the highest hydraulic conductivity levels are lying on low and high ranges of hydraulic conductivity. Therefore, as mentioned before by Nassimi and Mohammadi (2016) [88], these results explicitly indicate that as the scale of raw data entered into various computational methods for hydraulic conductivity calculations increases, the resulting hydraulic conductivity values from these methods will also be greater. Furthermore, a reliable estimate of hydraulic conductivity for a given point is achieved through the utilization of various methods. Each method establishes different rules and constraints along with s low level of the homogeneity and isotropy of the aquifer, leading to an approximate estimate of hydraulic conductivity, showing excessive scattering between data points in some figures, such as Figure 7d, Figure 11a,b and Figure 12a. The results caution against overlooking the scale at which Ks values are measured when incorporating them into numerical models. Failure to consider this scale disparity between observation and the model can lead to undefined predictions and decrease their reliability. Thus, it emphasizes the importance of accounting for scale differences to maintain the accuracy and validity of model predictions [11].
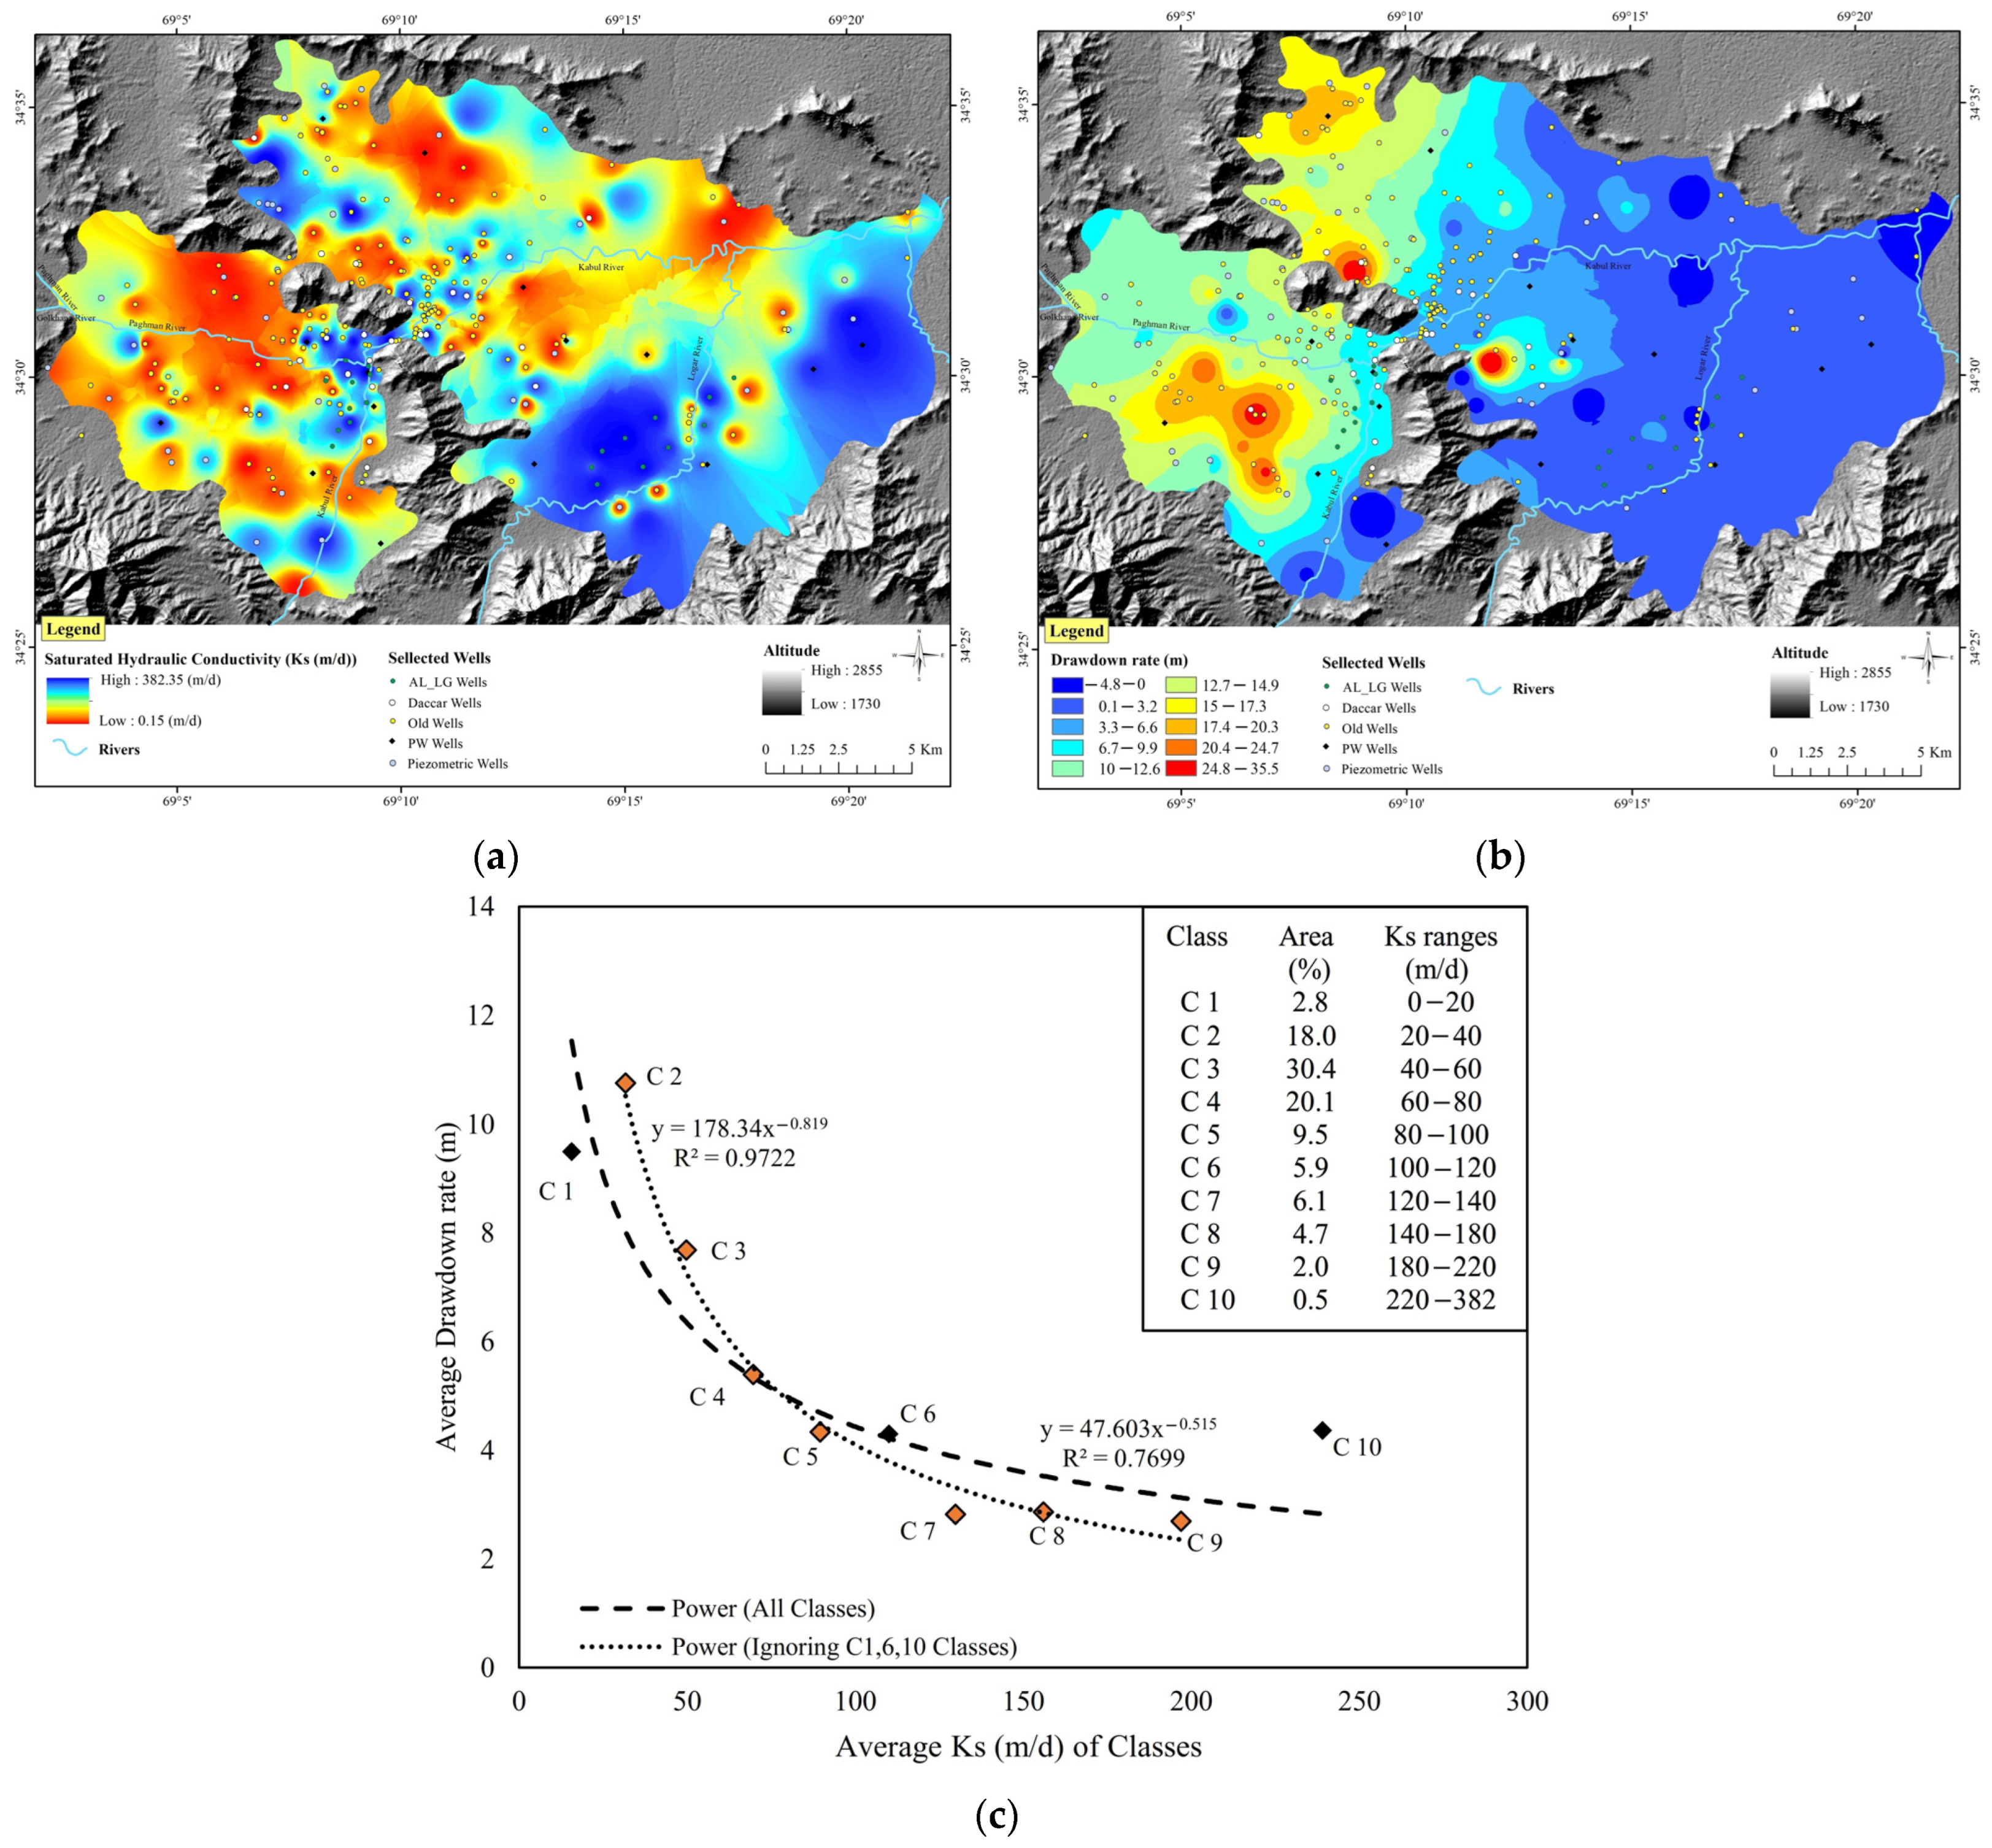
Overall computed hydraulic conductivity (Ks) from AL-LG, PW, piezometric, DACAAR, and old wells and obtained drawdown rates from monitoring wells in the 3 years from the water year 2016 to 2019 (Figure 1 and Figure 2) have been imported into the GIS environment and interpolated within the study area by Inverse Distance Weighting (IDW) and Kriging methods [29], respectively (Figure 18a,b). It is worth mentioning that the interpolation parameters include a pixel size of 12.5m × 12.5m and a search radius of 12 points. For Kriging, the method used is ordinary Kriging with a spherical semivariogram model, while for IDW interpolation, a power of 2 is used. By reclassifying and intersecting these two parameters, the average of the drawdown rate in each class of the overall average Ks parameter has been achieved. As shown in Figure 18c, the average accuracy of Ks is 77.0% for all classes, and when excluding classes C1, C6, and C10, it increases to 97.2%, demonstrating the reliability and applicability of the computed Ks. Furthermore, areas with high Ks values were found to correspond to zones exhibiting lower drawdown rates, indicating the role of the percolation process in declining the tensions on the shallow aquifer. The average value of the Ks map has been obtained as 70.6 m/d, closely approaching the average of all methods and the geological classification method based on derived Ks from pumping test results in Figure 17b, emphasizing high compatibility with the real conditions of the shallow aquifer.
This study has proven that the consequence of pumping test results, the utilization of predetermined values derived from empirical and laboratory approaches, while considering geological and classified soil materials, is a useful tool to achieve reliable Ks values through cost-effective and quick results, instead of applying expensive tests in arid and semi-arid areas. Furthermore, all applicable methods have inherent uncertainties and constraints, leading to a wide range of results. In this article, only reliable results are presented to avoid discrepancies with real aquifer conditions or unrealistic outcomes and to adhere to length circumscription.

6. Conclusions

Because the study area has been under severe water crisis and stress in the last few decades, the utilization of indirect methods was deemed necessary to estimate hydraulic conductivity and prevent jeopardizing the aquifer. The indirect methodology is particularly useful in regions where there is an unfavorable balance between water demand and availability, especially in areas where the volumes and seasonal distribution of water abstraction are unknown. However, the primary objective of this paper is to estimate reliable Ks through a combination of field, laboratory, and empirical methods applicable in the region in response to improving the management of groundwater abstraction and regional-scale overview of Ks. In the field, laboratory, and empirical or manual calculation methods, the Theis and Cooper–Jacob equations; the Kruger, Zamarin, Zunker, Sauerbrei, and Chapuis methods; and importing a well log dataset from each segment were in the good correlation rate ranges (60.0% to 75.0%). Moreover, the estimated Ks values related to alluvial particle sizes and geological classification were in the ranges of 8.6 × 10⁻⁵ to 4320 m/d, from hard conglomerates and shale to coarse gravel genus. As the predominant hydraulic conductivity of the shallow aquifer media lies within the gravel and sand parts, the obtained results fall within the high range of Ks classification, ranging from 30.0 to 139.8 m/d across various calculation methods. The impact of scaling was discerned in the computations, indicating a direct correlation wherein the magnitude of hydraulic conductivity increases proportionally with the augmentation of the raw data input scale. The resulting Ks map emphasizes a high accuracy (77.0%) with the real conditions of the aquifer regarding the drawdown rate map to discover the vulnerable areas. As a result, obtaining a reliable estimate of hydraulic conductivity requires the utilization of various methods, which entail the acquisition of extensive datasets. Nonetheless, cost-effective methodologies can be prioritized in this endeavor due to the lower costs and quick results. Applying the methods and results of this study to arid and semi-arid areas is highly recommended because obtaining accurate hydraulic conductivity in these areas is considered difficult and far from expected due to the endangerment of water resources.

Supplementary Materials

The following supporting information can be downloaded at https://www.mdpi.com/article/10.3390/w16152204/s1, Figure S1: Correlation coefficients for (a) the Ks values ratio obtained from the geological classification method and (b) the percentage of gravel across the well column; (c) the transmissivity values obtained from the Razack and Huntley method; (d) Ks values by the specific capacity of the wells (d) showing no significant.; Table S1: The chosen equations linking hydraulic conductivity, porosity, and effective grain size ex-tended by Devlin, 2015, and Vukovic and Soro, 1992, [50,88]. References [89,90] are cited in the Supplementary Materials.

Author Contributions

All authors contributed to the study conception and design. Material preparation, data collection, and analysis were performed by A.M., Z.M., J.H., A.F., V.S. and D.L. The first draft of the manuscript was written by A.M. and Z.M. and all authors commented on previous versions of the manuscript. Final review and editing were made by Z.M., J.H., A.F., V.S. and D.L. Data provision and fieldwork were arranged by A.M. and A.F. All authors have read and agreed to the published version of the manuscript.

Funding

This research received no external funding.

Data Availability Statement

All data used in this manuscript are available to support the findings of this research in a public repository.

Acknowledgments

The used data were provided by the Ministry of Energy and Water, the Ministry of Mines and Petroleum, and the Ministry of Urban Development and Land of Afghanistan. This research was also supported by Shiraz University and Ferdowsi University of Mashhad, Iran. The authors are grateful to three anonymous reviewers for their helpful and constructive comments and suggestions.

Conflicts of Interest

The authors declare no conflicts of interest.

References

  1. Darcy, H. Les Fontaines Publiques de la Ville de Dijon: Exposition et Application des Principes à Suivre et des Formules à Employer dans les Questions de Distribution D’eau; Dalmont, V., Ed.; Hachette Livre BNF: Paris, France, 1856; Volume 1. [Google Scholar]
  2. Alyamani, M.S.; Şen, Z. Determination of hydraulic conductivity from complete grain-size distribution curves. Groundwater 1993, 31, 551–555. [Google Scholar] [CrossRef]
  3. Mallants, D.; Jacques, D.; Tseng, P.-H.; van Genuchten, M.T.; Feyen, J. Comparison of three hydraulic property measurement methods. J. Hydrol. 1997, 199, 295–318. [Google Scholar] [CrossRef]
  4. Jadczyszyn, J.; Niedźwiecki, J. Relation of Saturated Hydraulic Conductivity to Soil Losses. Pol. J. Environ. Stud. 2005, 14, 431–435. [Google Scholar]
  5. Zhang, Y.; Schaap, M.G. Estimation of saturated hydraulic conductivity with pedotransfer functions: A review. J. Hydrol. 2019, 575, 1011–1030. [Google Scholar] [CrossRef]
  6. Mohammed, M.A.; Szabó, N.P.; Szűcs, P. Exploring hydrogeological parameters by integration of geophysical and hydrogeological methods in northern Khartoum state, Sudan. Groundw. Sustain. Dev. 2023, 20, 100891. [Google Scholar] [CrossRef]
  7. Dai, Y.; Shangguan, W.; Duan, Q.; Liu, B.; Fu, S.; Niu, G. Development of a China dataset of soil hydraulic parameters using pedotransfer functions for land surface modeling. J. Hydrometeorol. 2013, 14, 869–887. [Google Scholar] [CrossRef]
  8. Vereecken, H.; Schnepf, A.; Hopmans, J.W.; Javaux, M.; Or, D.; Roose, T.; Vanderborght, J.; Young, M.; Amelung, W.; Aitkenhead, M. Modeling soil processes: Review, key challenges, and new perspectives. Vadose Zone J. 2016, 15, 1–57. [Google Scholar] [CrossRef]
  9. Bravo-Cadena, J.; Pavón, N.P.; Balvanera, P.; Sánchez-Rojas, G.; Razo-Zarate, R. Water availability–demand balance under climate change scenarios in an overpopulated region of Mexico. Int. J. Environ. Res. Public Health 2021, 18, 1846. [Google Scholar] [CrossRef] [PubMed]
  10. Uma, K.; Egboka, B.; Onuoha, K. New statistical grain-size method for evaluating the hydraulic conductivity of sandy aquifers. J. Hydrol. 1989, 108, 343–366. [Google Scholar] [CrossRef]
  11. Sun, D.; Luo, N.; Vandenhoff, A.; McCall, W.; Zhao, Z.; Wang, C.; Rudolph, D.L.; Illman, W.A. Evaluation of Hydraulic Conductivity Estimates from Various Approaches with Groundwater Flow Models. Groundwater 2024, 62, 384–404. [Google Scholar] [CrossRef]
  12. Hazen, A. XXIII. Some physical properties of sands and gravels, with special reference to their use in filtration. In State Sanitation Volume II; Harvard University Press: Cambridge, MA, USA, 1917; pp. 232–248. [Google Scholar]
  13. Siosemarde, M.; Nodehi, D.A. Effect of Wells on Aquifers Water Table-Maaroof Siosemarde and Davood Akbari Nodehi. 2014. Available online: http://gnanaganga.inflibnet.ac.in:8080/jspui/handle/123456789/10569 (accessed on 14 November 2014).
  14. Fan, Z.; Parashar, R. Transient flow to a finite-radius well with wellbore storage and skin effect in a poroelastic confined aquifer. Adv. Water Resour. 2020, 142, 103604. [Google Scholar] [CrossRef]
  15. Rezaei, M.; Mousavi, S.R.; Rahmani, A.; Zeraatpisheh, M.; Rahmati, M.; Pakparvar, M.; Mahjenabadi, V.A.J.; Seuntjens, P.; Cornelis, W. Incorporating machine learning models and remote sensing to assess the spatial distribution of saturated hydraulic conductivity in a light-textured soil. Comput. Electron. Agric. 2023, 209, 107821. [Google Scholar] [CrossRef]
  16. Timlin, D.; Ahuja, L.; Pachepsky, Y.; Williams, R.; Gimenez, D.; Rawls, W. Use of Brooks-Corey parameters to improve estimates of saturated conductivity from effective porosity. Soil Sci. Soc. Am. J. 1999, 63, 1086–1092. [Google Scholar] [CrossRef]
  17. Fallico, C.; Vita, M.C.; De Bartolo, S.; Straface, S. Scaling effect of the hydraulic conductivity in a confined aquifer. Soil Sci. 2012, 177, 385–391. [Google Scholar] [CrossRef]
  18. Mohammed, M.A.; Szabó, N.P.; Flores, Y.G.; Szűcs, P. Multi-well clustering and inverse modeling-based approaches for exploring geometry, petrophysical, and hydrogeological parameters of the Quaternary aquifer system around Debrecen area, Hungary. Groundw. Sustain. Dev. 2024, 24, 101086. [Google Scholar] [CrossRef]
  19. Ibrahim, K.O.; Gomo, M.; Oke, S.A.; Yusuf, M.A. A new method for estimating hydraulic conductivity in un-screened concrete-lined large-diameter hand-dug wells. Groundw. Sustain. Dev. 2020, 11, 100443. [Google Scholar] [CrossRef]
  20. Peters, A.; Hohenbrink, T.L.; Iden, S.C.; Van Genuchten, M.T.; Durner, W. Prediction of the absolute hydraulic conductivity function from soil water retention data. Hydrol. Earth Syst. Sci. Discuss. 2023, 27, 1565–1582. [Google Scholar] [CrossRef]
  21. Assari, A.; Mohammadi, Z. Assessing flow paths in a karst aquifer based on multiple dye tracing tests using stochastic simulation and the MODFLOW-CFP code. Hydrogeol. J. 2017, 25, 1679. [Google Scholar] [CrossRef]
  22. Tilahun, T.; Korus, J. 3D hydrostratigraphic and hydraulic conductivity modelling using supervised machine learning. Appl. Comput. Geosci. 2023, 19, 100122. [Google Scholar] [CrossRef]
  23. Omar, M.T. Kabul: Rebirth of a City; University of Minnesota: Minneapolis, MN, USA, 2018. [Google Scholar]
  24. Farahmand, A.; Hussaini, M.S.; Zaryab, A.; Aqili, S.W. Evaluation of Hydrogeoethics approach for sustainable management of groundwater resources in the upper Kabul sub-basin, Afghanistan. Sustain. Water Resour. Manag. 2021, 7, 48. [Google Scholar] [CrossRef]
  25. Zaryab, A.; Farahmand, A.; Nassery, H.R.; Alijani, F.; Ali, S.; Jamal, M.Z. Hydrogeochemical and isotopic evolution of groundwater in shallow and deep aquifers of the Kabul Plain, Afghanistan. Environ. Geochem. Health 2023, 45, 8503–8522. [Google Scholar] [CrossRef] [PubMed]
  26. Hussainzadeh, J.; Samani, S.; Mahaqi, A. Investigation of the geochemical evolution of groundwater resources in the Zanjan plain, NW Iran. Environ. Earth Sci. 2023, 82, 123. [Google Scholar] [CrossRef]
  27. Calogero, P. Kabul: The 21st-century urbanism we did not expect. In Routledge Handbook of Asian Cities; Routledge: London, UK, 2023; pp. 238–248. [Google Scholar]
  28. Brati, M.Q.; Ishihara, M.I.; Higashi, O. Groundwater level reduction and pollution in relation to household water management in Kabul, Afghanistan. Sustain. Water Resour. Manag. 2019, 5, 1315–1325. [Google Scholar] [CrossRef]
  29. Mohammaddost, A.; Mohammadi, Z.; Rezaei, M.; Pourghasemi, H.R.; Farahmand, A. Assessment of groundwater vulnerability in an urban area: A comparative study based on DRASTIC, EBF, and LR models. Environ. Sci. Pollut. Res. 2022, 29, 72908–72928. [Google Scholar] [CrossRef] [PubMed]
  30. Bohannon, R.G. Geologic and Topographic Maps of the Kabul South 30ʹ x 60ʹ Quadrangle, Afghanistan; U.S. Department of the Interior, US Geological Survey: Reston, VA, USA, 2010.
  31. Hussaini, M.S.; Farahmand, A.; Shrestha, S.; Neupane, S.; Abrunhosa, M. Site selection for managed aquifer recharge in the city of Kabul, Afghanistan, using a multi-criteria decision analysis and geographic information system. Hydrogeol. J. 2022, 30, 59–78. [Google Scholar] [CrossRef]
  32. Jawadi, H.A.; Iqbal, M.W.; Naseri, M.; Farahmand, A.; Azizi, A.H.; Eqrar, M.N. Nitrate contamination in groundwater of Kabul Province, Afghanistan: Reasons behind and conceptual management framework discourse. J. Mt. Sci. 2022, 19, 1274–1291. [Google Scholar] [CrossRef]
  33. Japan International Cooperation Agency (JICA) Study Team. Draft Kabul City Master Plan: Product of Technical Cooperation Project for Promotion of Kabul Metropolitan Area Development Sub Project for Revise the Kabul City Master Plan; Japan International Cooperation Agency: Tokyo, Japan, 2011.
  34. Houben, G.; Niard, N.; Tünnermeier, T.; Himmelsbach, T. Hidrogeologia da Bacia de Cabul (Afeganistão), parte I: Aquíferos e hidrologia. Hydrogeol. J. 2009, 17, 665–677. [Google Scholar] [CrossRef]
  35. Böckh, E. Report on the Groundwater Resources of the City of Kabul-Report for BUNDESANSTALT FÜR GEOWISSENSCHAFTEN UND ROHSTOFFE. BGR File 1971, 43, unpublished. [Google Scholar]
  36. Theis, C.V. The relation between the lowering of the piezometric surface and the rate and duration of discharge of a well using ground-water storage. Eos Trans. Am. Geophys. Union 1935, 16, 519–524. [Google Scholar] [CrossRef]
  37. Cooper, H., Jr.; Jacob, C.E. A generalized graphical method for evaluating formation constants and summarizing well-field history. Eos Trans. Am. Geophys. Union 1946, 27, 526–534. [Google Scholar]
  38. Birsoy, Y.K.; Summers, W. Determination of aquifer parameters from step tests and intermittent pumping data. Ground Water 1980, 18, 137–146. [Google Scholar] [CrossRef]
  39. Neuman, S.P. Theory of flow in unconfined aquifers considering delayed response of the water table. Water Resour. Res. 1972, 8, 1031–1045. [Google Scholar] [CrossRef]
  40. Neuman, S.P. Effect of partial penetration on flow in unconfined aquifers considering delayed gravity response. Water Resour. Res. 1974, 10, 303–312. [Google Scholar] [CrossRef]
  41. Tartakovsky, G.D.; Neuman, S.P. Three-dimensional saturated-unsaturated flow with axial symmetry to a partially penetrating well in a compressible unconfined aquifer. Water Resour. Res. 2007, 43. [Google Scholar] [CrossRef]
  42. Kruseman, G.; de Ridder, N. Analysis and Evaluation of Pumping Test Data, 2nd ed.; International Institute for Land Reclamation and Improvement: Wageningen, The Netherlands, 1990; 372p. [Google Scholar]
  43. Theis, C.V.; Brown, R.H.; Meyer, R. Estimating the Transmissibility of Aquifers from the Specific Capacity of Wells; US Geological Survey: Reston, VA, USA, 1963.
  44. Razack, M.; Huntley, D. Assessing transmissivity from specific capacity in a large and heterogeneous alluvial aquifer. Groundwater 1991, 29, 856–861. [Google Scholar] [CrossRef]
  45. Slichter, C.S. Theoretical Investigation of the Motion of Ground Waters; 19th Annual Report; US Geophys Survey: Reston, VA, USA, 1899; pp. 304–319. [Google Scholar]
  46. Krüger, E. Die grundwasserbewegung. Int. Mitteilungen Für Bodenkd. 1918, 8, 105–122. [Google Scholar]
  47. Terzaghi, K. Principles of soil mechanics. Eng. News-Rec. 1925, 95, 19–32. [Google Scholar]
  48. Zamarin, J.A. Calculation of ground-water flow. Trudey I.V.H, Taskeni 1928. (In Russian)
  49. Zunker, F. Das Verhalten des Wassers zum Boden [The behavior of groundwater]. Z. Pflanzenernähr. Düng. Bodenkd. 1930, 25. [Google Scholar]
  50. Vuković, M.; Soro, A. Determination of Hydraulic Conductivity of Porous Media from Grain-Size Composition; Water Resources Publications: Littleton, CO, USA, 1992. [Google Scholar]
  51. Krumbein, W.; Monk, G. Permeability as a function of the size parameters of unconsolidated sand. Trans. AIME 1943, 151, 153–163. [Google Scholar] [CrossRef]
  52. Kozeny, J. Das wasser im boden. Grundwasserbewegung. In Hydraulik: Ihre Grundlagen und Praktische Anwendung; Springer: Berlin/Heidelberg, Germany, 1953; pp. 380–445. [Google Scholar]
  53. Beyer, W. On the determination of hydraulic conductivity of gravels and sands from grain-size distributions. Wasserwirtsch.-Wassertech. 1964, 14, 165–169. [Google Scholar]
  54. Białas, Z. O Usrednianiu Wspolczynnikow Filtracji z Zastosowaniem Elektronicznej Cyfrowej Maszyny Matematycznej [Averaging Filter Coefficients Using Digital Electronic Mathematical Machines]; Przedsiebiorstwo Geologiczne we Wroclawiu: Warsaw, Poland, 1966; pp. 47–50. [Google Scholar]
  55. Freeze, R.A.; Cherry, J.A. Groundwater prentice-hall. Englewood Cliffs NJ 1979, 176, 161–177. [Google Scholar]
  56. Barr, D.W. Coefficient of permeability determined by measurable parameters. Groundwater 2001, 39, 356–361. [Google Scholar] [CrossRef] [PubMed]
  57. Chapuis, R.P. Predicting the saturated hydraulic conductivity of sand and gravel using effective diameter and void ratio. Can. Geotech. J. 2004, 41, 787–795. [Google Scholar] [CrossRef]
  58. Devlin, J. HydrogeoSieveXL: Uma ferramenta baseada no Excel para estimar condutividade hidráulica a partir de análises do tamanho de partículas. Hydrogeol. J. 2015, 23, 837–844. [Google Scholar] [CrossRef]
  59. Odong, J. Evaluation of empirical formulae for determination of hydraulic conductivity based on grain-size analysis. J. Am. Sci. 2007, 3, 54–60. [Google Scholar]
  60. Maurya, P.K.; Balbarini, N.; Møller, I.; Rønde, V.; Christiansen, A.V.; Bjerg, P.L.; Auken, E.; Fiandaca, G. Subsurface imaging of water electrical conductivity, hydraulic permeability and lithology at contaminated sites by induced polarization. Geophys. J. Int. 2018, 213, 770–785. [Google Scholar] [CrossRef]
  61. Cormican, A.; Devlin, J.; Divine, C. Grain size analysis and permeametry for estimating hydraulic conductivity in engineered porous media. Groundw. Monit. Remediat. 2020, 40, 65–72. [Google Scholar] [CrossRef]
  62. Lin, R. Comparative Analysis of Methods to Determine Permeability. 2021. Available online: https://studenttheses.uu.nl/handle/20.500.12932/188 (accessed on 14 November 2014).
  63. Lévy, L.; Thalund-Hansen, R.; Bording, T.; Fiandaca, G.; Christiansen, A.V.; Rügge, K.; Tuxen, N.; Hag, M.; Bjerg, P. Quantifying reagent spreading by cross-borehole electrical tomography to assess performance of groundwater remediation. Water Resour. Res. 2022, 58, e2022WR032218. [Google Scholar] [CrossRef]
  64. Seth., S.M. Determination of hydraulic Conductivity of Soils in Central Bihar. India. Print. 1998. Available online: https://nihroorkee.gov.in/sites/default/files/Determination_of_Hydraulic_Conductivity_of_Soils_in_Central_Bihar.pdf (accessed on 14 November 2014).
  65. Lewis, M.; Cheney, C.; Odochartaigh, B. Guide to Permeability Indices; British Geological Survey Open Report; CR/06; British Geological Survey: Nottingham, UK, 2006. [Google Scholar]
  66. Hwang, H.-T.; Jeen, S.-W.; Suleiman, A.A.; Lee, K.-K. Comparison of saturated hydraulic conductivity estimated by three different methods. Water 2017, 9, 942. [Google Scholar] [CrossRef]
  67. Duffield, G. Aquifer Testing 101: Hydraulic Properties Representative Values of Hydraulic Properties. 2019. Available online: http://www.aqtesolv.com/aquifer-tests/aquifer_properties.htm (accessed on 14 November 2014).
  68. United States Department of Agriculture, Natural Resources Conservation Service (USDA NRCS). (n.d.). Saturated Hydraulic Conductivity in Relation to Soil Texture. Available online: https://www.nrcs.usda.gov/wps/portal/nrcs/detail/soils/survey/office/ssr10/tr/?cid=nrcs144p2_074846 (accessed on 14 November 2014).
  69. Widodo, L.E.; Cahyadi, T.A.; Notosiswoyo, S.; Widijanto, E. Application of clustering system to analyze geological, geotechnical and hydrogeological data base according to HC-system approach. In Proceedings of the 9th Asian Rock Mechanics Symposium, Bali, Indonesia, 18–20 October 2016. [Google Scholar]
  70. Shepard, D. A two-dimensional interpolation function for irregularly-spaced data. In Proceedings of the 1968 23rd ACM National Conference, New York, NY, USA, 27–29 August 1968; pp. 517–524. [Google Scholar]
  71. Li, J.; Heap, A.D. Spatial interpolation methods applied in the environmental sciences: A review. Environ. Model. Softw. 2014, 53, 173–189. [Google Scholar] [CrossRef]
  72. Workneh, H.T.; Chen, X.; Ma, Y.; Bayable, E.; Dash, A. Comparison of IDW, Kriging and orographic based linear interpolations of rainfall in six rainfall regimes of Ethiopia. J. Hydrol. Reg. Stud. 2024, 52, 101696. [Google Scholar] [CrossRef]
  73. Matheron, G. Principles of geostatistics. Econ. Geol. 1963, 58, 1246–1266. [Google Scholar] [CrossRef]
  74. Oliver, M.; Webster, R. A tutorial guide to geostatistics: Computing and modelling variograms and kriging. Catena 2014, 113, 56–69. [Google Scholar] [CrossRef]
  75. Murakami, D.; Yamagata, Y.; Hirano, T. Geostatistics and Gaussian process models. In Spatial Analysis Using Big Data; Elsevier: Amsterdam, The Netherlands, 2020; pp. 57–112. [Google Scholar]
  76. Yamamoto, J.K. An alternative measure of the reliability of ordinary kriging estimates. Math. Geol. 2000, 32, 489–509. [Google Scholar] [CrossRef]
  77. Journel, A.G.; Huijbregts, C.H.J. Mining Geostatistics; Academic Press: London, UK, 1978. [Google Scholar]
  78. Goovaerts, P. Kriging and semivariogram deconvolution in the presence of irregular geographical units. Math. Geosci. 2008, 40, 101–128. [Google Scholar] [CrossRef]
  79. Isaaks, E.H.; Srivastava, R.M. Applied Geostatistics; Oxford University Press: Oxford, UK, 1989. [Google Scholar]
  80. Chiles, J.-P.; Delfiner, P. Geostatistics: Modeling Spatial Uncertainty; John Wiley & Sons: Hoboken, NJ, USA, 2012; Volume 713. [Google Scholar]
  81. Krásný, J. Classification of transmissivity magnitude and variation. Groundwater 1993, 31, 230–236. [Google Scholar] [CrossRef]
  82. Jacob, C.E. On the flow of water in an elastic artesian aquifer. Eos Trans. Am. Geophys. Union 1940, 21, 574–586. [Google Scholar]
  83. Şen, Z. Practical and Applied Hydrogeology; Elsevier: Amsterdam, The Netherlands, 2014. [Google Scholar]
  84. Dixon, K.; Nichols, R. Permeability estimation from transient vadose zone pumping tests in shallow coastal-plain sediments. Environ. Geosci. 2005, 12, 279–289. [Google Scholar] [CrossRef]
  85. Mastrocicco, M.; Vignoli, G.; Colombani, N.; Zeid, N.A. Surface electrical resistivity tomography and hydrogeological characterization to constrain groundwater flow modeling in an agricultural field site near Ferrara (Italy). Environ. Earth Sci. 2010, 61, 311–322. [Google Scholar] [CrossRef]
  86. Miller, O.L.; Solomon, D.K.; Miège, C.; Koenig, L.S.; Forster, R.R.; Montgomery, L.N.; Schmerr, N.; Ligtenberg, S.R.; Legchenko, A.; Brucker, L. Hydraulic conductivity of a firn aquifer in southeast Greenland. Front. Earth Sci. 2017, 5, 38. [Google Scholar] [CrossRef]
  87. Sahagún-Covarrubias, S.; Waldron, B.; Larsen, D.; Schoefernacker, S. Characterization of hydraulic properties of the Memphis Aquifer by conducting pumping tests in active well fields in Shelby County, Tennessee. JAWRA J. Am. Water Resour. Assoc. 2022, 58, 185–202. [Google Scholar] [CrossRef]
  88. Nassimi, A.; Mohammadi, Z. Estimation of hdraulic conductivity using geoelectrical data for assessing of scale effect in a karst aquifer. Acta Carsologica 2016, 45. [Google Scholar] [CrossRef]
  89. Hantush, M.S. Drawdown around a partially penetrating well. J. Hydraul. Div. 1961, 87, 83–98. [Google Scholar] [CrossRef]
  90. Hantush, M.S. Aquifer tests on partially penetrating wells. J. Hydraul. Div. 1961, 87, 171–195. [Google Scholar] [CrossRef]
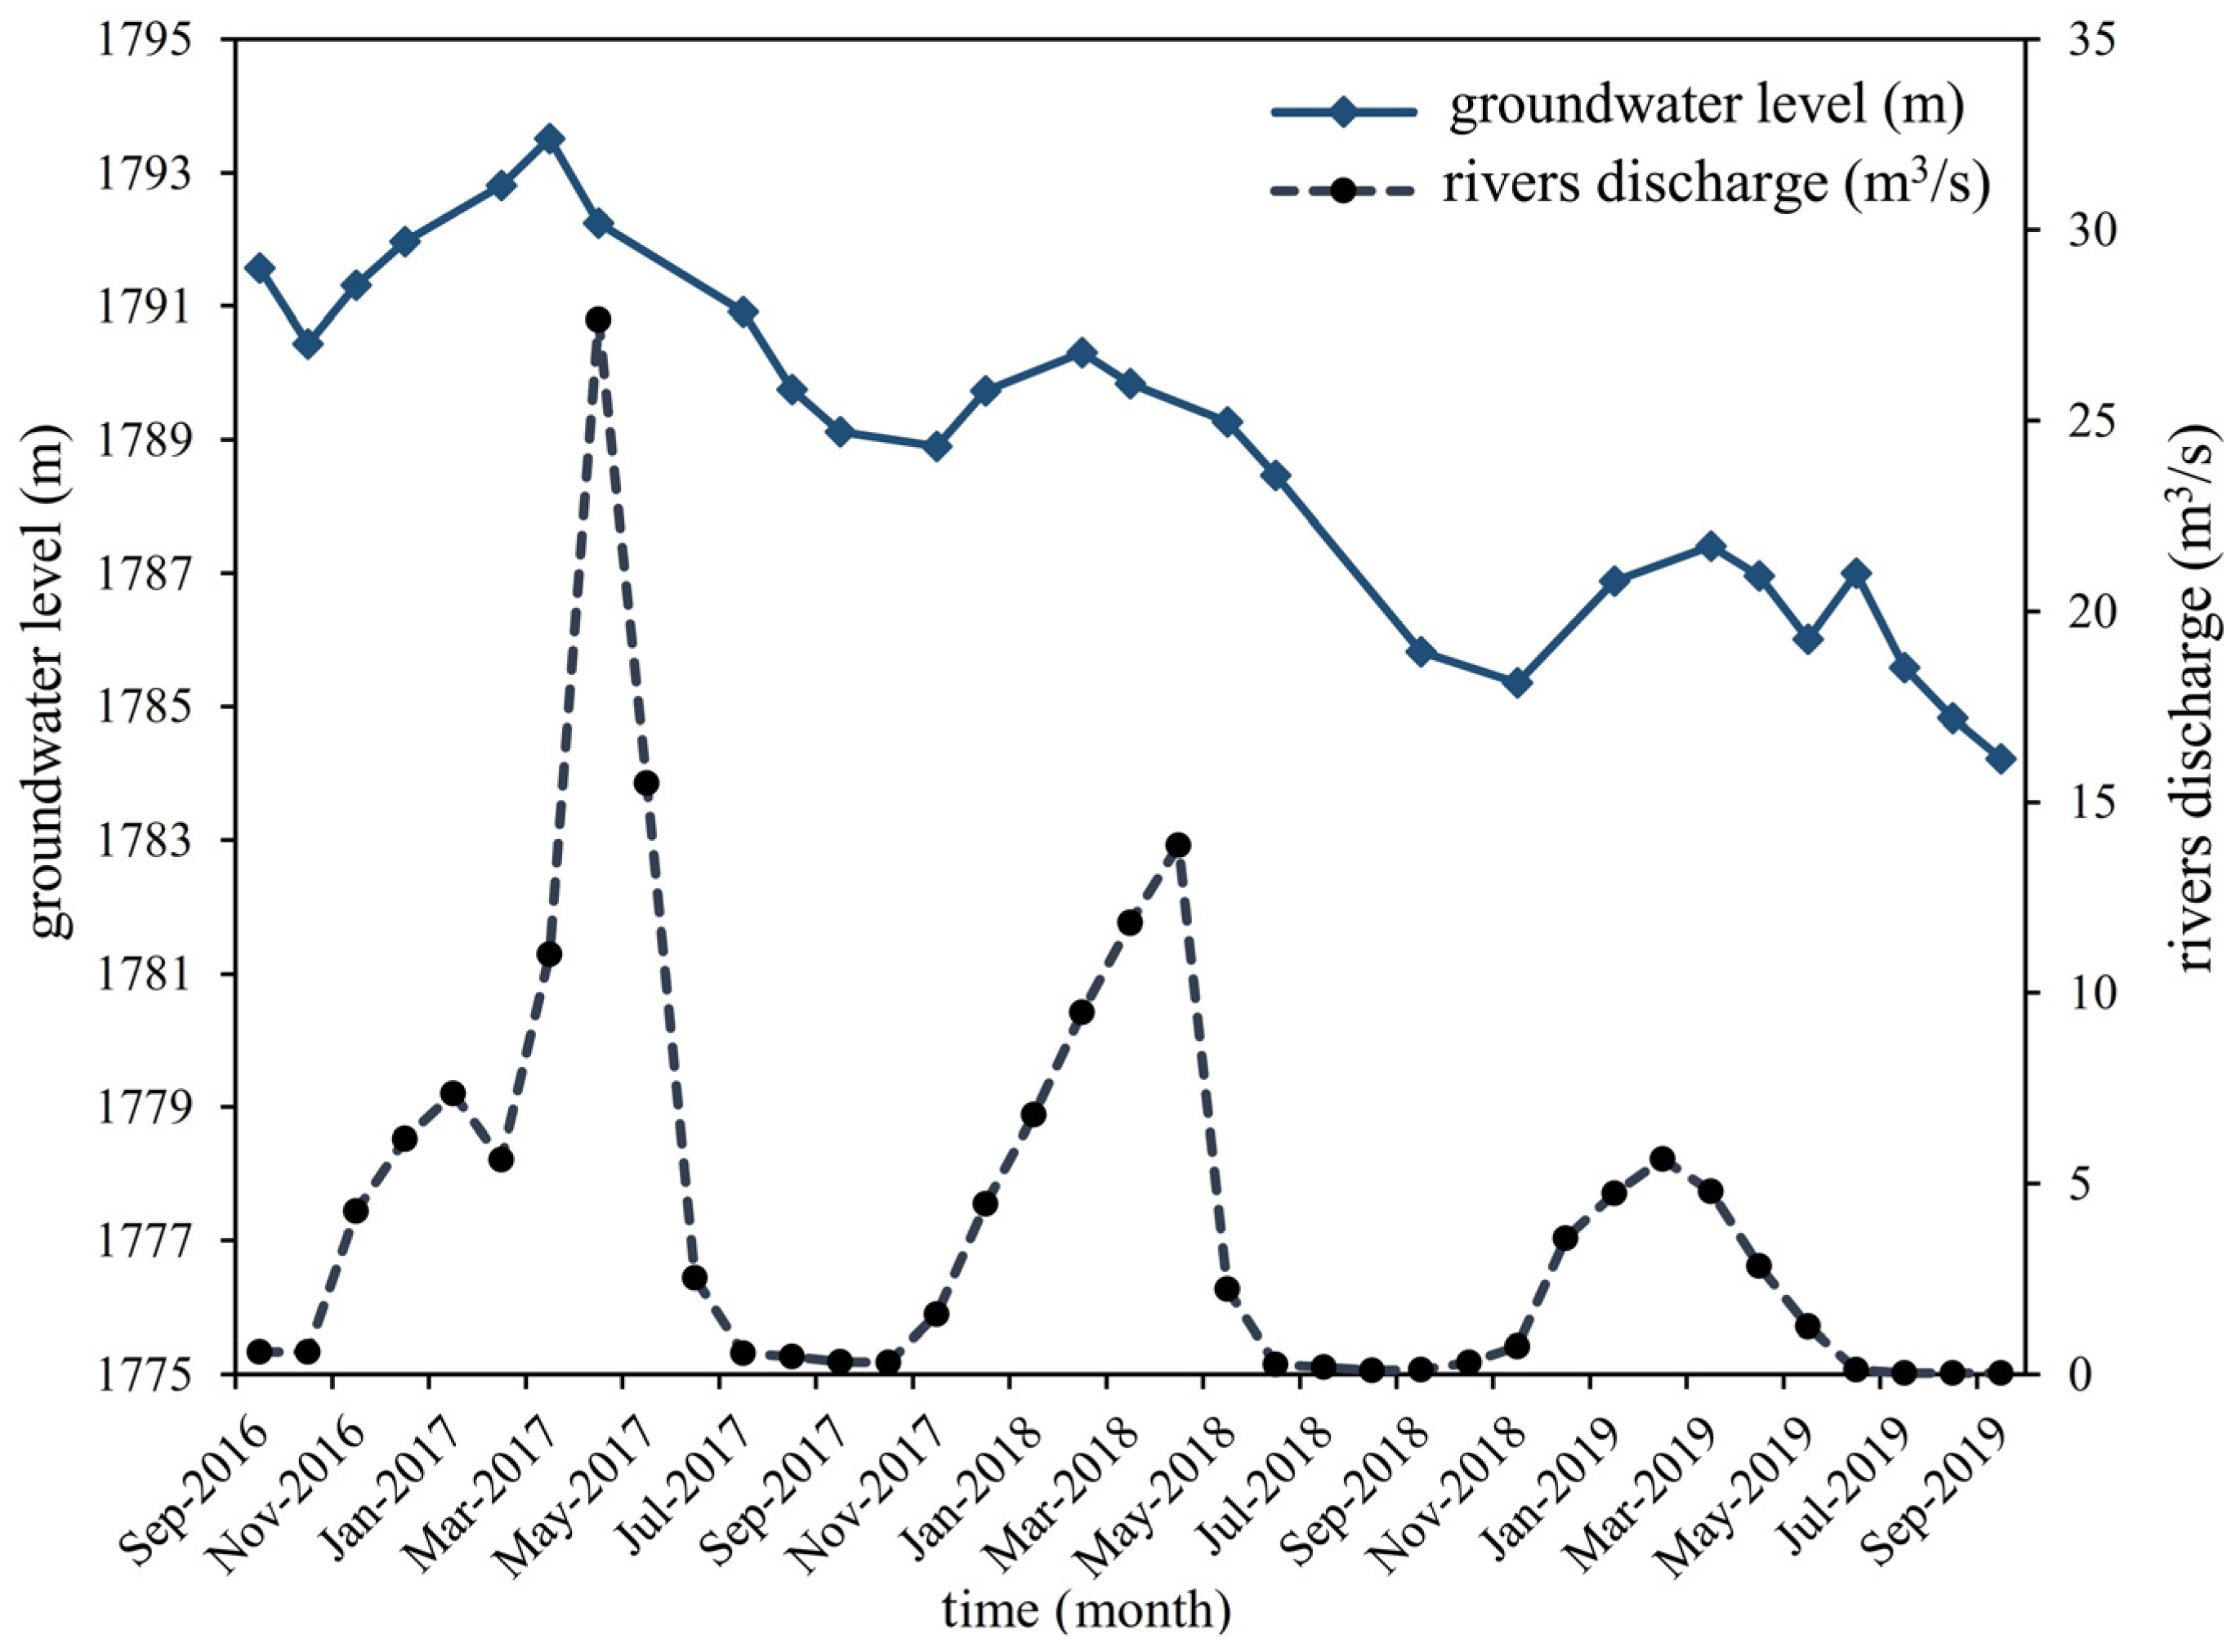
Figure 2. Fluctuation of weighted average hydrograph of shallow aquifer and river discharge.
Water 16 02204 g002
Figure 3. Hydrogeological conceptual model of Kabul City, the study area, including deep and shallow aquifers, confining layer, hard bedrock, rivers, land, and topography [29].
Water 16 02204 g003
Figure 4. The flowchart represents the outline of the methodology adopted for this study.
Water 16 02204 g004
Figure 5. (a) Ks values, (b) linear correlation of AL-LG wells between Ks values from AQTESOLV and manual calculation by the Cooper–Jacob method.
Water 16 02204 g005
Figure 6. (a) Comparison results of applied methods to index wells; (b) maximum, minimum, and average of Ks based on geological classification of well logs.
Water 16 02204 g006
Figure 7. (a) Correlation rates for Theis and Cooper–Jacob methods with step-drawdown pumping test; (b) with step-drawdown and constant rate pumping test; (c) Cooper–Jacob method with step-drawdown and constant rate pumping test; (d) Theis with step-drawdown pumping test and Recovery Test methods.
Water 16 02204 g007aWater 16 02204 g007b
Figure 8. (a) Correlation coefficient of computed Ks values through expertise manner using geological units in contrast with computed Ks values through Cooper–Jacob equation by manual; (b) automatic; (c) calculations for constant rate pumping test and Theis; (d) Cooper–Jacob; (e) equations for step-drawdown pumping test. Validation of computed Ks values through expertise manner using geological units by utilization of Ks values obtained from US soil classification; (f) recovery test.
Water 16 02204 g008
Figure 9. Calculated average Ks for soil classification of United States.
Water 16 02204 g009
Figure 10. (a) Correlation curves of specific capacity versus calculated transmissivity (T (m2/d)); (b) Ks; (c) from Razack and Huntley equation and computed Ks values through expertise manner using geological units in contrast with specific capacity; (d) obtained Ks from Razack and Huntley equation.
Water 16 02204 g010
Figure 11. (a) Relationships between calculated Ks from soil classification of United States and computed Ks through expertise manner using geological units; (b) computed Ks through expertise manner using geological units with allocating percentages of each unit; (c) computed Ks through expertise manner using geological units and with allocating percentages of each unit.
Water 16 02204 g011
Figure 12. (a) Correlation rates between average Ks and percentage of particles for each geological unit, gravel, (b) sand, (c) silt, and (d) clay.
Water 16 02204 g012
Figure 13. (a) Comparison correlation results between the percentage of geological classes across the entire well column and the average Ks of the classes; (b) the average Ks of each geological class and Ks of each segment across the entire well column.
Water 16 02204 g013
Figure 14. Obtained results from 15 computational methods of Ks using sieve analyses.
Water 16 02204 g014
Figure 15. Correlation rates between the average Ks of fine gravel and coarse sand and overall average Ks derived from 15 computational methods of Ks using sieve analyses.
Water 16 02204 g015
Figure 16. (a) The correlation curves between particle size percentage in the samples and average hydraulic conductivity of fine gravel, medium, fine, and coarse sand; (b) transmissivity (T) in geological segments across the derived Ks of Kruger, Zamarin, Zunker, Sauerbrei, and Chapuis measurement methods.
Water 16 02204 g016
Figure 17. (a) Results of average, maximum, and minimum hydraulic conductivity separated by well categories; (b) calculation methods.
Water 16 02204 g017
Figure 18. (a) Produced maps of overall computed hydraulic conductivity (Ks) from AL-LG, PW, piezometric, DACAAR, and old wells; (b) drawdown rate from monitoring wells; (c) classification and validation rate of Ks map by comparison with drawdown rate map.
Water 16 02204 g018
Table 1. Available datasets in the study area.
Well’s NameCountPumping TestWell LogSoil
Sieve Analysis
ConstantStep DrawdownGeological UnitUS Soil ClassificationCount WellCount Analysis
Alauddin Wells (AL)101010101037
Logar Wells (LG)1010101010918
Piezometer38--3838--
Old Wells 1980s (data are old)169169, just values of Q, drawdown, specific capacity, and thickness of aquifer-169---
Pumping wells (PW)29--29---
DACAAR Wells2323, just value of Ks-----
Monitoring wells83------
Total3622020256581225
Table 2. Classified datasets according to the availability of well log data.
PiezometersAL-LG WellsOld WellsAverage
Count38 Wells 20169
Particle SizeTotal Thickness (m)Thickness %Total Thickness (m)Thickness %Total Thickness (m)Thickness %Total Thickness (m)Thickness %
Rock51.52.61%349.231.39%94817.74%449.617.25%
Clay573.129.07%101.59.12%199637.34%890.225.18%
Silt910.946.20%22820.49%0 10.00% 1379.622.23%
Sand224.911.41%131.311.80%113921.31%498.414.84%
Gravel211.110.71%302.527.19%126223.61%591.920.50%
Summation1971.5100%1112.5100%5345100%2809.7100%
1 The old well log data provided a general classification without further detailed description.
Disclaimer/Publisher’s Note: The statements, opinions and data contained in all publications are solely those of the individual author(s) and contributor(s) and not of MDPI and/or the editor(s). MDPI and/or the editor(s) disclaim responsibility for any injury to people or property resulting from any ideas, methods, instructions or products referred to in the content.