Article

Influence of a Meandering Channel on the Threshold of Sediment

by
Nasim Rismani
1,
Hossein Afzalimehr
1,*,
Seyed-Amin Asghari-Pari
2,
Mohammad Nazari-Sharabian
3,* and
Moses Karakouzian
4
1
Faculty of Civil Engineering, Iran University of Science and Technology, Tehran 16846-13114, Iran
2
Department of Civil Engineering, Behbahan Khatam Alanbia University of Technology, Behbahan 63616-47189, Iran
3
Department of Mathematics, Engineering and Computer Science, West Virginia State University, Institute, WV 25112, USA
4
Department of Civil and Environmental Engineering and Construction, University of Nevada Las Vegas, Las Vegas, NV 89154, USA
*
Authors to whom correspondence should be addressed.
Water 2024, 16(15), 2162; https://doi.org/10.3390/w16152162
Submission received: 3 July 2024 / Revised: 28 July 2024 / Accepted: 29 July 2024 / Published: 31 July 2024
(This article belongs to the Section Water Erosion and Sediment Transport)

Abstract

:
River meanders and channel curvatures play a significant role in sediment motion, making it crucial to predict incipient sediment motion for effective river restoration projects. This study utilized an artificial intelligence method, multiple linear regression (MLR), to investigate the impact of channel curvature on sediment incipient motion at a 180-degree bend. We analyzed 42 velocity profiles for flow depths of 13, 15, and 17 cm in a laboratory flume. The results indicate that the velocity distribution was influenced by the sediment movement threshold conditions due to channel curvature, creating a distinct convex shape based on the bend’s position and flow characteristics. Reynolds stress distribution was concave in the upstream bend and convex in the downstream bend, underscoring the bend’s impact on incipient motion. Bed Reynolds stress was highest in the first half of the bend (0 to 90 degrees) and lowest in the second half (90 to 180 degrees). The critical Shields parameter at the bend was approximately 8–61% lower than the values suggested by the Shields diagram, decreasing from 0.042 at the beginning to 0.016 at the end of the bend. Furthermore, our findings suggest that the MLR method does not significantly enhance the understanding of sediment movement, highlighting the need for a more comprehensive physical rationale and an expanded dataset for studying sediment dynamics in curved channels.

1. Introduction

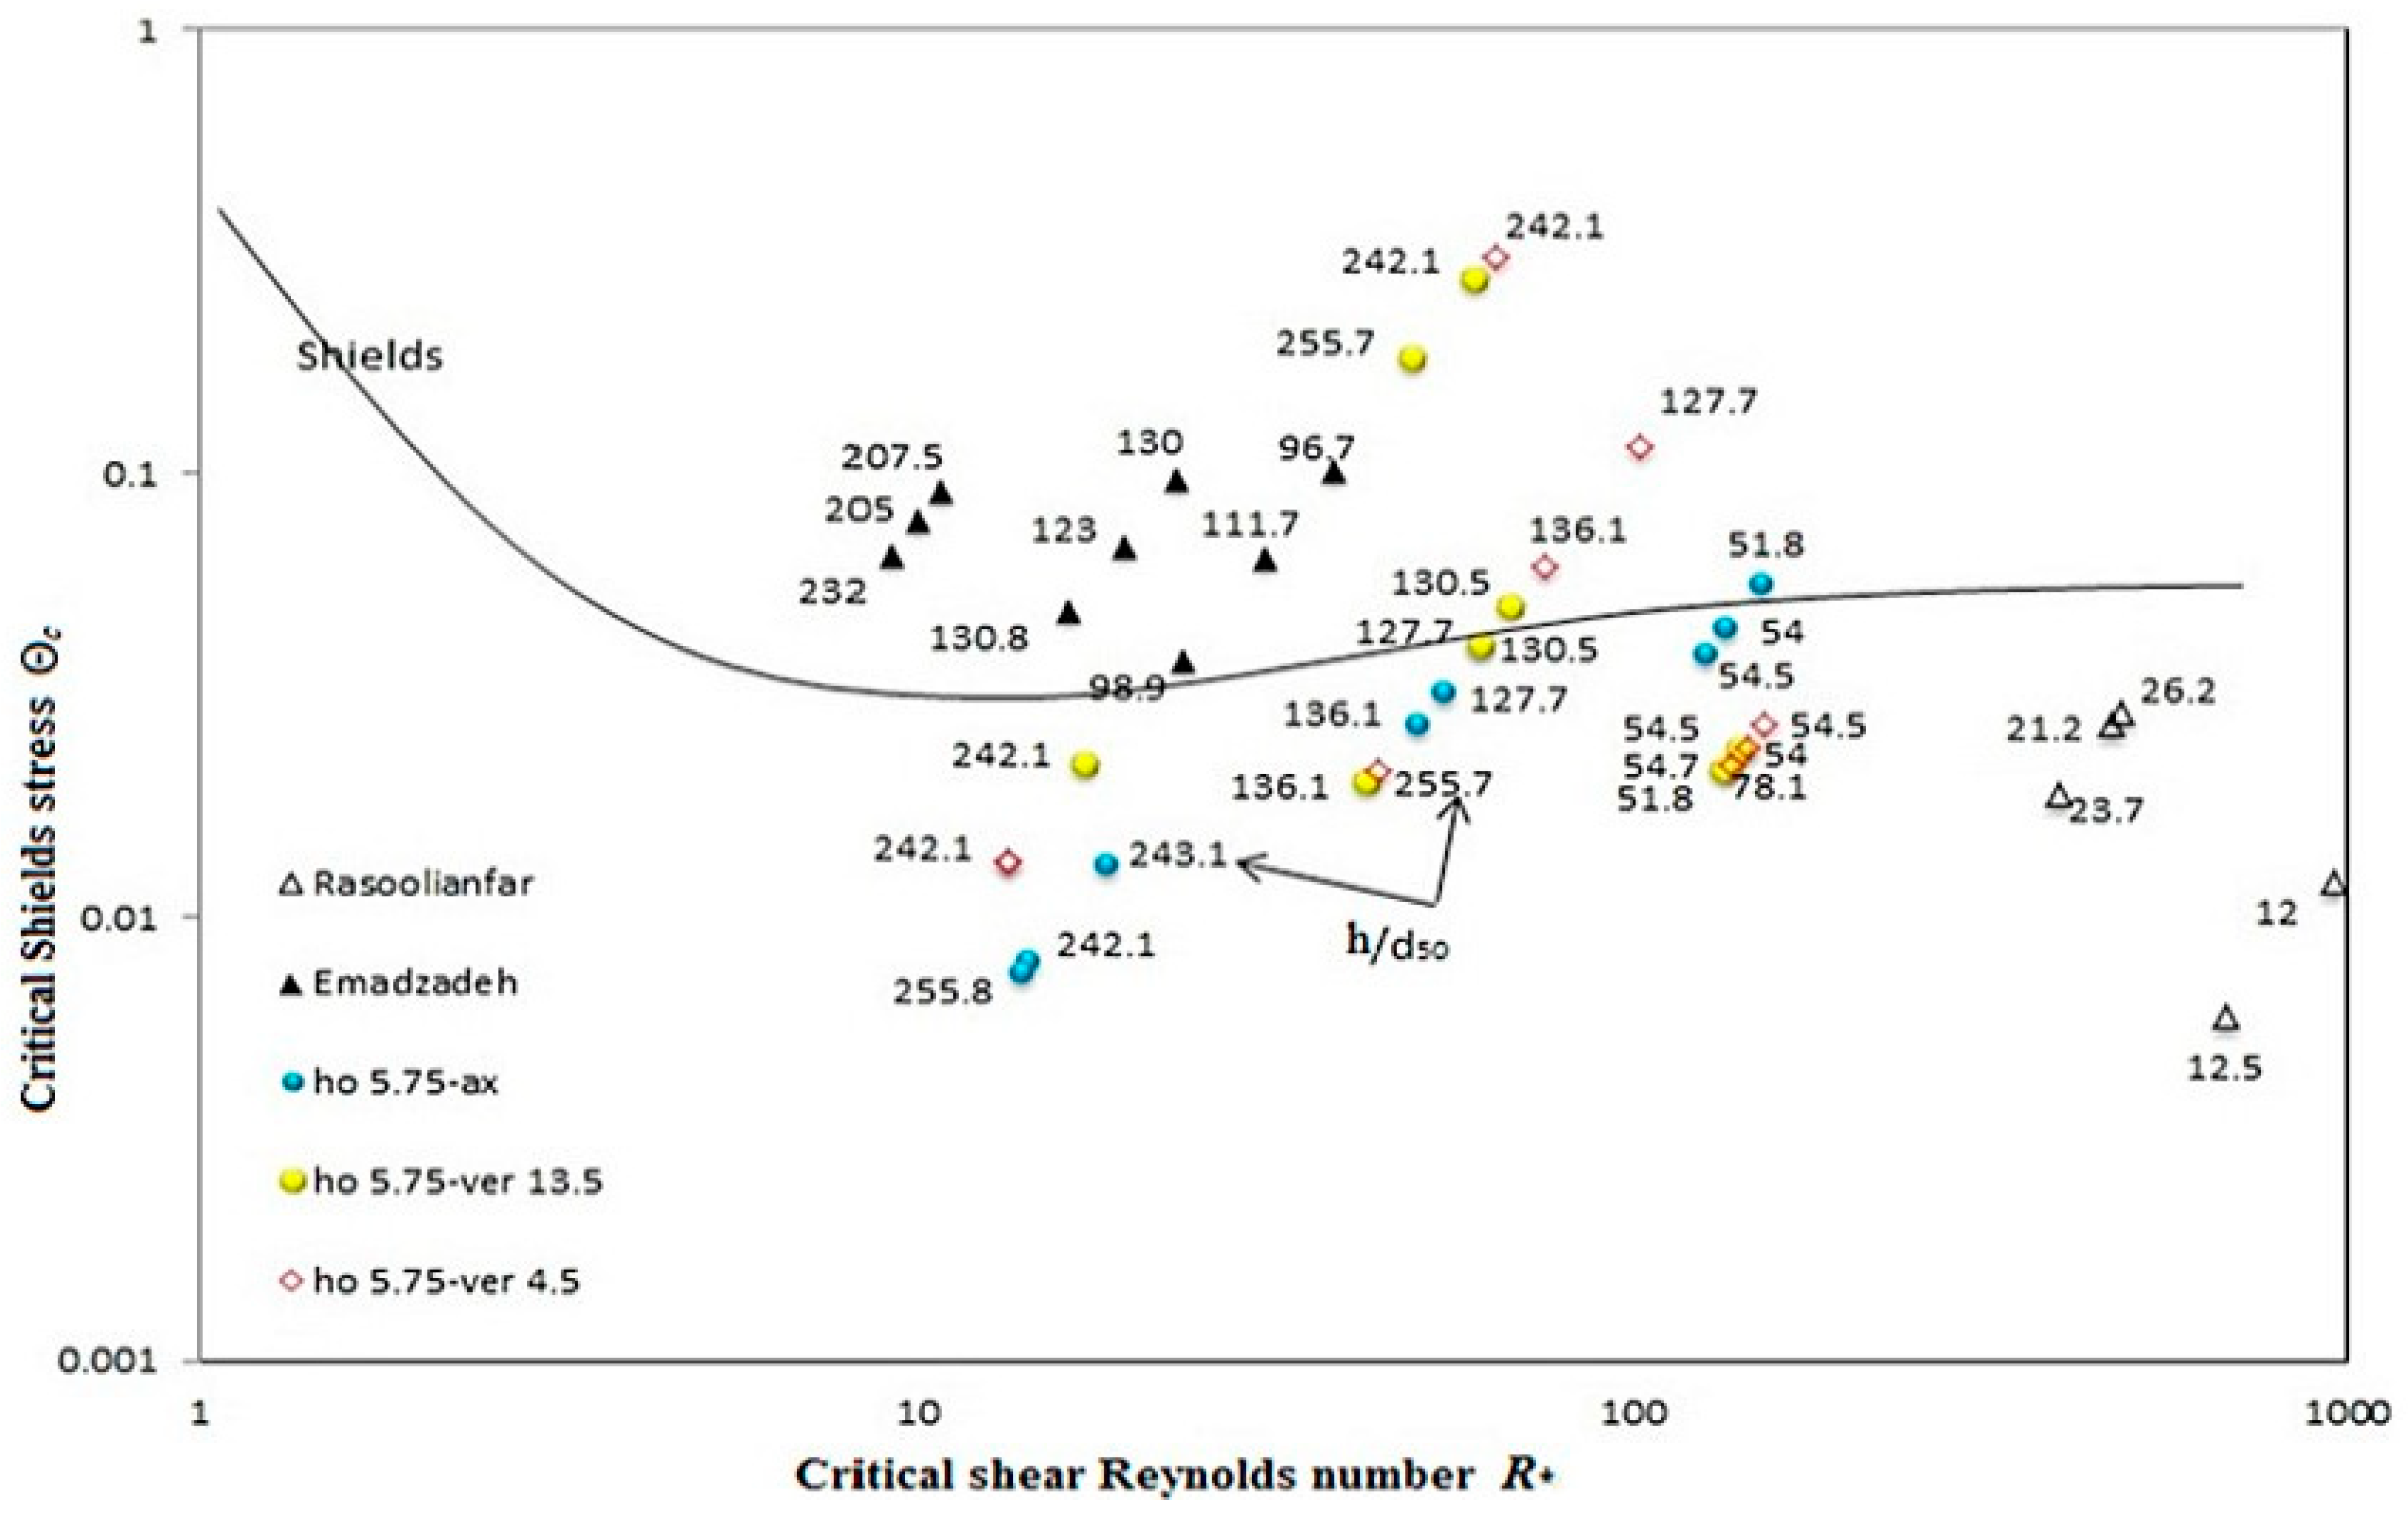
The sediments in rivers that can be eroded experience a range of hydrodynamic forces from the water flow. As the flow rate grows, the hydrodynamic forces also rise slowly. When the hydrodynamic forces exceed the critical level, the sediment particles start to move. This is known as “incipient motion”, and the situation when the particles move is called the “threshold or critical condition” [1,2]. Figure 1 shows the Shields diagram, which most research on sediment transport in river engineering uses as its basis. Shields (1936) was the first researcher to analyze the threshold of sediment particle movement. He used the principle of similarity and balanced the forces in the initial state of particle movement to create a diagram based on the critical Shields and Reynolds parameters [3].
Before Shields (1936), there were some attempts to simulate the incipient motion of sediments based on empirical equations, but they were not very useful in practice. Shields’ diagram was widely used for practical problems. However, some studies show some drawbacks of using the Shields diagram. One of the issues is that it treats shear stress and shear velocity as independent variables, even though they are related; it also does not clearly state how to find the critical shear stress. The impact of the bed slope on the start of sediment movement is still unclear and different studies have different findings on this [5,6,7]. In recent years, many studies have tried to include parameters that Shields (1936) did not consider in his research and finally resulted in the presentation of more accurate equations and a modified Shields diagram for modeling the incipient motion of sediment particles in waterways [8,9,10]. However, sediment movement still leaves many unknowns due to its complexity and stochastic nature. For instance, sediment particles transported in a turbulent flow experience complex motions as a result of the forces acting on them. Therefore, describing the movement and transfer of sediment particles along the river course is a challenging issue, and since the practical topics based on it (e.g., erosion, bridge foundation design, and scouring around hydraulic structures) require a correct knowledge of the characteristics of sediment movement in different conditions, this issue has become doubly important.
The dynamics of rivers have been successfully studied in recent years using theoretical, numerical, and experimental methods. Laboratory and experimental research have proven to be more effective than other methods in capturing the diversity and complexity of rivers. They have also contributed to a deep understanding of the mechanisms of flow and bed interaction. For instance, Afzalimehr et al. (2007) investigated the effect of decelerating flow on the movement threshold in channels with a sand bed [11]. The results indicated that the value of the Shields critical parameter for channels with a sand bed under non-uniform slow flow was lower compared to that of channels with uniform flow. Similarly, Motamedi et al. (2010) researched sediment movement and the essential shear stress in gravel-bed rivers [12]. They utilized observed bed load transport rates to calculate the Shields stress parameter, then evaluated these calculated parameters against those obtained using the Meyer–Peter Muller approach. The agreement between the two methodologies was notable, and the critical Shields stress values derived from both methods were corroborated by the Shields diagram. It was observed that the critical Shields stress diminished as the ratio of median grain size (d50) to the size where 90% of particles are finer (d90) increased, where d50 represents the median sediment size and d90 represents the sediment size below which 90% of the particles are finer. Moreover, Bolhassani et al. (2015) explored how the slope of the riverbed and the depth of water relative to the sediment size influence the initial movement of sediment in slowing water flows [4]. Their experimental research aimed to measure these effects. They examined three different sediment sizes with median grain diameters of 0.95 mm, 1.8 mm, and 3.8 mm, along with three varying slopes of the riverbed: 0.0075, 0.0125, and 0.015. The findings suggest that slowing water flows significantly affect when sediment begins to move. A notable pattern was observed where the critical Shields stress, which indicates the onset of sediment movement, varied with the bed slope, highlighting the impact of slowing flows. The study ultimately determined that the traditional Shields diagram, commonly used to assess critical shear stress, does not accurately predict the point at which sediment starts to move in decelerating flows. This is because there were instances where sediment moved even though the critical Shields stress was below the expected threshold according to the diagram. Vaghefi et al. (2016) conducted experimental studies of flow patterns and calculated the shear stress in a 180-degree sharp open channel bend [13]. Their results showed that the maximum strength of the secondary flow occurs in the second half of the bend. They also showed that the maximum shear stress occurred from the entrance of the bend to the bend apex area near the inner wall. Mohtar et al. (2020) modified the representation of the Shields parameter by incorporating turbulent strength. Experiments were conducted under steady, uniform flow conditions using eight sediment sizes with varying particle Reynolds numbers. The critical Shields parameter was calculated, revealing a trend similar to the traditional Shields curve. The analysis showed that turbulent fluctuations are essential for predicting incipient sediment motion and serve as more accurate predictors than the commonly used critical shear velocity [14]. Moghaddassi et al. (2021) conducted a study on the effect of the ratio of average velocity to critical velocity on the bed topography and the initial movement of sediment in meandering channels [10]. They experimented with a channel with a maze with two consecutive 180-degree bends. They examined the changes in the bed topography along the meander and the downstream straight path for different ratios of average velocity to critical velocity. They also explored the influence of the upstream bend on the downstream bend. They found that the maximum scour depth in the downstream bend increased with the ratio of the average velocity to the critical velocity. They also found that the initial movement of the upstream bend and the downstream bend happened for ratios of average speed to critical speed of 0.89 and 0.78, respectively. In addition, Sukhodolov et al. (2021) investigated the turbulent flow in the bend of a meander river, and they showed that the structure of the average and turbulent flow in the meander bend is three-dimensional [15]. This flow complexity makes applying the linear distribution of shear stress in-depth and using the logarithmic law difficult. Khosravi et al. (2021) conducted a study to investigate hydraulic parameters related to incipient motion conditions, comparing uniform and graded sediments as well as round and angular sediment types. The experiments included rounded uniform bed sediments of 5.17, 10.35, 14, and 20.7 mm, angular uniform sediment of 10.35 mm, and graded sediment. The findings showed that angular sediment had a higher critical shear velocity for incipient motion than rounded sediment. Critical Shields stress and relative roughness increased with bed slope, while the particle Froude number decreased. Additionally, graded sediment exhibited higher critical shear stress compared to finer uniform sediments, with finer fractions having higher particle Froude numbers and coarser fractions demonstrating lower stability [16]. Dodangeh and Afzalimehr (2022) investigated the incipient motion of sediment particles under non-uniform flow conditions in rivers and laboratory settings. Their research focused on the impact of bedforms on flow dynamics and sediment transport. The study challenges the traditional approach of using the Shields diagram, which is based on uniform flow assumptions, by highlighting the importance of considering pressure gradients in non-uniform flows. Their findings indicate that the Shields diagram underestimates particle motion in both laboratory and river settings. Key factors influencing incipient motion include the presence of bedforms, changes in river width, and flow non-uniformity. Additionally, the study observed differences in incipient motion between accelerating and decelerating flows, with greater motion occurring under accelerating flow conditions [17].
The water flow in a meander is characterized by a cross-stream motion, which has a three-dimensional flow structure different from that of a straight river. As a dynamic field that drives sediment movement, it directly affects the conditions of initial sediment movement in the bend and subsequent transport movement. Parker et al. (1985) stated that there is two-way sediment transport in the bend: longitudinal transport, which is related to the main flow, and lateral transport, which is related to the section’s lateral flow velocity [18]. They also concluded that the bed load’s initial movement and transport are non-uniform along the cross-section. In addition, Jia Dongdong et al. (2008) also pointed out that the direction of bed load transport significantly affects the results in the investigation of erosion and sediment transport in the bend [19]. Additionally, instead of using the average value of the flow velocity along the vertical, more attention should be paid to the effect of the water flow conditions near the bed on the sediment transport. Gonzalez et al. (2017) stated that the processes stabilizing the bed in straight paths are also active in meander bends [20]. However, cross-stream sediment fluxes in meander bends may contribute to increased sediment supply to high boundary shear stress zones. They identified the processes of bed stability at different scales: at the local scale, the median diameter of the surface material controls the mobility of the local sediment mixture; at the cross-section scale, the bed topography controls the shear stress distribution; at the reach scale, the channel geometry, flow velocity field, and sediment differential routing intervene to sort sediment through regions of more efficient transportation. Although knowledge about the incipient motion of sediment particles in water conveyances has significantly advanced from previous studies, the interaction arch has been neglected. This oversight serves as the primary motivation for the current work.
Understanding how particles start to move in curved channels in varying flows will enable researchers to understand erosion and sediment transport in rivers. This study aims to investigate how sediments begin to move in the curved channels, which are often overlooked but significantly affect the morphological stability of the bend and sediment transport across the channel and erosion at the bend. Previous studies on bend sediment transport investigated cross-channel transport as the dominant phenomenon. No study has addressed longitudinal sediment movement or established a criterion for the sediment movement threshold. Many studies also investigated bend secondary flow [13,21], but how it affects the Shields parameter has not received much attention. Wang et al. (2015) reported that secondary flow affects the movement of particles in a bend section of a river [22]. For a river with a specific curvature, the intensity of the secondary flow is unevenly distributed across the river, resulting in an uneven distribution of incipient motion and sediment transport direction. They also theoretically demonstrated that in curved paths, longitudinal flow primarily determines sediment movement, while secondary flows influence only the direction of sediment movement. The effectiveness of the Shields parameter in the bend also needs exploration. Thus, this study mainly investigates how bend flow curvature affects sediment incipient motion and bed shear stress distribution at incipient motion. It also investigates whether the Shields diagram prediction of incipient motion is applicable in curved channel flows. Finally, based on the field data recorded in the process of experiments in the current study, a new equation is presented using the method based on the soft multivariate polynomial regression, to calculate the Shields critical parameter.
The study underscores the practical applications of understanding meander dynamics in restoration projects, especially for the stabilization of canals or rivers and the enhancement of water quality. In meanders, natural lateral migrations occur due to erosion, leading to shifts in the meander position. These movements can result in changes in bed slope, canal width, radius of curvature, and flow patterns. By identifying sensitive points in meanders, measures such as using vegetation to stabilize banks and beds can be implemented, ultimately improving water quality. Examining sediment movement at different bend angles, this study offers valuable insights into effectively stabilizing beds and banks, contributing to the success of restoration projects and maintaining the health of aquatic ecosystems.

2. Materials and Methods

2.1. Physical Model Setup

Experiments were carried out in a glass-walled flume, sketched in Figure 2a, 21 m long, 0.6 m wide, and 0.6 m deep. This flume comprised a 90-degree bend upstream, followed by a 4.33 m long straight reach and a 180-degree bend downstream. The data of this study were collected along this 4.33 m long path and 180-degree bend downstream. The radius of curvature ( R c ) of the 180-degree bend downstream was 2.54 m. This bend was a mild bend because the ratio of the radius of curvature to flume width (B) was equal to R c / B = 4.23 , which was more than the critical value of 3 to obtain suitable data. The flume had a central control panel where flow and gate height could be adjusted, and discharge values displayed. The flume had a pump with a maximum discharge of 90 lit/s to circulate water in the downstream and upstream tanks of the flume. The output discharge from the pump was measured using an ultrasonic flowmeter, whose sensors were located on the output pipe from the pump and before entering the flume. There was a gate downstream to adjust the water level and pumping discharge during experiments. For measuring the flow depth, a luminometer was used. Experiments were carried out between 5.69 and 18.9 m from the flume entrance. Experiments were performed in two groups where: (1) the straight section of the flume was 4.33 m long; (2) a 180-degree bend was installed with an external bend length of 8.88 m and an internal bend length of 6.96 m. The entire section of the study was covered with a thickness of 31 cm of sediment; 10 cm of the lower part of the sediment was coarse gravel (with a mean size of 20 mm without movement), and 21 cm of the upper part of the sediment was uniform sediments of sand with a median grain size d 50 = 1.3   m m (Figure 2b). Before performing each experiment in this study, the surface of the bed was leveled, and then the pump was turned on to fill the flume. To avoid washing the bed sediment, the flow discharge was very low at the beginning; the gate was closed at this moment. After the water level increased to a certain level, to create a stable flow with the desired water depth, the gate at the end of the flume was opened slightly. The desired water depth in this research was 13, 15, and 17 cm. After the desired water depth was achieved, the flow discharge was increased until the movement threshold condition of sediment was observed.

2.2. Experiments Framework

Since there is no specific definition for incipient motion in bent flow paths, this research aims to establish a criterion to investigate the threshold of sediment movement. Due to the influence of secondary flow and the non-uniform distribution of transversal sediment transfer in bent paths, the criterion for incipient motion in these paths, including significant longitudinal sediment transport, is defined for each studied reach [22]. For straight paths, the criteria for incipient sediment motion are based on the standards proposed by Wang et al. (2015) [22] and Shahmohammadi et al. (2022) [23]. Here, Kramer medium transport criteria were used for the incipient motion, referring to the sediment movement threshold when a significant number of medium-sized particles move [24]. This criterion can capture sediment incipient motion well. According to Wang et al. (2015) [22], secondary flow affects particle movement in bends. To observe the sediment movement threshold based on this research’s criteria, a 180-degree bend was divided into six reaches each with a 30-degree central angle (Figure 3). For each reach, the outer and inner arc lengths were 148 and 116 cm, respectively. Based on the bent path reach length, a 148 cm straight path was considered 5.69 m from the flume entrance (Figure 3). The flow velocity was measured using a downward-facing acoustic Doppler velocimeter (ADV). The sampling frequency was 25 Hz for this study. The total sampling time was set at 4 min, and for each point, about 6000 velocity data points were recorded in each direction. The data were filtered based on two criteria: signal-to-noise ratio (SNR) greater than 15 and coefficient of correlation higher than 70% to eliminate noise effects. In each profile, data collection was conducted at 3 mm intervals within the lower 20% of the water column depth, and at 10 mm intervals for the remaining 80%. An ADV used for data collection must be positioned so that its sensors are submerged in the water, with the initial measurement point typically set 60 mm below the water surface. In this study, the distance between the sampling volume and the transmitter was maintained at 50 mm, resulting in the final data point being located 53 mm above the bed.
As mentioned before, the experiments were classified into two categories: the straight path (one run) and the bent path (six runs). Additionally, three flow depths of 13, 15, and 17 cm were investigated. In each experiment, two flow velocity profiles were taken, with about 16–20 points collected for each profile. Accordingly, in 42 points, the flow characteristics included (i.e., the flow velocity at incipient motion of sediment ( U ), the flow discharge of incipient motion of sediment ( Q 0 ), the Reynolds number defined by U h / υ , the Froude number defined by U / ( g h ) 0.5 , and critical Shields parameter ( τ c )) were measured. The values of these parameters are presented in Table 1.
Column 3 of Table 1 shows the profile in the transverse middle of the flume: M. For the straight flume, the initial profile had a number of 0 and the final profile had a number of 1. Similarly, for the bent path, each profile had a central angle value of the flume section. For instance, SM-0-0.13 was the initial profile in the transverse middle of the flume with a 13 cm flow depth and CM-30-0.17 was a profile in the curved path with a 30-degree angle, and the transverse middle of the flume with a 17 cm flow depth.

2.3. Overview of Multivariate Polynomial Regression

Machine learning and artificial intelligence models have become more popular in hydraulic engineering in recent years [25,26,27,28]. These models can classify and forecast different hydraulic phenomena, saving simulation and laboratory costs. However, they are complex systems that pose challenges for implementation and interpretation. Regression models, in contrast to black-box algorithms like artificial neural networks (ANN) and support vector machines (SVM), are much simpler and clearer for scholars.
Regression models are widely used to create a correlation between several variables and propose a relationship form. These models are categorized into two groups: (1) simple linear regression (SLR); and (2) multiple linear regression (MLR) [29]. Generally, the least squares method was used to fit the regression models, however, they might be fitted by other approaches (e.g., decreasing the lack of fit in some criteria, etc.). The SLR models are used to create the correlation between one input and one output variable, but to estimate the correlation between several input variables (two or more) and one target variable, MLR models are developed.
The MLR type of regression model is the most common method of regression analysis. This model predicts the correlation level of one target parameter from several independent parameters. In fact, the MLR finds a correlation in terms of a direct line that estimates all the data points including both predicted and measured variables [30]. Equation (1) presents the basic form of an MLR model:
Y = a 0 + j = 1 m α j X j
where Y and X are the predicted values of the model and input variables, respectively, and a 0 , …, a m are the model coefficients.
Even when the MLR fits a nonlinear model to the data, Equation (1) remains linear in its coefficients. Minimizing the sum of squared errors between the predicted and observed outcome yields the polynomial regression coefficients by least-squares methods. Therefore, in this study, an MLR was used to find the relationship between the flow velocity at the incipient motion of sediment, the flow discharge of the incipient motion of sediment, the Reynolds number, and the Froude number variables to calculate the critical Shields parameter.

3. Results

This section presents the results of the current research, which is compiled in two general sections: (1) laboratory achievements, and (2) statistical equation. In the first part, how a bend’s low curvature affects velocity distributions, Reynold’s stress, and Shields parameter are analyzed. In the second part, by applying gene expression programming, an accurate and novel relationship to estimate the Shields shear stress parameter is presented.

3.1. Laboratory Achievements

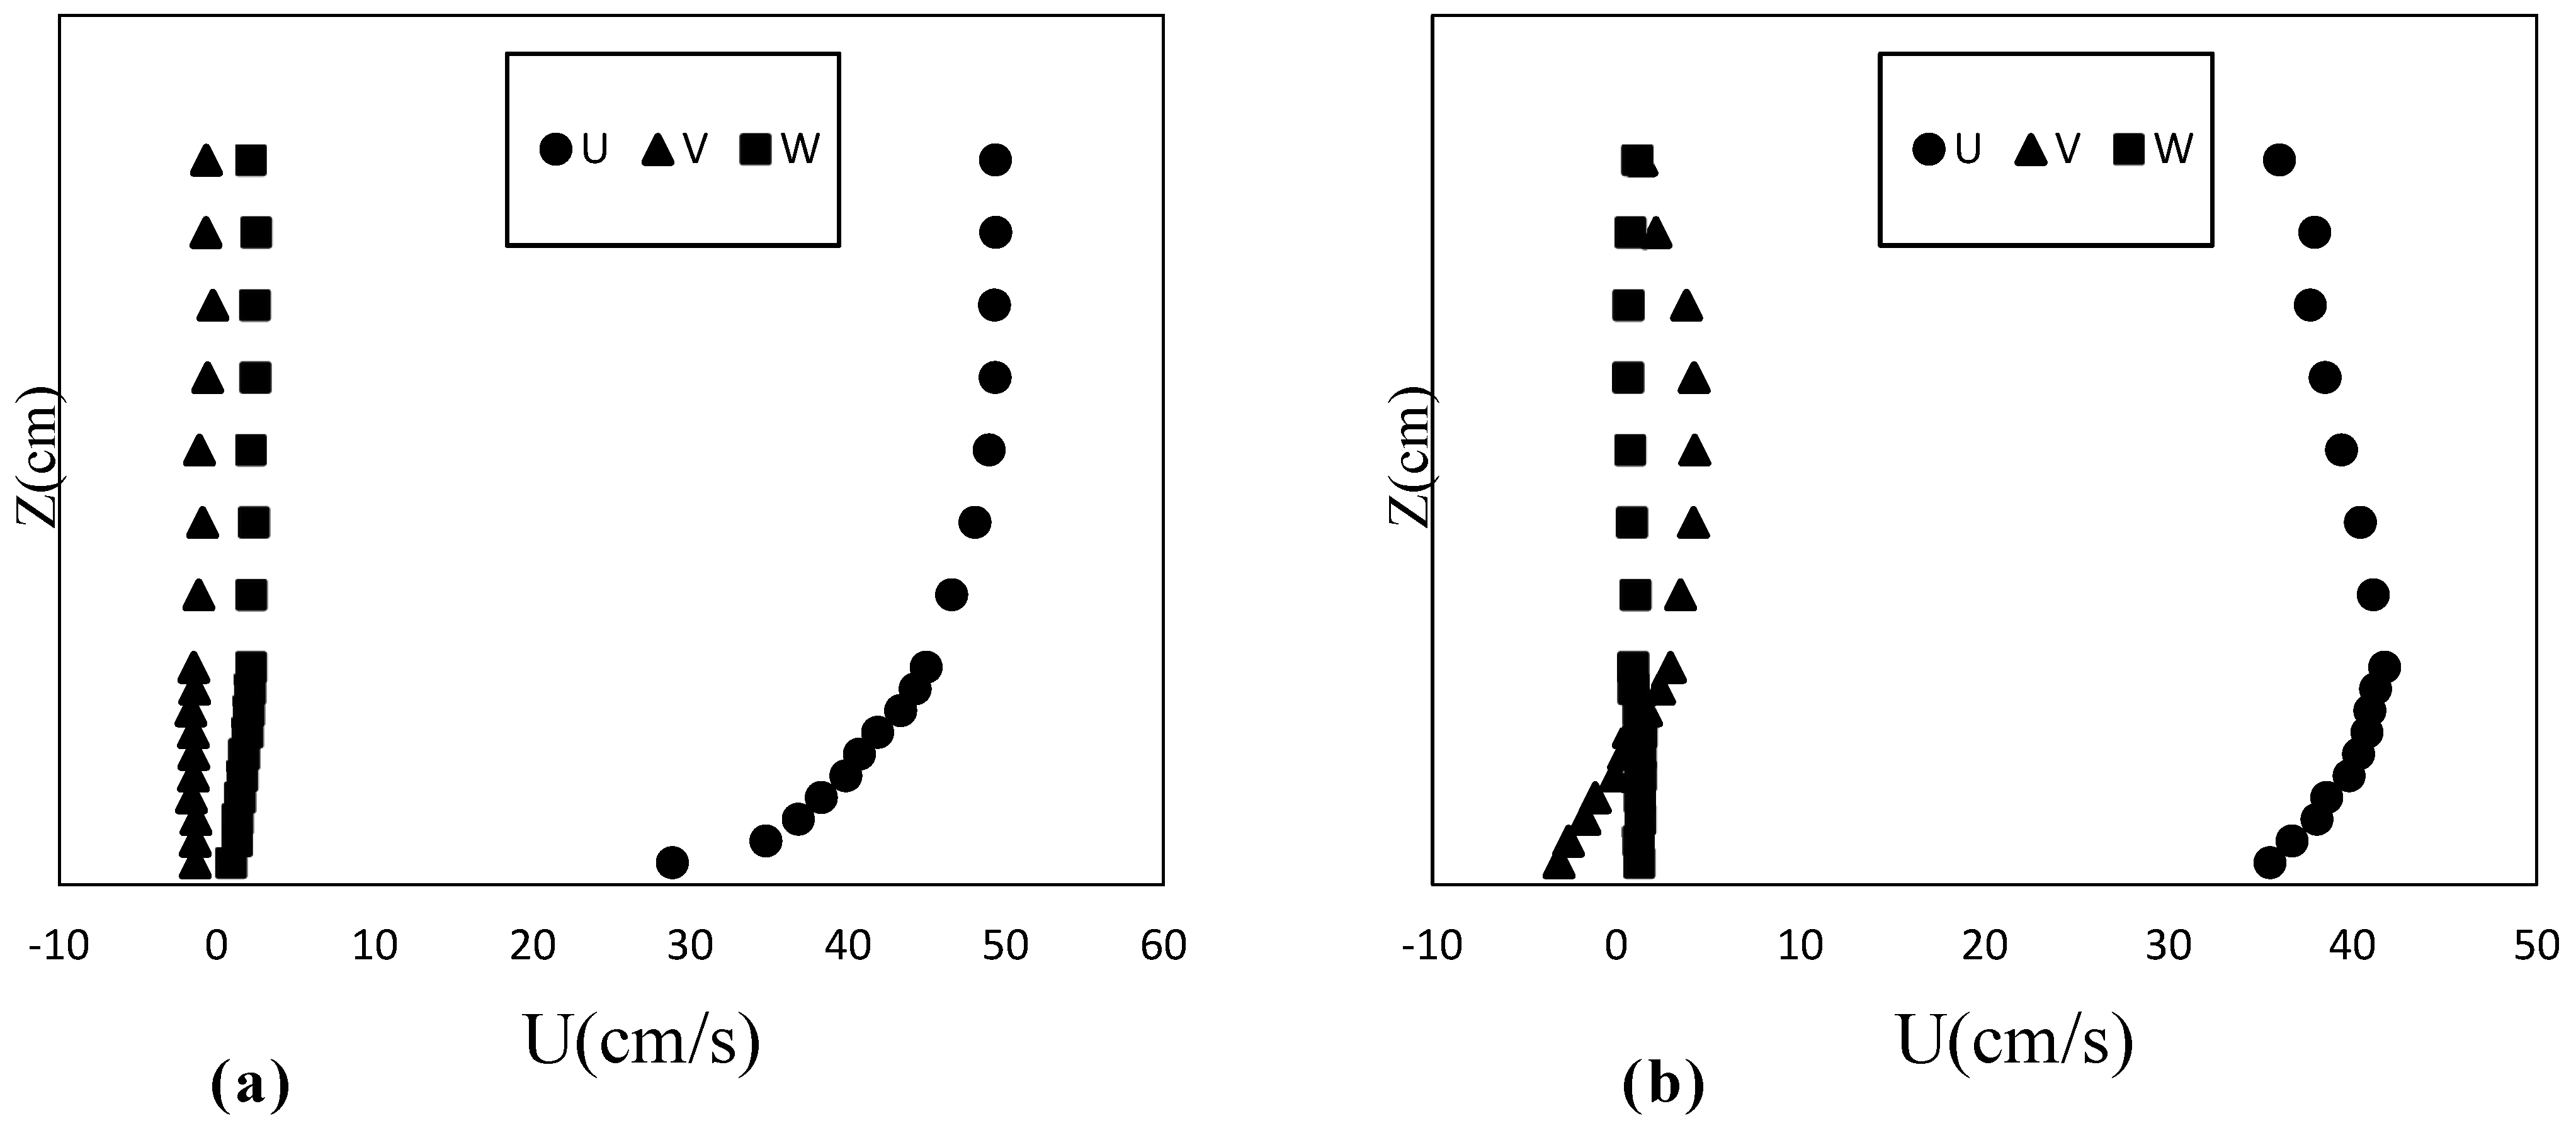
The distribution of the time-averaged velocity at the straight-path cross-section center and the 90-degree cross-section center are shown in Figure 4a,b, respectively. For W h 5 , with a small flow width-to-depth ratio, the flow is three-dimensional with significant secondary flow effects (dip phenomenon). For W h 5 , with a large flow width-to-depth ratio, the flow is two-dimensional with negligible secondary flow effects [31]. Various opinions have been presented depending on W / h for the flow dimensionality. Figure 4a shows that for W h = 4   ( i n   t h i s   s t u d y   3.53 W / h 4.61 ) in this study, stream-wise velocity gradually increased to the free surface without dips, as reported by Dey (2014) [32] and Julien (2018) [33]. According to Figure 4b, the velocity profiles exhibited dips, with stream-wise velocity decreasing towards the free surface and reaching a maximum below the surface. This observation indicates that on the bent path, the maximum velocity occurred below the water surface. The dip phenomenon results from the interaction between flow curvature, centrifugal force, and longitudinal channel flow, rather than wall effects.
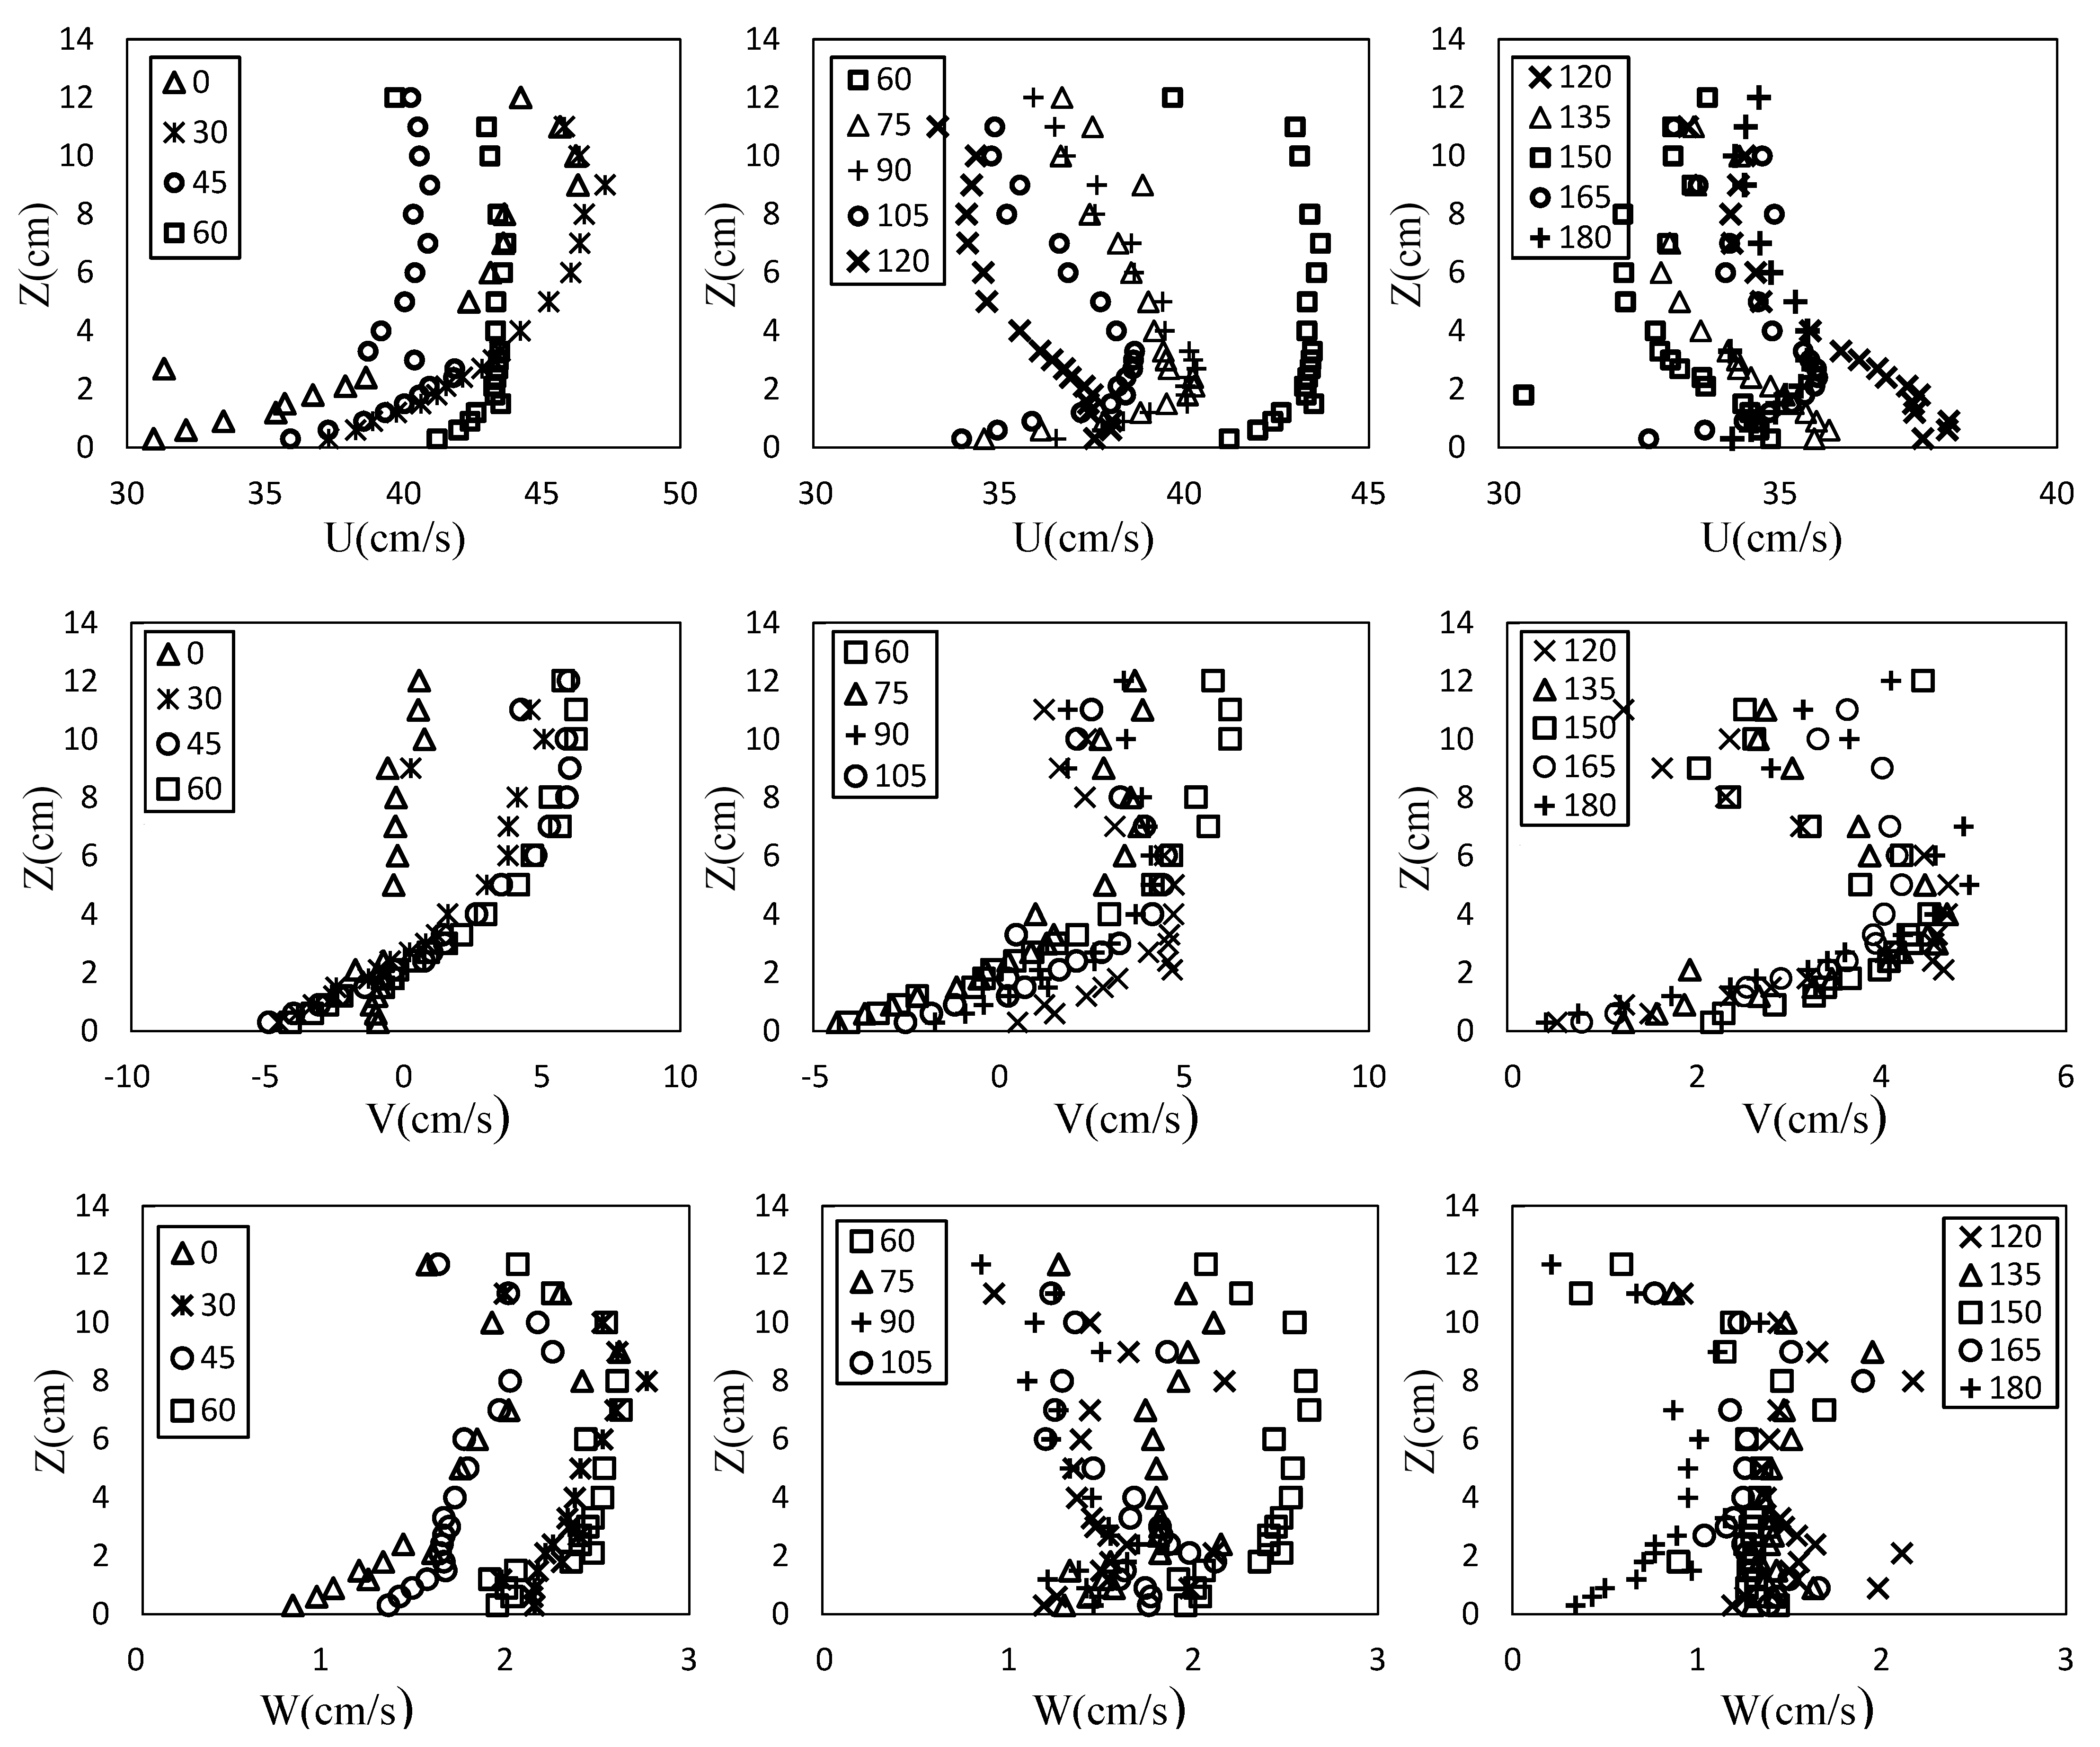
Figure 5 shows the velocity profiles in different directions of the flow. Here, the positive direction of X is in the flow direction, Y is towards the inner wall, and Z is from the water surface to the bed. Figure 5 shows that the longitudinal velocity component (U) is greater than the transverse and vertical velocity components (V and W).
As known, the velocity profiles have three different trends along the bend; longitudinal velocity reached the movement threshold maximum velocity close to the bed for 0 to 60 degrees (Table 1 Q data). It also increased upward to the water level with the maximum velocity near the water level with a small secondary flow effect on the flow conditions in this zone. At 60 to 120 degrees, maximum velocity shifted to the bed at Z / h 0.3 with a positive longitudinal velocity gradient in the depth direction close to the bed and a convex shape. However, the trend differed from 120 to 180 degrees from the bend. Maximum longitudinal velocity transferred to the bed bottom with a negative longitudinal velocity gradient near the bed. Moreover, transverse velocity profile analysis of 0 to 120 degrees from the bend shows that maximum transverse velocity occurred at the bed bottom and the water level, while close to the bed, velocity direction pointed to the outer wall and the inner wall at the water level. At 120 to 180 degrees from the bend, the velocity direction in depth pointed to the inner wall with maximum transverse velocity in this range.
Another important parameter for studying the threshold of bed sediment movement in the hydraulics of sediment transport is bed shear stress [34]. Different methods exist for calculating shear stress in non-uniform flows. Studies show that shear and normal stresses in any direction are much smaller than τ x z , the main flow direction, which is essential for particle movement evaluation. Therefore, this study applied Reynold’s stress τ x z = ρ u w ¯ to calculate the bed shear stress. Reynolds shear stress distribution u w ¯ on the straight path and the 180-degree bend are shown in Figure 6 with a flow depth of 17 cm for every 15 degrees (u′ and w′ are the longitudinal and vertical velocity fluctuation root mean square values, respectively). For uniform flows, Reynold’s stress is a linear function. As shown, the flow curvature strongly affects the Reynolds shear stress distribution. Bed Reynolds stress was also lower on the bent path than on the straight path. Since the Reynolds shear stress is related to the transfer of momentum, we expected with lower Reynold’s shear stress at the sediment movement threshold that sediment movement would occur sooner and incipient motion begin sooner on the bent path than on the straight path.
Figure 6 shows that Reynolds shear stress distribution on the straight path differed from that at the 180-degree bend. For all angles on the curved path, Reynold’s shear stress close to the bed reached its maximum and decreased to the water surface with concave profile shapes. At 0 to 60 degrees, the Reynolds stress profile shape is weakly concave with minimum Reynold’s stress on the water surface. At 60 degrees into the bend cross section, the figure shows low turbulent shear stress in the upper flow depth and a sharp and nearly linear increase in the lower flow depth. At 60 to 120 degrees, the Reynold’s stress profile shape is steeper concave with its minimum at Z / h 0.3 with a more significant gradient close to the bed in this zone. At 120 to 180 degrees, the profile is concave with a uniform decrease from the bed to the water surface with its minimum between Z / h 0.3 and Z / h 1 , approximately.
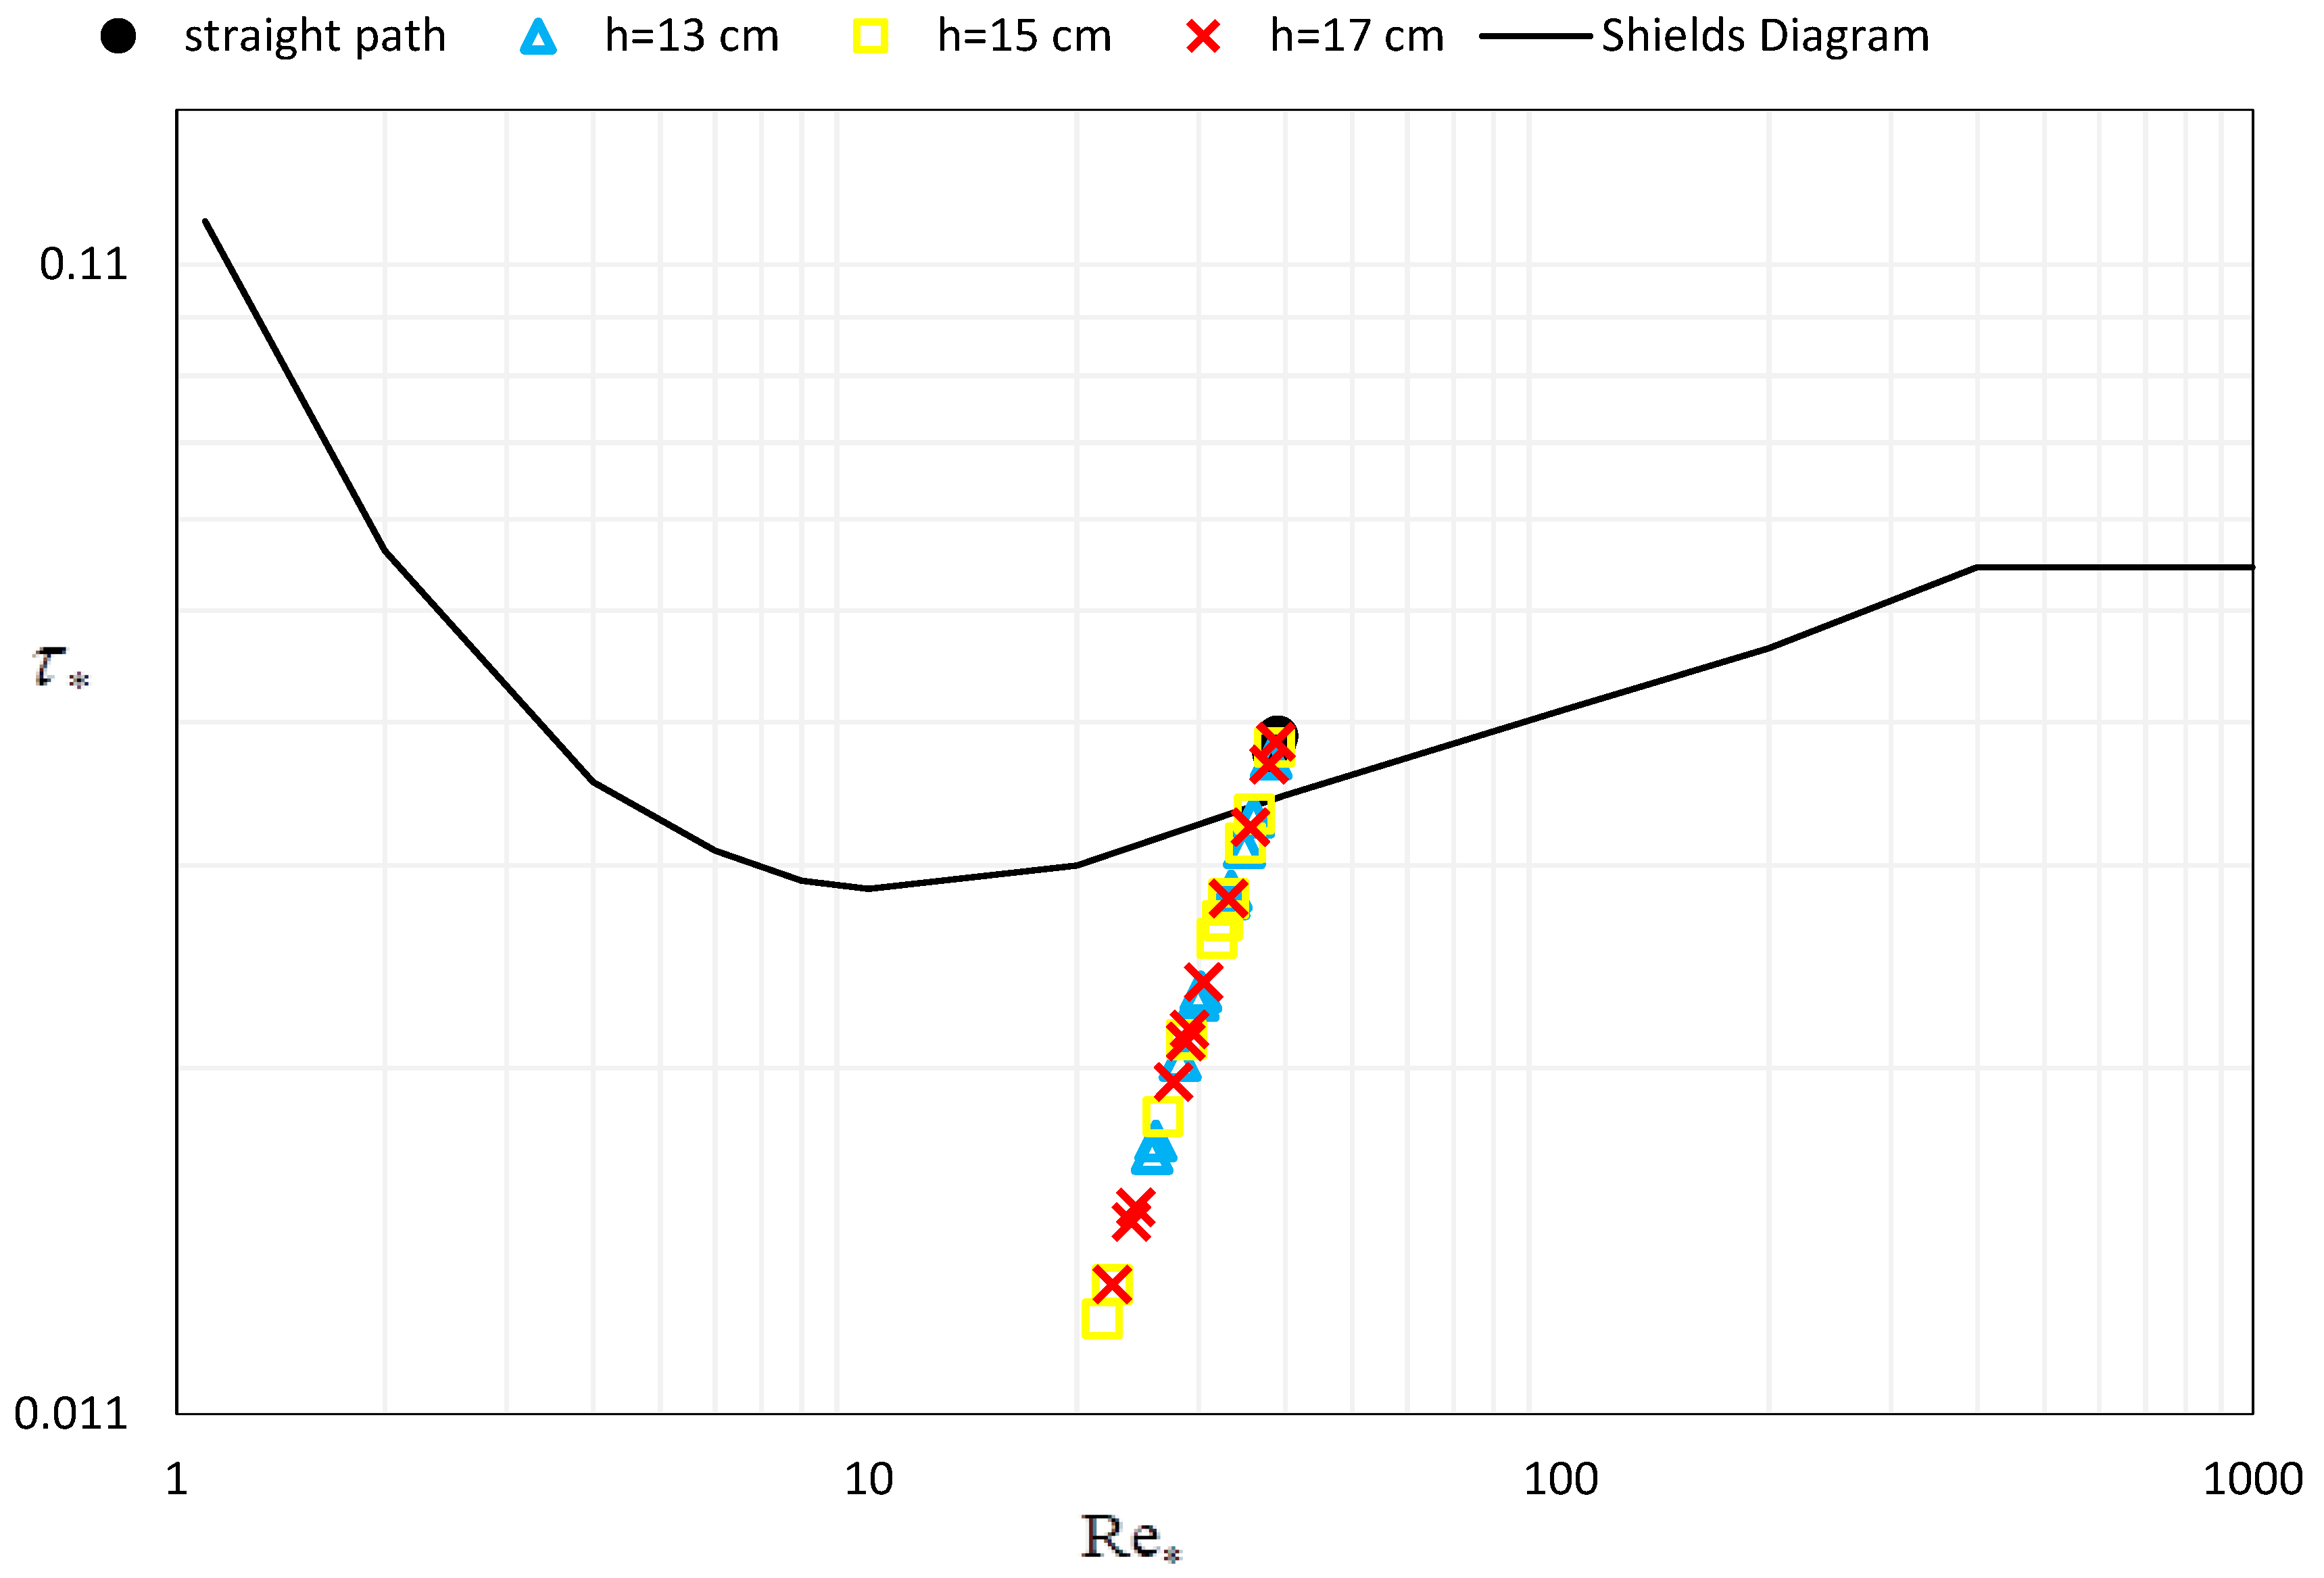
Figure 7 and Figure 8 show how the sediment motion responded to the flow curvature effects at the 180-degree bend. The Shields parameter was higher on the straight path than on the 180-degree bend, except for a few cases, which were below the Shields curve (Figure 7). This indicated that the bed sediment moved more easily on the bent path. Figure 8 plots the calculated critical Shields stresses for the 180-degree bend against various angles for three flow depth groups (13, 15, and 17 cm). The results indicate that τ c decreased as the angle increased in the 180-degree bend. This means that the bed sediment moved more easily due to the flow curvature effect. The critical Shields parameter decreased, reaching its minimum between 60 to 120 degrees, and then increased as it approached the straight path. However, the critical Shields parameter peaked at 90 degrees, suggesting that the Shields parameter values for 60 to 120 degrees were unreliable (Figure 8). This figure also shows that the critical Shields parameter had a slightly increasing trend at 150 to 180 degrees. It is interesting to note that in Figure 8, the critical Shields parameter ranges from 0.042 at the beginning of the bend (zero degrees) to 0.015 at the angle of 180 degrees. This indicates that a single value should not be used in sediment movement modeling. Instead, emphasis should be placed on context-specific values rather than relying on universal ones.
As mentioned before, the observation results, Q0 in Table 1, agreed with the Reynolds stress values. In Figure 5, the Reynolds stress profile shape differs by 60 to 120 degrees from that of other profiles, with a larger gradient close to the bed. These results may reflect the secondary flow effect in the bend. Bai et al. (2019) found in their studies that the secondary flow reached its maximum value for cross sections 40 to 120 degrees [35]. Indeed, a larger secondary flow facilitates sediment transport.

3.2. Statistical Equation

Currently, it is a very difficult task to propose a new equation for the critical incipient motion in bends because the physical aspects of this challenge are not yet well understood. In this laboratory study, the bend plan remained constant, and only the bend angle changed. Therefore, it was not feasible to establish criteria for incipient motion based on variations in bend radius and bend length. Given these limitations and the available dataset obtained in the laboratory, an effort was made to derive a statistical equation using easily measurable parameters in the bend, including velocity, Froude number, and Reynolds number. The results are not promising, as the proposed statistical equation does not significantly enhance our understanding of the incipient motion process, evidenced by high values of the coefficient of correlation. An example using multiple linear regression (MLR) is presented in Table 2, with the statistical results shown in Table 3. For the model, 80% of the collected data series were used for training and 20% for evaluation. The prediction accuracy, indicated by the root mean square error (RMSE), the mean absolute error (MAE), and the coefficient of correlation (R), did not improve significantly.
In Table 2, h represents the water depth (cm) and θ represents the central angle of each section relative to the starting point of the channel. Table 2 provides an example of the unfavorable modeling of incipient motion using the multiple linear regression (MLR) method.
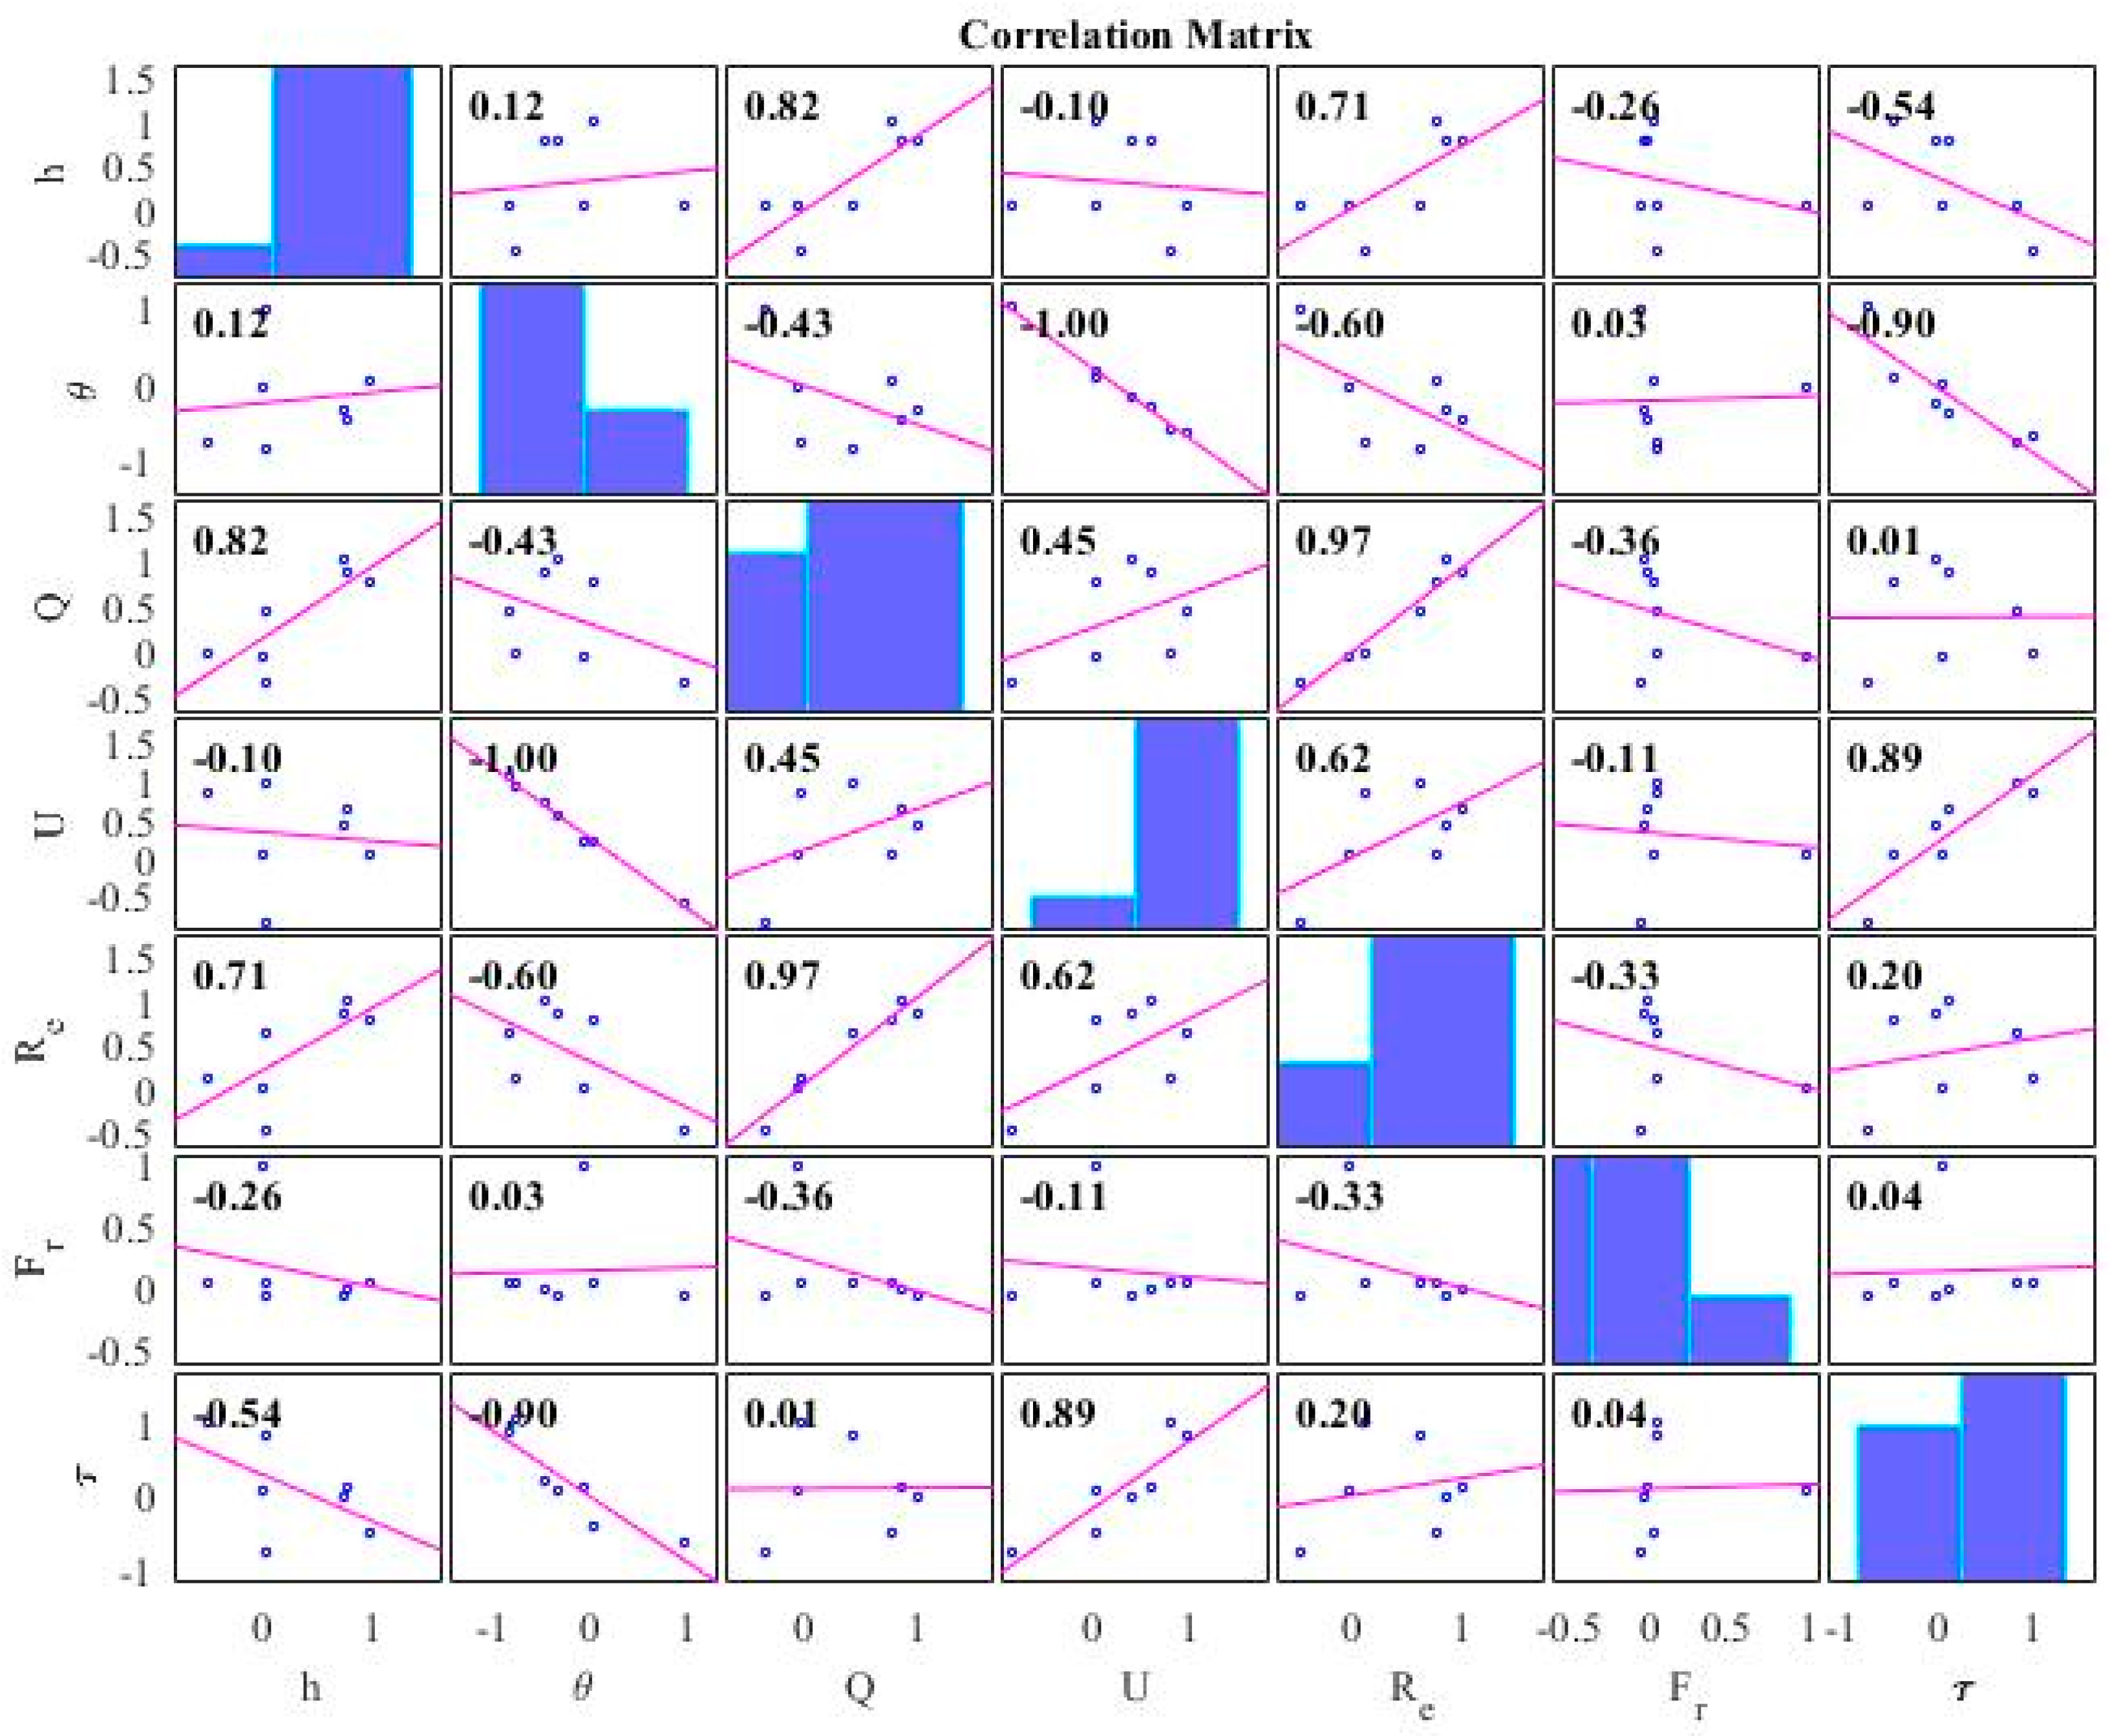
Figure 9 shows the correlation matrix between the input and output variables, confirming that obtaining a statistically significant equation is possible, albeit without physical relevance.
The results of this research can assist in meandering river restoration projects by improving the estimation of the incipient motion of sediment in curved channels within hydraulic models. Using the Reynolds stress distribution to calculate local bed shear stress, rather than the traditional method of τ = γRS, the outcomes for decision-making in the design and planning of fluvial hydraulics projects can be significantly affected. This study demonstrates that the interaction of curved channels and incipient motion influences velocity and Reynolds stress distributions. The velocity distribution exhibits a convex shape, with the maximum value depending on the bend location. Conversely, the Reynolds stress distribution shows a concave shape, indicating that incipient motion occurs more quickly in curved channels than in straight ones. The concave shape is caused by the bending effect, which leads to the observation of sediment movement, even when the critical Shields parameter is below the Shields diagram. The Shields diagram is not appropriate for curved channels, as the incipient motion is observed when the critical Shields parameter is below the diagram in these channels.
This study aimed to investigate the effectiveness of the Shields parameter in curved channels. The previous sections showed that the Shields parameter cannot accurately describe the sediment movement conditions in these channels. Therefore, a representative variable of the curved channel should be considered in estimating the critical Shields parameter. One possible reason for the underestimation of the Shields parameter is the application of a linear distribution of bed shear stress without considering the flow characteristics along the bend. Researchers have presented various models for simulating bend flow processes [5,24]. In these models, efforts have been made to simplify the equations by ignoring certain terms, while still attempting to accurately describe the processes in curved flows.
Figure 10 displays the profiles of Reynolds’s normal stresses in depth at the sediment movement threshold for different angles of the 180-degree flume. Normal stresses, which increase with velocity fluctuations, had maximum values at the bed bottom in all three directions (stream-wise, transverse, and vertical) and decreased towards the water surface. The normal stresses at the sediment movement threshold were highest in the straight path at 30 and 60 degrees, and lowest in the second half of the bend (90 to 150 degrees). The normal stresses in the stream-wise and transverse directions were larger than in the vertical direction, and the normal stress profile in the vertical direction had less variation in the flow depth. Since velocity fluctuations and turbulence may enhance sediment movement, it was expected that sediment movement would be faster in the second half of the threshold bend, which agrees with the previous results.

4. Discussion

Previous studies have predominantly focused on sediment incipient motion in straight river channels, with limited research on river bends. However, the limited studies on 180° sharp bends have not addressed sediment transport, which will be discussed here. Barman et al. (2022) [36] stated that despite many years of research, the structure of turbulence in meander bends remains unclear. They suggested that future work should focus on accurately measuring the fluid stresses exerted on the adjacent boundaries in meander bends.
The flow structures in a river bend are influenced by sediment incipient motion, resulting in more complex processes due to secondary currents. As the river channel’s plane changes, the spatial distribution of flow velocity varies, leading to changes in longitudinal and transverse flow velocities, and consequently, variations in hydraulic parameter estimations. To the authors’ knowledge, no study has examined the incipient motion in a 180° bend considering turbulent flow structures, which hinders the comparison of this study’s results with existing literature.
An examination of the vertical velocity profile revealed that central axis velocities have a small gradient in flow depth but point downward, creating strong vortices and placing the maximum velocity below the water’s surface. The sediment movement and curved channel interaction affect Reynolds stress distribution, showing that the bend degree influences the secondary current’s strength, leading to different patterns and locations of maximum velocity. When the maximum velocity tends towards the bed, the secondary currents become stronger in the bend, though this phenomenon is complex and requires extensive data and analysis. Moghaddassi et al. (2021) [10] examined a meandering channel with two consecutive 180-degree mild bends flanked by straight upstream and downstream reaches. They investigated the impact of varying mean velocity-to-critical velocity ratios at the upstream straight reach on bed topography variations along the meander. Additionally, they studied how the geometry of the upstream bend influenced bed topography in the downstream bend and how the downstream straight end affected the upstream bend. They discovered that variations in bed topography at the upstream bend indicate the downstream bend’s influence on incipient motion conditions along this bend. Furthermore, they found that for each flow velocity to critical velocity ratio (U/Uc) at the upstream bend, the maximum scour occurred 5% of the channel width from the outer bank, within the 178 to 180-degree range. However, Moghaddassi et al. [10] did not examine turbulent flow structures, including 3D velocity components, Reynolds normal stress, and Reynolds shear stress, nor did they discuss the limitations of the Shields parameter. Akbari and Vaghefi (2017) [37] reported that in a 180° sharp bend, the secondary flow strength and the size of the vortex formed from the beginning to the bend apex increased. They also determined the average horizontal angle of the streamlines, as well as the vector and locus of maximum velocity at different levels. However, they did not discuss turbulent flow characteristics or 3D Reynolds stresses.
Changes in velocity profiles affect the calculations of key hydraulic parameters, including the friction factor and Shields parameter. This suggests that applying a constant value for hydraulic parameters along a path may not yield accurate results or reasonable modeling. Bed shear stress results indicate that lower bed shear stress enhances the threshold condition. This experimental research allowed for the observation of complex flow separation and particle motion along the inner side of the curve. High turbulence in the separation zone causes particle movement, which depends on the pressure gradient and the sign of vorticity. Both factors can be calculated using velocity components in different flow directions, though accounting for vorticity in the critical Shields parameter is not currently feasible. Additionally, the Shields diagram requires modification to incorporate Reynolds stress distribution along a curved path. Applying Reynolds stress in incipient motion studies provides practical tools for designers and engineers in fluvial projects, allowing consideration of turbulent flow details rather than relying on average values in fluvial hydraulic models.
The bed shear stress, used in the numerator of the Shields parameter and particle Reynolds number in the Shields diagram, can only be estimated using statistical methods. However, the physical interpretation of this statistical analysis is performed using the momentum (Reynolds) equation. Before the bend apex, the flow experiences a favorable pressure gradient, showing no separation and a concave Reynolds stress distribution without inflection points in flow depth from the bed to the water surface. Conversely, after the apex, flow separation occurs in regions with an unfavorable pressure gradient, leading to a different Reynolds stress distribution. A strong pressure gradient can cause a stall, observed as a dead zone in the downstream part of the bend. These effects of instantaneous velocity fluctuations in 3D are reflected in the critical threshold condition, considering the turbulent flow structure analyzed by ADV in this study. Consequently, the critical Shields parameter is influenced by flow structures and the estimation of Reynolds stress, taking into account favorable or unfavorable pressure gradients in different curve regions.
Figure 6 shows that for the curved channel, Reynolds stress has a concave shape and lower bed shear stress compared to a straight path. The concave Reynolds stress distribution emphasizes that the bent channel accelerates incipient motion compared to the straight path with a mildly convex (quasi-linear) Reynolds stress distribution. Bed maximum Reynolds stress occurs in the bend’s first half (0 to 90 degrees), while bed minimum Reynolds stress occurs in the second half (90 to 180 degrees). Therefore, more sediment transport is expected in the bend’s second half with considered minimum Reynolds stresses for sediment incipient motion. Vaghefi et al. (2016) [13] investigated the influence of streamline variations, maximum velocity distribution, and secondary flow strength on bed shear stress distribution along a 180-degree sharp bend in a laboratory setting. They reported that maximum secondary flow strength occurred in the second half of the bend. They evaluated bed shear stress distribution using the TKE, modified TKE, and Reynolds methods within the turbulent boundary layer. Additionally, they found that maximum shear stress occurred from the entrance of the bend to the bend apex near the inner wall. They observed that maximum shear stress in the lower layer shifted from the 40-degree cross section to the 60-degree cross section in the upper layer. However, they did not present any patterns for Reynolds stress distribution or its application for determining the Shields parameter and predicting incipient motion. Graf and Blanckaert (2002) [38] reported that the magnitude and distribution of normal stresses and turbulent kinetic energy are concentrated over the thalweg, with the magnitude increasing through the first half of the bend. The streamwise cross-stream and cross-stream vertical Reynolds stresses increase as the flow moves through the bend, while the streamwise vertical stresses near the bank become less dominant. Additionally, it was found that the magnitudes of streamwise cross-stream stresses at the outer bank are relatively high compared to other stresses.
This study used the Shields parameter for different angles on a 180-degree bend. The Shields parameter defines the particle movement threshold, assuming uniform flow conditions, which may not hold in bends with non-uniform flow conditions. Curved channels alter Reynolds stress distribution from linear to nonlinear shapes, potentially overestimating or underestimating bed shear stress. This study calculates bed shear stress for estimating the Shields parameter and particle Reynolds number. Different methods exist for shear stress calculation, but more investigation is needed to determine the best method for non-uniform flow conditions due to flow curvature. Many studies have applied the equation τ 0 = γ R S to compute shear stress, where R is the hydraulic radius and S is the energy slope. However, this method only works for uniform and straight channels with linear stress distribution. This research deals with non-uniform flow due to channel curvature, causing nonlinear stress distribution. Therefore, this method is unsuitable. This study employed the Reynolds stress method to estimate channel bed shear stress from the Reynolds shear stress distribution (Figure 6), involving fitting a polynomial function to measure Reynolds stress profiles. The bed shear stress is the intersection point of the fitted curve and the bed on the Reynolds stress.
Using the Reynolds stress method, this study obtained Shields parameters ranging from 0.041 to 0.043 on the straight path, with particle Reynolds numbers up to 39. These values matched the Shields parameter of incipient motion in the Shields diagram, which assumes uniform flow conditions. For the 180-degree bend, the Shields parameter ranged from 0.018 to 0.041 for h = 13 cm, 0.013 to 0.042 for h = 15 cm, and 0.014 to 0.042 for h = 17 cm. This result showed that the Shields parameter was higher on the straight path than on the 180-degree bend, except for a few cases below the Shields curve (Figure 7). This indicated that bed sediment moved more easily on the bent path. The critical Shields parameter value on the bent path was about 8–61% lower than in the Shields diagram. Even though particles moved, the critical Shields parameter was below the Shields curve, suggesting that the Shields diagram overestimated the critical Shields parameter for flow on the 180-degree bend. This overestimation could result from various factors, such as flow non-uniformity in the bend, while the Shields diagram relies on uniform flow, or inappropriate shear stress determination methods. Lastly, the unrealistic estimation and agreement of the Shields parameter in the curved channel with the straight path was because this parameter did not include variables reflecting the curve path and lateral forces’ effects. Therefore, a better estimation of sediment movement threshold conditions in curved channels would consider the convex Reynolds shear stress distribution effect, differing from the straight path’s convex distribution. This study found a lower critical Shields stress for 60 to 120 degrees than other angles, but the critical Shields parameter results do not clearly show the movement threshold conditions for the 180-degree bend.

5. Conclusions

This study examined how channel curvature affects the sediment motion, which is important for river restoration projects. The study measured 42 velocity profiles for flow depths of 13, 15, and 17 cm at a 180-degree bend and a straight path. The classic methods could not determine the incipient motion criterion in bent channels due to changes in velocity and Reynolds stress distributions in different parts of the bend. The results show that the particles started moving when τ c was below the Shields curve in the 180-degree bend. The Shields diagram overestimated the critical Shields parameter along the bend. The concave shape at the bend upstream made the incipient motion faster than in the straight path and bend downstream where a convex distribution was observed for the Reynolds stress. The Shields diagram may not be applicable for curved channels, as incipient motion occurred when the critical Shields parameter fell below the values indicated in the diagram. This study can improve the incipient motion prediction and provide a realistic threshold value for meandering rivers. Using the Reynolds stress distribution instead of τ = γ R S in different locations of the bend, it is possible to better predict the particle movement in the fluvial hydraulics projects. The range of critical Shields parameter varied from 0.015 to 0.042 along a 180-degree bend. This reveals that no single value should be applied in the incipient motion projects because no universal value exists, but it should emphasize the defendable values in the fluvial studies. Furthermore, the results indicated that using artificial intelligence methods, such as multiple linear regression (MLR), may not enhance our understanding of the complex subject of incipient motion. Given that numerical simulations based on digital models of the land, similar to the laboratory model, can further elucidate the results of this study, future numerical research using the laboratory data obtained herein is recommended.
In summary, river restoration is very expensive and requires a significant budget from governmental agencies. A portion of these costs is attributed to sediment transport and changes in river patterns, which can affect river management and water supply policies at the watershed level. Changes in the river path can cause significant conflicts and social unrest in urban and agricultural areas. The study emphasizes the practical applications of understanding meander dynamics in restoration projects, particularly for stabilizing canals or rivers and improving water quality. The novelty of the present study lies in examining the effect of 3D turbulent flow structures on sediment thresholds at various bend angles and highlighting the limitations of the Shields diagram in accurately predicting sediment movement along a bend. This study provides valuable insights for effectively stabilizing riverbeds and banks, thereby contributing to the success of restoration projects and the health of aquatic ecosystems.
Author Contributions

Conceptualization, N.R. and H.A.; methodology, H.A.; software, N.R. and S.-A.A.-P.; resources, H.A. and S.-A.A.-P.; writing—original draft preparation, N.R. and M.N.-S.; writing—review and editing, M.N.-S.; visualization, N.R. and M.N.-S.; supervision, H.A. and M.K. All authors have read and agreed to the published version of the manuscript.

Funding

This research received no external funding.

Data Availability Statement

The data presented in this study are available on request from the corresponding author.

Conflicts of Interest

The authors declare no conflicts of interest.

References

  1. Buffington, J.M.; Montgomery, D.R. A systematic analysis of eight decades of incipient motion studies, with special reference to gravel-bedded rivers. Water Resour. Res. 1997, 33, 1993–2029. [Google Scholar] [CrossRef]
  2. Cheng, N.; Wei, M.; Lu, Y. Critical Flow Velocity for Incipient Sediment Motion in Open Channel Flow with Rigid Emergent Vegetation. J. Eng. Mech.-ASCE 2020, 146, 11. [Google Scholar] [CrossRef]
  3. Garcia, M. Sedimentation Engineering: Processes, Measurements, Modeling, and Practice; Engineering, Environmental Science; American Society of Civil Engineers: Reston, VA, USA, 2008. [Google Scholar] [CrossRef]
  4. Bolhassani, R.; Afzalimehr, H.; Dey, S. Effects of Relative Submergence and Bed Slope on Sediment Incipient Motion under Decelerating Flows. J. Hydrol. Hydromech. 2015, 63, 295–302. [Google Scholar] [CrossRef]
  5. Emadzadeh, A.; Chiew, Y.; Afzalimehr, H. Effect of Accelerating and Decelerating Flows on Incipient Motion in Sand Bed Streams. Adv. Water Resour. 2010, 33, 1094–1104. [Google Scholar] [CrossRef]
  6. Tang, H.; Wang, H.; Liang, D.; Lv, S.; Yan, L. Incipient Motion of Sediment in the Presence of Emergent Rigid Vegetation. J. Hydro-Environ. Res. 2013, 7, 202–208. [Google Scholar] [CrossRef]
  7. He, L.; Chen, D.; Termini, D.; Zhang, S.; Zhu, Z. Experiments on Longitudinal and Transverse Bedload Transport in Sine-Generated Meandering Channels. Appl. Sci. 2021, 11, 6560. [Google Scholar] [CrossRef]
  8. Safari, M.J.S.; Mohammadi, M.; Gilanizadehdizaj, G. On the Effect of Cross-Sectional Shape on Incipient Motion and Deposition of Sediments in Fixed Bed Channels. J. Hydrol. Hydromech. 2014, 62, 75–81. [Google Scholar] [CrossRef]
  9. Safari, M.J.S.; Aksoy, H.; Ünal, N.E.; Mohammadi, M. Experimental Analysis of Sediment Incipient Motion in Rigid Boundary Open Channels. Environ. Fluid Mech. 2017, 17, 1281–1298. [Google Scholar] [CrossRef]
  10. Moghaddassi, N.; Musavi-Jahromi, S.H.; Vaghefi, M.; Khosrojerdi, A. Effect of Mean Velocity-to-Critical Velocity Ratios on Bed Topography and Incipient Motion in a Meandering Channel: Experimental Investigation. Water 2021, 13, 883. [Google Scholar] [CrossRef]
  11. Afzalimehr, H.; Dey, S.; Rasoulianfar, P. Influence of decelerating flow on incipient motion of a gravel-bed stream. J. Sadhana 2007, 32, 545–559. [Google Scholar] [CrossRef]
  12. Motamedi, A.; Afzalimehr, H.; Singh, V.P. Evaluation of a Novel Approach to Determine the Critical Shields Stress. J. Hydrol. Eng. 2010, 15, 892–900. [Google Scholar] [CrossRef]
  13. Vaghefi, M.; Akbari, M.; Fiouz, A. An Experimental Study of Mean and Turbulent Flow in a 180-Degree Sharp Open Channel Bend: Secondary Flow and Bed Shear Stress. KSCE J. Civ. Eng. 2016, 20, 1582–1593. [Google Scholar] [CrossRef]
  14. Mohtar, W.H.M.W.; Lee, J.W.; Azha, N.I.M.; Cheng, N.-S. Incipient sediment motion based on turbulent fluctuations. Int. J. Sediment Res. 2020, 35, 125–133. [Google Scholar] [CrossRef]
  15. Sukhodolov, A.N. Structure of Turbulent Flow in a Meander Bend of a Lowland River. Water Resour. Res. 2012, 48, 1. [Google Scholar] [CrossRef]
  16. Khosravi, K.; Chegini, A.H.N.; Mao, L.; Rodriguez, J.F.; Saco, P.M.; Binns, A.D. Experimental Analysis of Incipient Motion for Uniform and Graded Sediments. Water 2021, 13, 1874. [Google Scholar] [CrossRef]
  17. Dodangeh, E.; Afzalimehr, H. Incipient motion of sediment particles in the presence of bed forms under decelerating and accelerating flows. Hydrol. Hydromech. 2022, 70, 89–102. [Google Scholar] [CrossRef]
  18. Parker, G.; Andrews, E.D. Sorting of Bed Load Sediment by Flow in Meander Bends. Water Resour. Res. 1985, 21, 1361–1373. [Google Scholar] [CrossRef]
  19. Jiao, D.D.; Shao, X.J.; Zhou, G. Selection of Bed-Load Transport Direction in 3D Water-Sediment Numerical Simulation of Bends. J. Hydrodyn. 2008, 23, 546–553. [Google Scholar]
  20. Gonzalez, F.N.; Rovira, A.; Ibanez, C. Bed Load Transport and Incipient Motion Below a Large Gravel-Bed River Bend. Adv. Water Resour. 2017, 120, 83–97. [Google Scholar] [CrossRef]
  21. Wang, M.; Blanckaert, K.; Heyman, J.; Li, D.; Schleiss, A. A Parametrical Study on Secondary Flow in Sharp Open-Channel Bends: Experiments and Theoretical Modelling. J. Hydro-Environ. Res. 2016, 13, 1–13. [Google Scholar] [CrossRef]
  22. Wang, H.; Tang, H.; Zhao, H.; Zhao, X.; Lu, S. Incipient Motion of Sediment in Presence of Submerged Flexible Vegetation. Water Sci. Eng. 2015, 8, 63–67. [Google Scholar] [CrossRef]
  23. Shahmohammadi, R.; Afzalimehr, H.; Sui, J. Estimation of Bed Shear Stress in Shallow Transitional Flows under Condition of Incipient Motion of Sand Particles Using Turbulence Characteristics. Water 2022, 14, 2515. [Google Scholar] [CrossRef]
  24. Kramer, H. Sand Mixtures and Sand Movement in Fluvial Model. Trans. Am. Soc. Civ. Eng. 1935, 100, 798–838. [Google Scholar] [CrossRef]
  25. Rahmanshahi, M.; Jafari-Asl, J.; Bejestan, M.S.; Mirjalili, S. A Hybrid Model for Predicting the Energy Dissipation on the Block Ramp Hydraulic Structures. Water Resour. Manag. 2023, 37, 3187–3209. [Google Scholar] [CrossRef]
  26. Rahmanshahi, M.; Jafari-Asl, J.; Fathi-Moghadam, M.; Ohadi, S.; Mirjalili, S. Metaheuristic Learning Algorithms for Accurate Prediction of Hydraulic Performance of Porous Embankment Weirs. Appl. Soft Comput. 2024, 151, 111150. [Google Scholar] [CrossRef]
  27. Rad, M.J.G.; Ohadi, S.; Jafari-Asl, J.; Vatani, A.; Ahmadabadi, S.A.; Correia, J.A. GNDO-SVR: An Efficient Surrogate Modeling Approach for Reliability-Based Design Optimization of Concrete Dams. Structures 2022, 35, 722–733. [Google Scholar] [CrossRef]
  28. Ohadi, S.; Monfared, S.A.H.; Moghaddam, M.A.; Givehchi, M. Feasibility of a Novel Predictive Model Based on Multilayer Perceptron Optimized with Harris Hawk Optimization for Estimating the Longitudinal Dispersion Coefficient in Rivers. Neural Comput. Appl. 2022, 35, 7081–7105. [Google Scholar] [CrossRef]
  29. Khademi, F.; Jamal, S.M.; Deshpande, N.; Londhe, S. Predicting Strength of Recycled Aggregate Concrete Using Artificial Neural Network, Adaptive Neuro-Fuzzy Inference System, and Multiple Linear Regression. Int. J. Sustain. Built Environ. 2016, 5, 355–369. [Google Scholar] [CrossRef]
  30. Rath, S.; Tripathy, A.; Tripathy, A. Prediction of New Active Cases of Coronavirus Disease (COVID-19) Pandemic Using Multiple Linear Regression Model. Diabetes Metab. Syndr. Clin. Res. Rev. 2020, 14, 1467–1474. [Google Scholar] [CrossRef] [PubMed]
  31. Kironoto, B.A.; Graf, W.H. Turbulence Characteristics in Rough Non-Uniform Open-Channel Flow. Proc. Inst. Civ. Eng. 1995, 112, 336–348. [Google Scholar] [CrossRef]
  32. Dey, S. Fluvial Hydrodynamics, Hydrodynamics and Sediment Transport Phenomena; Springer: Berlin/Heidelberg, Germany, 2014. [Google Scholar] [CrossRef]
  33. Julien, P.Y. Erosion and Sedimentation, 2nd ed.; Cambridge University Press: Cambridge, UK, 2010. [Google Scholar] [CrossRef]
  34. Rowinski, P.M.; Dey, S. Water-Worked Bedload: Hydrodynamic and Transport. Water 2019, 11, 1396. [Google Scholar] [CrossRef]
  35. Bai, R.; Zhu, D.; Chen, H.; Li, D. Laboratory Study of Secondary Flow in an Open Channel Bend by Using PIV. Water 2019, 11, 659. [Google Scholar] [CrossRef]
  36. Barman, J.; Taye, J.; Kumar, B. Review on Hydraulics of Meandering Rivers. In Hydraulics, Water Resources and Coastal Engineering; Jha, R., Singh, V.P., Singh, V., Roy, L.B., Thendiyath, R., Eds.; Springer Nature: Cham, Switzerland, 2022; Volume 2. [Google Scholar]
  37. Akbari, M.; Vaghefi, M. Experimental investigation on streamlines in a 180° sharp bend. Acta Sci. Technol. 2017, 39, 425–432. [Google Scholar] [CrossRef]
  38. Graf, W.H.; Blanckaert, K. Flow around bends in rivers. In Proceedings of the 2nd International Conference on New Trends in Water and Environmental Engineering for Safety and Life: Eco-Compatible Solutions for Aquatic Environments, Capri, Italy, 24–28 June 2002; pp. 1–9. [Google Scholar]
Figure 1. Shields diagram [4].
Water 16 02162 g001
Figure 2. Schematic illustration of (a) 3D view; (b) cross-sectional view.
Water 16 02162 g002
Figure 3. Plan view of the flume.
Water 16 02162 g003
Figure 4. (a) Flow velocity distribution at the straight path, and (b) flow velocity distribution at the center of the cross section of 90 degrees at the bent path.
Water 16 02162 g004
Figure 5. Flow velocity distribution at the center of each section at the bent path. U, V, and W are the longitudinal, transverse, and vertical velocity components.
Water 16 02162 g005
Figure 6. Distributions of the Reynolds shear stress u w at a straight path and the 180-degree bend at every 15 degrees with h = 17 cm.
Water 16 02162 g006
Figure 7. Comparison of the Shields parameter at the straight path and the 180-degree bend.
Water 16 02162 g007
Figure 8. The variation of critical Shields parameter for the 180-degree bend for the flow depths 13, 15, and 17 cm.
Water 16 02162 g008
Figure 9. The correlation matrix between the input and output variables.
Water 16 02162 g009
Figure 10. The Reynolds normal stress distribution at the center in the stream-wise, transverse, and vertical direction at the straight path and the 180-degree bend with h = 15 cm.
Water 16 02162 g010
Table 1. Details of datasets of the experimental model.
Pro.
No.
ProfileQ
(Lit/s)
U
(m/s)
ReFr τ c
Straight path1SM-0-0.1540.70.420663,0830.350.042
2SM-1-0.1540.70.432364,8410.360.042
3SM-0-0.1744.50.422071,7330.330.043
4SM-1-0.1744.50.442575,2280.340.043
5SM-0-0.13360.432956,2820.380.041
6SM-1-0.13360.451158,6490.400.041
Curved path7CM-0-0.15380.418962,8310.350.037
8CM-30-0.1536.50.413361,9910.340.042
9CM-0-0.17420.375063,7580.290.04
10CM-30-0.17410.430073,1060.330.042
11CM-0-0.13310.379749,3650.340.031
12CM-30-0.1330.50.383149,8050.340.041
13CM-45-0.17400.399267,8690.310.036
14CM-60-0.17390.429072,9260.330.023
15CM-45-0.15340.365354,7890.300.034
16CM-60-0.15310.393859,0750.320.028
17CM-45-0.13290.374248,6430.330.036
18CM-60-0.13280.390550,7660.350.031
19CM-75-0.17370.384065,2810.300.024
20CM-90-0.17370.386665,7210.300.026
21CM-75-0.1530.50.391958,7780.320.028
22CM-90-0.1530.50.391258,6800.320.03
23CM-75-0.13270.399651,9490.350.025
24CM-90-0.13270.375348,7830.330.034
25CM-105-0.13270.349345,4120.310.026
26CM-120-0.13270.348945,3550.310.022
27CM-105-0.17360.368762,6830.290.031
28CM-120-0.17360.360261,2270.280.021
29CM-105-0.15300.350452,5650.290.031
30CM-120-0.15300.344751,7040.280.023
31CM-135-0.13280.330242,9320.29-
32CM-150-0.13290.411253,4620.36-
33CM-135-0.1736.50.343658,4080.270.016
34CM-150-0.17380.332456,5020.260.014
35CM-135-0.1533.250.351952,7870.290.02
36CM-150-0.15350.344551,6700.280.013
37CM-165-0.1535.50.359153,8710.300.014
38CM-180-0.15370.381857,2630.31-
39CM-165-0.1738.50.346158,8370.270.021
40CM-180-0.17400.343858,4420.270.017
41CM-165-0.1329.50.350345,5440.310.018
42CM-180-0.13300.338844,0400.300.019
Table 2. The proposed equation of the Shields parameter.
MLRorderEquation
1 0.0255 × h 0.00013511 × t h e t a + 0.00016008 × Q + 0.08643 × U 2.488 e 07 × R e 0.046481 × F r
Table 3. Performance assessment of the presented equation.
Parameters
RMSEMAER
MLR1thorderTrain0.00320.00260.8970
Test0.00230.00230.5391
Disclaimer/Publisher’s Note: The statements, opinions and data contained in all publications are solely those of the individual author(s) and contributor(s) and not of MDPI and/or the editor(s). MDPI and/or the editor(s) disclaim responsibility for any injury to people or property resulting from any ideas, methods, instructions or products referred to in the content.