Article

Assessment and Driving Factors of Wetland Ecosystem Service Function in Northeast China Based on InVEST-PLUS Model

by
Xiaolin Zhu
1,
Ruiqing Qie
2,*,
Chong Luo
3,* and
Wenqi Zhang
2
1
Department of Landscape Architecture, College of Forestry and Grassland Science, Jilin Agricultural University, Changchun 130118, China
2
Department of Land Resource Management, College of Economics and Management, Jilin Agricultural University, Changchun 130118, China
3
State Key Laboratory of Black Soils Conservation and Utilization, Northeast Institute of Geography and Agroecology, Chinese Academy of Sciences, Changchun 130102, China
*
Authors to whom correspondence should be addressed.
Water 2024, 16(15), 2153; https://doi.org/10.3390/w16152153
Submission received: 26 June 2024 / Revised: 23 July 2024 / Accepted: 24 July 2024 / Published: 30 July 2024
(This article belongs to the Section Ecohydrology)

Abstract

:
Wetland ecosystem service function provides and maintains the Earth’s life system, which supports human and social development. However, in recent years, with the intensification of human social activities, the wetland area in northeast China has been reduced, and wetland ecosystem service function has been damaged. This paper evaluates the ecosystem service function of wetlands in northeast China based on the InVEST model, taking 40 prefecture-level cities as the evaluation unit, calculating the carbon stock, soil retention, and habitat quality of the wetlands in the study area and analyzing the drivers of changes in ecosystem service function using the PLUS model. The following results were obtained: temporally, the wetland carbon stock decreased from 754 Tg in 2000 to 688 Tg in 2020; the wetland soil retention increased from 24,424 Tg in 2000 to 33,160 Tg in 2010, and then decreased to 28,765 Tg in 2020; and the quality of wetland habitats was roughly unchanged. The wetland habitats in the study area were categorized into 5 types, classified as I, II, III, IV, or V, and the spatial changes in the 40 prefecture-level cities in northeast China were analyzed. The driving factors affecting the change in the wetland ecosystem service function were further analyzed, mainly focusing on changes in the wetland area itself. The influence of other land-use types and the influence of related policies were analyzed in three aspects, among which the GDP and spatial density of the population are social factors, and the elevation and slope are natural factors that provide larger contributions to the change in wetland area. The reduction in forest and grassland areas and the increase in cultivated land and construction land areas have a negative effect on the ecosystem service function of wetlands, and the implementation of relevant wetland protection policies promotes the ecosystem service function of wetlands. According to the problems faced by wetlands in different regions, the government formulates strategies that are in line with local development, with a view to implementing wetland ecological development in the northeast region in the new context, which will help to realize intensive land use and stimulate the vitality of the region.

1. Introduction

Wetland ecosystem service function and value are important components of the Earth’s living system [1,2], which supports human and social development [3]. Since the 1950s, human social activities have intensified [4]; large areas of land have been reclaimed for farmland, and irrational development has led to soil erosion [5] and a decline in soil-retention function [6]. Expansion of construction land, logging of forests [7,8,9], serious desertification of grasslands, and encroachment of ecological land by cropland and construction land have led to a decrease in vegetation cover and forest area [4,10] and an increase in carbon dioxide emissions [11,12], resulting in the greenhouse effect. Climate change has also caused changes in biodiversity, with wetland areas shrinking under the influence of warming, droughts leading to a reduction in habitat and biodiversity, and extreme weather events affecting biodiversity through habitat destruction.
In 2020, China proposed the goals of “carbon peaking” by 2030 and “carbon neutrality” by 2060 and incorporated them into the 14th Five-Year Plan. On 27 March 2023, China released the “Beautiful China 2035” plan, with the goal of achieving sustainable development. To realize sustainable development, it is necessary to pay attention to the development of ecosystem service function. Quantitatively evaluating the ecosystem service function allows people to visually see the change in ecosystem service function and raise people’s awareness of protecting the ecological environment.
Ecosystem services are the substances and products that human beings obtain from ecosystems [13,14]. In this paper, we systematically combed through the domestic and international literature related to ecosystem service assessment studies conducted in recent years and found that, in terms of study areas, the main focus has been on the meso–macro level, including municipal [15] and provincial [16] levels based on administrative divisions, followed by urban territorial types such as urban agglomerations [17], as well as wetlands [18], forests [19], watersheds [20], and other ecosystem-related studies. In terms of research methods, the main methods that have been commonly used for ecosystem service function assessment are field surveys, biogeochemical process modeling [21,22], and the integrated valuation of ecosystem service function (InVEST) model [23,24]. Field surveys can yield more accurate results but are not adapted to areas with large ranges. Biogeochemical process models generally require complex parameter inputs, which diminish the direct impact of land use on ecosystem services. The InVEST model has simple input parameters, high generality, and stability, which can spatially integrate the dynamics of land use and terrestrial ecosystem services, and is widely applicable to the comprehensive evaluation and simulation of the carbon cycle in different regions. The impacts of ecological engineering on ecosystem services in the upper Heihe River Basin in the semiarid region of Northwest China were assessed by linking CA-Markov and InVEST models [23]. Alternatively, the integrated ecosystem services and trade-offs (InVEST) model and the water inundation frequency framework were proposed for the long-term assessment of wetland ecosystem carbon stock services in the Greater Bay Area, which in turn promotes regional sustainable development. Other studies have assessed and predicted carbon stocks in Indian forests using Markov chain and InVEST models [25]. Previous studies mainly analyzed the effects of InVEST model ecosystem services with natural environmental factors and neglected the effects of socioeconomic factors on ecosystem services. With the development of metacellular, automata-based land-use simulation models, more and more scholars have used CA-based land-use simulation models to simulate land-use changes, including the CLUE-S model [26,27,28], CA-Markov model [29,30], and PLUS model [31,32], to explore the relationship between land use and ecosystem services under multiscenario simulations and to study the drivers of land change.
Northeast China has the largest area of wetland distribution and the largest number of wetland types in China. The total area of wetlands in northeast China is 1.06 × 10⁷ km2. Natural wetlands account for 67.83% of the total area, with an area of 7.19 × 10⁶ km2. Wetlands in northeast China provide a large number of ecosystem services, including freshwater supply, flood control, water purification, wildlife habitats, aquatic biological reserves, and sand barriers. Wetlands in northeast China can be divided into the Three Rivers Plain wetlands, Songnen Plain wetlands, Liaohe River wetlands, Daxinganling wetlands, Xiaoxinganling wetlands, and Changbai Mountain wetlands. Among them, Sanjiang Plain wetlands and Songnen Plain wetlands are most seriously disturbed by human activities [33]. Wetlands in northeastern China are typical areas for ecological management and ecological restoration, assuming important ecological service functions and providing regional services such as water conservation, soil conservation, and carbon sequestration. However, the previous literature lacks research on the assessment of ecosystem service functions affecting wetlands in northeast China. In this paper, we introduce the InVEST model; adjust the parameters to assess the three major ecological service functions of carbon storage, biodiversity, and soil conservation in the study area; and analyze the contribution of their drivers to provide suggestions for the development of scientific and reasonable environmental-management policies.

2. Database and Methodology

2.1. Data Sources

Land-use data were collected from http://www.globallandcover.com/ (accessed on 14 May 2023), soil-environment data (among natural-driver data) were collected from https://data.tpdc.ac.cn/home (accessed on 14 May 2023), other natural-driver data were collected from https://www.resdc.cn/ (accessed on 14 May 2023), and social-driver data were collected from https://www.resdc.cn/ (accessed on 14 May 2023).

2.2. Study Area

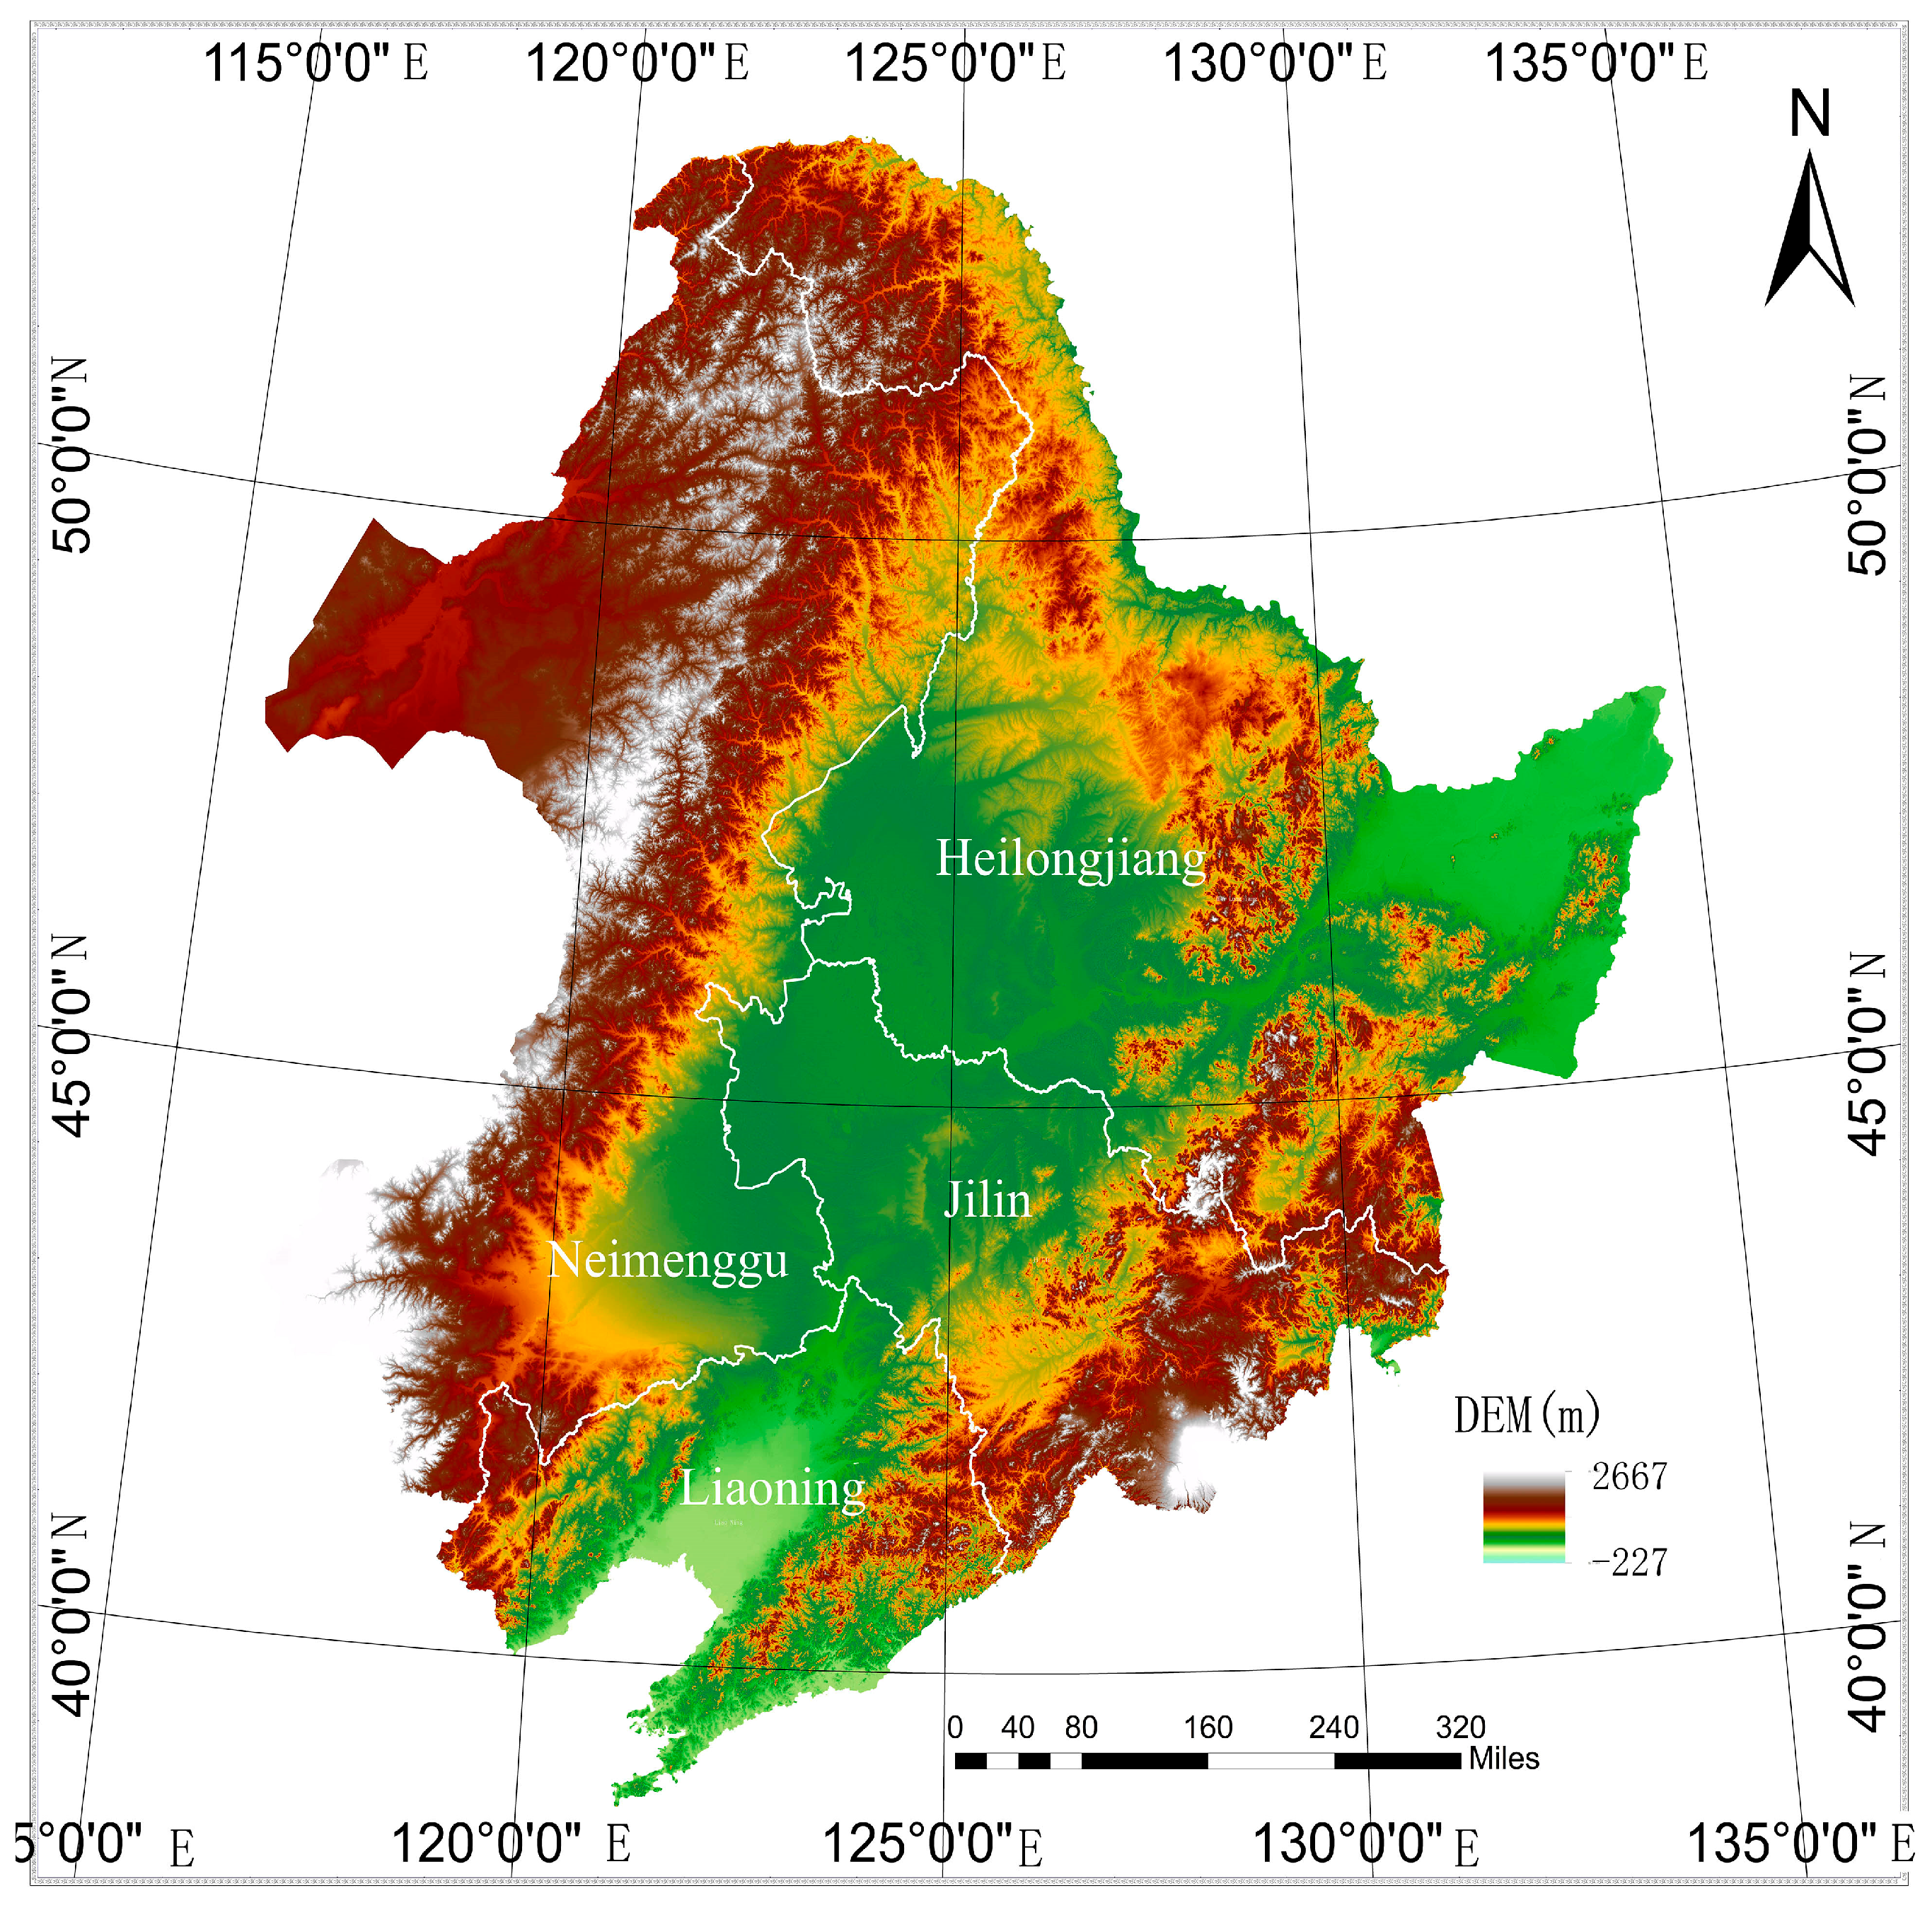
The northeast region is located in the northeastern part of China’s mainland at 115° E~135° E and 38° N~56° N. Its administrative division includes all of Liaoning, Jilin, and Heilongjiang Provinces, as well as Hulunbeier, Xinganmeng, Tongliao, and Chifeng in the eastern part of the Inner Mongolia Autonomous Region, and occupies a land area of about 1,240,000 square kilometers. Its northwestern part is the northern section of Daxinganling, the northeastern part is Xiaoxinganling; the eastern part is the Sanjiang Plain, as well as a series of mountainous areas; the southeastern part is the Changbai mountainous area; the southern part is the Liaohe Plain; and the central part is centered on the North China Plain, with the altitude between 800 and 1200 m, forming the ground features of mountains surrounded by water and fertile fields. The zonal vegetation includes cold-temperate coniferous forests in the northern part of the Daxinganling Mountains, temperate mixed coniferous and broad forests in the eastern part of the mountains, and semimoist forested grasslands in the plains. The main land-cover types are forested land, cultivated land, and grassland. Permafrost is also widely distributed in the northeast, which is the second largest permafrost distribution area in China. Major rivers, such as the Songhua River, Dongliao River, Xiliao River, and Yalu River, originate here, providing abundant water sources for the formation and development of wetlands [33,34,35], as shown in Figure 1. The distribution of wetlands from 2000 to 2020 is shown in Figure 2.

2.3. Carbon Storage Calculation

In this paper, based on the InVEST model used to calculate carbon storage metrics, the carbon storage and sequestration module was used to aggregate biophysical quantities of carbon that are stored in four carbon pools, namely, aboveground living biomass (the carbon in all living plant material above the soil), belowground living biomass (the carbon present in the living root system of the aboveground biomass), soil organic matter (the carbon distributed in the soil’s organic components), and dead organic matter (carbon in dead leaves and branches as well as horizontal and standing dead branches) [2,36]. Based on different land-use types and carbon densities, the carbon density of LULC type i can be expressed as follows:
Ci = Cia + Cib + Cis + Cid
C tot = i = 1 n   C i × S i
where i denotes the land-use type, Ci denotes the total carbon density of land-use type i, Cia denotes the aboveground density, Cib denotes the belowground density, Cis denotes the soil organic carbon density, and Cid denotes the dead organic carbon density. All carbon densities are expressed in megagrams per hectare (Mg/ha). In addition, Ctot denotes the total carbon stock of the ecosystem (Mg), Si denotes the area (ha) of land-use type i, and n denotes the number of land-use types; in this study, n = 1. The carbon-pool density was determined according to the study of carbon density in wetland areas by Liu Shuang et al., [35,37], and the results are shown in Table 1.

2.4. Calculation of Soil-Conservation Module

Soil conservation refers to the erosion-control ability of the ecosystem to prevent soil loss and the sediment-storage retention ability and is calculated by applying the sediment-transport-rate module from the InVEST model [38]. The calculation formula is as follows:
RKLSn = Rn × Kn × Ln × Sn
USLEn = Rn × Kn × Ln × Sn × Cn × Pn
SKn = RKLSn − USLEn
where RKLSn is the potential soil-erosion amount (t); USLEn is the actual soil-erosion amount (t); SKn is soil retention (t); Rn is rainfall erosivity; Kn is soil erodibility; Ln is the slope-length factor; Sn is the slope factor; Cn is the vegetation-cover and management factor; and Pn is a soil- and water-conservation-measure factor.
Based on the above, the soil-conservation module needs to input raster data such as land use, DEM, rainfall-erosivity factor, soil-erodibility factor, surface-vector data of subbasins in northeast China, and the biophysical table. Refer to Zhou Lilei and other related studies to determine the values of C factor and P factor [38] shown in Table 2.

2.5. Calculation of the Habitat-Quality Module

The habitat-quality model in the InVEST model can reflect biodiversity by assessing the extent and degradation of habitat types or vegetation types in the region. It combines the land-use/-cover information and biodiversity threat factors within the ecosystem to obtain the distribution information of the habitat quality, so as to assess the biodiversity function of the study area [39]. In this study, construction land, cultivated land, and major transportation arteries were used as habitat-threat sources, and the impact range, weight and attenuation mode of the threat sources were determined with reference to the relevant research by Liu Shuang et al. [37]. The habitat suitability and its relative sensitivity to different threat sources are shown in Table 3 and Table 4.

2.6. Calculation of the Contribution of Drivers Affecting Changes in Land-Use Types

When selecting PLUS model [20,32,40,41] clustering-process drivers, the main LEAS module calculation is carried out, with extensive reference to related literature to select driver indicators. All driver projection-coordinate systems were unified as WGS1984. Social drivers and natural-factor indicators are inputted into the LEAS module, and the driver contribution is calculated, as shown in Table 5.

3. Results

According to the land-use-type data from the GlobeLand30 data platform, the wetland patches were extracted, and the wetland land area decreased from 1,632,124 hm2 to 1,476,421 hm2. As shown in Figure 2, the wetland areas of the Sanjiang Plain and the Liaohe River delta showed more obvious changes: the Liaohe River delta increased in wetland area from 2000 to 2010 as the mainly grassland area was converted into wetland, and the wetland area decreased from 2010 to 2020 as wetland was converted into cropland. In the Three Rivers Plain, the wetland area remained basically unchanged from 2000 to 2010, and the wetland area decreased from 2010 to 2020, during which the wetland was mainly converted into cropland.

3.1. Analysis on Evolution of Ecosystem Service Functions in the Study Area

3.1.1. Analysis of Temporal and Spatial Changes in Carbon Stocks

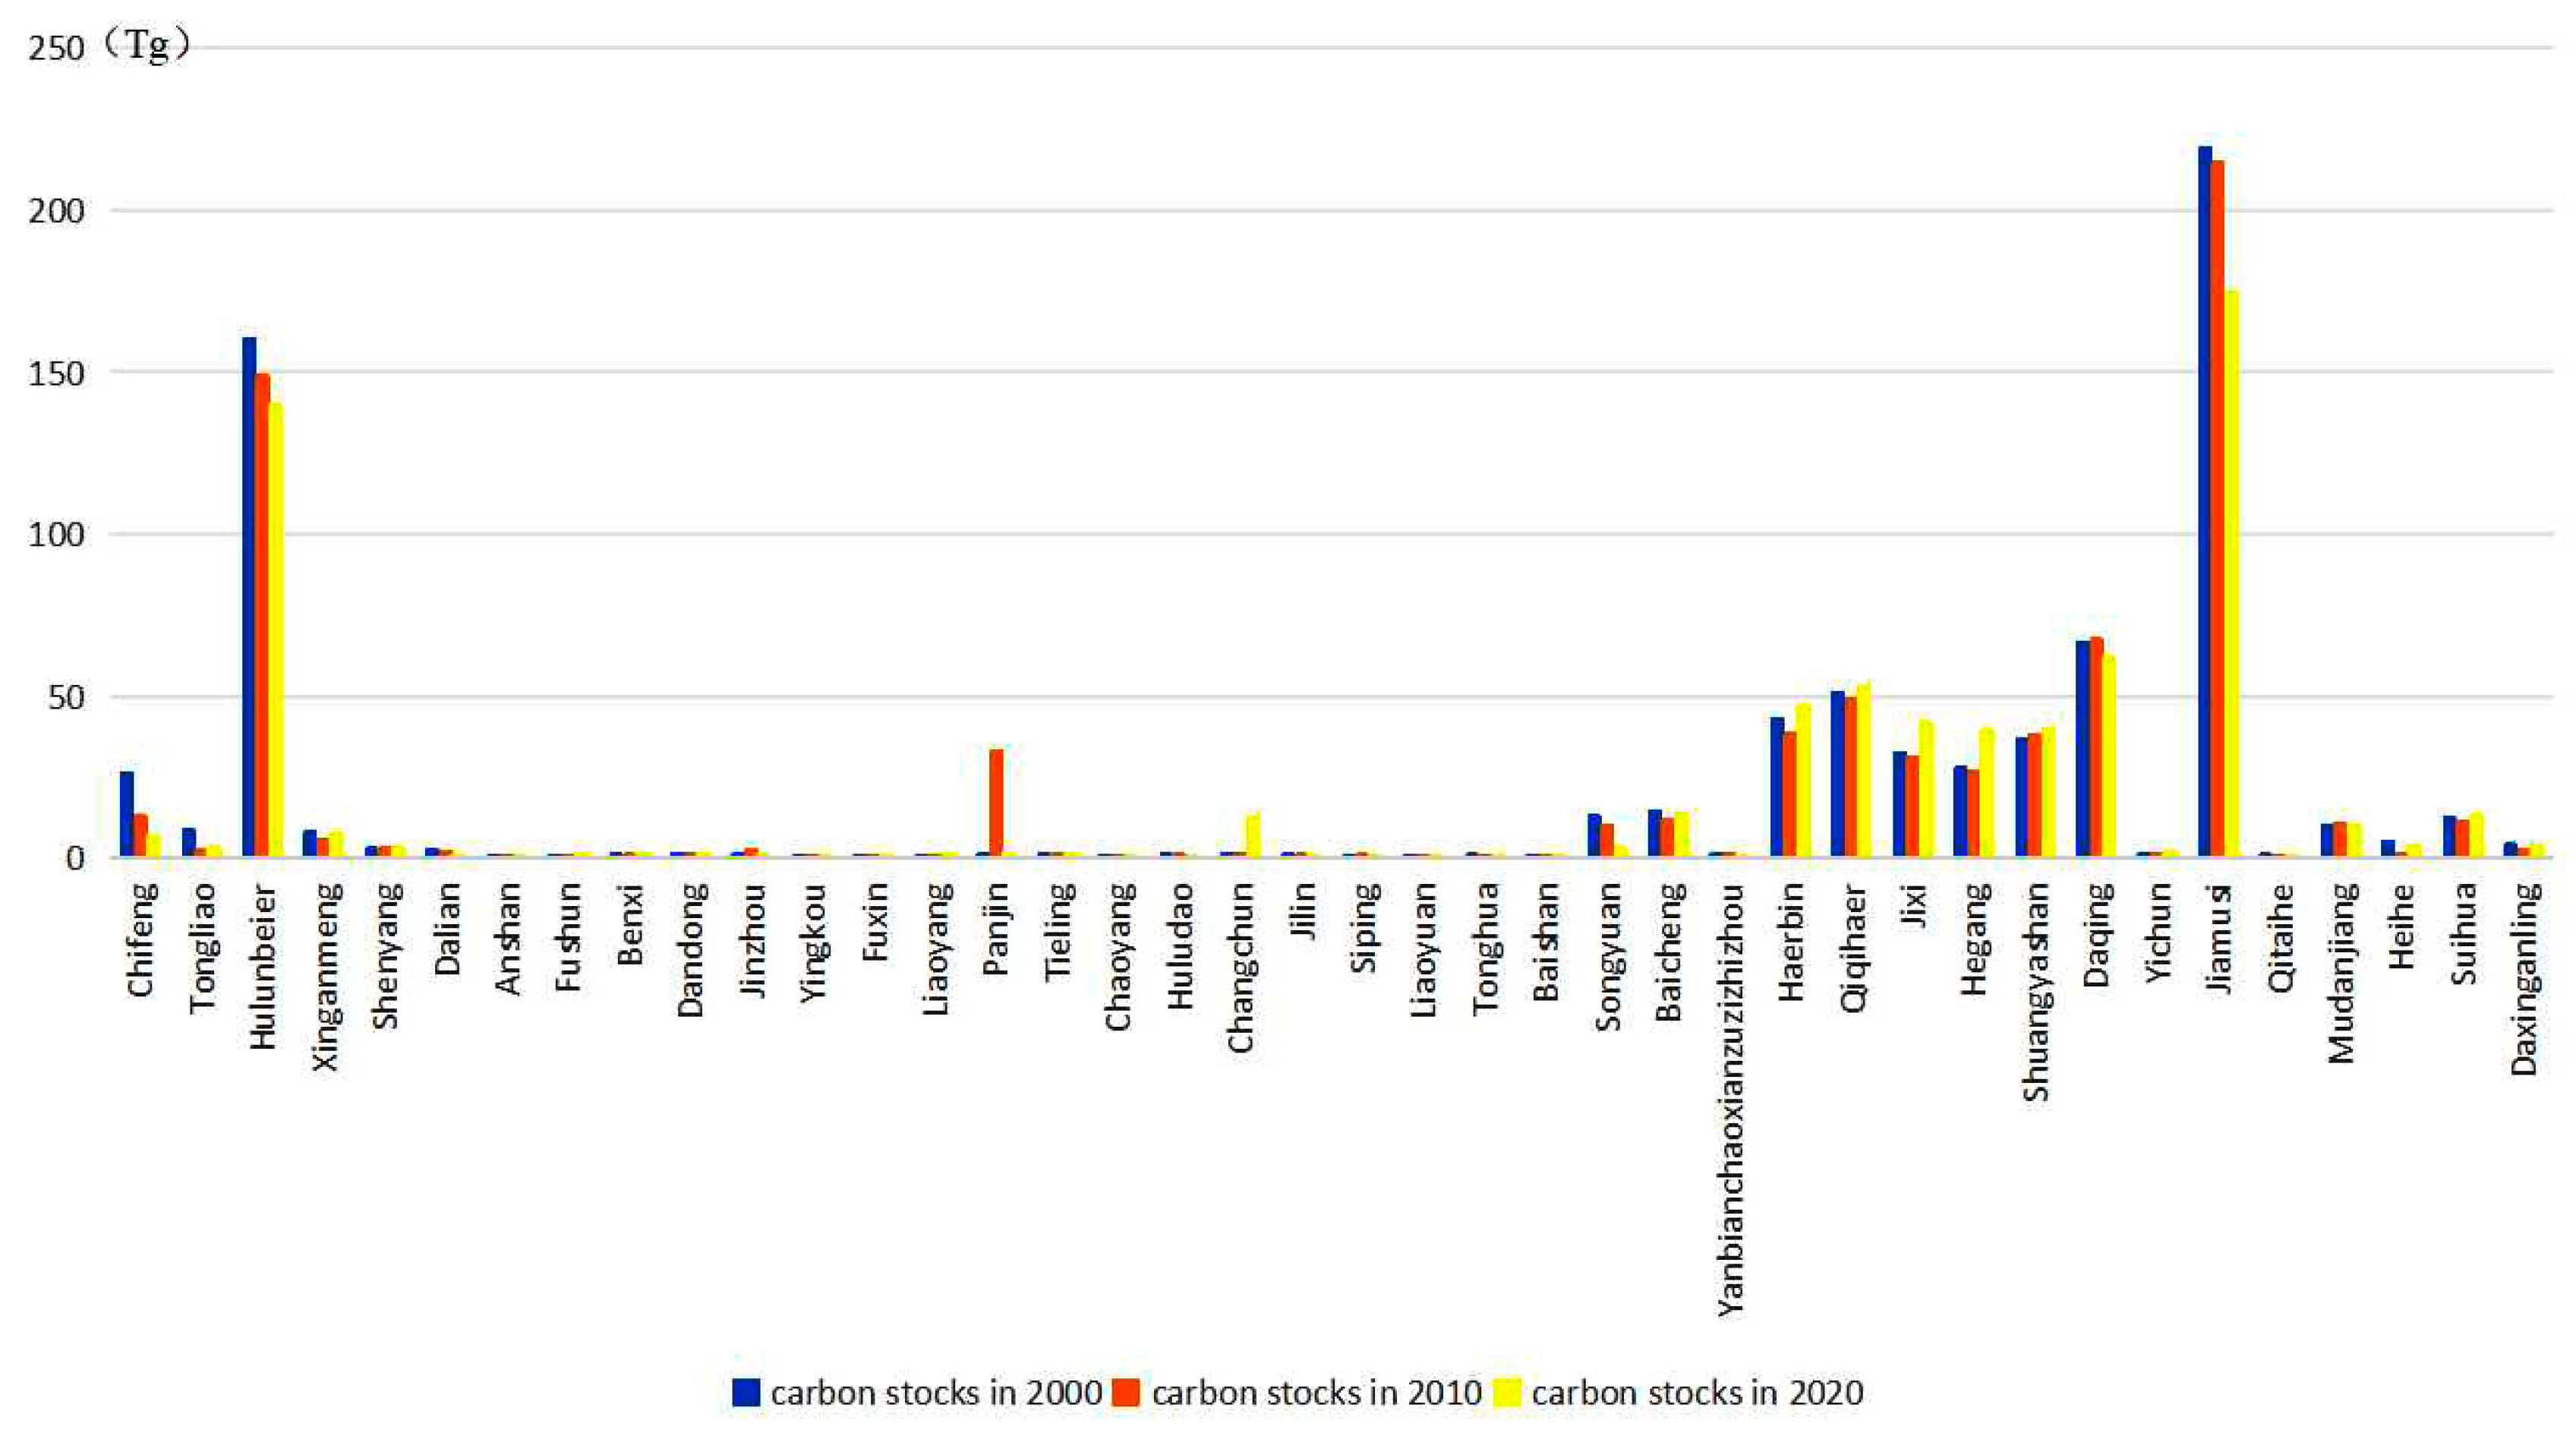
For example, Figure 3 shows the change in wetland carbon stock in 40 prefecture-level cities from 2000 to 2020. Using the partition statistics function of QGIS3.32.0, the carbon stock of each prefecture-level city was obtained for all 40 cities. The wetland carbon stock decreased from 755 Tg in 2000 to 736 Tg in 2010, and then decreased further to 689 Tg in 2020. The wetland carbon stock of Jiamusi was the highest. The wetland area in the Jiamusi region is extensive, and includes wetlands of the Three Rivers Plain, so the wetland carbon stock is higher. In recent years, many wetlands have been converted into cropland, and local wetland resources have been reduced, which, together with the degradation of the surrounding ecological environment, has led to a decrease in wetland carbon stock. Hulunbeier City has a high wetland carbon stock, showing a trend of growth and then decreasing. The Hulunbuir region is rich in wetland resources, and includes Hulunbuir grassland, which can promote soil carbon sequestration and improve the carbon storage of local wetlands. However, in recent years, grassland degradation has caused serious degradation of the local ecological environment and may cause a reduction in wetlands, resulting in reduced wetland carbon storage. Wetland carbon stock in Panjin City region has changed a lot, and includes the Shuangtai estuary of Liaoning Province and Liaohe delta wetlands [42]. Some grasslands may have been converted into wetlands between 2000 and 2010 under the appeal of some wetland-protection policies, and some wetlands have been converted into croplands between 2010 and 2020, which will reduce wetland resources and carbon stock.
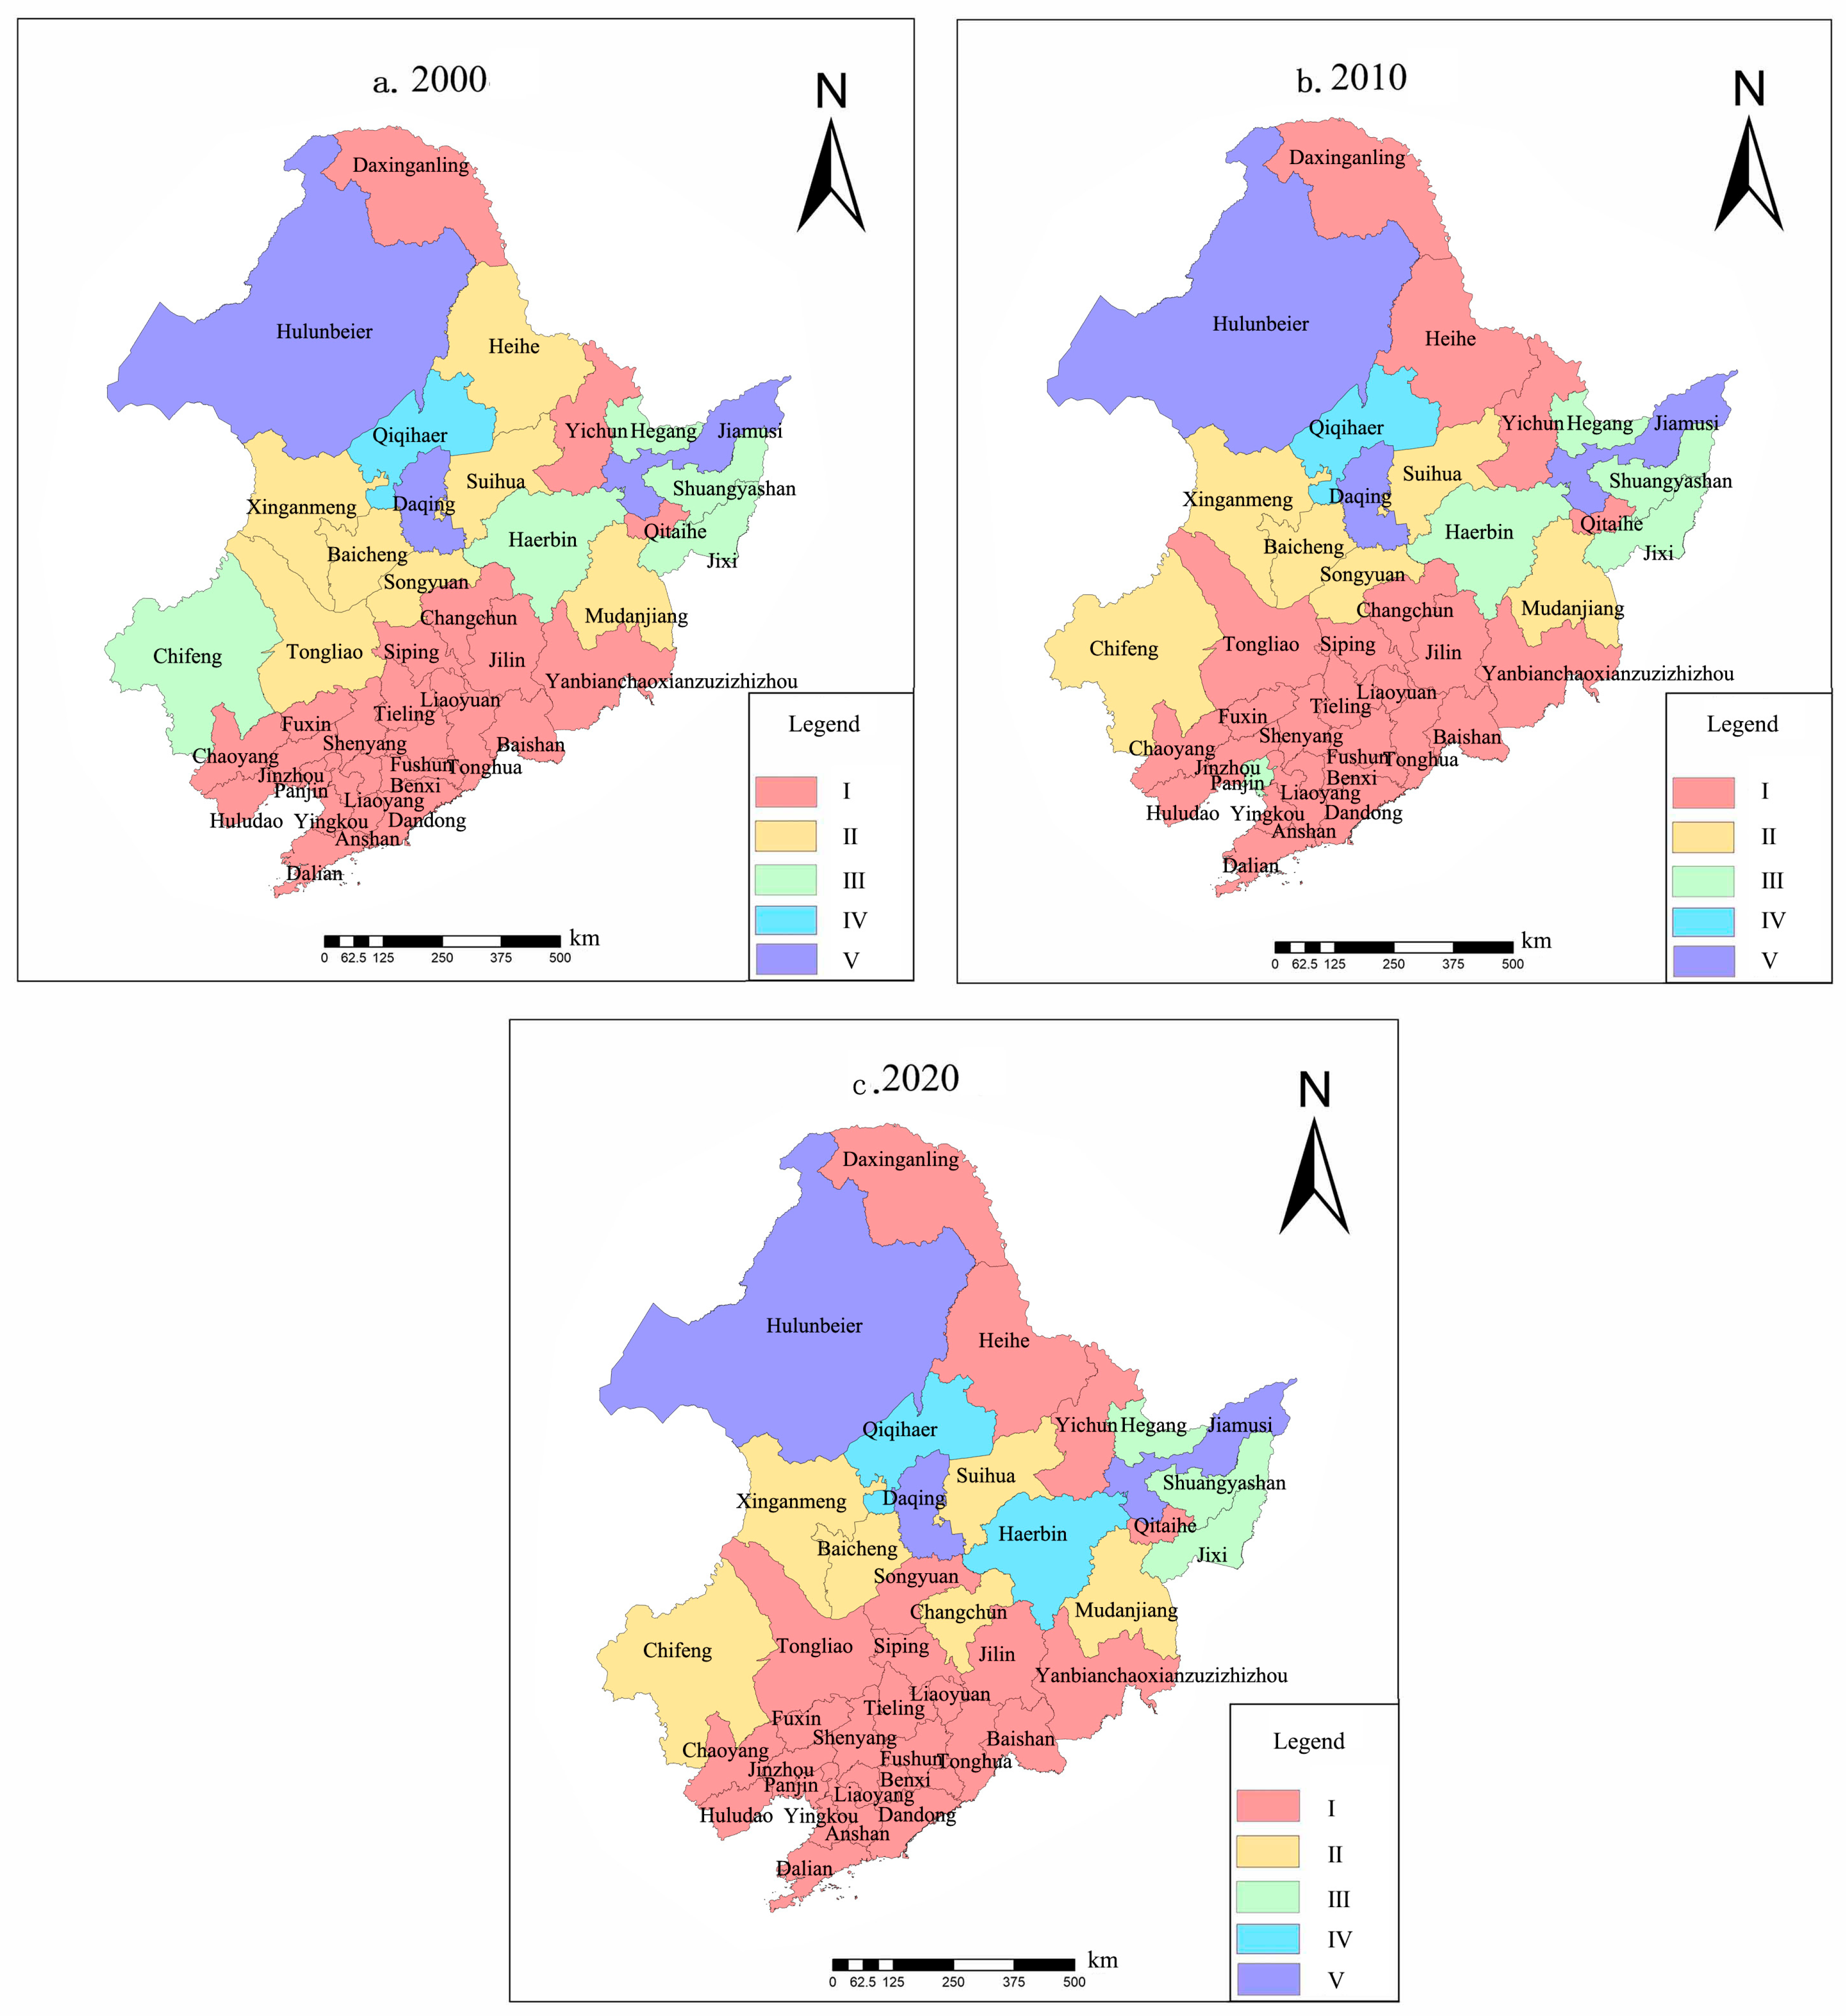
The carbon stock of wetlands in 40 municipalities in northeast China is functionally graded into five degrees: I, II, III, IV, and V, as shown in Table 6. As shown in Figure 4, from 2000 to 2020, about 60–67.5% of the area in northeast China had a carbon stock value of I; 15–17.5% of the area had a value of II; 7.5–12.5% had a value of III; 2.5–5% had a value of IV; and about 7.5% had a value of V. Among these municipalities, Panjin City increased from a value I area to a value III area, and then became a value I area again, which was related to the increase and decrease in local wetland resources and the rapid development of local economy. The encroachment of construction land into the wetland likewise caused a large amount of loss in wetland area. Changchun City and Heihe City, which included wetland areas of Daxinganling, Xiaoxinganling, and Changbai Mountain in their administrative area, increased from being value I areas to value II areas. It is possible that people’s awareness of wetland protection has increased in the past few years and the management of wetland areas has been strengthened. As a result, the wetland may have suffered less damage, allowing the wetland carbon stock to increase. The Harbin City area increased from value III to value IV, and includes Songnen Plain in its administrative area. In recent years, the state has attached importance to the protection of Songnen Plain, which may be related to the promulgation of relevant national protection policies. The Chifeng City are decreased from value III to value II. The wetland area also decreased, which may be related to the degradation of the local grassland and the deterioration of the ecological environment caused by the sanding of the grassland, with the reduction in wetland resources leading to the decrease in the wetland carbon stock.

3.1.2. Analysis of Soil-Retention Changes

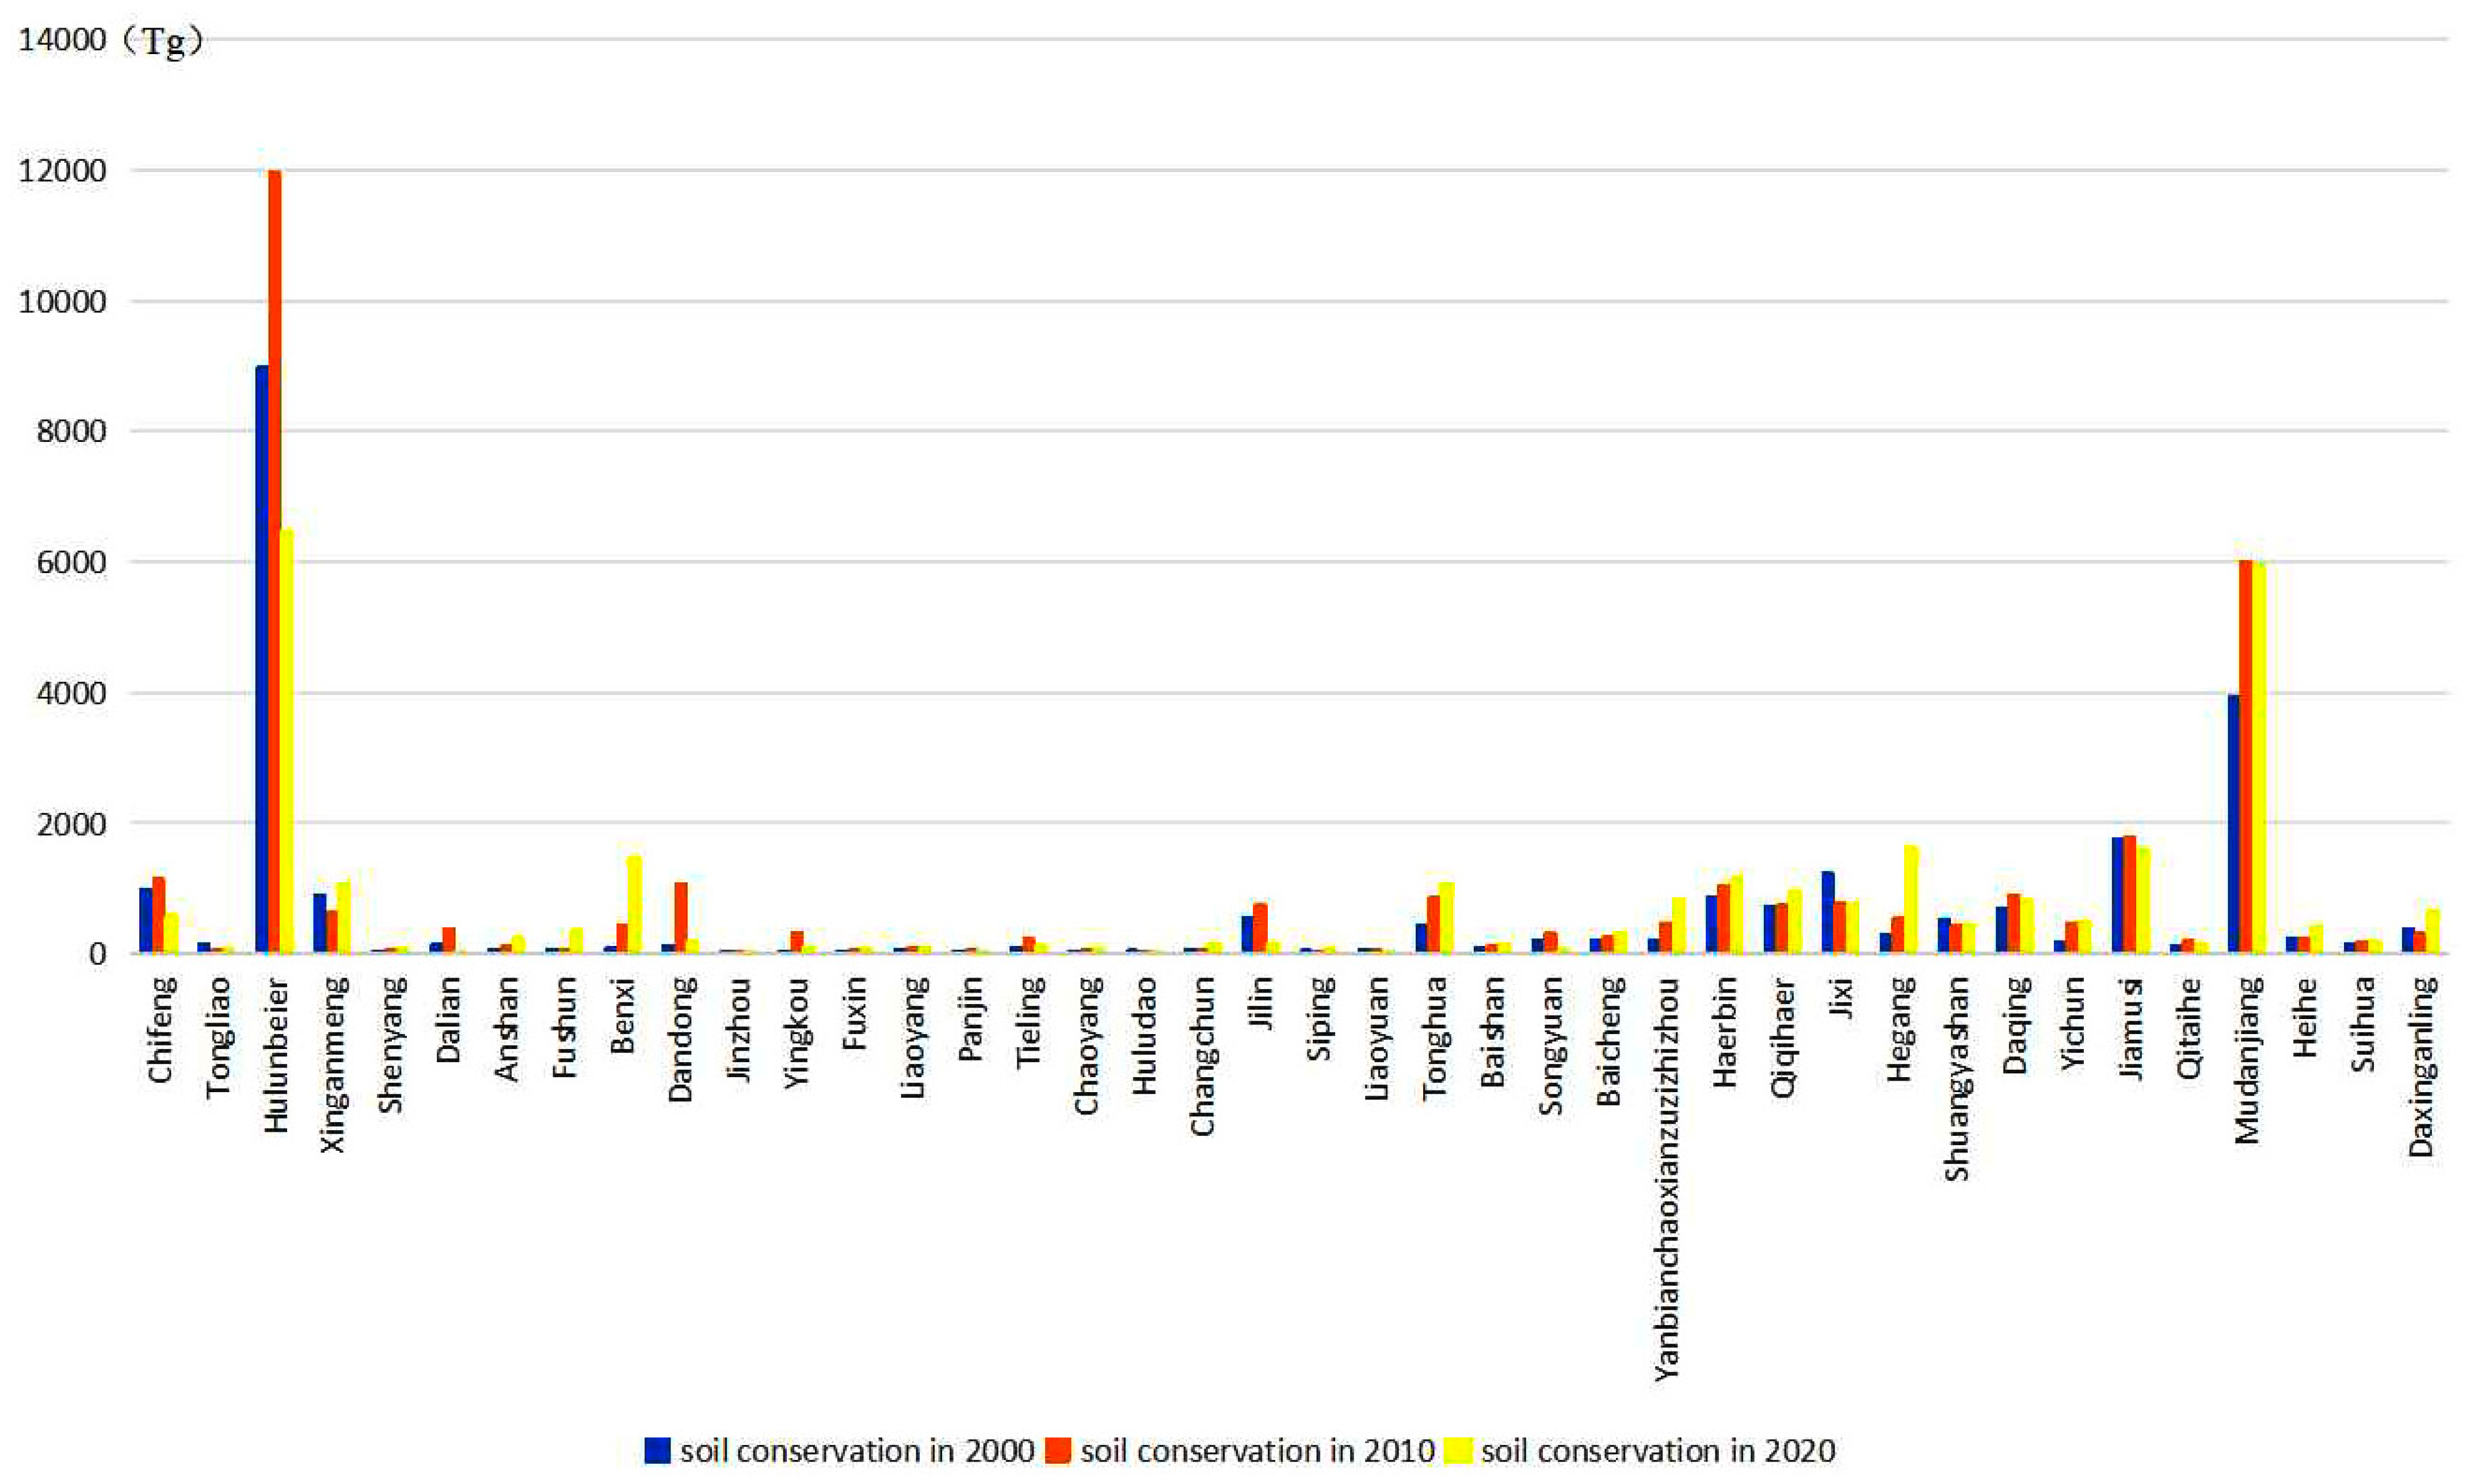
Wetland soil retention in various cities in northeast China is shown in Figure 5. The distribution of soil retention in each of the 40 prefecture-level city was obtained by using the partition statistics function of QGIS 3.32.0. The total amount of wetland soil retention in northeast China increased from 24,424 Tg in 2000 to 33,160 Tg in 2010, and decreased to 28,765 Tg in 2020. Hulunbeier city had the highest amount of wetland soil conservation, showing a trend of growth followed by a decrease. The Hulunbeier grassland is rich in grassland resources, which can reduce the infringement of rainfall and erosion on the soil and increase the water- and soil-conservation capacities. However, in recent years, there has been a phenomenon of grassland degradation in Hulunbeier, which has caused a decline in soil water and soil-conservation capacity, resulting in a decrease in soil conservation in the wetland. Mudanjiang soil retention shows an increase, and there are abundant woodland resources in the area that can regulate the climate, protect the soil, reduce soil erosion, and increase wetland soil retention. Jixi and Jiamusi showed a slight decrease, probably because the local wetland resources were encroached by cultivated land, decreasing wetland resources and soil retention.
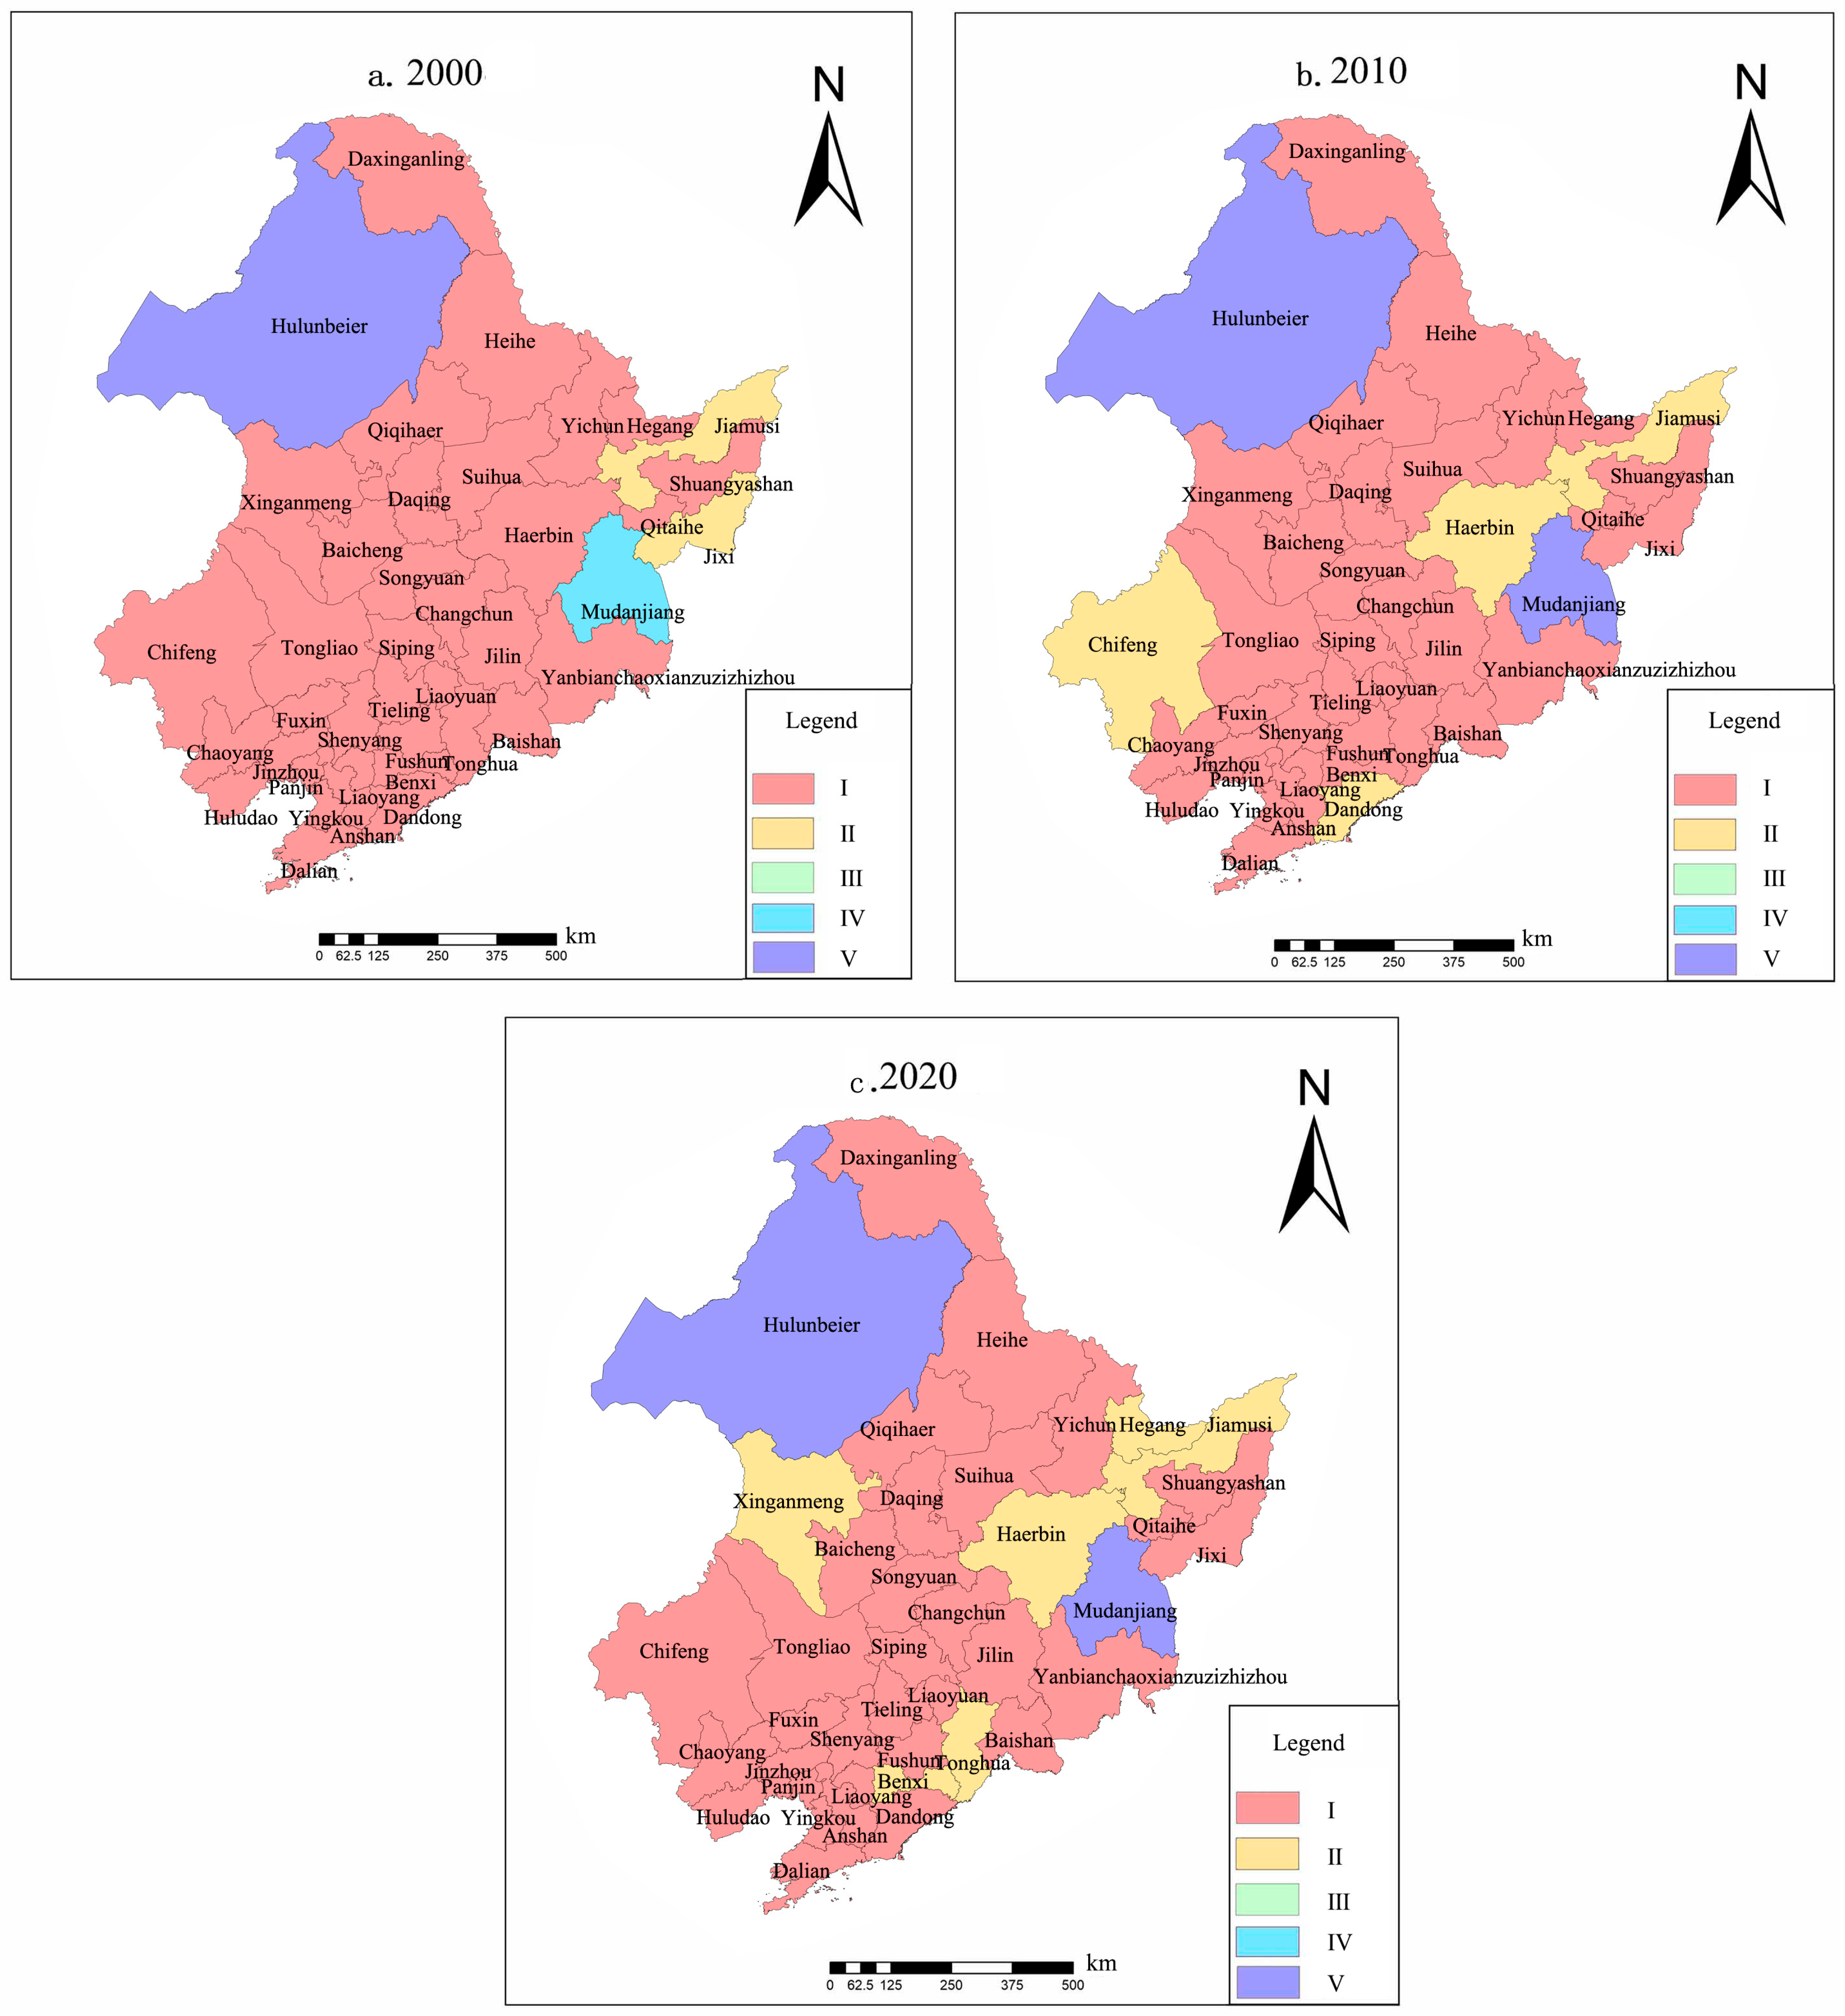
The soil retention of wetlands in 40 municipalities in northeast China is functionally graded and divided into five standards: I, II, III, IV, and V, as shown in Table 7. As shown in Figure 6, from 2000 to 2020, 80% to 90% of the areas in northeast China were classified as having soil retention of I. The number of prefectural-level municipalities included in these level I areas is gradually decreasing from 36 to 32, mainly Yingkou, Dalian, Benxi, and Yichun cities in Liaoning Province where local woodland resources are more abundant. These four areas show increasing soil retention, which may be caused by the increase in woodland resources. Of the remaining areas, 5–15% had a soil retention of value II, with 2 to 6 municipalities having been converted from value I; 2.5–5% had a value of V, and included Peony, Heilongjiang Province, as one of the most important areas. The areas in which Mudanjiang City in Heilongjiang Province were transformed from high to higher soil conservation are related to the rich woodland resources in the area.

3.1.3. Analysis of Temporal and Spatial Changes in Habitat Quality

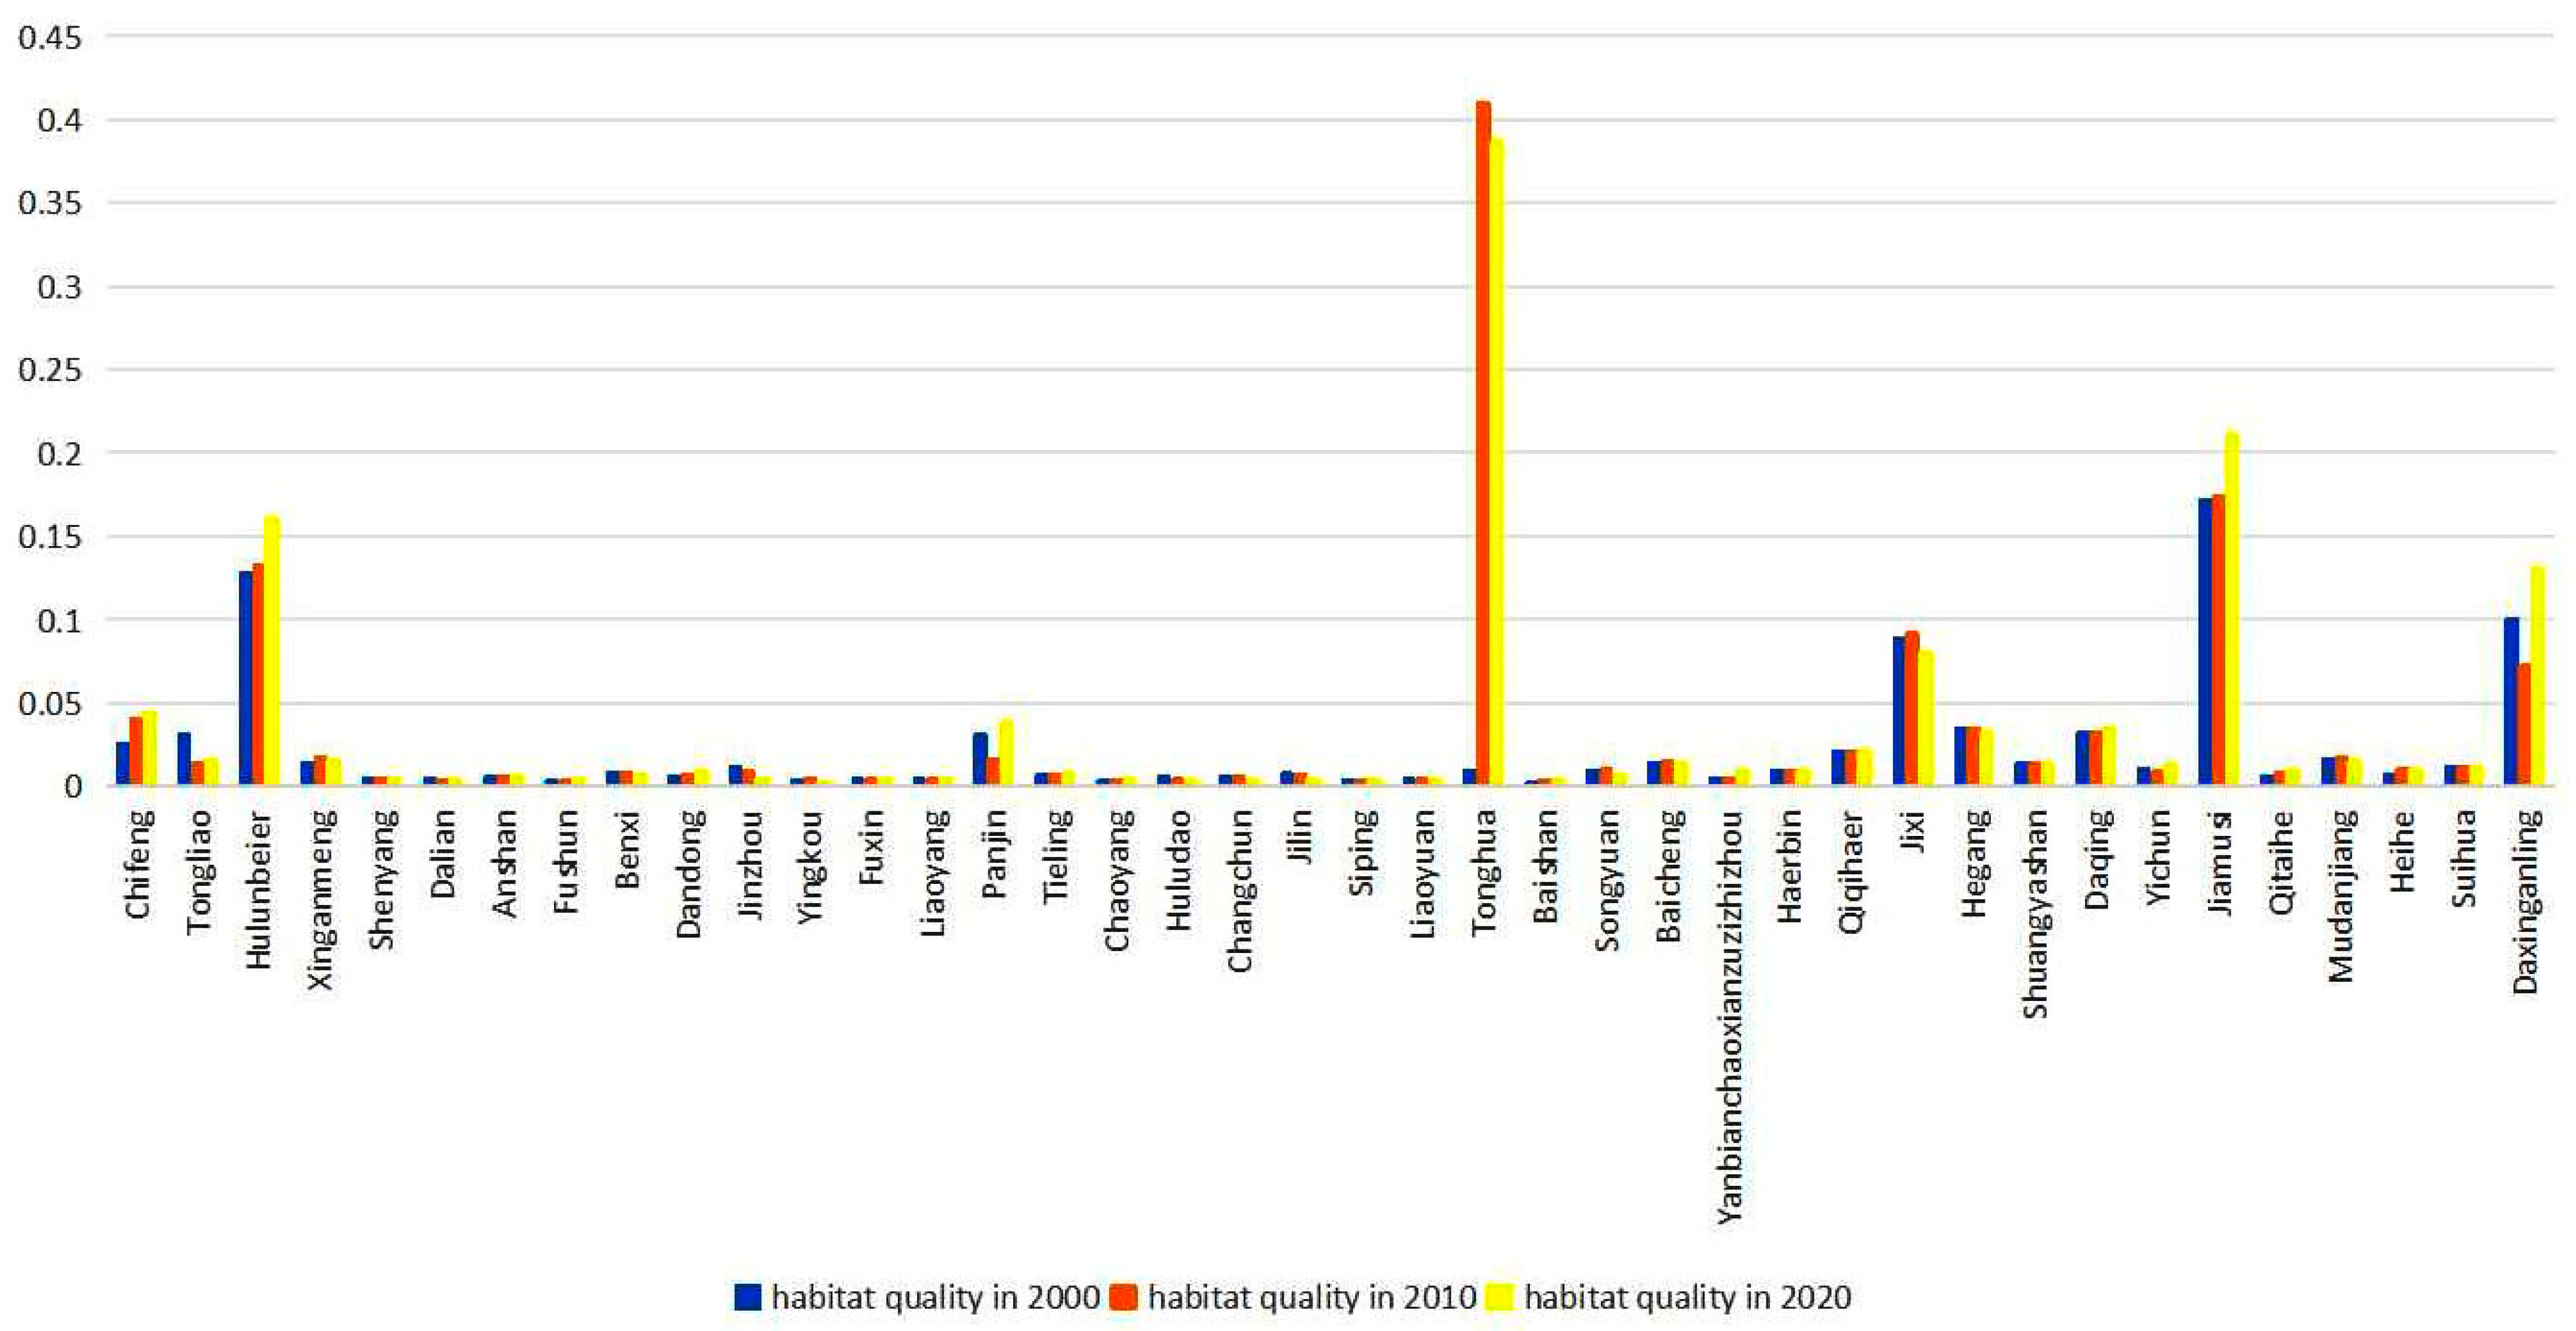
Changes in wetland habitat quality in the northeast region are shown in Figure 7. Using the partition statistics function of QGIS3.32.0, the partition statistics were conducted for 40 prefecture-level cities, and the distribution of mean habitat quality in each prefecture-level city was derived. Among them, Jiamusi City has the highest wetland habitat quality, showing an increasing trend. The Sanjiang Plain within Jiamusi City has rich biological resources and fewer local sources of habitat threats. The Sanjiang Plain is also an important breeding site for many rare and endangered waterfowls and is a major stop for a large number of migratory birds [43]. Secondly, Hulunbeier City has a high quality of wetland habitat, showing a growing trend, with rich tundra resources and abundant wetland resources. The Hulunbeier grassland in the region also has a good ecological environment and a high quality of habitat. Songyuan City and Baicheng City show a decreasing trend in wetland habitat quality. These two prefecture-level cities are located in the western part of Jilin Province, where grassland degradation is more serious, causing a decrease in biological resources and leading to a decrease in local habitat quality and a decline in wetland habitat quality. Panjin City shows a trend of decreasing and then increasing; the Liao River system, including Erlong Lake, which is located in the East Liao River system in northeast China, had particularly serious water-quality pollution from 2000 to 2010. The water quality of each monitoring point has remained in the poor (V) category since the monitoring in 2002 due to the pollution, and the local biological resources have decreased, which led to the decrease in the quality of the wetland habitat. After strengthening management and protection from 2010 to 2020, the habitat quality gradually rebounded to its previous state.
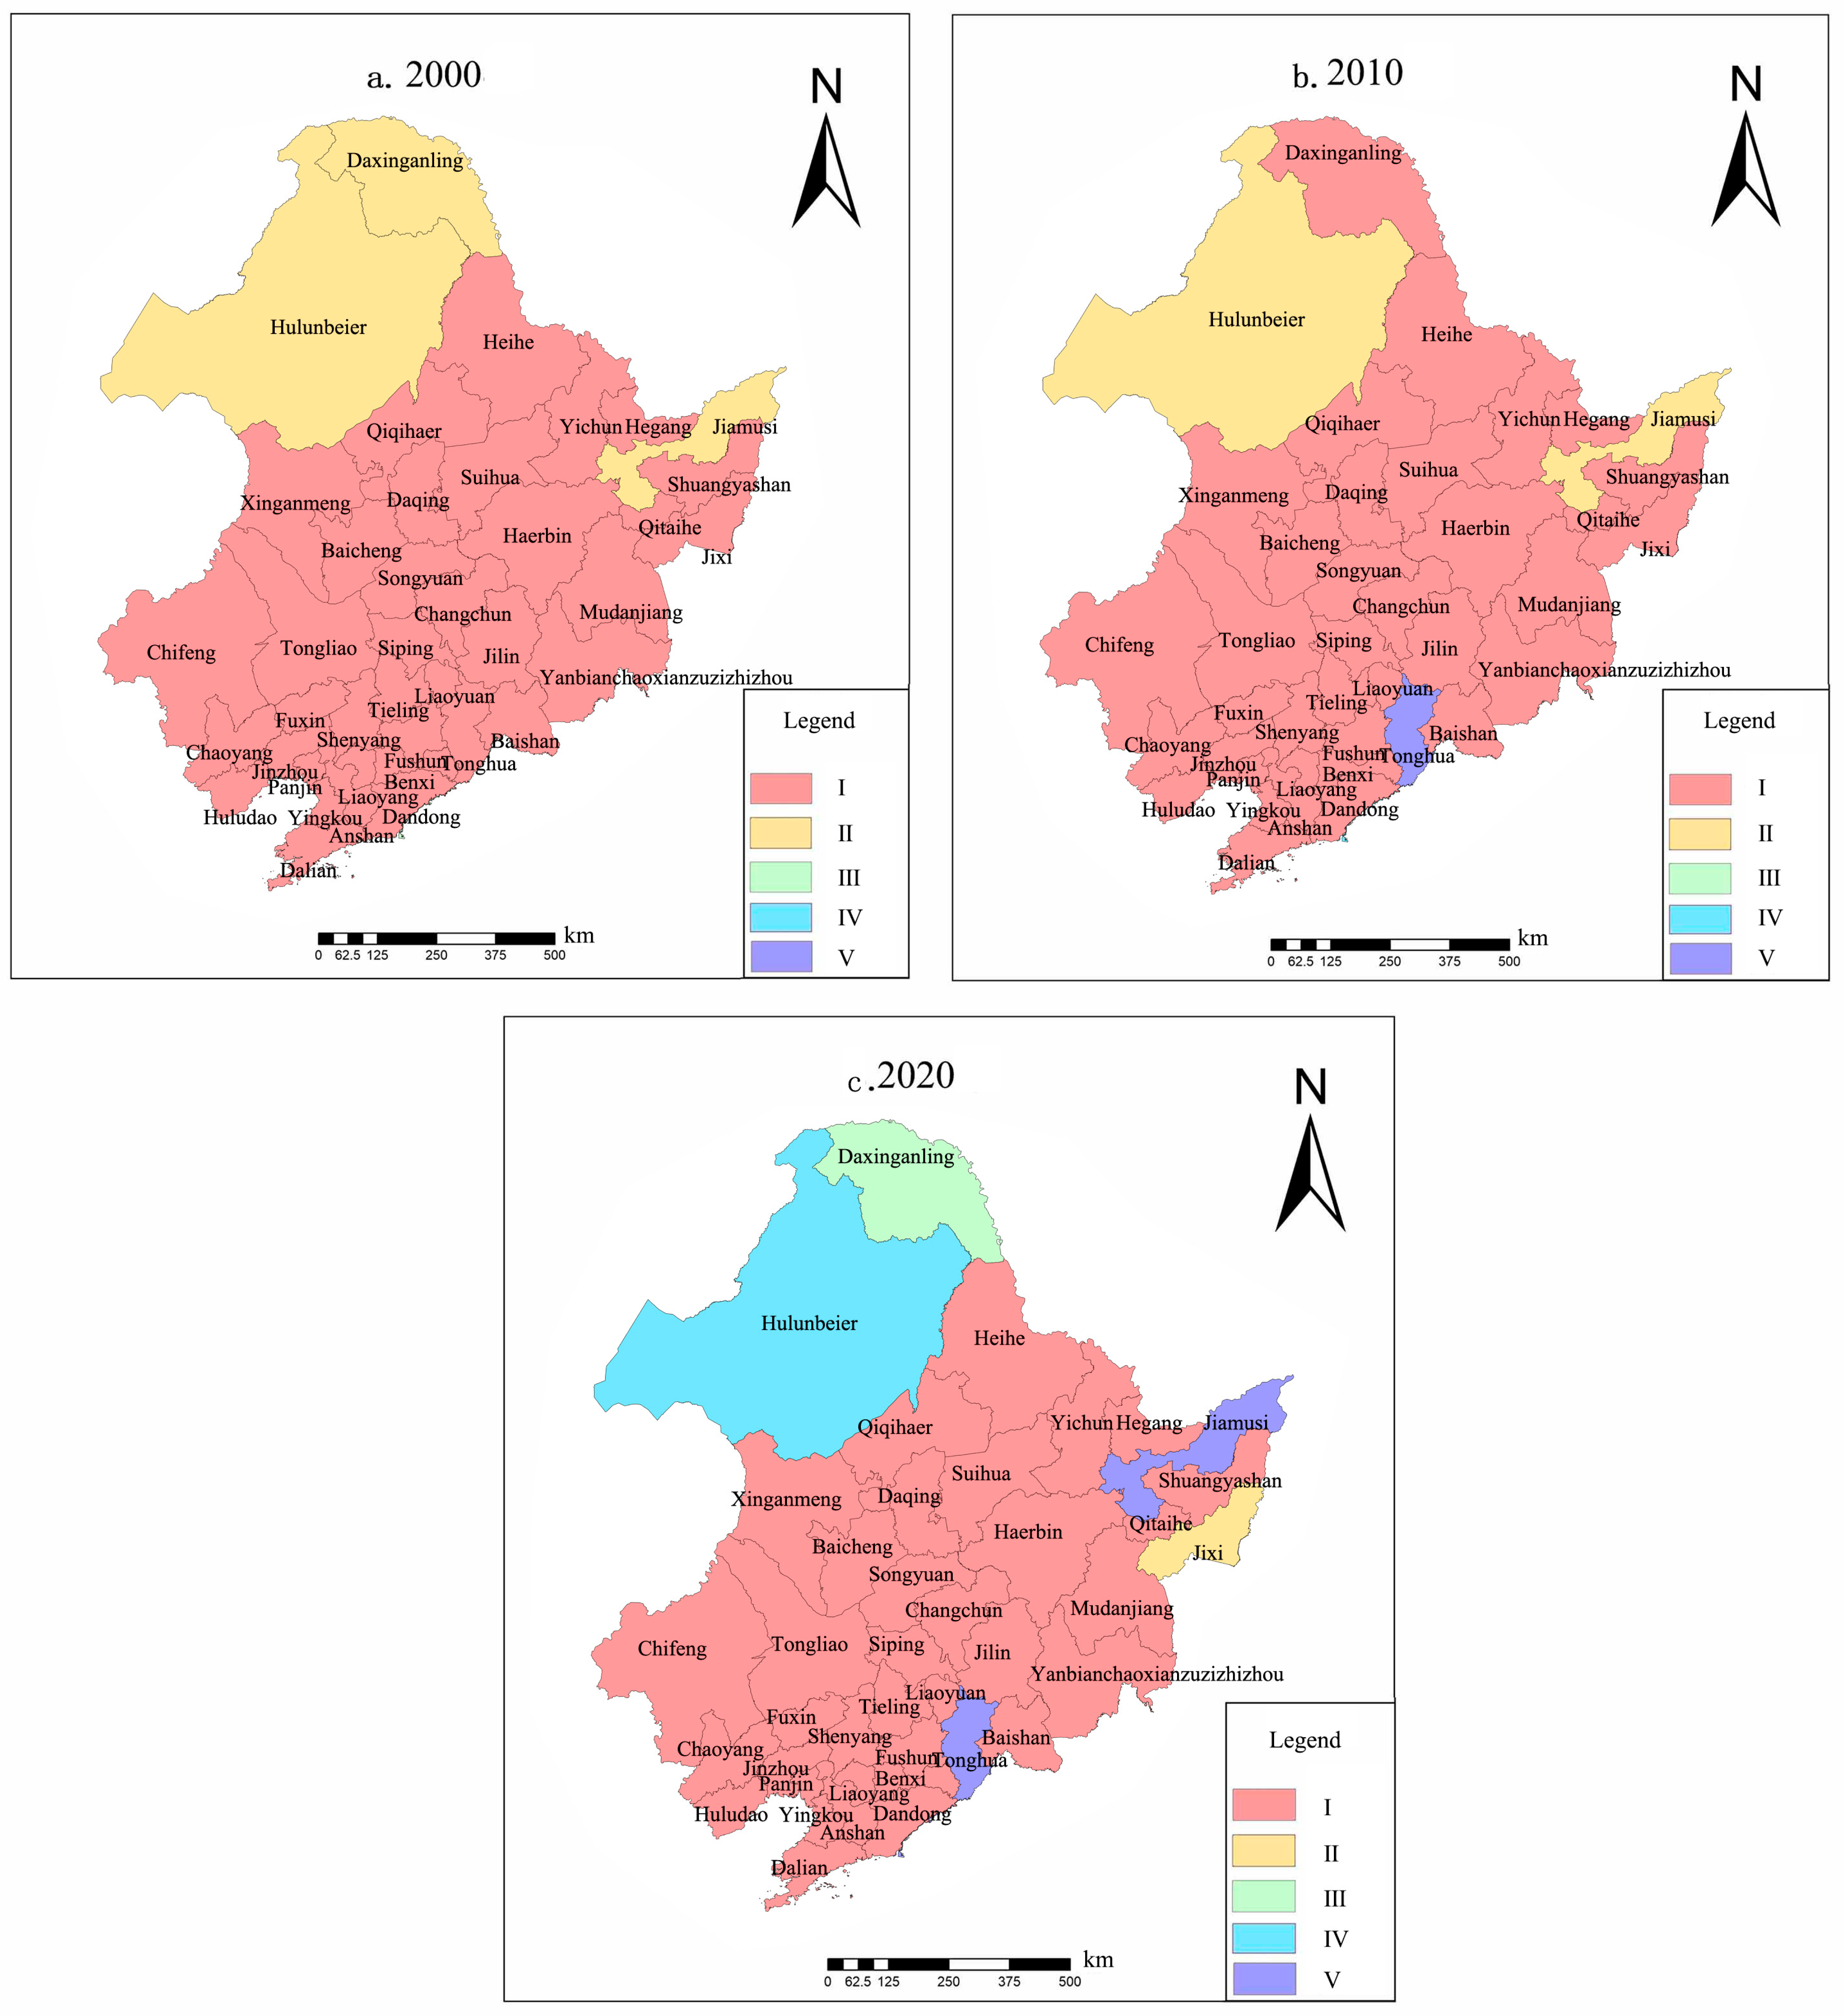
The ArcGIS natural breakpoint method was used to classify the functional value F of wetland habitat quality in northeast China, which was divided into five grades, namely I, II, III, IV, and V, as shown in Table 8. As shown in Figure 8, from 2000 to 2020, 90–92.5% of the area in northeast China was classified as having a habitat quality of I; about 2.5–7.5% had a habitat quality of II; about 0–2.5% had a habitat quality of III; about 0–2.5% had a habitat quality of IV; and about 2.5–5% had a habitat quality of V. Habitat quality I areas decreased from 37 prefectural-level cities to 36, mainly in the Inner Mongolia Autonomous Region of Hulunbeier City and Heilongjiang Province in the Daxinganling region. Hulunbeier City, rich in grass resources, has a good ecological environment; the Daxinganling region has a wealth of woodland resources and biological resources, and the quality of the habitat is higher. Because of the complex topography of the region, the transportation is inconvenient, and there is less interference due to human activities. Tonghua City, Jilin Province, was transformed from a habitat quality V area to a habitat quality I area, and this paper calculates the average value of the regional habitat quality. Tonghua City has rich woodland resources within the city, and at the same time has a forest protection zone, so the local habitat quality is higher. There is a forest park in the local area, and the development of the tourism industry has driven the development of the surrounding transportation and residential land, which has led to the decline in wetland habitat quality.

3.2. Analysis of Driving Factors of Ecosystem Service Function Change

3.2.1. Changes in Wetlands Cause Changes in Wetland Ecosystem Service Functions

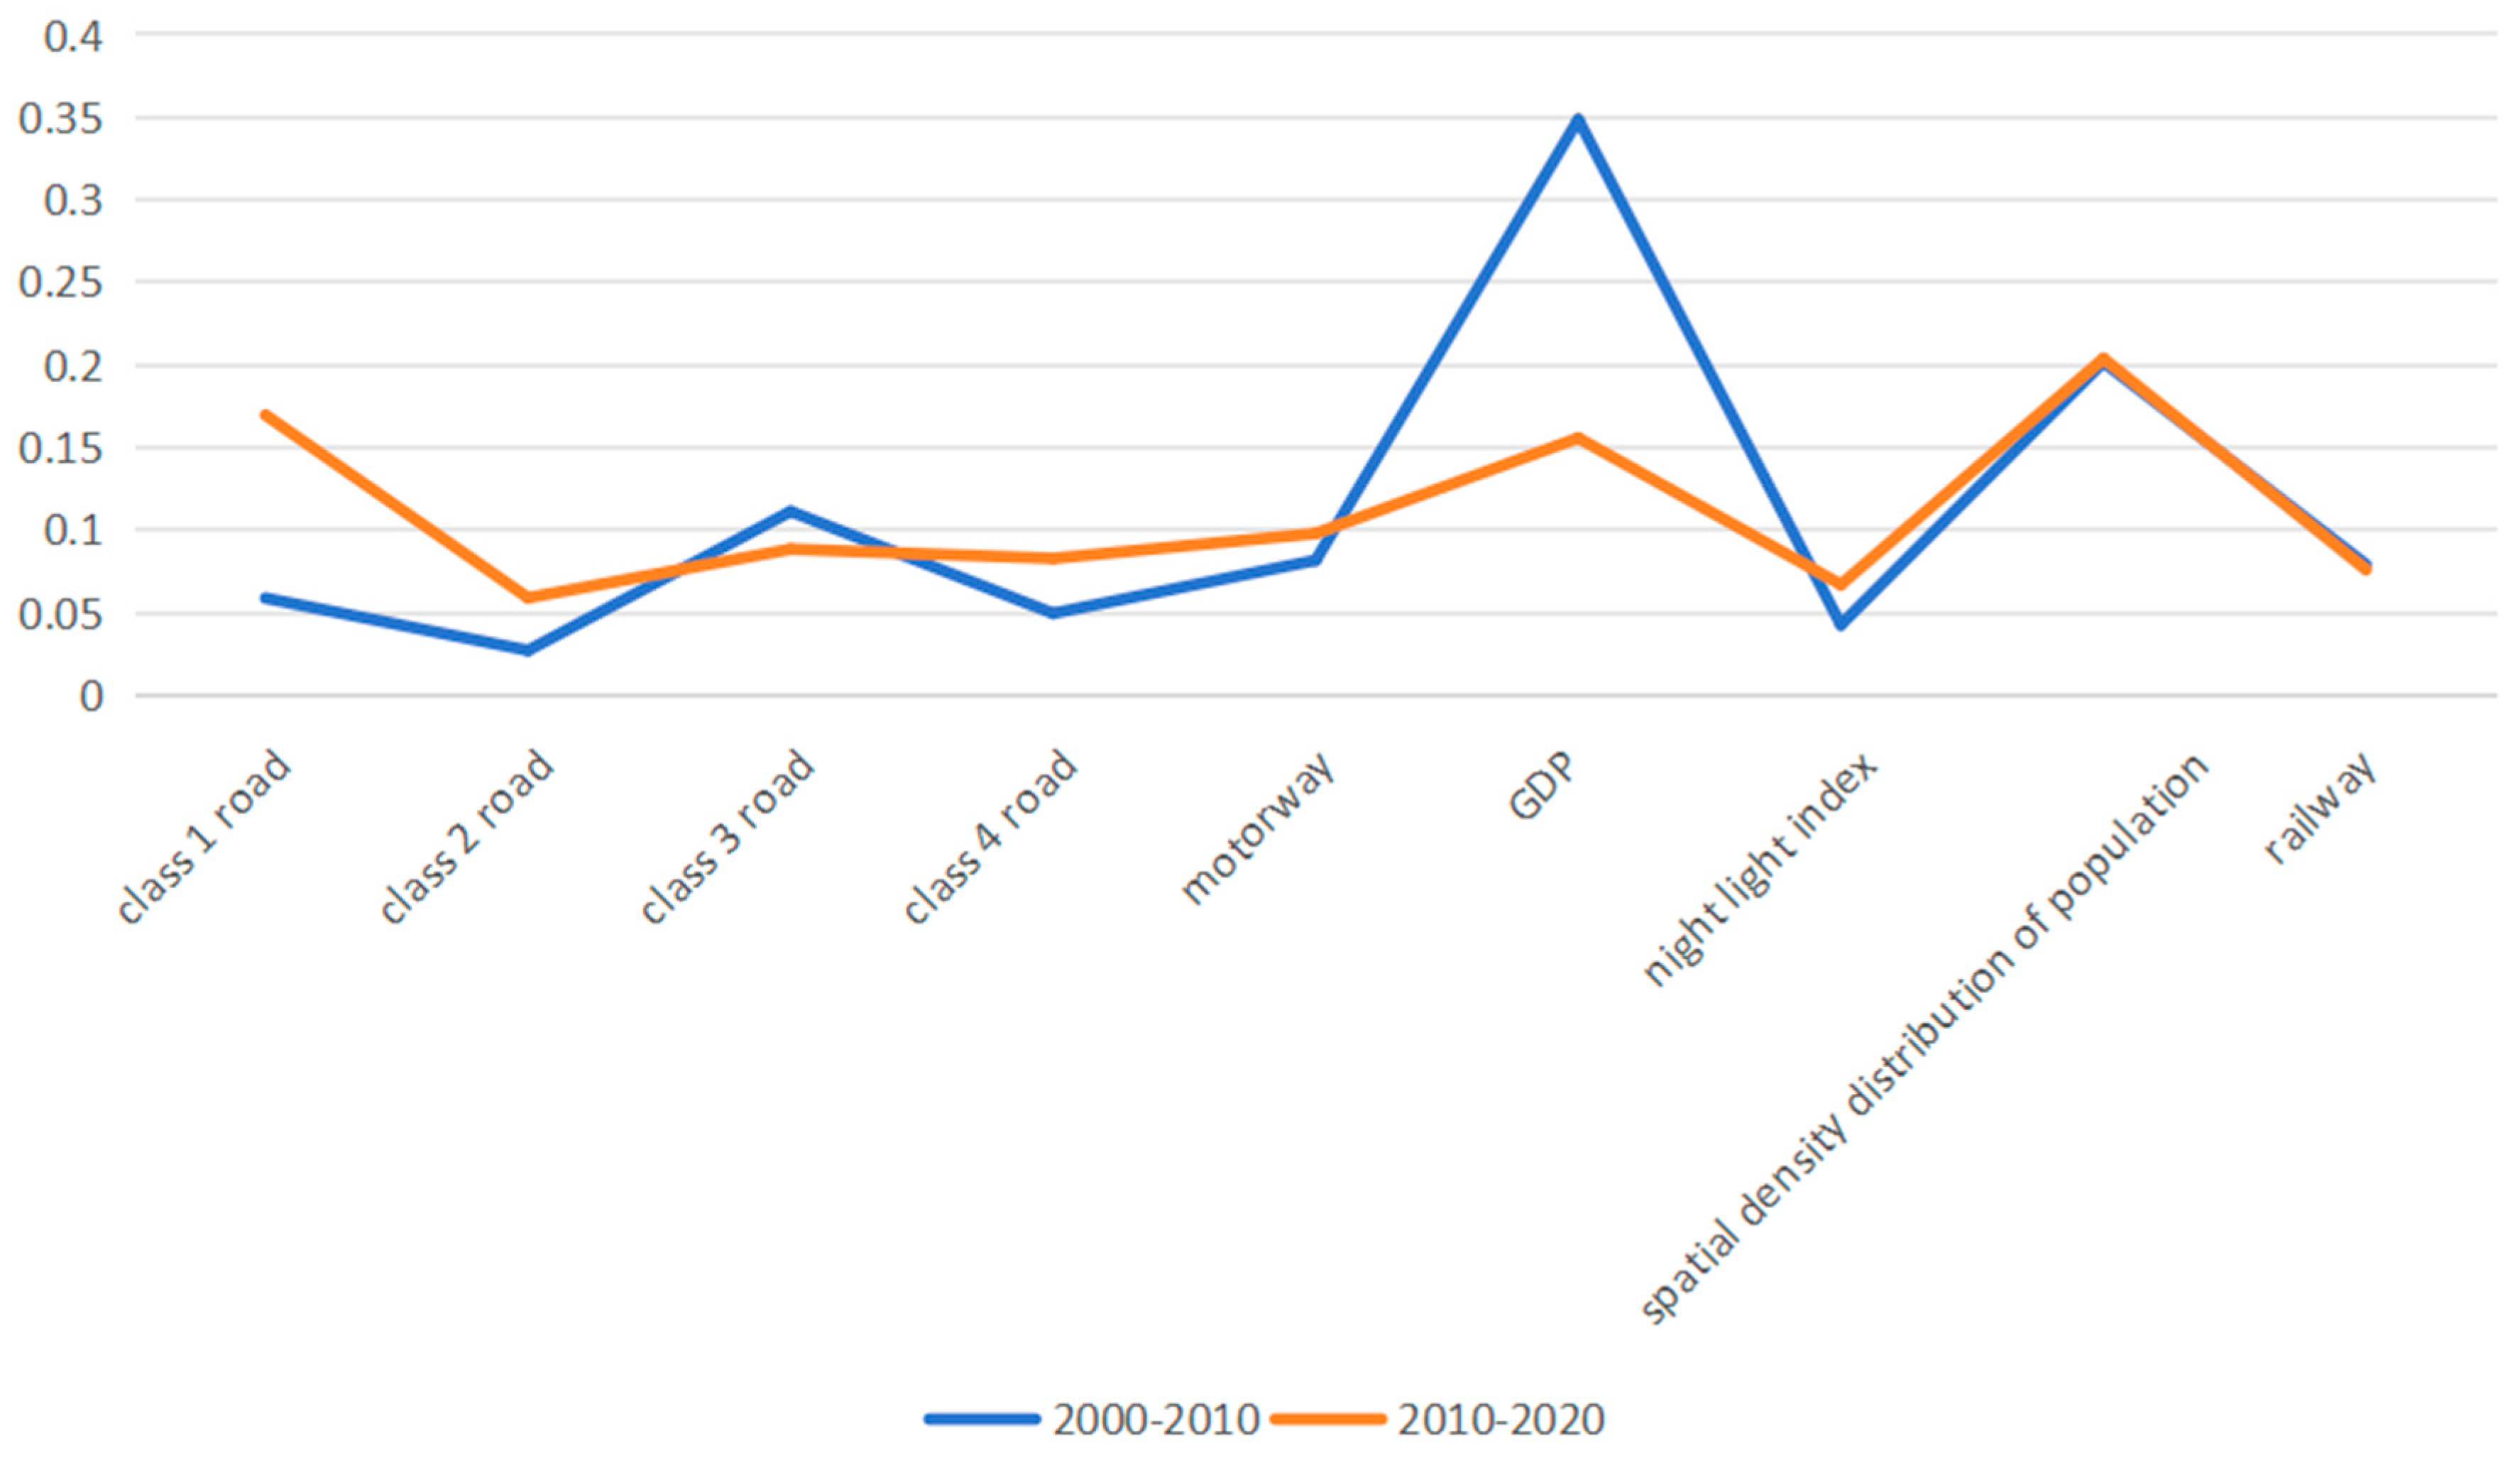
As shown in Figure 9, The wetland area showed a decreasing trend during these 20 years, and according to the results of PLUS modeling, the contribution of social drivers to the wetland change was obtained. GDP had the highest degree of influence on wetlands among the drivers of social activities from 2000 to 2010, with a contribution of 34.81%, followed by spatial density of the population, with a contribution of 20.15%. With the increase in GDP and spatial density of population, the destruction and pollution of wetlands by human activities has become more and more serious. In order to expand urban areas or build infrastructure, people may fill lakes or reclaim wetlands, which will lead to the reduction in wetland area and the destruction of ecosystems [43]. Behaviors such as overfishing, overfarming, and overexploitation of wetland resources will lead to a decrease in wetland biodiversity and an imbalance of the ecosystem. The rapid development of urbanization from 2010 to 2020 increased the intensity of primary road construction, which usually requires the occupation of a large amount of land. It may lead to a decrease in the area of wetlands, and then destroy their ecosystems. The contribution of the GDP is 15.56 percent, the contribution of the night-lighting index is 6.7 percent, and the contribution of population spatial density is 20.37 percent. The contribution of population spatial density was the largest; as population spatial density increases, human activities increase, and the direct human utilization and exploitation of wetlands will also increase [43].
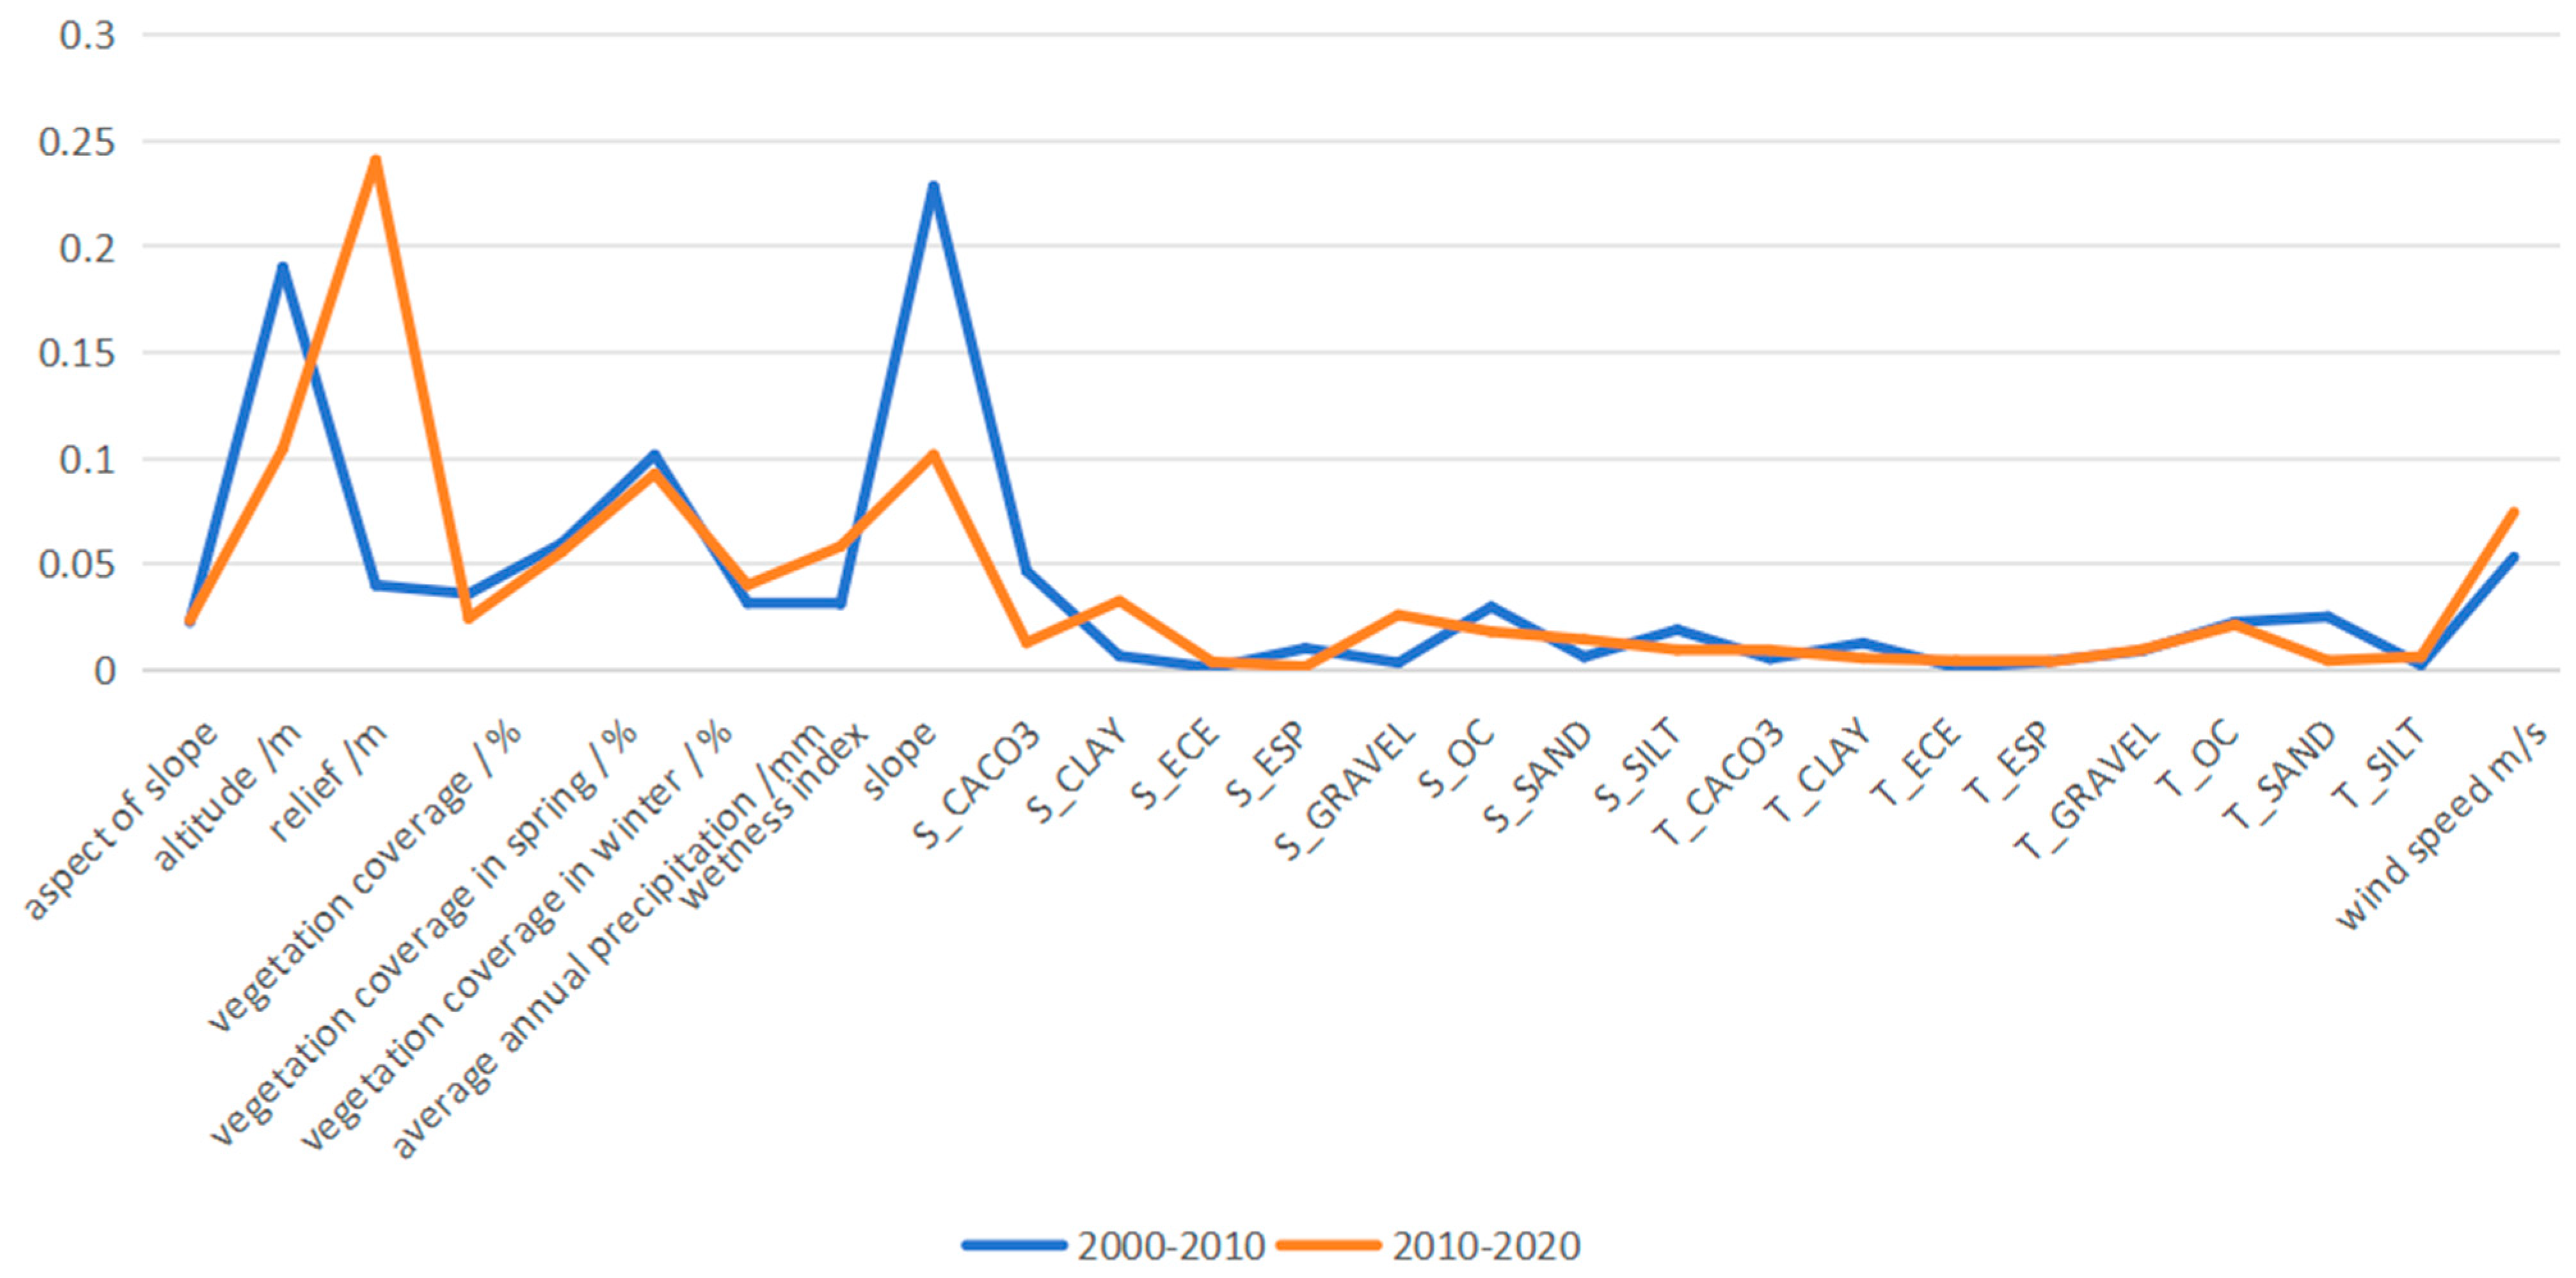
As shown in Figure 10, the contribution of natural drivers behind wetland changes in the northeast was also explored. The contribution of elevation and slope is larger in the period of 2000–2010, which are 19.03% and 22.85%, respectively. Areas with low elevation and a gentle slope are more likely to be affected by human activities, and thus wetland agrarianization occurs. The contribution of topographic relief was the largest during the period 2010–2020, which is 24.09%. Areas with low-lying topography are more likely to form wetlands, while areas with high topographic relief may not be conducive to the formation and expansion of wetlands, and may be more susceptible to natural disasters (e.g., flooding, mudslides, etc.), which may lead to the instability of wetlands. The subsoil clay component contributes the most to the soil factor, and the contribution of the subsoil clay component is 3.26%. Clay has a strong water-holding capacity, which helps the wetland to retain water. In addition, clay can adsorb and retain a large amount of nutrients such as nitrogen, phosphorus, and potassium, which has an important effect on the productivity of the wetland ecosystem.

3.2.2. Changes in Other Land-Use Types Cause Changes in Wetland Ecosystem Service Functions

Expansion of agricultural and construction land use can cause a reduction in wetlands. Because of its varied topography, the northeastern region is subject to varying degrees of anthropogenic disturbance. Changes in forested land can also cause changes in wetlands, and a reduction in forested land can lead to a reduction in ground vegetation cover. This situation will reduce the ability of woodlands to intercept rainfall through the canopy, litter layer, and soil layer, and reduce the ability of crops to resist rain erosion and ensure the ecosystem service function of wetlands. Grassland reduction will cause changes in wetlands, degradation of alpine meadow grasslands and swampy meadows, and a serious threat of sanding. Soil sanding causes changes in plant communities and the disappearance of water accumulation in marshy wetlands, leading to degradation of wetlands, a reduction in wetland resources, and a decrease in local biodiversity, resulting in a decrease in the ecosystem service function of wetlands.

3.2.3. Changes in Wetland Ecosystem Service Functions Caused by Relevant Government Policies

In recent years, the protection of wetlands has attracted attention as people’s understanding and evaluation of the ecological value of wetlands continue to improve. The National Wetland Conservation Plan (2004–2030), approved by the State Council in 2003, proposed that more than 90% of natural wetlands would be effectively protected by 2030. These wetland-related policies have played a useful role in the protection and restoration of wetlands. In order to mitigate wetland degradation and better protect wetlands, specialized regulations, long-term mechanisms, and technical support for wetland protection should be established. Wetland compensation programs should be implemented and technologies to improve the adaptive capacity of wetlands should be developed. Some of these wetland protection projects and measures, such as the National Wetland Protection Project, the Western Jilin River and Lake Connectivity Project, the Heilongjiang Wetland Protection and Restoration Project, and the Water Source Protection Project. Based on the problems faced by wetlands in different regions, the government has formulated strategies that are in line with local development, with a view to implementing wetland ecological development for the northeastern region in the new context, which will help to realize intensive land use and stimulate the vitality of the region.

4. Discussion

4.1. Characterization of Three Ecosystem Service Functioning Assessments Using the InVEST Model

The application of the InVEST model can realize the dynamization and quantification of ecosystem service function assessment. At the same time, the modeling operation can simplify the assessment steps and is highly repeatable, which has significant advantages in the assessment and management of regional natural resources, but there are still some limitations and deficiencies in the model and data processing in the actual assessment process. The habitat quality module in the model uses the habitat quality index of the study area to characterize the current status of biodiversity, and it is believed that the higher the habitat quality index, the stronger the biodiversity function of the place, which is a certain limitation of the assessment method. Although this paper applies the diversity data of plant communities in the study area to supplement the assessment of individual biodiversity functions, because of the selection of typical community surveys, the sampling quantity is not sufficient to spatialize the diversity information, and it fails to combine the diversity data into the comprehensive assessment; in the comprehensive assessment of ecosystem service functions, the units of the three ecological service functions cannot be standardized in the quantitative outline, which makes the results of the comprehensive assessment inadequate.

4.2. Characteristics of Wetland Ecosystem Service Functions and Their Drivers in Northeastern China Compared with Other Regions

Wetland ecosystem in northeast China is a hotspot for scholars both at home and abroad. Previously, there have been researches from the mid-macro regional scale, but there are few reports on the ecosystem service function assessment of 40 prefecture-level cities in northeast China. With the economic development of northeast China, human activities have intensified, and a large area of land has been reclaimed as farmland. Unreasonable development has led to soil erosion, a decline in soil-retention function, a decrease in the area of wetlands, an increase in carbon dioxide emissions, leading to the greenhouse effect, and a reduction in the area of wetlands, resulting in the reduction in habitats and biodiversity. Carbon storage function, habitat-quality function and soil-retention function were selected to evaluate the above problems that have emerged. Compared with other regions, the northeast region is rich in permafrost resources, and this paper reflects the characteristics of the northeast region in terms of driving factors by selecting vegetation in different seasons.

5. Conclusions

Based on remote sensing and GIS technology, this paper takes the land-use/-cover data of the study area obtained by remote sensing interpretation as the research basis, combines elevation data, meteorological data, soil data, carbon pool data and other related data, and applies the InVEST model to assess the carbon stock function, habitat quality function, and soil-retention function of the wetlands of the northeast region from 2000 to 2020, and analyzes the dynamic change characteristics and the driving factors affecting wetland changes. The following are the main conclusions.
Wetland carbon stock in time Wetland carbon stock decreased from 754 Tg in 2000 to 735 Tg in 2010 and then to 688 Tg in 2020 Wetland habitat quality remained roughly the same in time. Wetland soil retention increased in time from 24,424 Tg in 2000 to 33,160 Tg in 2010 and decreased to 28,765 Tg in 2020.
Factors affecting the evolution of spatial and temporal patterns of wetland ecosystem services in the northeast can be summarized into three types: (1) changes in wetland ecosystem services caused by changes in drivers related to wetland ecosystem services, leading to changes in ecosystem service functions; (2) changes in ecosystem service functions caused by changes in other land-use types; and (3) human activities, such as the operation of the management mechanism of the wetlands and the implementation of planning programs developed by relevant departments, will have a certain impact on ecosystem services.
Author Contributions

Conceptualization: R.Q. and C.L.; Methodology: X.Z. and C.L.; Formal analysis: X.Z.; Validation: X.Z.; Data Curation: X.Z.; Writing—Original Draft: X.Z.; Writing—Review & Editing: X.Z., R.Q., C.L. and W.Z.; Project Administration: R.Q. All authors have read and agreed to the published version of the manuscript.

Funding

This research was funded by [Ruiqing Qie] grant number [20180418105FG].

Data Availability Statement

No new data were created or analyzed in this study. Data sharing is not applicable to this article.

Conflicts of Interest

The authors declare that they have no known competing financial interests or personal relationships that could have appeared to influence the work reported in this paper.

References

  1. Xu, Y.M.; Xie, Y.J.; Wu, X.D.; Xie, Y.T.; Zhang, T.Y.; Zou, Z.X.; Zhang, Z.Q. Evaluating temporal-spatial variations of wetland ecosystem service value in China during 1990–2020 from the donor side based on cosmic exergy. J. Clean Prod. 2023, 414, 137485. [Google Scholar] [CrossRef]
  2. Deng, Y.W.; Jiang, W.G.; Wu, Z.F.; Peng, K.F.; Ling, Z.Y.; Li, Z.; Wang, X.Y. Assessing and Characterizing Carbon Storage in Wetlands of the Guangdong-Hong Kong-Macau Greater Bay Area, China, during 1995–2020. IEEE J. Sel. Top. Appl. Earth Obs. Remote Sens. 2022, 15, 6110–6120. [Google Scholar] [CrossRef]
  3. Guswa, A.J.; Brauman, K.A.; Brown, C.; Hamel, P.; Keeler, B.L.; Sayre, S.S. Ecosystem services: Challenges and opportunities for hydrologic modeling to support decision making. Water Resour. Res. 2014, 50, 4535–4544. [Google Scholar] [CrossRef]
  4. Ferraz, S.F.B.; Ferraz, K.; Cassiano, C.C.; Brancalion, P.H.S.; da Luz, D.T.A.; Azevedo, T.N.; Metzger, J.P. How good are tropical forest patches for ecosystem services provisioning? Landsc. Ecol. 2014, 29, 187–200. [Google Scholar] [CrossRef]
  5. Galford, G.L.; Melillo, J.; Mustard, J.F.; Cerri, C.E.P.; Cerri, C.C. The Amazon Frontier of Land-Use Change: Croplands and Consequences for Greenhouse Gas Emissions. Earth Interact. 2010, 14, 1–24. [Google Scholar] [CrossRef]
  6. Nóbrega, R.L.B.; Ziembowicz, T.; Torres, G.N.; Guzha, A.C.; Amorim, R.S.S.; Cardoso, D.; Gerold, G. Ecosystem services of a functionally diverse riparian zone in the Amazon-Cerrado agricultural frontier. Glob. Ecol. Conserv. 2020, 21, e00819. [Google Scholar] [CrossRef]
  7. Pearson, T.R.H.; Brown, S.; Murray, L.; Sidman, G. Greenhouse gas emissions from tropical forest degradation: An underestimated source. Carbon Balance Manag. 2017, 12, 3. [Google Scholar] [CrossRef]
  8. Tyukavina, A.; Baccini, A.; Hansen, M.C.; Potapov, P.V.; Stehman, S.V.; Houghton, R.A.; Goetz, S.J. Aboveground carbon loss in natural and managed tropical forests from 2000 to 2012. Environ. Res. Lett. 2018, 13, 074002. [Google Scholar] [CrossRef]
  9. Garrett, R.D.; Koh, I.; Lambin, E.F.; de Waroux, Y.L.; Kastens, J.H.; Brown, J.C. Intensification in agriculture-forest frontiers: Land use responses to development and conservation policies in Brazil. Glob. Environ. Change Hum. Policy Dimens. 2018, 53, 233–243. [Google Scholar] [CrossRef]
  10. Pasion, B.O.; Barrias, C.D.P.; Asuncion, M.P.; Angadol, A.H.; Pabiling, R.R.; Pasion, A., Jr.; Baysa, A.M., Jr. Assessing tree diversity and carbon density of a riparian zone within a protected area in southern Philippines. J. Asia-Pac. Biodivers. 2021, 14, 78–86. [Google Scholar] [CrossRef]
  11. Gratani, L.; Varone, L.; Bonito, A. Carbon sequestration of four urban parks in Rome. Urban For. Urban Green. 2016, 19, 184–193. [Google Scholar] [CrossRef]
  12. Zarin, D.J.; Harris, N.L.; Baccini, A.; Aksenov, D.; Hansen, M.C.; Azevedo-Ramos, C.; Tyukavina, A. Can carbon emissions from tropical deforestation drop by 50% in 5years? Glob. Change Biol. 2016, 22, 1336–1347. [Google Scholar] [CrossRef] [PubMed]
  13. Boyd, J.; Banzhaf, S. What are ecosystem services? The need for standardized environmental accounting units. Ecol. Econ. 2007, 63, 616–626. [Google Scholar] [CrossRef]
  14. Othoniel, B.; Rugani, B.; Heijungs, R.; Beyer, M.; Machwitz, M.; Post, P. An improved life cycle impact assessment principle for assessing the impact of land use on ecosystem services. Sci. Total Environ. 2019, 693, 133374. [Google Scholar] [CrossRef] [PubMed]
  15. Zhang, D.; Zheng, H.F.; Ren, Z.B.; Zhai, C.; Shen, G.Q.; Mao, Z.X.; He, X.Y. Effects of forest type and urbanization on carbon storage of urban forests in Changchun, Northeast China. Chin. Geogr. Sci. 2015, 25, 147–158. [Google Scholar] [CrossRef]
  16. Tang, L.P.; Ke, X.L.; Zhou, T.; Zheng, W.W.; Wang, L.Y. Impacts of cropland expansion on carbon storage: A case study in Hubei, China. J. Environ. Manag. 2020, 265, 110515. [Google Scholar] [CrossRef] [PubMed]
  17. Guo, W.; Teng, Y.J.; Yan, Y.G.; Zhao, C.W.; Zhang, W.Q.; Ji, X.L. Simulation of Land Use and Carbon Storage Evolution in Multi-Scenario: A Case Study in Beijing-Tianjin-Hebei Urban Agglomeration, China. Sustainability 2022, 14, 13436. [Google Scholar] [CrossRef]
  18. Xiao, D.R.; Deng, L.; Kim, D.G.; Huang, C.B.; Tian, K. Carbon budgets of wetland ecosystems in China. Glob. Change Biol. 2019, 25, 2061–2076. [Google Scholar] [CrossRef]
  19. Xian, J.L.; Xia, C.Q.; Cao, S.X. Cost-benefit analysis for China’s Grain for Green Program. Ecol. Eng. 2020, 151, 105850. [Google Scholar] [CrossRef]
  20. Shi, M.J.; Wu, H.Q.; Fan, X.; Jia, H.T.; Dong, T.; He, P.X.; Jiang, P.G. Trade-Offs and Synergies of Multiple Ecosystem Services for Different Land Use Scenarios in the Yili River Valley, China. Sustainability 2021, 13, 1577. [Google Scholar] [CrossRef]
  21. Sahana, M.; Hong, H.Y.; Sajjad, H.; Liu, J.Z.; Zhu, A.X. Assessing deforestation susceptibility to forest ecosystem in Rudraprayag district, India using fragmentation approach and frequency ratio model. Sci. Total Environ. 2018, 627, 1264–1275. [Google Scholar] [CrossRef]
  22. Sahana, M.; Hong, H.Y.; Sajjad, H. Analyzing urban spatial patterns and trend of urban growth using urban sprawl matrix: A study on Kolkata urban agglomeration, India. Sci. Total Environ. 2018, 628–629, 1557–1566. [Google Scholar] [CrossRef]
  23. Zhao, M.M.; He, Z.B.; Du, J.; Chen, L.F.; Lin, P.F.; Fang, S. Assessing the effects of ecological engineering on carbon storage by linking the CA-Markov and InVEST models. Ecol. Indic. 2019, 98, 29–38. [Google Scholar] [CrossRef]
  24. Wang, N.F.; Chen, X.P.; Zhang, Z.L.; Pang, J.X. Spatiotemporal dynamics and driving factors of county-level carbon storage in the Loess Plateau: A case study in Qingcheng County, China. Ecol. Indic. 2022, 144, 109460. [Google Scholar] [CrossRef]
  25. Babbar, D.; Areendran, G.; Sahana, M.; Sarma, K.; Raj, K.; Sivadas, A. Assessment and prediction of carbon sequestration using Markov chain and InVEST model in Sariska Tiger Reserve, India. J. Clean. Prod. 2021, 278, 123333. [Google Scholar] [CrossRef]
  26. Kucsicsa, G.; Popovici, E.A.; Balteanu, D.; Grigorescu, I.; Dumitrascu, M.; Mitrica, B. Future land use/cover changes in Romania: Regional simulations based on CLUE-S model and CORINE land cover database. Landsc. Ecol. Eng. 2019, 15, 75–90. [Google Scholar] [CrossRef]
  27. Waiyasusri, K.; Yumuang, S.; Chotpantarat, S. Monitoring and predicting land use changes in the Huai Thap Salao Watershed area, Uthaithani Province, Thailand, using the CLUE-s model. Environ. Earth Sci. 2016, 75, 1–16. [Google Scholar] [CrossRef]
  28. Fox, J.; Vogler, J.B.; Sen, O.L.; Giambelluca, T.W.; Ziegler, A.D. Simulating Land-Cover Change in Montane Mainland Southeast Asia. Environ. Manag. 2012, 49, 968–979. [Google Scholar] [CrossRef]
  29. Minji, P.; Geun-ae, P.; Lee, Y.-j.; Kim, S. Application of the Modified CA-Markov Technique for Future Prediction of Forest Land Cover in a Mountainous Watershed. J. Korean Soc. Agric. Eng. 2010, 52, 61–68. [Google Scholar]
  30. Tariq, A.; Yan, J.G.; Mumtaz, F. Land change modeler and CA-Markov chain analysis for land use land cover change using satellite data of Peshawar, Pakistan. Phys. Chem. Earth 2022, 128, 103286. [Google Scholar] [CrossRef]
  31. Li, X.; Liu, Z.S.; Li, S.J.; Li, Y.X. Multi-Scenario Simulation Analysis of Land Use Impacts on Habitat Quality in Tianjin Based on the PLUS Model Coupled with the InVEST Model. Sustainability 2022, 14, 6923. [Google Scholar] [CrossRef]
  32. Wang, R.Y.; Cai, H.A.; Chen, L.K.; Li, T.H. Spatiotemporal Evolution and Multi-Scenario Prediction of Carbon Storage in the GBA Based on PLUS-InVEST Models. Sustainability 2023, 15, 8421. [Google Scholar] [CrossRef]
  33. Yu, X.F.; Ding, S.S.; Zou, Y.C.; Xue, Z.S.; Lyu, X.G.; Wang, G.P. Review of Rapid Transformation of Floodplain Wetlands in Northeast China: Roles of Human Development and Global Environmental Change. Chin. Geogr. Sci. 2018, 28, 654–664. [Google Scholar] [CrossRef]
  34. Wang, G.P.; Zhai, Z.L.; Liu, J.S.; Wang, J.D. Forms and profile distribution of soil phosphorus in four wetlands across gradients of sand desertification in Northeast China. Geoderma 2008, 145, 50–59. [Google Scholar] [CrossRef]
  35. Ren, Y.X.; Li, X.Y.; Mao, D.H.; Xi, Y.B.; Wang, Z.M. Northeast China holds huge wetland soil organic carbon storage: An estimation from 819 soil profiles and random forest algorithm. Plant Soil 2023, 490, 469–483. [Google Scholar] [CrossRef]
  36. Pechanec, V.; Purkyt, J.; Benc, A.; Nwaogu, C.; Sterbová, L.; Cudlín, P. Modelling of the carbon sequestration and its prediction under climate change. Ecol. Inform. 2018, 47, 50–54. [Google Scholar] [CrossRef]
  37. Liu, S. Wetland Ecosystem Services Evalution Based on the InVEST Model; Harbin Normal University: Harbin, China, 2019. [Google Scholar]
  38. Zhou, L.L. Evaluation and multi-scenario simulation of wetland ecosystem services in the upper Yangtze River. Land 2020, 13, 844. [Google Scholar] [CrossRef]
  39. Wu, L.L.; Sun, C.G.; Fan, F.L. Estimating the Characteristic Spatiotemporal Variation in Habitat Quality Using the InVEST Model—A Case Study from Guangdong-Hong Kong-Macao Greater Bay Area. Remote Sens. 2021, 13, 1008. [Google Scholar] [CrossRef]
  40. Liu, X.P.; Liang, X.; Li, X.; Xu, X.C.; Ou, J.P.; Chen, Y.M.; Pei, F.S. A future land use simulation model (FLUS) for simulating multiple land use scenarios by coupling human and natural effects. Landsc. Urban Plan. 2017, 168, 94–116. [Google Scholar] [CrossRef]
  41. Chen, Y.H.; Wang, J.; Xiong, N.N.; Sun, L.; Xu, J.Q. Impacts of Land Use Changes on Net Primary Productivity in Urban Agglomerations under Multi-Scenarios Simulation. Remote Sens. 2022, 14, 1755. [Google Scholar] [CrossRef]
  42. Zhi, L.H.; Li, X.; Ma, T.T.; Xie, X.; Li, X.W.; Wu, J.W.; Bai, J.H.; Cui, B.S. The spatiotemporal evolution of land use trajectories, drivers and the ecosystem services in Liao River Delta in the past four decades. Acta Sci. Circumst. 2022, 42, 141–150. [Google Scholar]
  43. Mao, D.H.; Wang, Z.M.; Luo, L.; Ren, C.Y.; Jia, M.M. Monitoring the Evolution of Wetland Ecosystem Pattern in Northeast China from 1990 to 2013 Based on Remote Sensing. J. Nat. Resour. 2016, 31, 1253–1263. [Google Scholar]
Figure 1. Location map of northeast China.
Water 16 02153 g001
Figure 2. Wetland distribution map of northeast China.
Water 16 02153 g002
Figure 3. Temporal variation in wetland carbon storage.
Water 16 02153 g003
Figure 4. Spatial distribution of wetland carbon storage.
Water 16 02153 g004
Figure 5. Temporal variations in wetland soil conservation.
Water 16 02153 g005
Figure 6. Spatial distribution of wetland soil conservation.
Water 16 02153 g006
Figure 7. Temporal variations in wetland habitat quality.
Water 16 02153 g007
Figure 8. Spatial distribution of wetland habitat quality.
Water 16 02153 g008
Figure 9. Contribution of social drivers.
Water 16 02153 g009
Figure 10. Contribution degree of natural drivers.
Water 16 02153 g010
Table 1. Carbon-pool density (Mg/ha).
Land-Use TypeC_AboveC_BelowC_SoilC_Dead
Wetland2.332.33467.590
Table 2. Biophysical information of soil conservation.
Land-Use TypeUsle_CUsle_P
Wetland10
Table 3. Influence range, weight, and attenuation mode of threat sources.
ThreatMax_DistWeightDecay
Construction land101exponential
Cultivated land80.7linear
rail30.5linear
Table 4. Habitat suitability and relative sensitivity to different threat sources.
Land-Use TypeHabitatConstruction LandCultivated LandRail
Wetland0.70.60.70.7
Table 5. Drivers.
Table 5. Drivers.
Criterion Layer Indicator Layer
Topographic factorAltitude/m
Slope
Aspect of slope
Relief/m
Natural factor


Social driver
Water factorWetness index
Average annual precipitation/mm
Wind factorWind speed m/s
Plant factorVegetation coverage/%
Vegetation coverage in winter and spring/%
Soil factorT_GRAVEL content of topsoil
S_GRAVEL subsoil gravel content
T_SAND sand content of topsoil
Sand content of S_SAND subsoil
T_SILT grade of silt
Silt grade of S_SILT subsoil
T_CLAY topsoil clay composition
S_CLAY subsoil clay composition
T_OC surface soil organic carbon
S_OC subsoil organic carbon
T_ESP surface soil alkalinity
S_ESP subsoil alkalinity
T_CACO3 calcium carbonate content in topsoil
S_CACO3 low soil calcium carbonate content
T_ECE surface soil salinity
S_ECE subsoil salinity
Population sizeSpatial density distribution of population
Night light index
Economic factorGDP
Traffic factorMotorway
Railway
Class 1 road
Class 2 road
Class 3 road
Class 4 road
Table 6. Classification of wetland carbon-storage function levels in northeast China.
F (Tg)Lv.
0 < F ≤ 5I
5 < F ≤ 15II
15 < F ≤ 45III
45 < F ≤ 60IV
60 < F ≤ 250V
Table 7. Classification of wetland soil-conservation quantity in northeast China.
F (Tg)Lv.
0 < F ≤ 1 × 10³I
1 × 10³ < F ≤ 2 × 10³II
2 × 10³ < F ≤ 3 × 10³III
3 × 10³ < F ≤ 4 × 10³IV
4 × 10³ < F ≤ 1.2 × 10⁴V
Table 8. Classification of wetland habitat quality in northeast China.
FLv.
0 < F ≤ 0.1I
0.1 < F ≤ 0.2II
0.2 < F ≤ 0.3III
0.3 < F ≤ 0.4IV
0.4 < F ≤ 1V
Disclaimer/Publisher’s Note: The statements, opinions and data contained in all publications are solely those of the individual author(s) and contributor(s) and not of MDPI and/or the editor(s). MDPI and/or the editor(s) disclaim responsibility for any injury to people or property resulting from any ideas, methods, instructions or products referred to in the content.