Abstract
Throughout its history, Papua New Guinea (PNG) has faced recurrent agricultural droughts, imposing considerable strain on both livelihoods and the economy. Particularly severe droughts have been associated with El Niño climate patterns. During these episodes, PNG becomes especially vulnerable to extended periods of aridity and diminished precipitation. Historically, humanitarian assistance for these events has primarily focused on responding to emergencies after an agricultural drought has been declared and communities have already been impacted. Here, we developed a proactive agricultural drought-triggering method for anticipatory action (AA) in PNG to offer a more sustainable and cost-effective approach to address this hazard. Our AA uses weather forecasts and risk data to identify and implement mitigative actions before a disaster occurs. The research details a step-by-step guide from early warning to action implemented by the Food and Agricultural Organization of the United Nations and the Government of Papua New Guinea. This preemptive disaster risk management initiative integrates a combined drought index (CDI) with specific thresholds and tailored anticipatory actions based on crop calendars. Moreover, the developed CDI provides a 3-month lead time for implementing AA to reduce the impact of the agricultural drought. During the El Niño-induced drought event that began in 2023, the CDI was tested and the AA was piloted for the first time.
1. Introduction
The impacts of climate change increase challenges for agriculture and water, sanitation, and hygiene (WASH) and the associated adaptations in Papua New Guinea (PNG). The frequent incidence of extreme weather events, including heatwaves, droughts, heavy rainfall with landslides, and floods in recent years, serves as compelling evidence of climate change [1,2,3,4]. Small island developing states (SIDS) in the Pacific encompass some of the world’s most vulnerable communities to climate change and hazards [5]. According to the 2020 World Risk Report, SIDS such as Vanuatu, Tonga, the Solomon Islands, and PNG are among the top 15 nations most at risk to natural hazards such as drought and floods [6]. Agricultural drought, in particular, has been a core concern for PNG’s communities in the past and is forecasted to escalate in the future [1].
Because more than 80% of the population engages in subsistence farming and the cultivation of cash crops, the impact of agricultural drought can have grave economic and nutritional consequences, particularly for rural families [7]. Tuber varieties such as sweet potato, taro, and yams constitute the primary staple food group in PNG, with more than 60% of the rural population relying on sweet potato as their primary food source [8]. Drawing from assessments during the 2015/2016 El Niño drought episode [9], sweet potato yields in the highlands of PNG experienced declines of up to 50%. This translated to a national decrease in productivity of approximately 38%, potentially triggering a 75% surge in sweet potato prices and a short-term reduction of 22% in sweet potato consumption [9]. As an illustration of the vulnerability to the food system’s collapse, an El Niño-induced drought in 2015 led to widespread food shortages as drought-related frosts devastated subsistence crops on a catastrophic scale, with up to 2.4 million people affected and 480,000 people experiencing acute food shortages [10,11].
Droughts occurring throughout PNG primarily stem from two significant climate influences: the El Niño–Southern Oscillation (ENSO) and the Indian Ocean Dipole (IOD) [12]. Smith et al. [10] used satellite-based products to provide reliable estimates and linear correlations between the data and NINO3.4 indices to gain insight into how ENSO patterns affect rainfall in PNG. Despite improvements in monitoring and predicting El Niño events, severe drought and frost damage occurred in PNG during the 1997–1998 El Niño causing famine, loss of life, crop devastation, and widespread forest fires, placing more than a million people at risk [11].
Currently, PNG’s National Weather Service (NWS) uses the user-centered Integrated Early Warning System (I-EWS) for monitoring drought [12,13,14]. The I-EWS combines satellite products, such as the Standardized Precipitation Index (SPI3) and Vegetation Health Index (VHI3), averaged across a 3-month sliding window, with seasonal probabilistic forecasting outputs (chance of exceeding the median rainfall) [13]. However, further refinements are needed to this existing pre-emptive drought monitoring system known as anticipatory action (AA). AA, also referred to as forecast-based financing or early warning–early action, is a growing strategy in disaster risk management that uses a proactive approach to mitigate the effects of extreme climatic events [15,16]. This support system enables the allocation of funding and the initiation of measures and interventions before a hazard or damages materialize, relying on scientific forecasts of the hazards or impacts [17]. The goal of AA is to support risk-exposed groups to build resilience over time by investing in predictable and effective assistance mechanisms that are activated prior to an event occurrence.
In 2022, the Association of Southeast Asian Nations (ASEAN) unveiled its Framework on Anticipatory Action in Disaster Management, clarifying the definition and structure of this preemptive approach and highlighting three essential building blocks for an effective AA system: (1) risk information, forecasting, and early warning systems with a clear triggering methodology and thresholds; (2) planning, operations, and delivery with appropriate activities that can be executed promptly; and (3) prearranged financing with sufficient funds available when needed, which are flexible and agile [18]. Compared with traditional disaster responses, AA has proven, through empirical evidence, to achieve higher returns on investments [19]. Research has indicated that for each US dollar invested in AA, yield returns of up to $7.10 USD can be gained via prevented losses and additional benefits [20]. The benefits accrued transcend momentary enhancements where the approach provides a more dignified modality to aid assistance.
The current drought early warning model used by PNG’s NWS utilizing a 3-month monitoring of SPI3 and VHI3, with thresholds of SPI3 < −1 and VHI3 < 40 [13], indicates that a drought has already commenced. However, at least a 2–3-month window is required to implement the AA. Therefore, we elected to use monthly SPI and VHI with 3-month forecasted SPI. As the World Meteorological Organization (WMO) recommends, the following SPI depth classification can be used for detecting different types of drought: 1 or 2 months for meteorological drought, and 3 to 6 months for agricultural drought [21]. Our proposed methodology can monitor meteorological drought with SPI1 and forecast the transformation of meteorological drought into agricultural drought with SPI3. Additionally, soil moisture data in the rhizosphere are used as an additional indicator. Previous research [22] highlighted the main challenge of articulating drought triggers for AA in the Indo-Pacific, i.e., limitations in the in situ hydrometeorological observations and the low accuracy of seasonal forecasts. Herein, the seasonal forecast was verified, and bias-correction methods using machine learning (ML) and indices such as ENSO and IOD were tested.
Our study developed an AA protocol for drought in PNG that incorporates the three essential building blocks, with a focus on the first two: triggering models and planning, operations, and delivery. This represents a standard operating tool for bringing the AA concept from theory to reality in PNG and the broader region. The testing of this AA protocol from October 2023 to May 2024 involved close collaboration with the Government of PNG and the Food and Agriculture Organization of the United Nations.
2. Materials and Methods
2.1. Materials
2.1.1. Study Site
PNG is an island nation with a population of approximately 9 million and an estimated 851 distinct spoken languages [23]. Its climate is predominantly tropical, with some influence from the West Pacific Monsoon [24]. One of its prominent geographical features is the PNG Highlands, which reach a maximum elevation of 4509 m a.s.l. [25]. The Highlands region is of significant agricultural importance, supporting an estimated 75% of the country’s annual sweet potato production [26]. Additionally, most of the crops are rain-fed, with very little irrigation practiced. About 80% of people rely on rain-fed farming and more than three-quarters of the food consumed in PNG is locally grown [5].
However, despite the importance of climate data within the agricultural sector, there are very few meteorological stations in the Highlands (Figure 1). The regional topography, derived from Shuttle Radar Topography Mission (SRTM) data with a 30 m spatial resolution [27], is depicted alongside the existing operational observation network (Figure 1). Analysis of the impacts of historical droughts based on previous reports [7,8] and consultations with the NWS revealed that during past drought years the Western Province and Western Highlands Province were the most severely affected agricultural areas. Thus, we decided to initiate and develop a drought-triggering methodology for agricultural assistance in these two provinces (Figure 1).
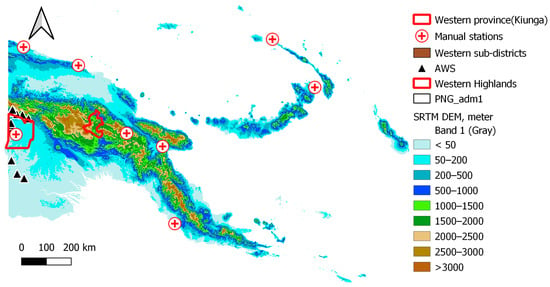
Figure 1.
Topography of the region, with the study area outlined in red and the locations of the observation network in PNG.
2.1.2. Data
Total monthly rainfall observations for the period of 1993–2024 were obtained from eight manual meteorological stations provided by the NWS. The rainfall data used from these manual stations have passed quality control checks, such as outlier processing and homogeneity testing. In areas where historical rainfall data were unavailable, we utilized the monthly rainfall product from CHIRPS (CHIRPS2.0: Rainfall Estimates from Rain Gauge and Satellite Observations, Climate Hazards Center) [28], which provides adequate climate analyses in PNG [29]. According to a verification analysis conducted for rainfall data derived from Japan’s Aerospace Exploration Agency (JAXA) Global Satellite Mapping of Precipitation (GSMaP V6) product, the US National Oceanographic and Atmospheric Administration (NOAA) Climate Prediction Center’s morphing technique (CMORPH V1), CHIRPS, and the National Aeronautics and Space Administration (NASA) Integrated Multi-Satellite Retrievals for GPM (IMERG V6b) [12,29], GSMaP achieved the best performance, particularly in mountainous areas, while CHIRPS performed most consistently [29]. CHIRPS was suggested for monitoring drought because it accounts for historical climate data, whereas GSMaP was preferred for tropical cyclone seasons owing to its robust performance in areas with sparse or no rain gauge coverage, as well as its shorter latency [29]. For accurate identification of monthly rainfall, CHIRPS monthly data with a spatial resolution of 4.8 km [28] and Global Precipitation Measurement (GPM) [30] data with a spatial resolution of 11 km were used. GPM is a constellation of low Earth-orbiting satellites maintained by NASA and JAXA. Additionally, the satellite observation products at spatial resolutions of 9 km for the soil moisture anomaly percentage index (SMAPI) of the surface (0–10 cm) and the root-zone (0–100 cm) were used [31,32]. The Vegetation Health Index (VHI), derived from satellite observations with a 1 km resolution, was obtained from the FAO portal [33]. These data were used in conjunction with a monthly time series of climate variability indices, such as the ENSO (Nino 3.4) and the IOD Dipole Mode Index (DMI), sourced from the Tokyo Climate Center [34].
Previously [13], the ECMWF (European Centre for Mid-Range Weather Forecasts) was assessed as the most accurate model for PNG and was used in the existing I-EWS drought forecasting model of NWS. Thus, the ECMWF SEAS5 seasonal forecasts used for this study were retrieved from the Copernicus Climate Change Service (C3S) through the Climate Data Store (CDS, https://cds.climate.copernicus.eu/#!/home, (accessed on 16 January 2024). Monthly total rainfall hindcasts from 1993 to 2016 and forecasts from 2017 to 2023 were used with a spatial resolution of 1° × 1°.
2.2. Methods
2.2.1. Analysis of the Observation Network
The WMO noted that the representative area of a weather station may extend up to a radius of 100 km in ideal conditions, e.g., flat terrain with no large water bodies or extensive variations in vegetation [35]. Moreover, the different meteorological variables do not possess identical spatial representativeness [35]. For instance, rainfall, a discrete variable, exhibits greater spatial variability compared with temperature and pressure [36]. Thus, the representative radius for rainfall observations may be limited to 10–50 km within complex orographic terrain [37]. To analyze the representative area of the observation network in PNG, we examined a 50 km radius area using a digital elevation model from SRTM. We created a 50 km buffer zone and then, using elevation data and relief exposure, identified the coverage zone of the observations. Elevations above the station’s level and areas with rugged relief and exposure were excluded as non-representative zones.
2.2.2. Agriculture Drought Indices and the Combined Drought Index
Researchers have advocated various indicators of drought, all outlined in the WMO guide [21]. The methodology for triggering agricultural drought analyzes two main aspects: (a) the precursors of impact and (b) the predictors of future drought [22]. Precursor variables do not necessarily need to exhibit a direct correlation between their current state and future drought conditions, although they may indicate susceptibility to droughts, thereby influencing the severity of impacts of a later climatological drought [22]. These variables encompass soil moisture, VHI, and current rainfall anomalies. Predictors of future drought encompass indices such as the ENSO and IOD indices [22].
Numerous drought indices derived from remote sensing (RS) data have been developed and used to effectively identify drought conditions worldwide [38,39,40]. As drought adversely affects vegetation, alterations in the vegetation index can indicate the extent of drought. The severity and variations in drought are more accurately described by a combination of different indices that portray vegetation stress, water deficit, and soil moisture status, rather than relying solely on individual indices. One commonly used drought indicator is the VHI [41,42], formulated by combining the Vegetation Condition Index (VCI) and the Temperature Condition Index (TCI). Drought classes used for the SPI [21], VHI [42], and SMAPI [43] are shown in Table 1.

Table 1.
Drought classes of SPI, VHI, and SMAPI (reproduced with permission from [22]).
To address the methodology for triggering agriculture droughts, we propose a Combined Drought Index (CDI) that uses SPI1 based on monthly rainfall [13] and monthly mean VHI. Our initial testing used the 1-month mean SMAPI and 3-month rainfall forecasts, enhanced by rainfall predictors such as the ENSO and IOD indices. This approach was necessary, due to the limited accuracy of seasonal rainfall forecasts.
To establish proactive measures focusing on agricultural droughts, the following components were incorporated: SPI1, which assesses meteorological drought; monthly mean VHI; and monthly mean SMAPI. Additionally, we utilized a 3-month rainfall forecast (SPI3) to provide advance warnings, allowing for a lead time before the crisis escalates. To compute historical CDI values, the SPI3 forecasted index was obtained from bias-corrected (BC) ECMWF seasonal forecasts.
The core concept behind the CDI for detecting agricultural drought is based on an idealized cause-and-effect relationship between deficiencies in rainfall and crop yield. This relationship unfolds through several stages: a shortfall in rain (Step 1) initially results in soil moisture depletion (Step 2), which, when prolonged, induces crop water stress, reflected in the observed VHI (Step 3). Ultimately, this leads to a decline in crop yields (Step 4) [22]. Therefore, the CDI is designed to monitor the current state of rainfall deficits using SPI1, monthly soil moisture levels with SMAPI, and vegetation health with VHI, in addition to forecasting 3-month rainfall patterns with SPI3. Table 2 outlines the proposed and tested CDI classifications.

Table 2.
CDI classes (reproduced with permission from [22]).
This approach not only monitors meteorological drought but also forecasts agricultural drought, encompassing processes spanning > 4 months, involving interactions between the atmosphere and the Earth’s surface. In its simplest form, the CDI enables us to determine which phase of the cause-and-effect relationship the agricultural system has entered during a drought event and when to initiate the activation of the anticipatory action (AA) protocol.
2.2.3. Crisis Timeline for PNG
Crisis timelines serve as tools for untangling the complexities of slow-onset AA within disaster risk management (DRM) systems. They form the foundation of a phased approach by pinpointing AA windows and suitable interventions. These timelines enable stakeholders to understand how drought-related early warning systems and triggering can be coupled with actions to mitigate or articulate the impacts of the forecast event, thus providing an indication of the time required for the implementation of AA and, ultimately, the timeline of preparedness and response actions for slow-onset hazards [44]. An important initial step in the application of AA to slow-onset hazards involves analyzing how seasonal agricultural calendars align with particular natural hazards, including agricultural cycles and patterns of livestock movement. After this analysis, activities that are most beneficial during each cycle need to be determined for effective interventions [44].
In PNG, a crisis timeline was developed in October 2023 based on consultations with the Government of PNG and validated during community consultations in November 2023. During these consultations, February and March were identified to be the most problematic periods because the rainy season may cease earlier than usual or the rainfall that has occurred may not have been sufficient to replenish the existing soil water prior to the onset of the dry season. However, these seasonal patterns may differ greatly across PNG due to its diverse geography. Communities indicated that the months of November and December were optimal periods to receive AA assistance to help mitigate the impacts of drought on crops and livestock. Based on this information, a crisis timeline was constructed (Table 3).

Table 3.
Crisis timeline for PNG used in this investigation.
2.2.4. Bias-Correction of the Seasonal Forecast by Using a Machine Learning Approach
Various statistical methodologies have been utilized to address bias corrections in seasonal forecasts. Machine learning (ML) techniques have been increasingly used in numerous studies to address diverse issues related to earth and climate sciences [38,45,46,47,48,49]. Our study marks the inaugural utilization of ML techniques in PNG to perform bias-corrections on seasonal rainfall forecasts, incorporating in situ rainfall observations, the ENSO index, and the IOD index. ML algorithms can analyze incoming data comprehensively, uncovering both explicit and concealed patterns. As such, they offer robust modeling approaches that enable the replication of intricate dependencies [3]. In the ML approach used in PNG for monthly parameters from 1993 to 2023 (n = 369), 30% of the data were allocated for the test and 70% for training [22].
For bias-correction, the ML Xgboost Regressor (XgbR) algorithm [47] with hyperparameter tuning (HPT) was used, which was previously found to be suitable for time-series meteorological data applications [3,49]. This method was utilized to bias-correct the 3-month rainfall forecasts on the basis of a range of potential predictors, including rainfall observations, the ENSO index, and the IOD index.
2.2.5. Verification Methods
Since the initiation of GPM observations in 2000, we assessed the most reliable RS-derived dataset by comparing it with the available meteorological data spanning from 2000 to 2023, using monthly calculations of bias. Subsequently, we utilized Taylor diagrams [50] to verify the accuracy of the CHIRPS and GPM rainfall observations. Taylor diagrams provide correlation statistics, including Pearson correlation coefficients, the root mean square difference (RMSD), and standard deviations, offering a comprehensive summary of the precision and consistency of remote sensing rainfall observations [51].
The performance of the seasonal rainfall forecast bias-correction model was evaluated by statistical methods to analyze errors between the actual and bias-corrected data. This evaluation encompassed metrics such as bias and the Taylor diagram. To test the CDI, we analyzed plots containing national yield data from 1993 to 2023, along with retrospectively calculated CDI values. Additionally, the Heidke skill score (HSS) [52], also known as kappa [53] outside of meteorology, was utilized to assess the CDI with SMAPI for the period from 1993 to 2023. The HSS ranges from −∞ to 1, where negative values indicate the chance forecast is better, 0 denotes no predictive ability, and a perfect forecast has an HSS of 1. Following the terminology of Jolliffe and Stephenson [54] and as shown in Table 4, the HSS was defined for 2 × 2 contingency tables.

Table 4.
Contingency table of the comparison between forecasts and observations or any two analyses or products. The symbols a–d represent the different numbers of cases observed to occur in each category.
3. Results
3.1. Analysis of the Representative Zones of PNG’s Observation Network
To analyze the representative area of the meteorological observation network in PNG, a digital elevation model from SRTM was clipped within a 50 km radius of each meteorological station using elevation data and relief exposure to identify the coverage zone of the observations (Figure 2). The analysis showed that the current observation network lacks coverage throughout much of PNG. Manual observation stations with >30 years of records (red labels in Figure 2) were also used in this research. Automated weather stations (AWS) have been operational since 2018 (black triangular marks in Figure 1); however, they were not sufficient for the correlation analysis and were not used in our research.
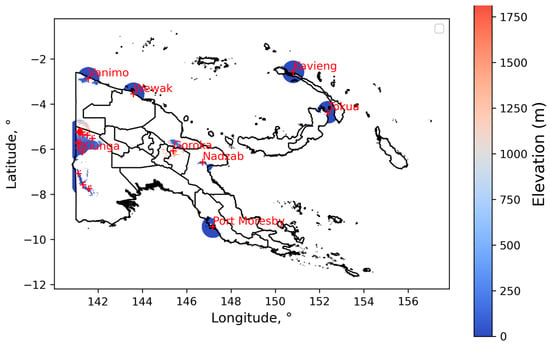
Figure 2.
Representative zones (blue circles with 50 km radius) of PNG’s operational meteorological observation network (red crosses).
3.2. Verification of CHIRPS 2.0 and GPM Monthly Rainfall Datasets with In Situ Observations
As noted, the current rainfall observation network is not sufficient to cover all of PNG, and RS data should be assimilated with in situ observations to fill the gaps. To verify the monthly rainfall data from CHIRPS and GPM, we calculated the standard deviation, root mean square difference, correlation coefficient, and bias for the eight long-term manual observation stations (Figure 2; stations labeled red). Taylor diagrams and bias graphs for Kiunga station (Figure 3a,b), one of the target areas of AA, and the Western Highlands Province (the second piloting area), using the closest station (Goroka; Figure 3c,d), are presented for the period of 2000–2023. For the other six stations, Taylor diagrams and bias graphs are presented in Appendix A.
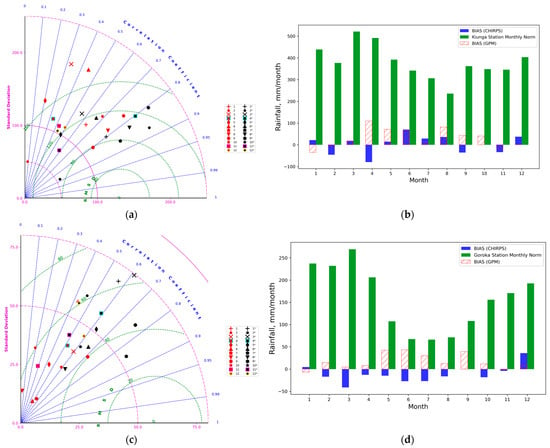
Figure 3.
Verification results of monthly rainfall from remotely sensed data and in situ observations for 2000–2023. (a) Taylor diagram of the correlation, centered root mean square difference (RMSD), and standard deviation between monthly rainfall from CHIRPS (black marks)/GPM (red marks) and monthly data from Kiunga meteorological station; symbols (from 1 to 12) represent months. (b) Bias of monthly rainfall derived from CHIRPS (blue bars) and GPM (red hashed bars), and the monthly rainfall norms from Kiunga meteorological station (green). (c) Taylor diagram for monthly rainfall from CHIRPS/GPM and from Goroka meteorological station, and (d) Bias of monthly rainfall derived from CHIRPS (blue bars) and GPM (red hashed bars), and the monthly rainfall norms of Goroka meteorological station (green).
Analysis of the statistical metrics used for verification indicated comparable accuracies between CHIRPS and GPM, but for mountainous stations such as Goroka, CHIRPS-derived monthly rainfall data showed better results (Figure 3). Given that the CHIRPS rainfall dataset exhibits better quality with a longer historical observation period (from 1983 to 2023), CHIRPS was used for the target Western Highlands Province; for Kiunga district in the Western Province, the Kiunga station’s data were used in this analysis.
3.3. Analysis of ENSO and IOD as Predictors of Drought
It is widely recognized that sea-surface temperature anomalies in the El Niño region of the Pacific Ocean significantly affect global atmospheric circulation and, consequently, rainfall patterns in PNG [10]. A notable correlation exists between the state of ENSO and concurrent rainfall in the Kiunga district of the Western Province and the Western Highlands of PNG (Figure 4a,b). ENSO is a crucial factor influencing the seasonal climate’s predictability, given its relatively slow variation and evolution over a period of months to annually. Similar correlation analysis maps of other provinces are presented in Appendix B.
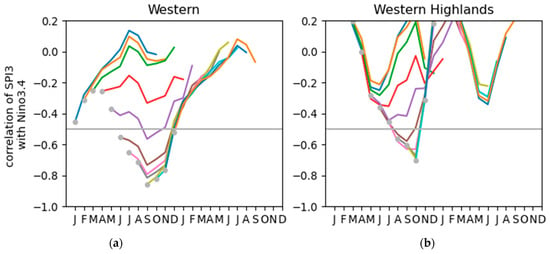
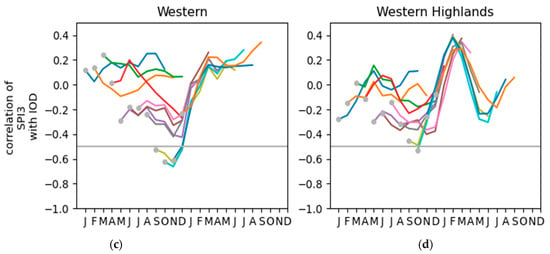
Figure 4.
Correlations between ENSO (Nino 3.4) and SPI3 (a,b) and between IOD and SPI3 (c,d) at various lead times. SPI3 for the nominal month represents data from three subsequent months (i.e., the data point for January will be the SPI3 from January to March). Each line represents a correlation between IOD or ENSO (Nino 3.4) for the month marked by the marker, and the given month’s SPI3. The correlation level indicates the practically applicable predictive power (−0.5), marked with a grey line; the sample period is 1984–2022.
We examined the Niño 3.4 index and its correlation with rainfall anomalies in the Western Province and Western Highlands Province, represented by SPI3, to assess ENSO’s role as a potential predictor of drought in these regions (Figure 4a,b). Two approaches were used: (1) the current ENSO conditions were used to predict future meteorological drought, and (2) the forecasted ENSO conditions were used to predict future meteorological drought. The strength of the Niño 3.4-SPI3 relationship varied across seasons and lead times. Strong correlations allowed for practical application in predictive models, notably during the period from July to December in the Western Province (Figure 4a) and from July to November in the Western Highlands Province (Figure 4b).
The IOD is another influential mode of variability in the global climate impacting rainfall in PNG. Similar to ENSO, it persists at a seasonal scale. However, the relationship between IOD and rainfall anomalies is generally weaker compared with that of ENSO (Figure 4c,d). Only near-concurrent relationships during September to December demonstrated potential predictability for the Western Province (Figure 4c), while for the Western Highlands Province, there was no statistically significant impact (Figure 4d).
3.4. Antecedent Circumstances as Forerunners of the Impacts of Drought
In developing a CDI, we assessed the factors that do not directly predict drought but rather indicate previous drought conditions. These conditions could potentially mitigate or exacerbate the effects of meteorological droughts. VHI and soil moisture were analyzed to determine if a discernible signal of the preceding conditions was reflected in these variables in the impact indices. Initially, the correlations of VHI and soil with meteorological drought (SPI3) were analyzed, focusing on rainfall anomalies influencing these variables, with SPI preceding VHI and soil moisture.
3.4.1. The Correlation between VHI and Drought
The VHI index exhibited a pattern of variation similar to SPI3, with a comparable level of variability (Figure 5). In the Western Province (Figure 5a), there were relatively strong correlations between the antecedent SPI3 and VHI from October to December, but correlations were low from January to September. Conversely, in the Western Highlands, the correlations were not statistically significant for all seasons but showed better results during the period from September to November (Figure 5b).
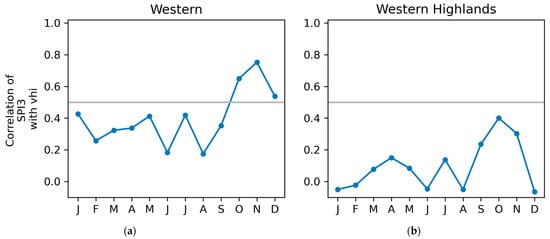
Figure 5.
Correlations between VHI and SPI3 for the (a) Western Province and (b) Western Highlands; sample period: 1984–2022. Correlation levels indicate statistically significant correlations (+0.5), marked with a grey line.
3.4.2. The Correlation between Monthly Mean Soil Moisture and SPI
Overall, the correlations between both SPI3 and SPI1 with soil moisture were rather strong (Figure 6). This suggested that soil moisture serves as a valuable quantitative indicator, particularly in regions lacking meteorological observations.
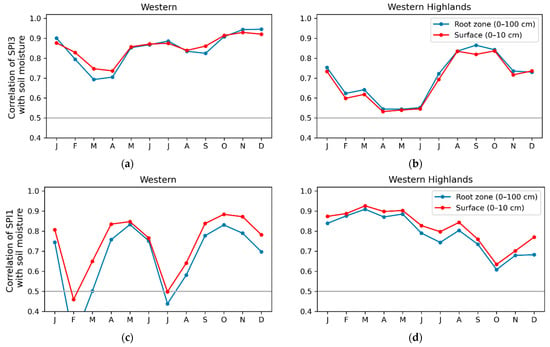
Figure 6.
Correlations between soil moisture anomalies and SPI3 (a,b) and SPI1 (c,d). The Western Province’s data are shown in (a,c) and data for the Western Highlands Province are shown in (b,d). Correlation levels indicate statistically significant correlations (+0.5), marked with a grey line.
SPI3 was significantly correlated with both surface and root zone soil moisture in the two provinces (Figure 6a,b). Conversely, SPI1 and surface soil moisture displayed stronger correlations across all months compared with root-zone soil moisture (Figure 6c,d). Because using root-zone soil moisture is advantageous for monitoring agricultural drought, we prioritized it as a reliable indicator of the antecedent rainfall and soil conditions.
3.5. Verification of the ECMWF’s Seasonal Rainfall Forecasts and Application of the ML Approach to Correcting the Bias of Seasonal Forecasts
To assess the effectiveness of ECMWF and the ML XgbR-HPT algorithm in modeling 3-month rainfall forecasts, we computed standard deviations, RMSD, and correlation coefficients for the period from 1993 to 2022 (Figure 7). Additionally, we evaluated total rainfall forecasts with a 3-month lead time and compared them with the 3-month rainfall observations from January 2023 to September 2023 (Figure 8a,b). Bias-corrected ECMWF (BC) data had improved correlations with smaller standard deviations and generally lower RMSD, suggesting better performance compared with ECMWF data alone. This improved performance in rainfall forecasts was particularly noticeable for the mountainous station of Goroka (Figure 8b). Bias-corrected analytical graphs of the other provinces are shown in Appendix C.
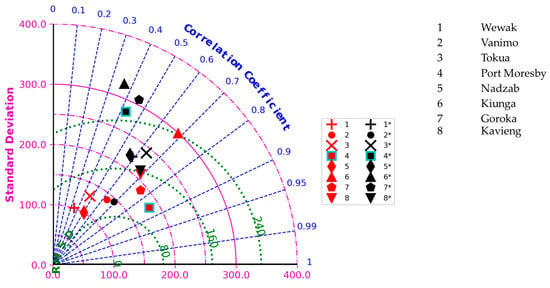
Figure 7.
Taylor diagram of correlation, centered root mean square difference (RMSD), and standard deviation for 3-month total rainfall from bias-corrected ECMWF data (BC) (in red), ECMWF data (in black), and data from the eight manual meteorological stations. The different symbols (1 to 8) represent the names of the meteorological stations noted on the right-hand side; the sample period is from 1993 to 2023.

Figure 8.
Trends of 3-month total rainfall forecasted by ECMWF (in orange), 3-month total rainfall bias-corrected ECMWF (BC) predictions (in green), and in situ observations from the meteorological stations (in blue) for 2023: (a) Kiunga meteorological station; (b) Goroka meteorological station.
3.6. Verification of the Drought-Triggering Methodology and Identification of Thresholds for Activating Anticipatory Action
The proposed CDI (Table 3) incorporates various key indicators, such as ENSO, SPI1, SPI3, SMAPI, IOD, and VHI, depending on the seasonal and temporal relationships. As previously noted [39,55], vegetation’s response to precipitation requires time, thus the impacts of drought on agricultural value chains progress from rainfall to soil moisture and finally to VHI. Therefore, SPI1, derived from rainfall observations, was used to complement the current monitoring of soil moisture and VHI. Additionally, we used SPI3, calculated from seasonal forecasts, as suggested in previous studies [13,14], due to its superior accuracy in forecasts compared with 6-month rainfall forecasts and SPI6.
By analyzing historical data, we computed the CDI for the period 1993–2023 and overlaid the national yield data for the period 1993–2022 (Figure 9). From the CDI calculations (Figure 9), it was evident that significant reductions in crop yield occurred during moderate and severe drought conditions.
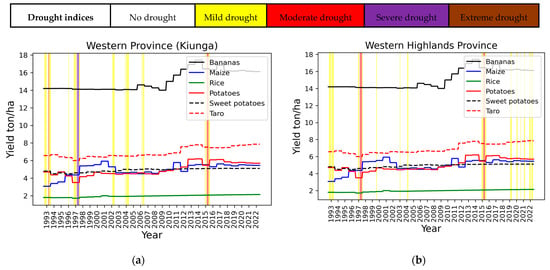
Figure 9.
CDI and crop yield time series data (a) for the Western Province (Kiunga district) and (b) for the Western Highlands Province within the period 1993–2022. The colored vertical lines represent the severity of drought, as noted in the top of the figure.
Furthermore, HSS was computed to assess the forecasting accuracy of the CDI for 1993 to 2023 (Table 5). In the calculation of HSS, forecast hits were considered when CDI predicted one drought class and at least one of the next 3 months experienced the same drought category using SMAPI. Overall, HSS showed the capability of the CDI to capture and predict agricultural drought with a lead time of 3 months (Table 5). Better performance was obtained during periods of no drought (HSS = 99) and moderate drought (HSS = 48–63). Negative values indicate that random forecasting is more accurate, 0 indicates no ability, and a perfect forecast achieves a HSS of 1.

Table 5.
HSS ability for the CDI with a forecast lead time of 3 months; period: 1993–2023.
A more temporally explicit analysis during drought years (1997, 2015, 2023) together with the corresponding 3-month SMAPI are presented (Table 6). Values highlighted in green indicate forecast hits, orange denotes forecast misses (underestimated forecasts), and white signifies forecast misses with overestimated forecasts. Analysis of the CDI (Table 6) and SMAPI revealed that the forecasted CDI achieved an overall accuracy of >90%. Based on crop yield reductions and SMAPI (Figure 9, Table 5 and Table 6), an AA activation threshold for a ‘moderate drought’ is proposed.

Table 6.
CDI calculations and monthly SMAPI during drought years (1997, 2015, and 2023). Values highlighted in green indicate forecast hits, orange indicates forecast misses (underestimated forecasts), and white indicates forecast misses (overestimated forecasts).
3.7. Practical Solutions Associated with Implementation of the AA
The AA initiative is designed to be implemented in three phases: a pre-drought phase (Phase 0), the early rainy season with reduced rainfall (Phase 1), and during the drought’s emergence (Phase 2). A comprehensive plan was established to offer timely solutions aligned with these three phases and tailored for the specific agricultural requirements of PNG’s communities to support drought resilience.
During the pre-drought phase (Phase 0), dissemination of early warnings tailored to specific audiences is required, along with training on water conservation measures, and crop, livestock, and other agricultural drought management practices. Moreover, support for a cost-effective and environmentally sensitive rain harvesting infrastructure for agricultural and domestic water is needed during this pre-drought period to provide a buffer against the impending drought. During the early part of the rainy season (Phase 1), support and enhancement is needed for water storage facilities (e.g., water tanks, ponds), pest control measures (rodents), irrigation systems and canals, agricultural inputs (e.g., fertilizer, mulch, shade cloth), dry storage facilities for cuttings, climate-adapted vegetable seeds (short-season), livestock feed kits, rehabilitation of water sources (via cash-for-work programs), and food preservation and conservation (via training). Once drought conditions have emerged (Phase 2), voucher assistance (initiated in Phase 1) can be boosted to support the farmers and workers most at risk, along with supplying feed and health kits for livestock and water purification tablets to increase access to clean water.
4. Discussion and Summary
Here, we enhanced and refined the existing early warning system of drought for PNG [13] by incorporating and testing remotely sensed precipitation data with the available meteorological station records from 2000 to 2023. Our drought-triggering methodology is designed for use in anticipatory action (AA) in PNG’s agricultural communities and relies on a combination of indicators. Several descriptive and semi-quantitative AA structures have recently emerged for assessing the onset of drought, with potential application in the developing world [44,56,57]. However, pinpointing the conditions for AA and specifying exactly when and how this system should be implemented requires a more quantitative approach. While the structure of the AA we developed for PNG is similar to the quantitative algorithm recently designed for Mozambique [58], the larger number of drought indicators and the more comprehensive statistical assessment in our PNG-based AA represents a significance advance specifically crafted for agricultural operations in the regions of interest.
During the testing period that began in 2020, it was apparent that the current drought monitoring system [13] was insufficient to support proactive AA. Despite including 3-month monitoring of SPI3 and VHI3, with thresholds for SPI3 of <−1 and for VHI3 of <40 [12,13], it appears that a drought had already commenced. Given that droughts are slow-onset hazards [59], a minimum window of 2 to 3 months is needed to implement AA prior to full emergence of the drought to ensure effective mitigation. Thus, we used monthly SPI and VHI together with 3-month SPI forecasts. Root-zone soil moisture data were incorporated as an additional indicator, as suggested in previous research [13,60].
Challenges in establishing drought triggers for AA in the Indo-Pacific, including the limitations of in situ hydrometeorological observations and the low accuracy of seasonal forecasts, have been previously noted [22,61,62,63]. Our seasonal forecasts were verified and bias-corrected using ML, and indices such as ENSO and IOD were tested, as noted in other studies [64,65]. The bias correction method significantly improved the 3-month forecast of total rainfall across PNG, similar to findings in the study on Mozambique [58]. To address gaps in the in situ monitoring of rainfall within PNG, remote sensing-derived indices were integrated, as in previous studies, which showed that CHIRPS and GPM provide better results than other remotely sensed rainfall products [13,29]. Because of its higher spatial resolution, CHIRPS produces more accurate monthly rainfall assessments compared with GPM and was used in our mountainous study area where in situ observations are lacking.
For the robust application of AA, several observational indicators need to be evaluated. First, crop development needs to be assessed, including any extent of crop damage and replanting that has occurred in the target villages. Additionally, local soil moisture and water sources should be assessed and compared with the average values. Local monthly rainfall observations should be compared with the monthly averages. Ideally, this assessment can be conducted in a brief monitoring mission supplemented with online data. Ground truthing the AA can also be enhanced by local observational data and communications with extension officers in the region on the extent of damages.
To ascertain the likelihood of an impending drought in an El Niño period, it is essential to analyze the long-term seasonal trends, present circumstances, and the predictions included in the CDI. To effectively mitigate the effects of agricultural drought, these forecasts and assessments must be incorporated in the AA because relevant responses vary depending on the development (phenological) stage of crops. A series of mitigation measures aligned with the crisis timeline for PNG (Table 3) in consultation with PNG’s NWS and food security cluster were developed. From August through September (Phase 0), preparation commences for the impending rainy season, with agricultural mitigation strategies developed for the potential below-average rainfall during the growing season (planning for early warnings, water harvesting, training in soil and water conservation, and support for livelihood diversification). In our AA planning, evidence of a strong ENSO event in the Pacific was apparent at this time, which would cause below-average rainfall in early 2024, as well as frosts at high altitudes. In Phase 1 (October through December) when the rain begins to decrease, mitigation measures to minimize losses of rainfed crops (outlined in Phase 0) should be implemented, along with monitoring of rainfall and vegetation conditions. During the drought’s emergence (Phase 2, January–March), AA interventions to protect livestock and stabilize food security are required, guided by expertise from the FAO and the Government of PNG and aligned with the community’s needs.
Moving away from reactive drought responses to proactive mitigation strategies such as AA offers a more sustainable and cost-effective approach to disaster reduction in the developing world, which is particularly relevant in an era of changing climate [66]. To be effective, these mitigation strategies must clearly recognize local vulnerabilities [67] and target actions to specific types of droughts [68]. The AA developed in this study focuses on specific agricultural sectors of PNG while engaging with local governments and incorporating the community’s needs. As noted by others [68,69], such a proactive drought mitigation strategy can greatly assist agriculture during periods of drought and help break the cycle of overreliance and dependence on governments and donor agencies.
Since the main practical outcome of this work is the establishment of an operational testing system (Figure 10), we illustrate the sequence of calculations conducted during the first week of each month, along with a flowchart for developing an AA system for agricultural drought (Figure 11). This algorithm (Figure 11) can be replicated for other territories in the region to implement an AA system for agricultural drought.
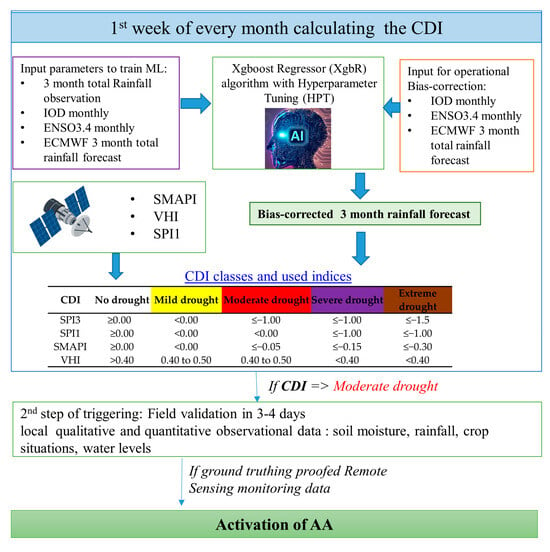
Figure 10.
Algorithm for triggering the agricultural drought.
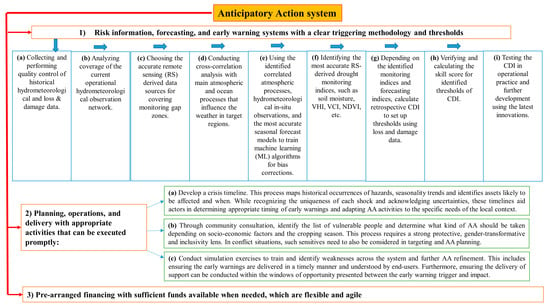
Figure 11.
Flow chart of developing the AA system for agricultural drought.
5. Conclusions
We propose a CDI to serve as a visual representation of drought conditions and the potential impacts on agriculture, categorizing the progression of drought, starting with a deficit in rainfall leading to reduced soil moisture and ultimately affecting the growth of vegetation. In addition to a 3-month rainfall forecast, the CDI incorporates ENSO (Nino 3.4) and the IOD as predictors of drought using machine learning algorithms to correct seasonal rainfall forecasts. Decision thresholds are established on the basis of these factors to trigger early warnings and anticipatory actions. The lead time identified by the CDI emphasizes the importance of a 2- to 3-month window for proactive measures, demonstrating how systematic proactive action can be implemented. We assert that the developed CDI effectively identifies both severe and mild droughts, suggesting its potential for operational use in PNG. The straightforward design and reliance on openly accessible satellite and forecasting data make the CDI a promising model for adoption in other drought-prone countries in the Asia-Pacific region. However, further testing and community engagement are necessary before such implementation.
In an ongoing test phase, this methodology will be refined by addressing the identified shortcomings. Following the proposed timeline, the FAO, in collaboration with government agencies and partners, will monitor the CDI monthly. If the CDI threshold indicates a moderate drought in the target municipalities, field verification will occur within 3–5 days. Activation of the AA will follow confirmation of a drought via local observations and consultations with farmers and municipal authorities. For example, during the first week of October 2023, the CDI calculation showed moderate drought in the Western Province (Kiunga). We conducted a field validation during the second week of October and, after confirming the remotely sensed derived indices, we activated the AA.
This research marks a pioneering effort in outlining the process of developing an agricultural drought-triggering methodology for AA in the context of PNG, where most of the aid focuses on traditional responses. Additionally, we devised a framework to evaluate the effectiveness of these methodologies in facilitating lead-time-dependent decision-making, incorporating various phases based on crop calendars. These findings advance drought-related AA protocols and guidelines for the Indo-Pacific region.
The following studies are recommended to advance this AA approach: (a) evaluating the performance of the testing phase and delving into the implementation processes at national and local levels; (b) investigating the end-to-end utilization and gender dynamics involved in using the CDI model, especially in the context of remote, high-risk areas; (c) exploring the perspectives of AA with government counterparts and communities, and their readiness to scale up efforts within the existing drought management plans in PNG; and (d) continuing to assess the accuracy of the AA.
Author Contributions
Conceptualization, E.I. and C.J.; methodology, E.I., N.Y., R.C.S. and C.J.; software, E.I. and N.Y.; validation, E.I., K.I. and L.D.; formal analysis, K.I. and R.C.S.; investigation, E.I.; resources, C.J. and K.I.; data curation, N.Y. and L.D.; writing—original draft preparation, E.I., R.C.S. and C.J.; visualization, E.I. and N.Y. All authors have read and agreed to the published version of the manuscript.
Funding
This research was funded by the German Federal Foreign Office under the project ‘Addressing El Niño induced climate risks in the Indo-Pacific Region with Anticipatory Action’.
Data Availability Statement
The raw data supporting the conclusions of this article will be made available by the authors on request.
Acknowledgments
We are grateful for the support and technical exchanges on this research from Luke Simmons, Jessica Raneri, Elena Martin Avila, and Fiona Lynn from the Australia Department of Foreign Affairs (DFAT) and Trade and the Australian Centre for International Agricultural Research (ACIAR).
Conflicts of Interest
The authors declare no conflicts of interest.
Appendix A
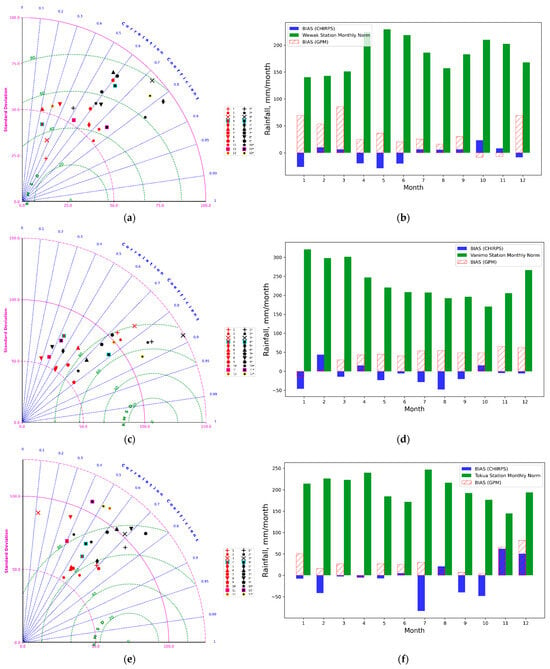
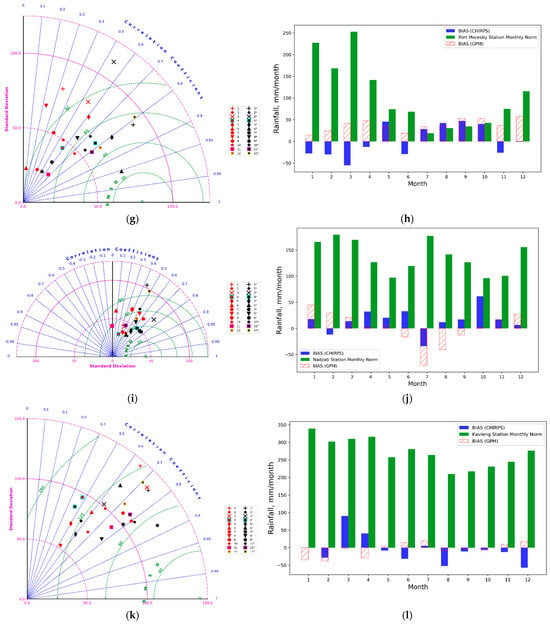
Figure A1.
Verification of the results of monthly rainfall from RS data and in situ observations for the period 2000–2023. (a) Taylor diagram of the correlation, centered root mean square difference (RMSD), and standard deviation between monthly rainfall from CHIRPS (black marks) or GPM (red marks) and monthly data from the Wewak meteorological station; the symbols (1 to 12) represent months. (b) Bias of monthly rainfall derived from CHIRPS (blue bars) and GPM (red hashed bars), and monthly rainfall norms from the Wewak meteorological station (green). Taylor diagram for monthly rainfall in (c) Vanimo, (e) Tokua, (g) Port Moresby (i) Nadzab, (k) Kavieng; bias of monthly rainfall (d) Vanimo, (f) Tokua, (h) Port Moresby, (j) Nadzab, and (l) Kavieng.
Appendix B
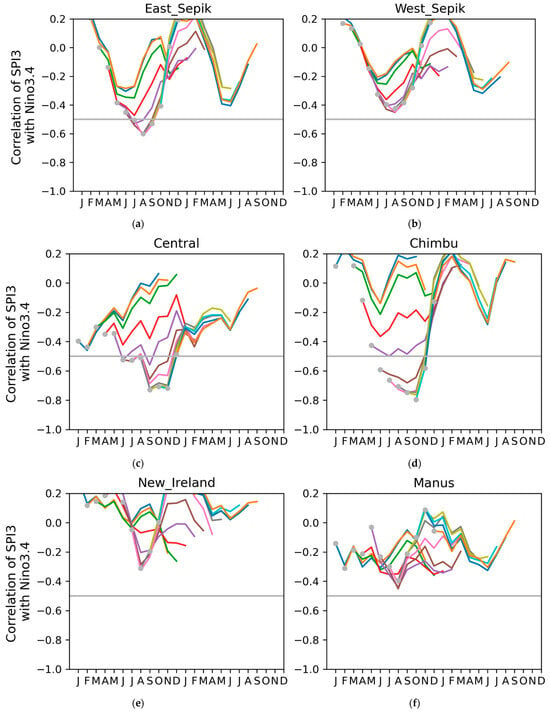
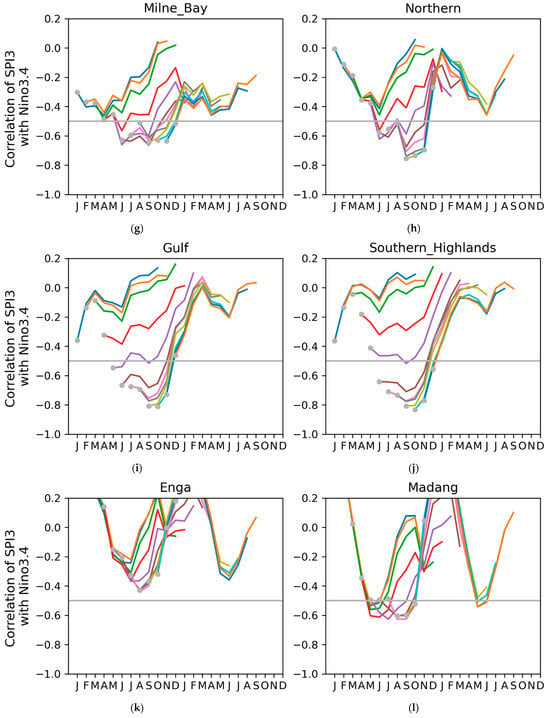
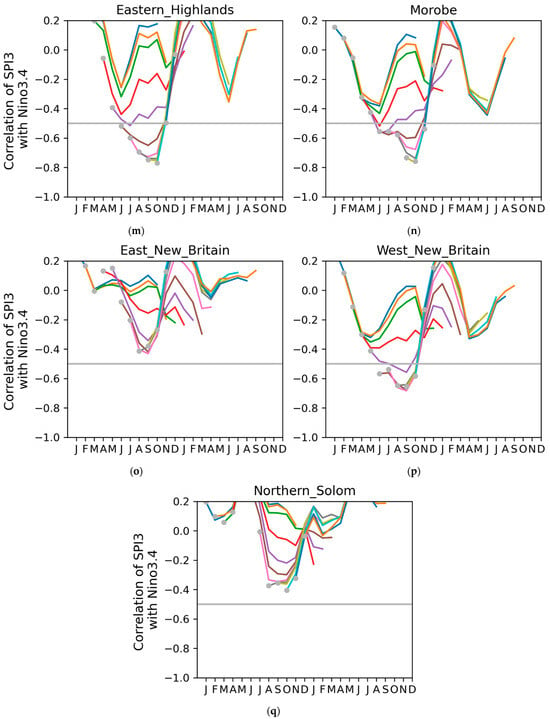
Figure A2.
Correlation between ENSO (Nino 3.4) and SPI3 for (a) East Sepik, (b) West Sepik, (c) Central, (d) Chimbu, (e) New Ireland, (f) Manus, (g) Milne Bay, (h) Northern, (i) Gulf, (j) Southern Highlands, (k) Enga, (l) Madang, (m) Eastern Highlands, (n) Morobe, (o) East New Britain, (p) West New Britain, and (q) Northen Solomon at various lead times. The SPI3 for the nominal month represents data from three subsequent months (i.e., the data point for January will be the SPI3 from January to March). Each line represents a correlation between ENSO (Nino 3.4) for the month marked by the marker, and the given month’s SPI3. The correlation level indicates the practically applicable predictive power (−0.5), marked with a grey line; the sample period is 1984–2022.
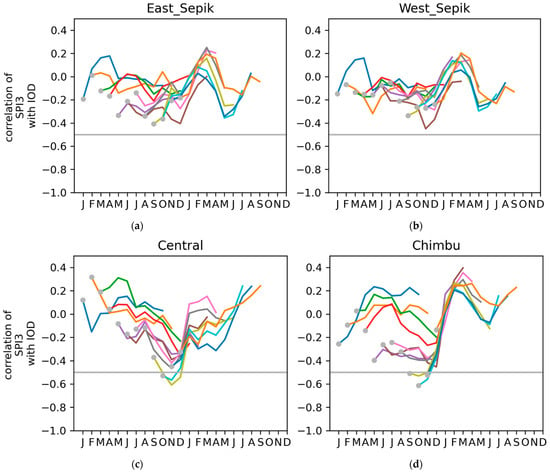
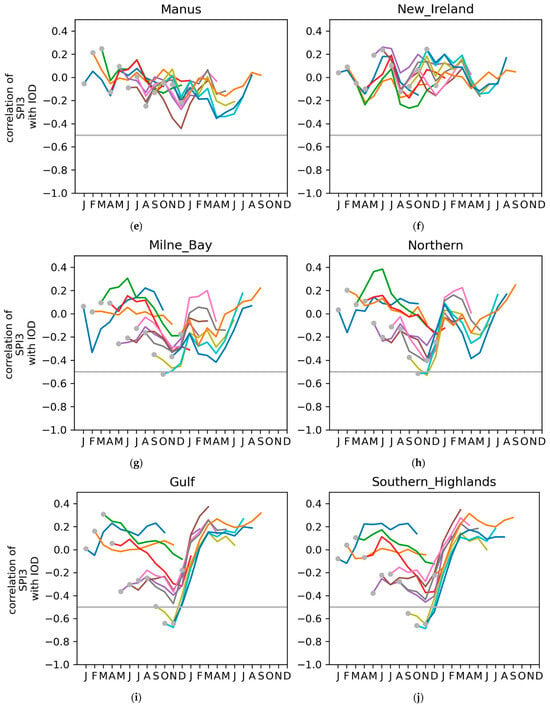
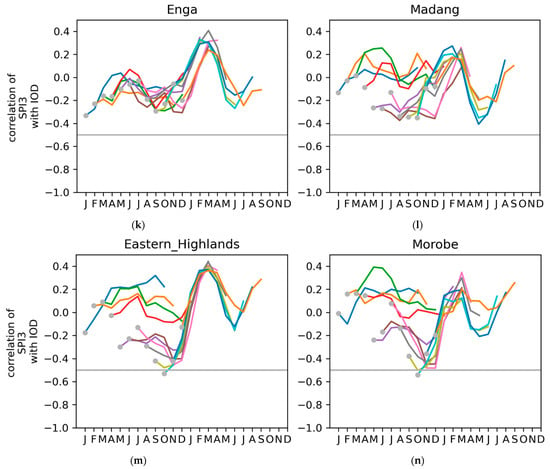
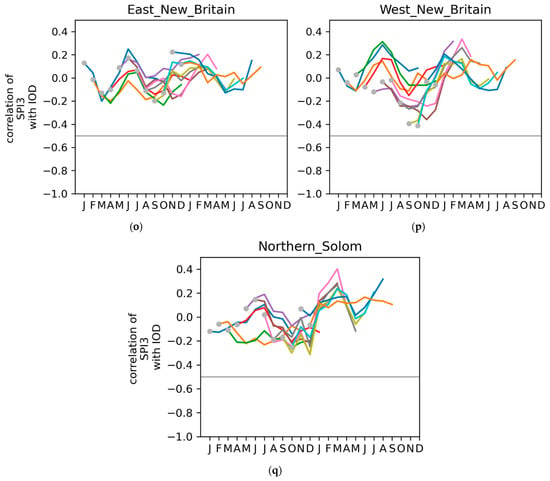
Figure A3.
Correlations between IOD and SPI3 for (a) East Sepik, (b) West Sepik, (c) Central, (d) Chimbu, (e) New Ireland, (f) Manus, (g) Milne Bay, (h) Northern, (i) Gulf, (j) Southern Highlands, (k) Enga, (l) Madang, (m) Eastern Highlands, (n) Morobe, (o) East New Britain, (p) West New Britain, and (q) Northen Solomon at various lead times. The SPI3 for the nominal month represents data from three subsequent months (i.e., the data point for January will be the SPI3 from January to March). Each line represents a correlation between the IOD on the month marked by the marker, and the given month’s SPI3. The correlation level indicates the practically applicable predictive power (−0.5), marked with a grey line; the sample period is 1984–2022.
Appendix C
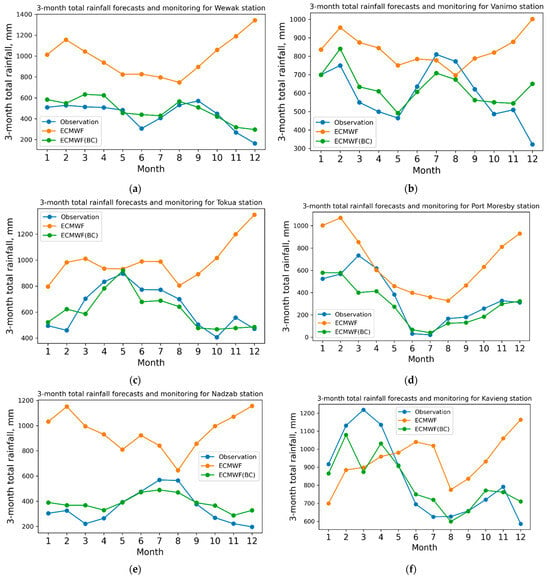
Figure A4.
Monthly total rainfall forecasted by ECMWF (orange), 3-month total rainfall bias-corrected ECMWF (BC) predictions (green), and in situ observations from meteorological stations (blue) for 2023. Meteorological stations: (a) Wewak, (b) Vanimo, (c) Tokua, (d) Port Moresby, (e) Nadzab, and (f) Kavieng.
References
- Kuleshov, Y.; McGree, S.; Jones, D.; Charles, A.; Cottrill, A.; Prakash, B.; Atalifo, T.; Nihmei, S.; Seuseu, F.L.S.K. ExtremeWeather and Climate Events and Their Impacts on Island Countries in the Western Pacific: Cyclones, Floods and Droughts. Atmos. Clim. Sci. 2014, 4, 803. [Google Scholar] [CrossRef]
- Iese, V.; Kiem, A.S.; Mariner, A.; Malsale, P.; Tofaeono, T.; Kirono, D.G.C.; Round, V.; Heady, C.; Tigona, R.; Veisa, F. Historical and Future Drought Impacts in the Pacific Islands and Atolls. Clim. Chang. 2021, 166, 19. [Google Scholar] [CrossRef]
- Isaev, E.; Ermanova, M.; Sidle, R.C.; Zaginaev, V.; Kulikov, M.; Chontoev, D. Reconstruction of Hydrometeorological Data Using Dendrochronology and Machine Learning Approaches to Bias-Correct Climate Models in Northern Tien Shan, Kyrgyzstan. Water 2022, 14, 2297. [Google Scholar] [CrossRef]
- Isaev, E.; Murata, A.; Fukui, S.; Sidle, R.C. High-Resolution Dynamic Downscaling of Historical and Future Climate Projections over Central Asia. Cent. Asian J. Water Res. 2024, 10, 91–114. [Google Scholar] [CrossRef]
- Bang, S.; Crimp, S. Accessible Weather Forecasts, Advisories Key to PNG Farm Resilience. Partners Res. Dev. 2019, 3, 14–17. [Google Scholar]
- Behlert, B.; Diekjobst, R.; Felgentreff, C.; Manandhar, T.; Mucke, P.; Pries, L.; Radtke, K.; Weller, D. The World Risk Report 2020; Bündnis Entwicklung Hilft: Bochum, Germany, 2020. [Google Scholar]
- Bourke, R.M.; Harwood, T. Food and Agriculture in Papua New Guinea; ANU E Press: Canberra, Australia, 2009; ISBN 1921536616. [Google Scholar]
- Cobon, D.H.; Ewai, M.; Inape, K.; Bourke, R.M. Food Shortages Are Associated with Droughts, Floods, Frosts and ENSO in Papua New Guinea. Agric. Syst. 2016, 145, 150–164. [Google Scholar] [CrossRef]
- Joseph, J.; Hayoge, G.; Sikas-Iha, H.; Dorosh, P.; Schmidt, E.; Kedir, M.J. Potential Impacts of an El Niño Related Drought on Sweet Potato Consumption and Prices in Papua New Guinea; International Food Policy Research Institute: Washington, DC, USA, 2021. [Google Scholar]
- Smith, I.; Moise, A.; Inape, K.; Murphy, B.; Colman, R.; Chuang, C. ENSO-Related Rainfall Changes over the New Guinea Region. J. Geophys. Res. Atmos. 2013, 118, 10665–10675. [Google Scholar] [CrossRef]
- Nicholls, N. Atmospheric and Climatic Hazards: Improved Monitoring and Prediction for Disaster Mitigation. Nat. Hazards 2001, 23, 137–155. [Google Scholar] [CrossRef]
- Chua, Z.-W.; Kuleshov, Y.; Watkins, A.B. Drought Detection over Papua New Guinea Using Satellite-Derived Products. Remote Sens. 2020, 12, 3859. [Google Scholar] [CrossRef]
- Bhardwaj, J.; Kuleshov, Y.; Chua, Z.-W.; Watkins, A.B.; Choy, S.; Sun, Q. Building Capacity for a User-Centred Integrated Early Warning System for Drought in Papua New Guinea. Remote Sens. 2021, 13, 3307. [Google Scholar] [CrossRef]
- Aitkenhead, I.; Kuleshov, Y.; Bhardwaj, J.; Chua, Z.W.; Sun, C.; Choy, S. Validating a Tailored Drought Risk Assessment Methodology: Drought Risk Assessment in Local Papua New Guinea Regions. Nat. Hazards Earth Syst. Sci. 2023, 23, 553–586. [Google Scholar] [CrossRef]
- Parodi, L.S.I.; Enenkel, M.; Lombardi, N.; Ngaina, J. Anticipatory Action for Drought in the Sahel: An Innovation for Drought Risk Management or a Buzzword? Front. Clim. 2024, 6, 1347519. [Google Scholar] [CrossRef]
- Rüth, A.; Fontaine, L.; De Perez, E.C.; Kampfer, K.; Wyjad, K.; Destrooper, M.; Miller, R. Forecast-Based Financing, Early Warning, and Early Action: A Cutting-Edge Strategy for the International Humanitarian Community. In Routledge Companion to Media and Humanitarian Action; Routledge: New York, NY, USA, 2017; pp. 135–149. ISBN 9781315538129. [Google Scholar]
- Thalheimer, L.; Simperingham, E.; Jjemba, E.W. The Role of Anticipatory Humanitarian Action to Reduce Disaster Displacement. Environ. Res. Lett. 2022, 17, 014043. [Google Scholar] [CrossRef]
- ASEAN (Association of Southeast Asian Nations). ASEAN Framework on Anticipatory Action in Disaster Management; ASEAN Secretariat: Jakarta, Indonesia, 2022. [Google Scholar]
- Global Commission on Adaptation Adapt Now. A Global Call for Leadership on Climate Resilience; World Resources Institute: Washington, DC, USA, 2019. [Google Scholar]
- FAO (Food and Agricultural Organization of the United Nations). The Impact of Disasters on Agriculture and Food Security 2023—Avoiding and Reducing Losses through Investment in Resilience; FAO: Rome, Italy, 2023. [Google Scholar]
- Svoboda, M.; Fuchs, B.A. Handbook of Drought Indicators and Indices|World Meteorological Organization; WMO: Geneva, Switzerland, 2016. [Google Scholar]
- Isaev, E.; Jones, C.; Goncalves, M.; Parkinson, E.; Moniz, T.; Soares, R. Exploring the Application of Artificial Intelligence for Triggering Anticipatory Action in Agricultural Drought: A Timor-Leste Case Study; FAO: Dili, Timor-Leste, 2024. [Google Scholar]
- United Nations Office for Disaster Risk Reduction. Disaster Risk Reduction in Papua New Guinea: Status Report 2019; UNDRR: Bangkok, Thailand, 2019. [Google Scholar]
- Beck, H.; Zimmermann, N.; McVicar, T.; Vergopolan, N.; Berg, A.; Wood, E. Present and Future Köppen-Geiger Climate Classification Maps at 1-Km Resolution. Sci. Data 2018, 5, 180214. [Google Scholar] [CrossRef] [PubMed]
- Benjamin, A.K.; Mopafi, I.; Duke, T.A. Perspective on Food and Nutrition in the PNG Highlands; PNG University of Technology: Lae, Papua New Guinea, 2001; Volume 11. [Google Scholar]
- Lutulele, R.P. Sweet Potato Variety Developments in the PNG Highlands: Implications for Future Research and Extension Focus. Food Secur. Papua New Guinea 2001, 99, 730–735. [Google Scholar]
- Shuttle Radar Topography Mission (SRTM) Global. NASA Shuttle Radar Topogr. Mission 2013. [CrossRef]
- CHIRPS: Rainfall Estimates from Rain Gauge and Satellite Observations|Climate Hazards Center—UC Santa Barbara. Available online: https://www.chc.ucsb.edu/data/chirps (accessed on 16 December 2022).
- Wild, A.; Chua, Z.-W.; Kuleshov, Y. Evaluation of Satellite Precipitation Estimates over the South West Pacific Region. Remote Sens. 2021, 13, 3929. [Google Scholar] [CrossRef]
- Jackson, G.; Berg, W.; Kidd, C.; Kirschbaum, D.; Petersen, W.; Huffman, G.; Takayabu, Y. Global Precipitation Measurement (GPM): Unified Precipitation Estimation from Space. In Remote Sensing of Clouds and Precipitation; Springer: Cham, Switzerland, 2018; pp. 175–193. [Google Scholar]
- Dorigo, W.; Wagner, W.; Albergel, C.; Albrecht, F.; Balsamo, G.; Brocca, L. ESA CCI Soil Moisture for Improved Earth System Understanding: State-of-the Art and Future Directions. Remote Sens. Environ. 2017, 203, 185–215. [Google Scholar] [CrossRef]
- Das, N.N.; Entekhabi, D.; Dunbar, R.S.; Colliander, A.; Chen, F.; Crow, W. The SMAP Mission Combined Active-Passive Soil Moisture Product at 9 Km and 3 Km Spatial Resolutions. Remote Sens. Environ. 2018, 211, 204–217. [Google Scholar] [CrossRef]
- FAO; GIEWS; Earth Observation. Available online: https://www.fao.org/giews/earthobservation/country/index.jsp?lang=en&code=TLS (accessed on 1 September 2023).
- Tokyo Climate Center El Niño and IOD Monitoring. Available online: https://ds.data.jma.go.jp/tcc/tcc/products/elnino/index/index.html (accessed on 1 September 2023).
- WMO. Guide to the Global Observing System, 2010th ed.; WMO: Geneva, Switzerland, 2017. [Google Scholar]
- Isaev, E.; Aniskina, O. Impact of Cloud Microphysic Parametrization Schemes on the Quality of Atmospheric Processes Forecast in Areas with Complex Relief over Territory Kyrgyzstan. Uchenye Zap. RGGMU 2015, 38, 118–125. [Google Scholar]
- Chung, W.; Abdel-Aty, M.; Lee, J. Spatial Analysis of the Effective Coverage of Land-Based Weather Stations for Traffic Crashes. Appl. Geogr. 2018, 90, 17–27. [Google Scholar] [CrossRef]
- Park, S.; Lim, C.H.; Kim, S.J.; Isaev, E.; Choi, S.E.; Lee, S.D.; Lee, W.K. Assessing Climate Change Impact on Cropland Suitability in Kyrgyzstan: Where Are Potential High-Quality Cropland and the Way to the Future. Agronomy 2021, 11, 1490. [Google Scholar] [CrossRef]
- Chang, S.; Isaev, E.; Chen, H.; Wu, B.; Meng, J.; Yan, N.; Ma, Z. Exploring the Linkages between Different Types of Drought and Their Impacts on Crop Production in Kyrgyzstan. IEEE J. Sel. Top. Appl. Earth Obs. Remote Sens. 2024, 17, 4566–4580. [Google Scholar] [CrossRef]
- Wang, P.-X.; Li, X.-W.; Gong, J.-Y.; Song, C.-H. Vegetation Temperature Condition Index and Its Application for Drought Monitoring. In Proceedings of the International Geoscience and Remote Sensing Symposium, Sydney, Australia, 9–13 July 2001; pp. 141–143. [Google Scholar]
- Kogan, F.N. Application of Vegetation Index and Brightness Temperature for Drought Detection. Adv. Sp. Res. 1995, 15, 91–100. [Google Scholar] [CrossRef]
- Kogan, F.N.; Stark, R.; Gitelson, A.; Jargalsaikhan, L.; Dugrajav, C.; Tsooj, S. Derivation of Pasture Biomass in Mongolia from AVHRR-Based Vegetation Health Indices. Int. J. Remote. Sens. 2004, 25, 2889–2896. [Google Scholar] [CrossRef]
- Luong, N.D.; Hiep, N.H.; Bui, T.H. Investigating the Spatio-Temporal Variation of Soil Moisture and Agricultural Drought towards Supporting Water Resources Management in the Red River Basin of Vietnam. Sustainability 2021, 13, 4926. [Google Scholar] [CrossRef]
- Levine, S.; Wilkinson, E.; Weingärtner, L.; Mall, P. Anticipatory Action for Livelihood Protection; Overseas Development Institute: London, UK, 2020. [Google Scholar]
- Nabavi, S.O.; Haimberger, L.; Abbasi, E. Assessing PM 2.5 Concentrations in Tehran, Iran, from Space Using MAIAC, Deep Blue, and Dark Target AOD and Machine Learning Algorithms. Atmos. Pollut. Res. 2019, 10, 889–903. [Google Scholar] [CrossRef]
- Chang, Y.S.; Chiao, H.T.; Abimannan, S.; Huang, Y.P.; Tsai, Y.T.; Lin, K.M. An LSTM-Based Aggregated Model for Air Pollution Forecasting. Atmos. Pollut. Res. 2020, 11, 1451–1463. [Google Scholar] [CrossRef]
- Bolourani, S.; Brenner, M.; Wang, P.; McGinn, T.; Hirsch, J.S.; Barnaby, D.; Zanos, T.P.; Barish, M.; Cohen, S.L.; Coppa, K.; et al. A Machine Learning Prediction Model of Respiratory Failure within 48 Hours of Patient Admission for COVID-19: Model Development and Validation. J. Med. Internet Res. 2021, 23, e24246. [Google Scholar] [CrossRef] [PubMed]
- Czernecki, B.; Marosz, M.; Jędruszkiewicz, J. Assessment of Machine Learning Algorithms in Short-Term Forecasting of PM10 and PM2.5 Concentrations in Selected Polish Agglomerations. Aerosol Air Qual. Res. 2021, 21, 200586. [Google Scholar] [CrossRef]
- Isaev, E.; Ajikeev, B.; Shamyrkanov, U.; Kalnur, K.; Maisalbek, K.; Sidle, R.C. Impact of Climate Change and Air Pollution Forecasting Using Machine Learning Techniques in Bishkek. Aerosol Air Qual. Res. 2022, 22, 210336. [Google Scholar] [CrossRef]
- Taylor, K.E. Summarizing Multiple Aspects of Model Performance in a Single Diagram. J. Geophys. Res. Atmos. 2001, 106, 7183–7192. [Google Scholar] [CrossRef]
- Funk, C.; Peterson, P.; Landsfeld, M.; Pedreros, D.; Verdin, J.; Shukla, S.; Husak, G.; Rowland, J.; Harrison, L.; Hoell, A.; et al. The Climate Hazards Infrared Precipitation with Stations—A New Environmental Record for Monitoring Extremes. Sci. Data 2015 21 2015, 2, 150066. [Google Scholar] [CrossRef] [PubMed]
- Heidke, P. Berechnung Des Erfolges Und Der Gute Der Windstarkevorhersagen Im Sturmwarnungsdienst (Measures of Success and Goodness of Wind Force Forecasts by the Gale-Warning Service). Geogr. Ann. 1926, 8, 301–349. [Google Scholar]
- Cohen, J. A Coefficient of Agreement for Nominal Scales. Educ. Psychol. Meas. 1960, 20, 213–220. [Google Scholar] [CrossRef]
- Jolliffe, I.T.; Stephenson, D.B. Forecast Verification: A Practitioners Guide in Atmospheric Science; John Wiley & Sons: Hoboken, NJ, USA, 2012; p. 292. [Google Scholar]
- Isaev, E.; Kulikov, M.; Shibkov, E.; Sidle, R.C. Bias Correction of Sentinel-2 with Unmanned Aerial Vehicle Multispectral Data for Use in Monitoring Walnut Fruit Forest in Western Tien Shan, Kyrgyzstan. J. Appl. Remote. Sens. 2022, 17, 022204. [Google Scholar] [CrossRef]
- Enenkel, M.; Dall, K.; Huyck, C.K.; McClain, S.N.; Bell, V. Monitoring, Evaluation, Accountability, and Learning (MEAL) in Anticipatory Action—Earth Observation as a Game Changer. Front. Clim. 2022, 4, 923852. [Google Scholar] [CrossRef]
- Alahacoon, N.; Amarnath, G.; Gnanatheepan, W. Development of an Anticipatory Action Plan for Drought Hazard in Sri Lanka; International Water Management Institute: Anuradhapura, Sri Lanka, 2023. [Google Scholar]
- Guimarães Nobre, G.; Towner, J.; Nhantumbo, B.; João da Conceição Marcos Matuele, C.; Raiva, I.; Pasqui, M.; Bonifácio, R. Ready, Set, Go! An Anticipatory Action System against Droughts. EGU Sph. 2024, 1–30. [Google Scholar] [CrossRef]
- Wilhite, D.A.; Svoboda, M.D. Drought Early Warning Systems in the Context of Drought Preparedness and Mitigation; WMO: Geneva, Switzerland, 2000. [Google Scholar]
- Esit, M.; Kumar, S.; Pandey, A.; Lawrence, D.M.; Rangwala, I.; Yeager, S. Seasonal to Multi-Year Soil Moisture Drought Forecasting. Clim. Atmos. Sci. 2021, 4, 16. [Google Scholar] [CrossRef]
- UNESCAP. Ready for the Dry Years: Building Resilience to Drought in South-East Asia; UNESCAP: Bangkok, Thailand, 2021. [Google Scholar]
- De Perez, E.C.; Harrison, L.; Berse, K.; Easton-Calabria, E.; Marunye, J.; Marake, M.; Zauisomue, E.H. Adapting to Climate Change through Anticipatory Action: The Potential Use of Weather-Based Early Warnings. Weather Clim. Extrem. 2022, 38, 100508. [Google Scholar] [CrossRef]
- Zaki, M.K.; Noda, K. A Systematic Review of Drought Indices in Tropical Southeast Asia. Atmosphere 2022, 13, 833. [Google Scholar] [CrossRef]
- Piani, C.; Haerter, J.O.; Coppola, E. Statistical Bias Correction for Daily Precipitation in Regional Climate Models over Europe. Theor. Appl. Climatol. 2010, 99, 187–192. [Google Scholar] [CrossRef]
- Ghosh, S.; Lu, J.; Das, P.; Zhang, Z. Machine Learning Algorithms for Merging Satellite-Based Precipitation Products and Their Application on Meteorological Drought Monitoring over Kenya. Clim. Dyn. 2024, 62, 141–163. [Google Scholar] [CrossRef]
- Sivakumar, M.V.; Stefanski, R.; Bazza, M.; Zelaya, S.; Wilhite, D.; Magalhaes, A.R. High Level Meeting on National Drought Policy: Summary and Major Outcomes. Weather Clim. Extrem. 2014, 3, 126–132. [Google Scholar] [CrossRef]
- Hayes, M.J.; Wilhelmi, O.V.; Knutson, C.L. Reducing Drought Risk: Bridging Theory and Practice. Nat. Hazards Rev. 2004, 5, 106–113. [Google Scholar] [CrossRef]
- Wilhite, D.A.; Sivakumar, M.V.; Pulwarty, R. Managing Drought Risk in a Changing Climate: The Role of National Drought Policy. Weather Clim. Extrem. 2014, 3, 4–13. [Google Scholar] [CrossRef]
- Bandyopadhyay, N.; Bhuiyan, C.; Saha, A.K. Drought Mitigation: Critical Analysis and Proposal for a New Drought Policy with Special Reference to Gujarat (India). Prog. Disaster Sci. 2020, 5, 100049. [Google Scholar] [CrossRef]
Disclaimer/Publisher’s Note: The statements, opinions and data contained in all publications are solely those of the individual author(s) and contributor(s) and not of MDPI and/or the editor(s). MDPI and/or the editor(s) disclaim responsibility for any injury to people or property resulting from any ideas, methods, instructions or products referred to in the content. |
© 2024 by the authors. Licensee MDPI, Basel, Switzerland. This article is an open access article distributed under the terms and conditions of the Creative Commons Attribution (CC BY) license (https://creativecommons.org/licenses/by/4.0/).