Article

Evaluation and Comparison of Five Long-Term Precipitation Datasets in the Hang-Jia-Hu Plain of Eastern China

1
Research Center of Big Data Technology, Nanhu Laboratory, Jiaxing 314000, China
2
Department of Hydraulic Engineering, Tsinghua University, Beijing 100084, China
*
Authors to whom correspondence should be addressed.
Water 2024, 16(14), 2003; https://doi.org/10.3390/w16142003
Submission received: 3 June 2024 / Revised: 29 June 2024 / Accepted: 8 July 2024 / Published: 15 July 2024
(This article belongs to the Section Hydrology)

Abstract

:
This study analyzed the applicability of five long-term precipitation datasets in the Hang-Jia-Hu Plain of eastern China based on meteorological observation data. The accuracy of each dataset at different time scales (yearly, monthly) was analyzed. Besides, their spatiotemporal distributions and differences in precipitation event frequency were also compared. The results indicate that the high-resolution (1 day, 1 km) and long-term (1961–2019) gridded dataset for temperature and precipitation across China (HRLT) exhibited the best overall performance at the annual scale, while the long-term, gauge-based gridded precipitation dataset for the Chinese mainland (CHM_PRE) performed the best at the monthly scale. The dataset of monthly precipitation with a resolution of 1 km in China from 1960 to 2020 (HHU) and the China Meteorological Forcing Dataset (CMFD) tend to overestimate the local precipitation amounts, while the other three products are characterized by an underestimation. The mean result of the five datasets indicates a slight, statistically insignificant rise in precipitation, by 4.19 mm annually, with an overall multi-year average of 1303.28 mm. The analysis of the five datasets successfully captures the spatial precipitation patterns across the Hang-Jia-Hu Plain, characterized by higher precipitation levels in the southwest and lower in the northeast. Although the interannual variability displays general consistency, there are significant discrepancies in the interannual growth rates and the spatial distribution of significance across different regions. This study can provide a reference for the accuracy of precipitation data in the fields of hydrology, meteorology, agriculture, and ecology, facilitating the analysis of uncertainties in related research.

1. Introduction

Precipitation, as a crucial component of the global hydrological cycle and energy balance, is the primary input of the atmosphere into terrestrial hydrological systems [1]. Recent research indicates an increase in the frequency and intensity of extreme precipitation or drought events, attributed to climate change and intensified human activities [2,3,4,5,6]. Due to its uneven spatiotemporal distribution and wide range of changes, precipitation directly contributes to natural disasters, such as droughts, floods, and blizzards [7]. However, the current uneven distribution of precipitation observation networks is not conducive to analyzing the spatial heterogeneity of precipitation, which brings great uncertainty to research related to regional precipitation, such as climate change, flood prediction and warning, and water resource allocation [8,9,10]. The gridded precipitation dataset is a reliable alternative to generating continuous spatiotemporal precipitation results [11] and serves as crucial input data to drive hydrological models [12] and land surface process models [13].
At present, there is an increasing proliferation of high spatiotemporal resolution global precipitation datasets, which have been constructed and utilized in numerous studies. However, there are significant differences in time series length, spatiotemporal resolution, accuracy characteristics, etc., among precipitation datasets due to various data sources and estimation methods [14]. Broadly, these datasets can be categorized into three groups [8]. The first group is derived from the analysis of precipitation datasets obtained from ground observation stations, such as the dataset from the Global Climate Precipitation Center (GPCC) [15]. The second group is obtained through the application of inversion, fusion, and correction algorithms to satellite precipitation data. This includes datasets such as CMORPH [16], TRMM [17], PERSIANN [18], and MSWEP [19]. Lastly, the third group is derived from various physical and dynamic models driven by existing observed meteorological data. This includes datasets such as NCEP [20], ERA-Interim [21], CFSR [22], and JRA-55 [23]. The suitability of these datasets varies depending on spatiotemporal and practical conditions. Ground-observed and reanalysis datasets that include long-term precipitation records are well suited for climate change research. In contrast, satellite-observed datasets, despite having shorter time records, offer more consistent spatiotemporal coverage. This makes them invaluable for weather processes and hydrological monitoring [8,24]. A significant amount of prior research has concentrated on the accuracy assessment and application of precipitation datasets in large-scale regions, such as global, national, and large watershed scales [25,26,27]. However, the precipitation products used for such research are mostly short time series (such as satellite precipitation datasets, mostly after 2000) and low spatial resolution (most global precipitation products have a spatial resolution of 0.1° or above), which cannot capture the continuous high spatial heterogeneity of precipitation in a certain region [28], hindering its application on a local regional scale.
This study selects five long-term and high spatial resolution precipitation datasets over China, namely the dataset of monthly precipitation with a resolution of 1 km in China from 1960 to 2020 (HHU) [29], the high-resolution (1 day, 1 km) and long-term (1961–2019) gridded dataset for temperature and precipitation across China (HRLT) [30], the 1 km monthly precipitation dataset for China (1901–2022) (NWAFU) [31], the China Meteorological Forcing Dataset (CMFD) [32], and the long-term, gauge-based gridded precipitation dataset for the Chinese mainland (CHM_PRE) [33]. They are all classified as the analysis of precipitation datasets obtained from ground observation stations. We evaluated their applicability and accuracy in small areas and urban regions to quantify the spatiotemporal characteristics of precipitation, thereby providing support for investigating the role of precipitation in climate change and human activities. The accuracy of CMFD has been corroborated by various studies focusing on diverse climatic regions over China, such as the arid inland areas of the Northwest [34], the Qilian Mountains [35], the Heihe River Basin [36], the Three Gorges Reservoir [37], as well as the metropolitan vicinity of Beijing [38]. The research indicated that the HHU possesses a higher data accuracy than NWAFU in China and the western region of China [29]. The CHM_PRE has been substantiated as exhibiting relatively lower uncertainty compared to other precipitation datasets across mainland China [39], as well as demonstrating commendable data quality [33]. In previous studies, the five aforementioned precipitation datasets have demonstrated good performance across different regions. However, in the Taihu Basin within the complex hydro-meteorological interactions, further assessment is needed to evaluate their applicability. Therefore, this study aims to assess the applicability of five precipitation datasets in the Hang-Jia-Hu Plain. By employing analysis methods such as correlation evaluation indices, error statistical indices, and comprehensive evaluation indices, this research quantified the differences among five datasets at both annual and monthly scales. Additionally, we compared the spatiotemporal variation characteristics.

2. Materials and Methods

2.1. Study Area

The Hang-Jia-Hu Plain, situated southeast of the Taihu Basin in China, is a characteristic plain river network area spanning a total of 7438 km2, with a water area of 633 km2. The plain possesses a general altitude of 1.6–2.2 m and a river network density of 3.8 km/km2 [40]. Rivers within this plain drain into the Taihu, Huangpu River, and Taipu River, flowing from southwest to northeast. Hang-Jia-Hu experiences a humid subtropical monsoon climate, with a mean annual air temperature of 16 °C and sunlight hours between 1710 and 2100 h [41]. A significant discrepancy in precipitation exists between high-flow years and dry years, ranging from 980 to 2000 mm. The sustained rainfall caused by the May to June rainy season and the short-term heavy rainfall caused by typhoons are often the main reasons for flood disasters in the region. In recent decades, under the background of climate change and urbanization, extreme rainfall events have become frequent, significantly escalating the flood risk by affecting runoff processes and regulating flood storage space [42]. Figure 1 shows the geographical location of Hang-Jia-Hu in the Taihu Lake Basin and the distribution of rainfall observation stations.

2.2. Datasets

2.2.1. Ground Observations

In this study, the daily precipitation data from seven meteorological gauges within the Hang-Jia-Hu, namely HN, HY, HZ, JS, JX, TX, and PH, were sourced from the daily meteorological dataset of basic meteorological elements of China National Surface Weather Station (V3.0). This serves as the benchmark. The time span of the data ranges from 1979 to 2014, ensuring a consistent temporal distribution across all datasets. Moreover, the quality of the dataset was strictly controlled before release.

2.2.2. Gridded Precipitation Datasets

This study aims to evaluate five distinct sets of long-term Chinese precipitation datasets, as outlined in Table 1:
(1) CHM_PRE was based on the daily precipitation observations of 2839 ground gauges across China and nearby regions. On the basis of the traditional construction approach of “precipitation background field + precipitation ratio field”, terrain feature correction and monthly precipitation were applied as constraints. Parameter-elevation Regression on Independent Slopes Model was merged into daily climatology fields, and the inverse distance weighting method was used to interpolate station observations into the ratio field. After cross-validation of 45,992 high-density daily gauge observations from 2015 to 2019, the scheme with the best performance was used to construct a new long-term gauge-based gridded precipitation dataset across mainland China [33,43,44,45].
(2) CMFD, with a 0.1° spatial resolution and 3 h temporal resolution, was founded on Princeton, GLDAS, GEWEX-SRB, and TRMM data. It also incorporates observed data from the National Meteorological Information Center [32,46,47]. Numerous validation studies have shown that this dataset has high accuracy and reasonable consistency with meteorological data measured on the ground.
(3) HHU was calculated using the climate data spatial interpolation software ANUSPLIN4.4 based on precipitation data from over 2400 meteorological stations in China from the same period, and validation was carried out using observed precipitation data and China Hydrological Yearbook [29,48].
(4) HRLT was interpolated using machine learning, generalized additive models, and the thin-plate spline method. The dataset is rooted in the National Meteorological Information Center’s 0.5° × 0.5° gridded dataset and covariates such as elevation, aspect, slope, topographic wetness index, latitude, and longitude. Its accuracy was evaluated using observed data from meteorological stations [30,49].
(5) NWAFU was based on the global CRU climate dataset published by the National Center for Atmospheric Science in the UK and the global high-resolution climate dataset published by the WorldClim Global Climate Database. The dataset was downscaled in China using the Delta spatial downscaling scheme and validated using data from 496 meteorological observation points [31,50].
Table 1. Main characteristics of precipitation datasets.
Precipitation DatasetsTime SeriesSpatial
Resolution
Temporal
Resolution
Reference
CHM_PRE1961–20220.1 degreesDaily[33]
CMFD1979–20180.1 degrees3-Hourly[32]
HHU1960–20201 kmMonthly[29]
HRLT1961–20191 kmDaily[30]
NWAFU1901–20221 kmMonthly[31]
CHM_PRE represents the long-term, gauge-based gridded precipitation dataset for the Chinese mainland; CMFD represents the China Meteorological Forcing Dataset; HHU represents the dataset of monthly precipitation with resolution of 1 km in China from 1960 to 2020; HRLT represents the high-resolution (1 day, 1 km) and long-term (1961–2019) gridded dataset for temperature and precipitation across China; NWAFU represents the 1 km monthly precipitation dataset for China (1901–2022).

2.3. Methods

To quantitatively evaluate the accuracy of five precipitation datasets, this study employs five primary indicators to measure the correlation and difference between the datasets and observed data. Consistent with the observed precipitation data, the evaluation time range is from 1979 to 2014. These indicators include the Pearson correlation coefficient (R), root mean square error (RMSE), mean error (ME), Nash–Sutcliffe efficiency (NSE), and the CCHZ-DISO Big Data Evaluation System (DISO). The R and NSE values closer to 1 and RMSE and ME values closer to 0 indicate higher consistency between the datasets and observed data. DISO mainly utilizes the above-mentioned four statistical indicators to construct a Euclidean space. Here, the distance between the evaluated results and observed data is normalized using dimensional statistical indicators, enabling a comprehensive accuracy assessment of the dataset [51]. A value closer to 0 indicates a superior evaluation. Table 2 provides the formulas for calculating the five indicators.

3. Results

3.1. Evaluation of Precipitation Datasets at Different Time Scales

3.1.1. Annual Scale

Figure 2 shows the comparison of precipitation at the annual scale between the five precipitation datasets and gauge observations. Firstly, there are significant differences in NSE among different precipitation datasets at different sites on an annual scale, in which CHM_PRE and CMFD have large differences in NSE values. For example, the NSE of CHM_PRE is above 0.95 at JS, JX, HZ, and TX, but less than 0 at PH. Similarly, the NSE of CMFD is also above 0.95 at HZ and PH, but nearly 0 at HN. The differences in NSE among HHU, HRLT, and NWAFU are relatively small at each site, and both HRLT and HHU have NSE values higher than 0.47 at 7 sites. Overall, HRLT has the highest credibility in annual precipitation among the five datasets, with an NSE value of 0.75. CHM_PRE follows, with an NSE value of 0.74, while NWAFU has the lowest NSE value of 0.28 (Table 3).
The annual precipitation of the five datasets is sorted from lowest to highest according to RMSE as follows: HRLT, CHM_PRE, HHU, CMFD, and NWAFU. CHM_PRE has the lowest RMSE at HN, JS, JX, HZ, and TX, but the highest RMSE at PH. HHU has the lowest RMSE at the HY station, while CMFD has the lowest RMSE at the PH station. Although HRLT did not show the lowest error at any specific site, it had the lowest RMSE across the whole area, with a value of 118.28 mm/yr. Besides, analysis of the ME calculation results reveals that HHU and CMFD exhibit an overestimation characteristic, while NWAFU shows an underestimation phenomenon at all sites. HRLT and CHM_PRE exhibit different deviations at different sites, with ME values of −6.49 mm/yr and −41.79 mm/yr, respectively.
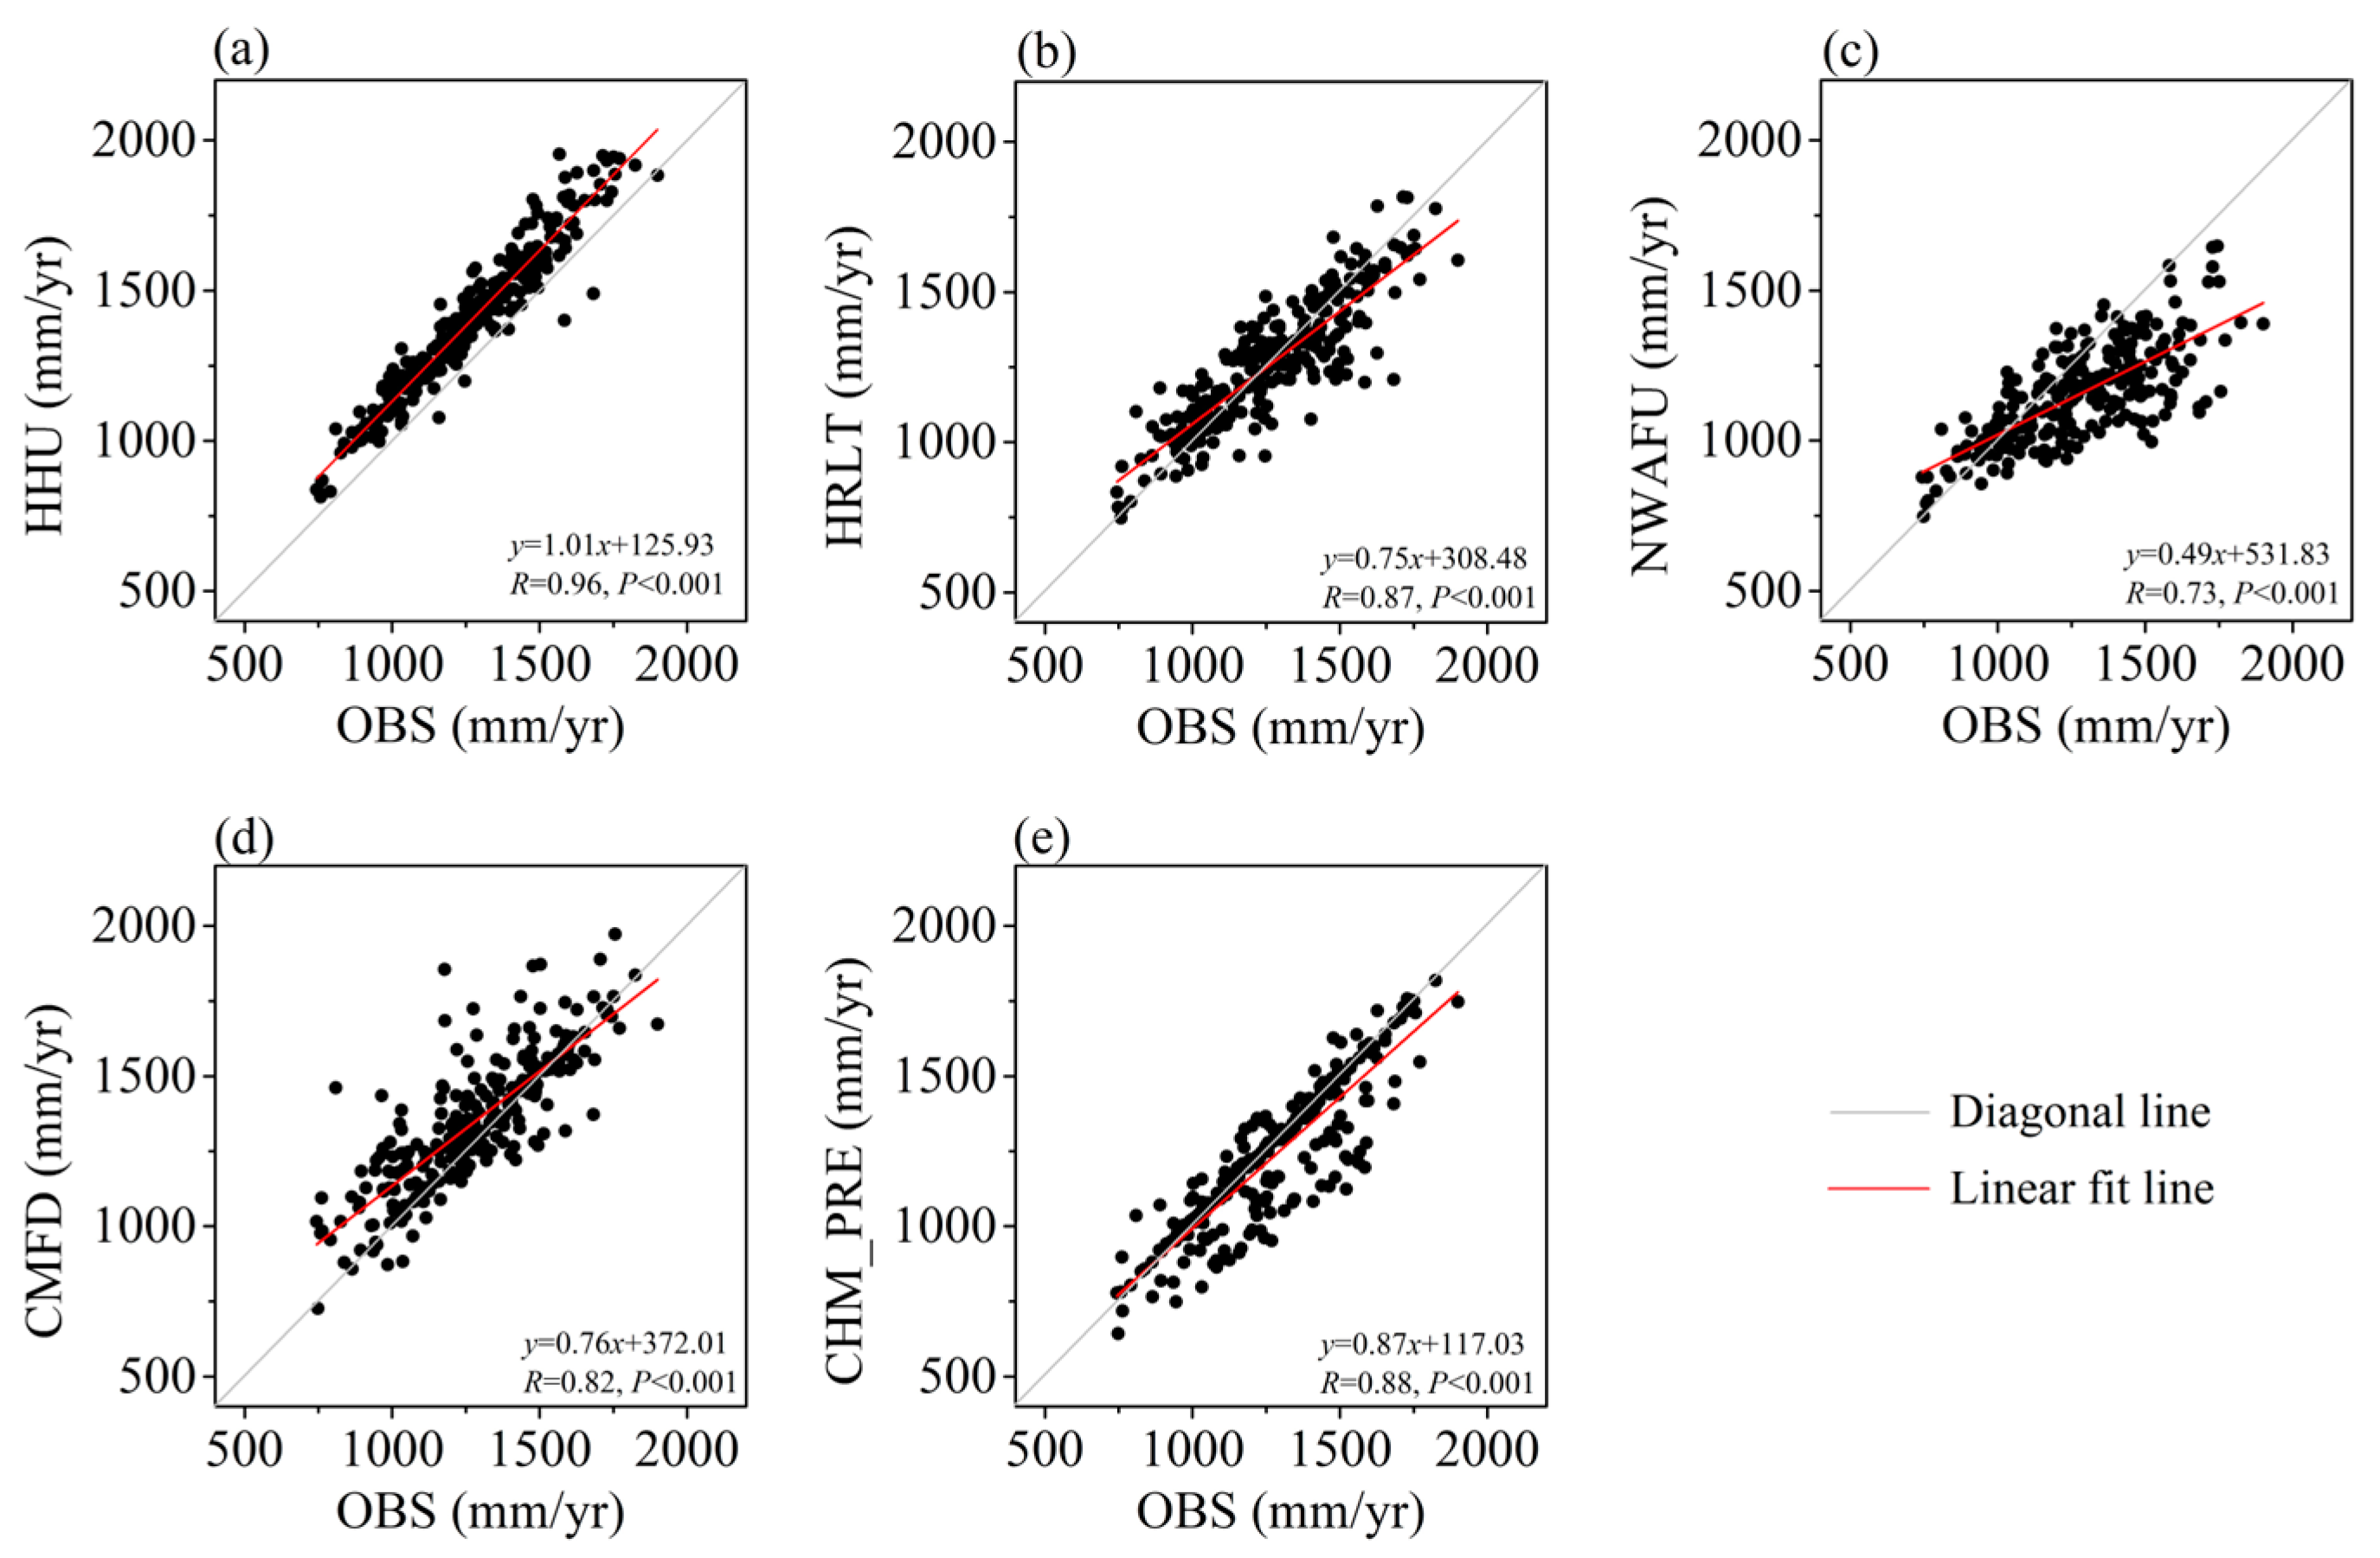
Figure 3 shows the correlation between the values of precipitation datasets and gauge observations. All datasets have an R value exceeding 0.63 at 7 sites (p < 0.001), in which HHU shows the highest consistency with the observed data, with an R value of 0.96, followed by CHM_PRE and HRLT, with values of 0.88 and 0.87, respectively. In addition, NWAFU has the lowest correlation with the observed data, with an R value of 0.73.
Based on the four evaluation indicators mentioned above, the DISO of the five precipitation datasets are developed to represent comprehensive performance. CHM_PRE has the minimum value DISO among HZ, JS, JX, HZ, and TX, while HY has the optimal DISO value for HHU. CMFD has the lowest DISO value for PH. Overall, the DISO values of the precipitation datasets on the annual scale are ranked as HRLT, CHM_PRE, HHU, CMFD, and NWAFU from smallest to largest. Therefore, HRLT demonstrates excellent comprehensive performance, followed by CHM_PRE.

3.1.2. Monthly Scale

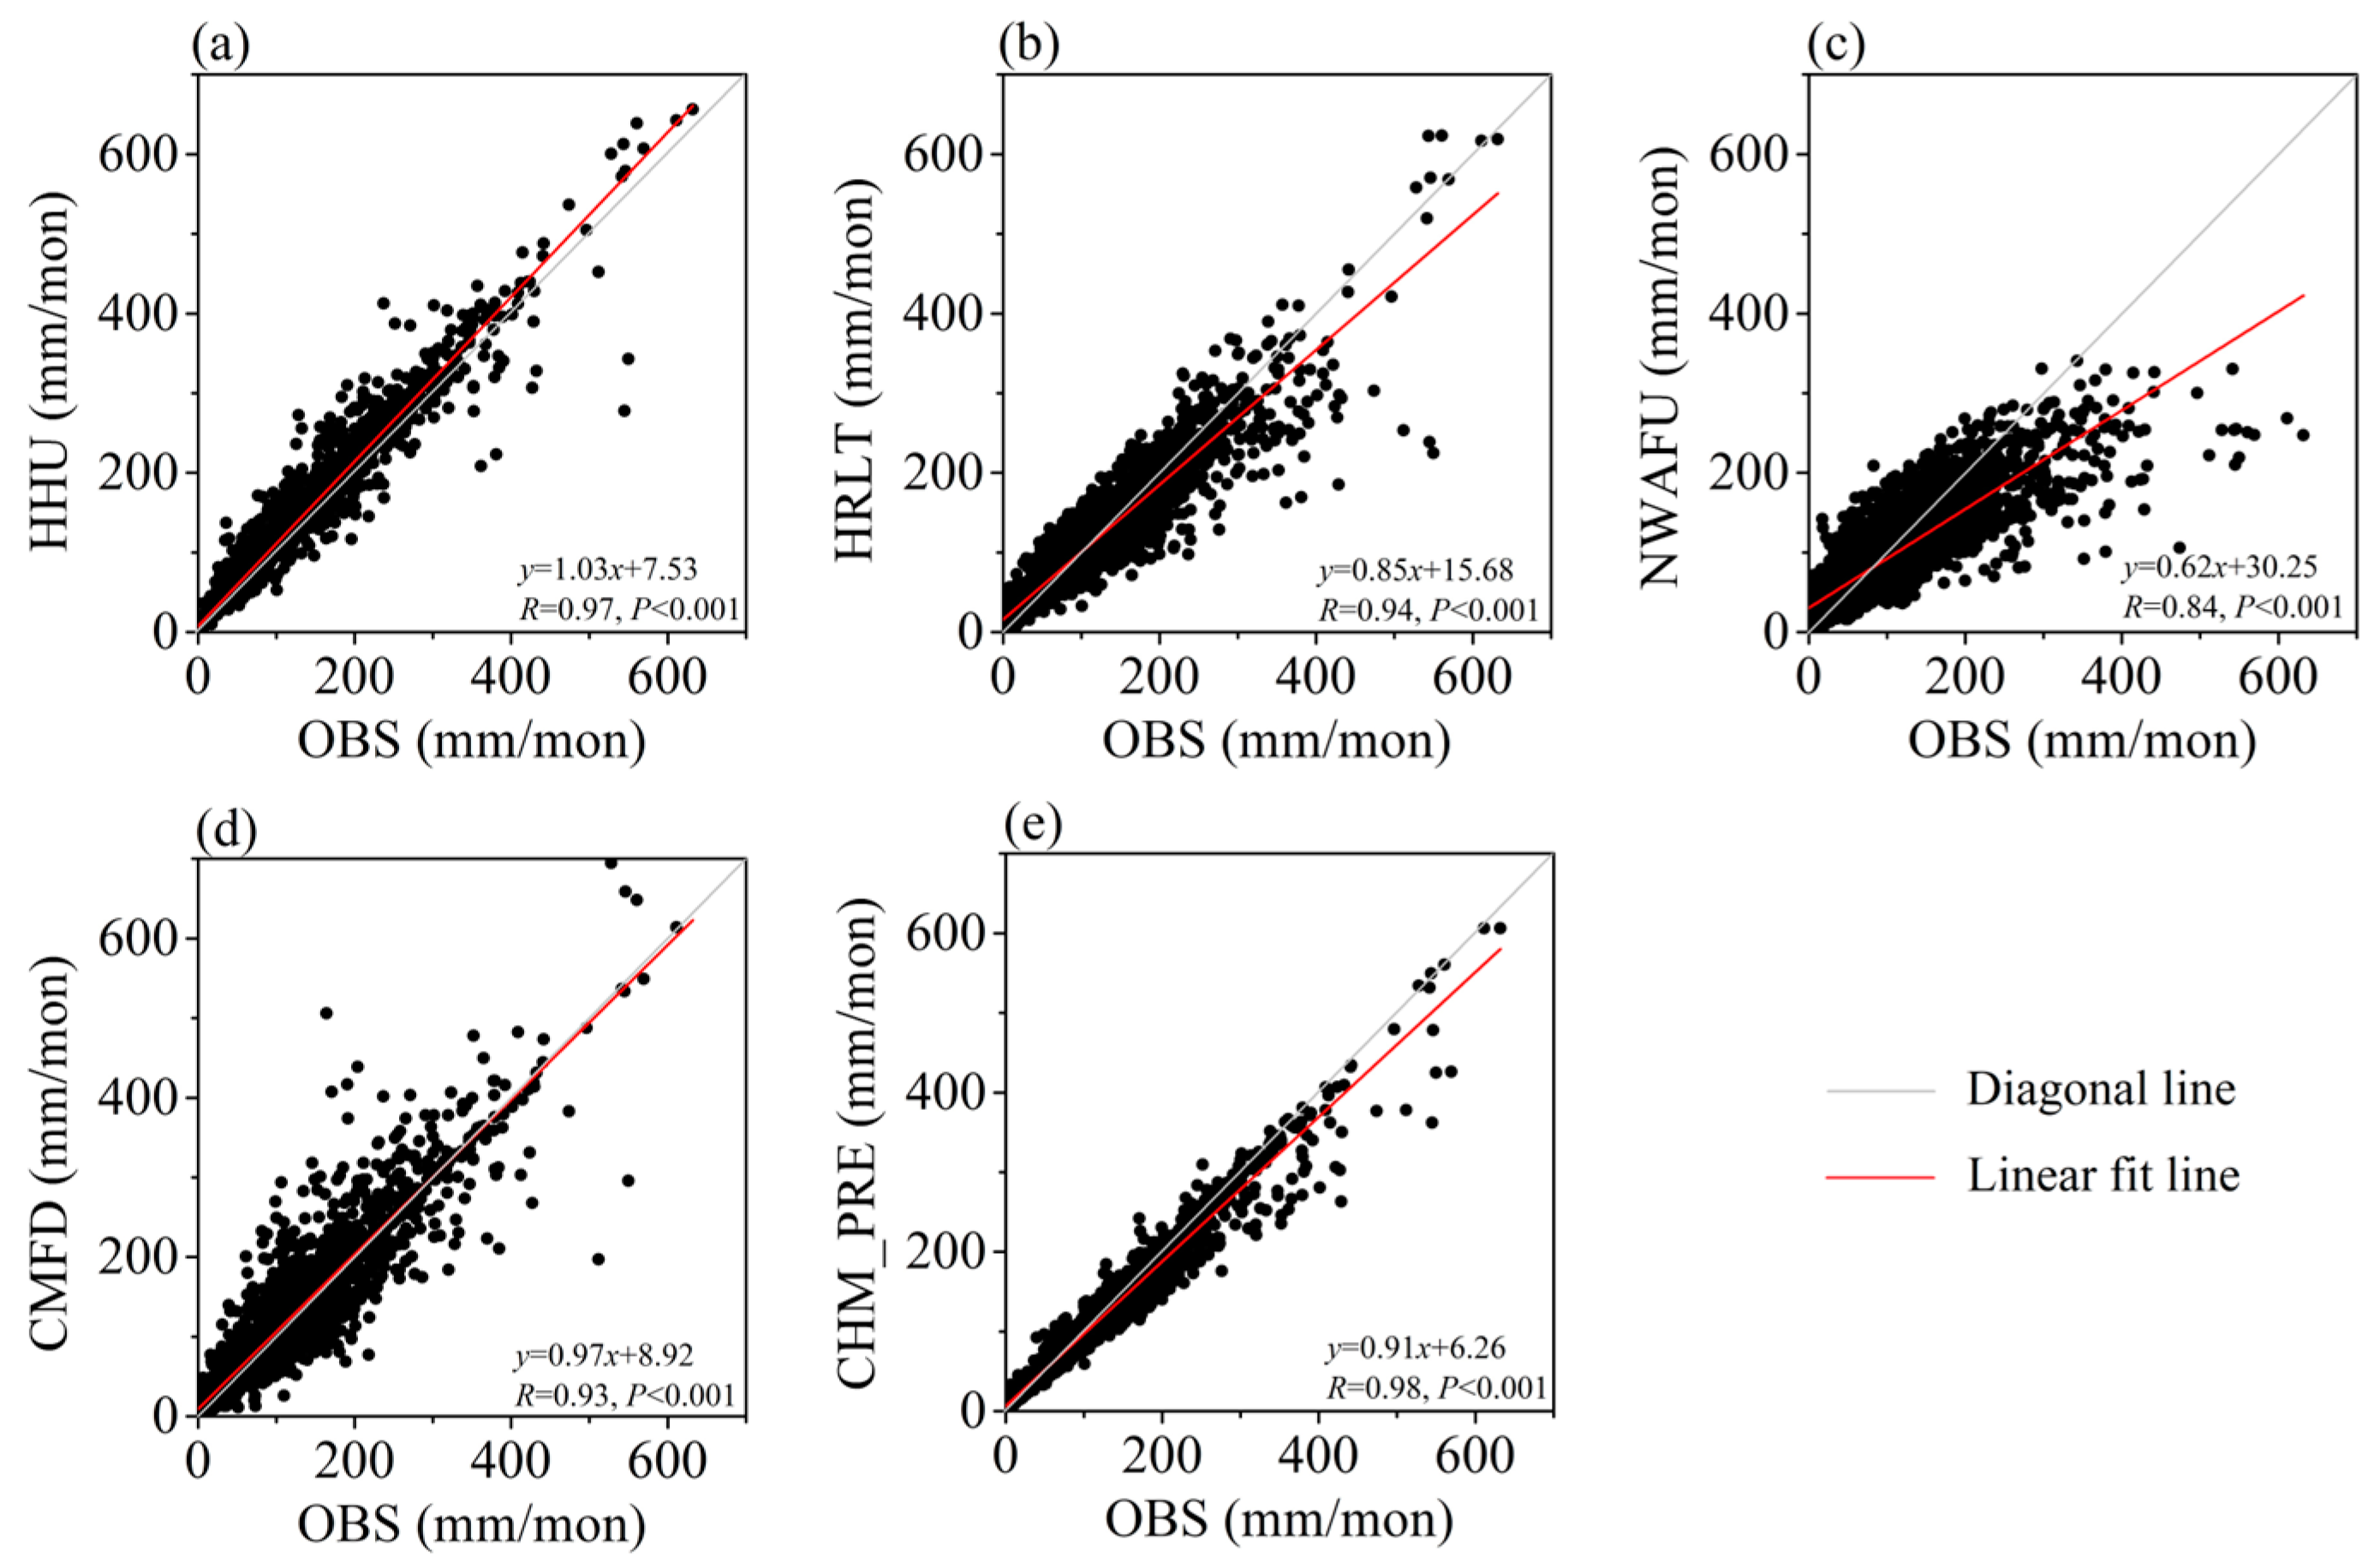
An analysis of the applicability of the five precipitation datasets for monthly precipitation at seven sites in Hang-Jia-Hu is shown in Figure 4. All five datasets reached high values of NSE at all sites, with CMFD performing the highest at PH and CHM_PRE having the highest value at the other stations. HHU, HRLT, and CHM_PRE indicate high data reliability, with NSE greater than 0.83 at all sites. In contrast, NWAFU has the lowest NSE values among all sites, less than 0.75. The RMSE performance of each precipitation dataset is consistent with NSE at different stations, with the RMSE distribution of HHU ranging from 19.04 to 26.36 mm/mon and the RMSE distribution of HRLT ranging from 24.05 to 34.63 mm/mon. The RMSE difference between these two datasets at each station is small and at a relatively low level of error. Although NWAFU has similar RMSE values at each site, the values are all greater than 40 mm/mon. CMFD and CHM_PRE have large differences in RMSE at different sites, ranging from 7 to 30 mm/mon. As shown in Figure 5, the R between precipitation datasets and observed data is above 0.80 at all sites; moreover, HHU and CHM_PRE exceed 0.95. In addition, CMFD performs best at PH with the smallest DISO. CHM_PRE has the smallest DISO value at the other sites. The DISO values of the other datasets are also below 0.7.
Overall, all datasets indicate high accuracy with high correlation and low bias (Table 4). The NSE values of the five datasets are all larger than 0.6, with CHM_PRE and HHU reaching 0.96 and 0.92, respectively. CHM_PRE has the smallest RMSE value, followed by HHU. HRLT, NWAFU, and CHM_PRE exhibit some underestimation, while HHU and CMFD show some degree of overestimation. CHM_PRE reached the highest R, with the value of 0.98, and NWAFU had the lowest R, with 0.84, indicating significant correlation between datasets and gauge observations. Based on the DISO, the comprehensive performance of the five datasets is ranked from highest to lowest as CHM_PRE, HHU, HRLT, CMFD, and NWAFU.

3.2. Differences in Spatiotemporal Characteristics of Precipitation Datasets

3.2.1. Differences in the Trend and Properties of Precipitation

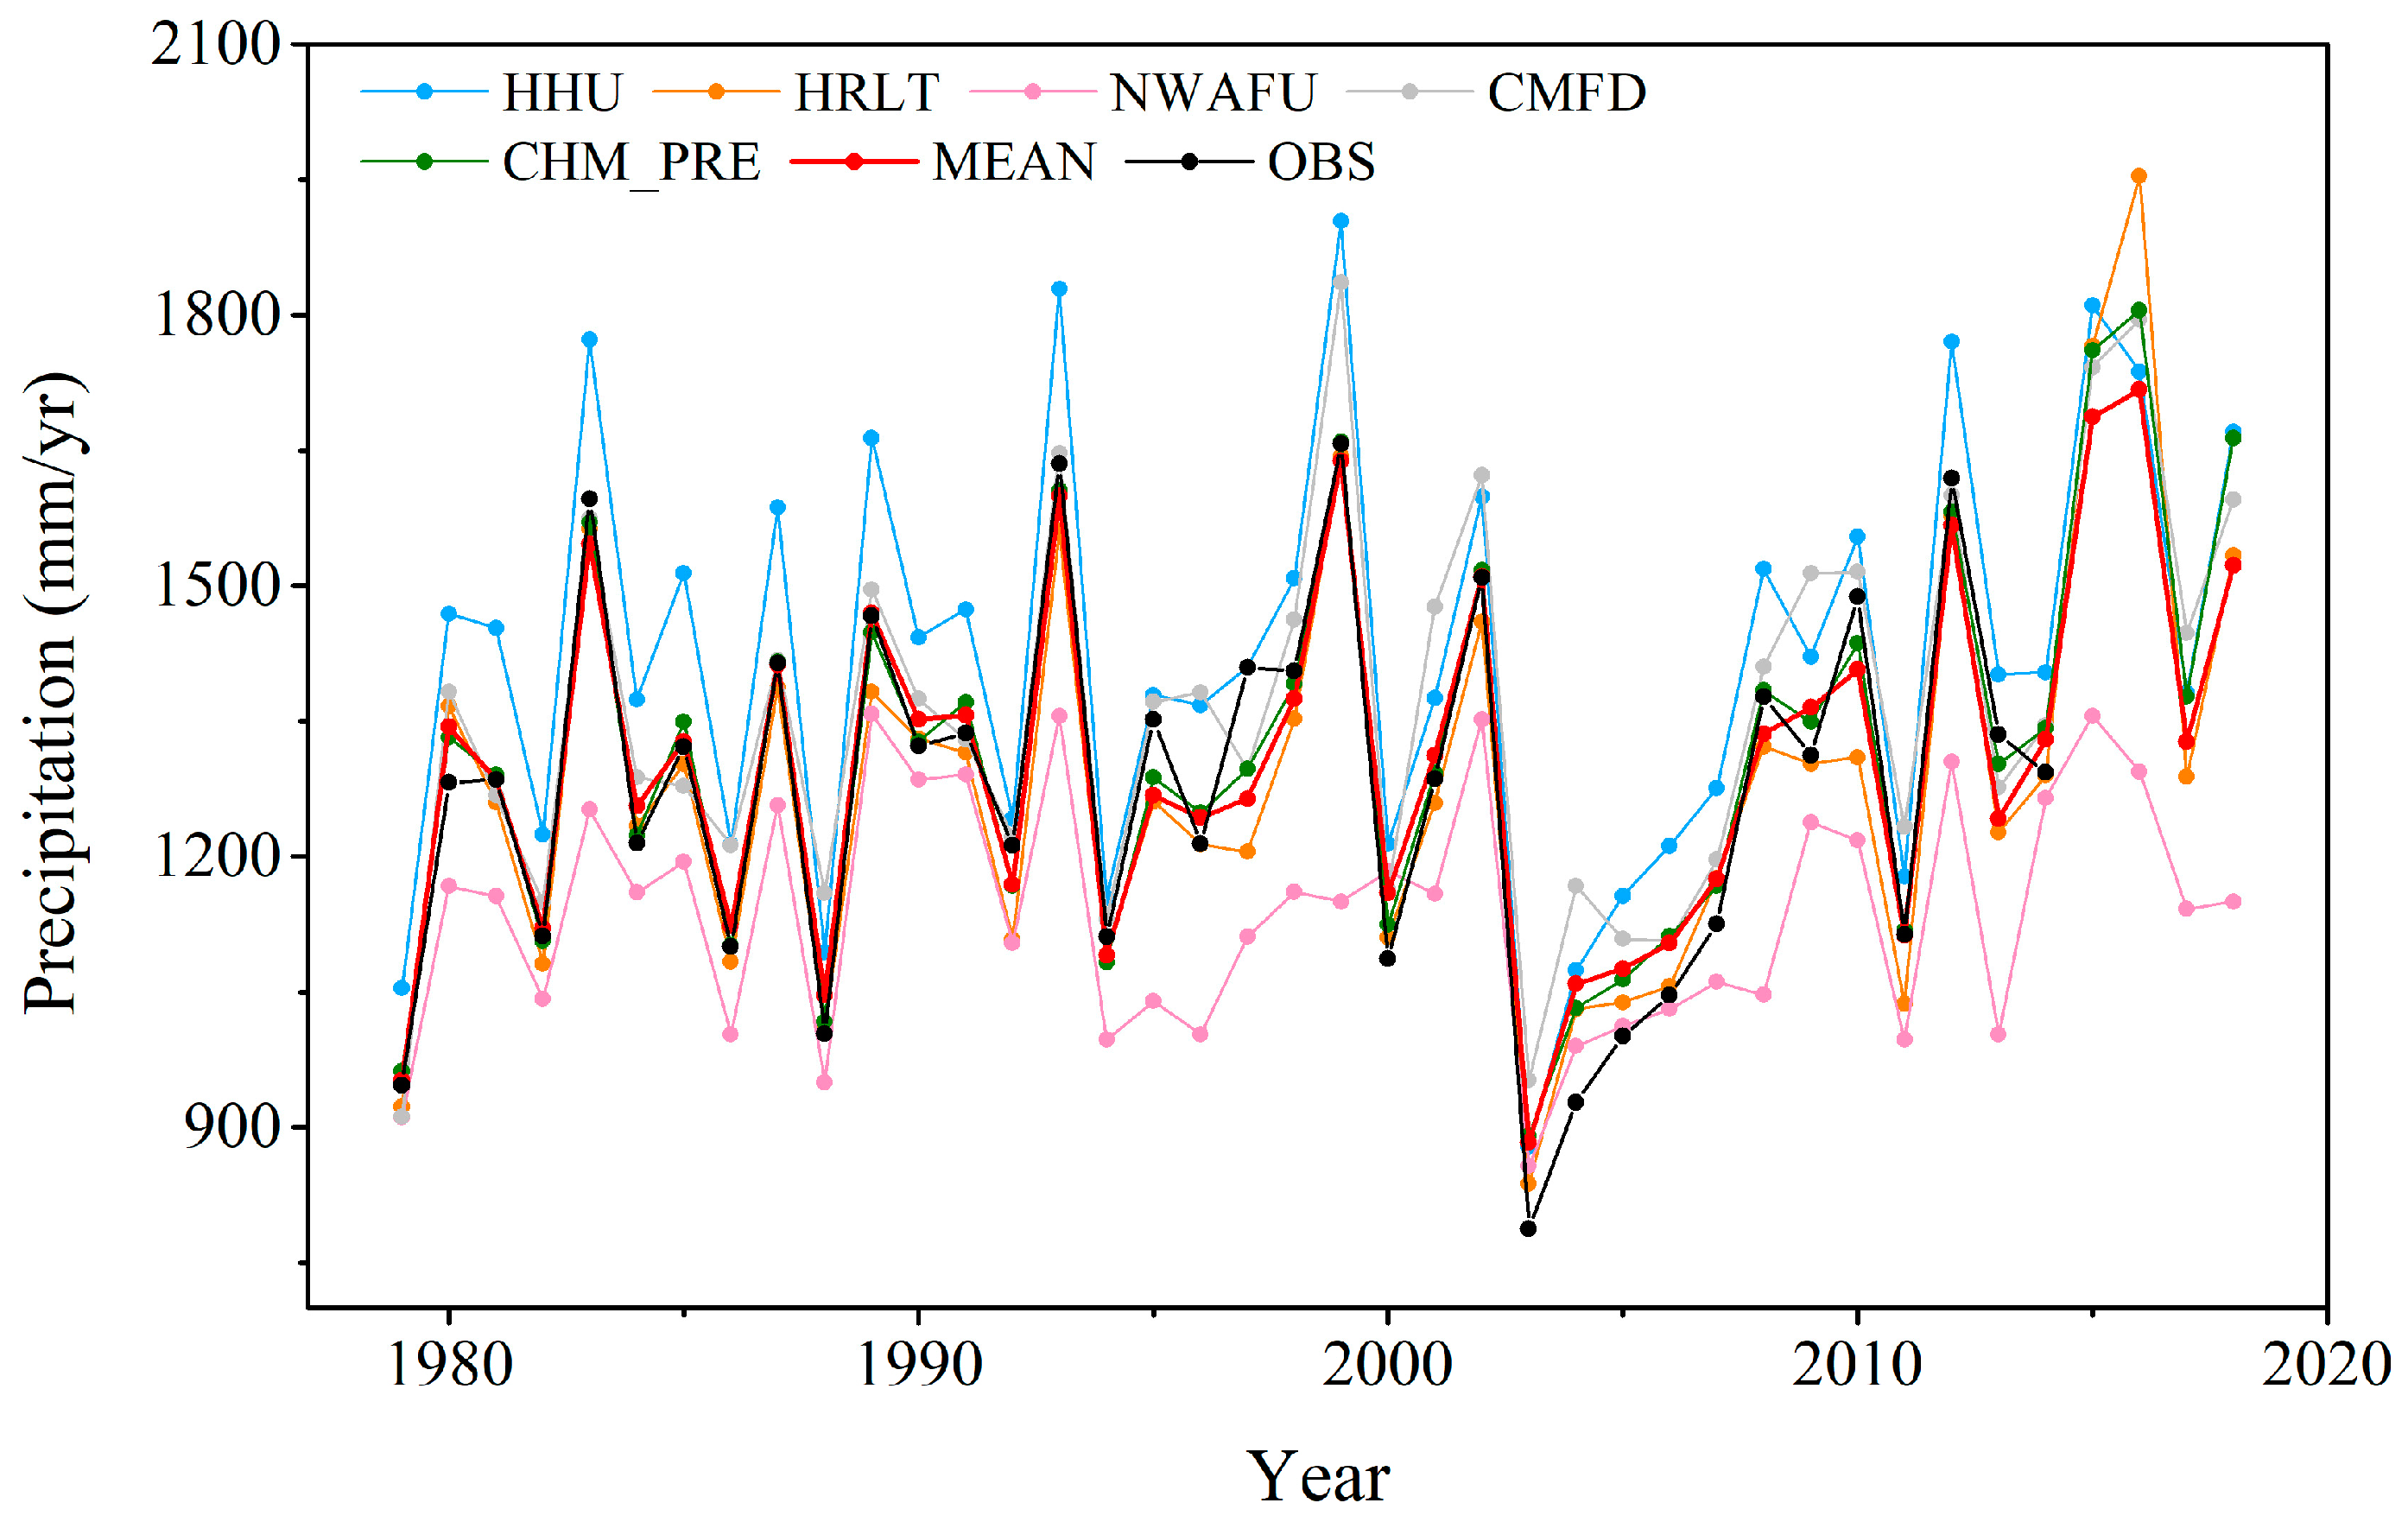
Figure 6 compares the five datasets in the annual series from 1979 to 2018. The characteristic of interannual variation is basically consistent, while there are slight differences in some years. For example, from 1997 to 2000, the annual precipitation of NWAFU showed a significant increasing trend, while other datasets first increased and then decreased. In terms of the interannual trend, HHU, HRLT, and NWAFU showed non-significant increasing trends of 2.96 mm/yr, 5.13 mm/yr, and 0.99 mm/yr, respectively (p > 0.1), while CMFD and CHM_PRE showed significant increases at rates of 6.04 mm/yr and 5.85 mm/yr, respectively (p < 0.05).
HHU has the highest average annual precipitation among the multi-year averages, with 1419.04 mm, followed by CMFD, CHM_PRE, and HRLT, which were 1361.48 mm, 1314.37 mm, and 1281.27 mm, respectively. The lowest value was 1140.23 mm for NWAFU. The difference between the maximum and minimum multi-year average annual precipitation values for each dataset was 278.81 mm, with a maximum difference of 753.67 mm in 1999 and a minimum difference of 103.53 mm in 2000. In addition, the average of the five datasets indicated that Hang-Jia-Hu showed a non-significant increasing trend at a rate of 4.19 mm/yr from 1979 to 2018, with a multi-year average annual precipitation of 1303.28 mm.
Figure 7 shows the characteristics of monthly and seasonal precipitation of the five datasets from 1979 to 2018. HHU, HRLT, CMFD, and CHM_PRE exhibit a monthly multimodal distribution, with the highest peak occurring in June, exceeding 200 mm. Moreover, the second-highest peak occurs in August, with the value of precipitation ranging from 147.88 mm to 182.84 mm. The third small peak appears in March, with precipitation approaching 120 mm. Unlike other datasets, NWAFU only shows one significant peak in June, with a minimum in October, where the precipitation is only 41.45 mm, while other datasets exceed 70 mm in October. On average, the characteristics of monthly precipitation in Hang-Jia-Hu show a multi-peak pattern, with the highest and lowest peak occurring in June and December, respectively. The multi-year average seasonal precipitation of all datasets exhibits a characteristic of decreasing sequentially from summer to spring, autumn, and winter. HHU shows the highest values in spring, summer, and autumn, while CMFD has the highest value in winter. NWAFU consistently shows the lowest values across all seasons, with the largest difference from HHU occurring in summer and reaching up to 115.59 mm. Except for summer, HRLT and CHM_PRE demonstrate a high degree of consistency, with differences within 6 mm.

3.2.2. Spatial Distribution Comparison

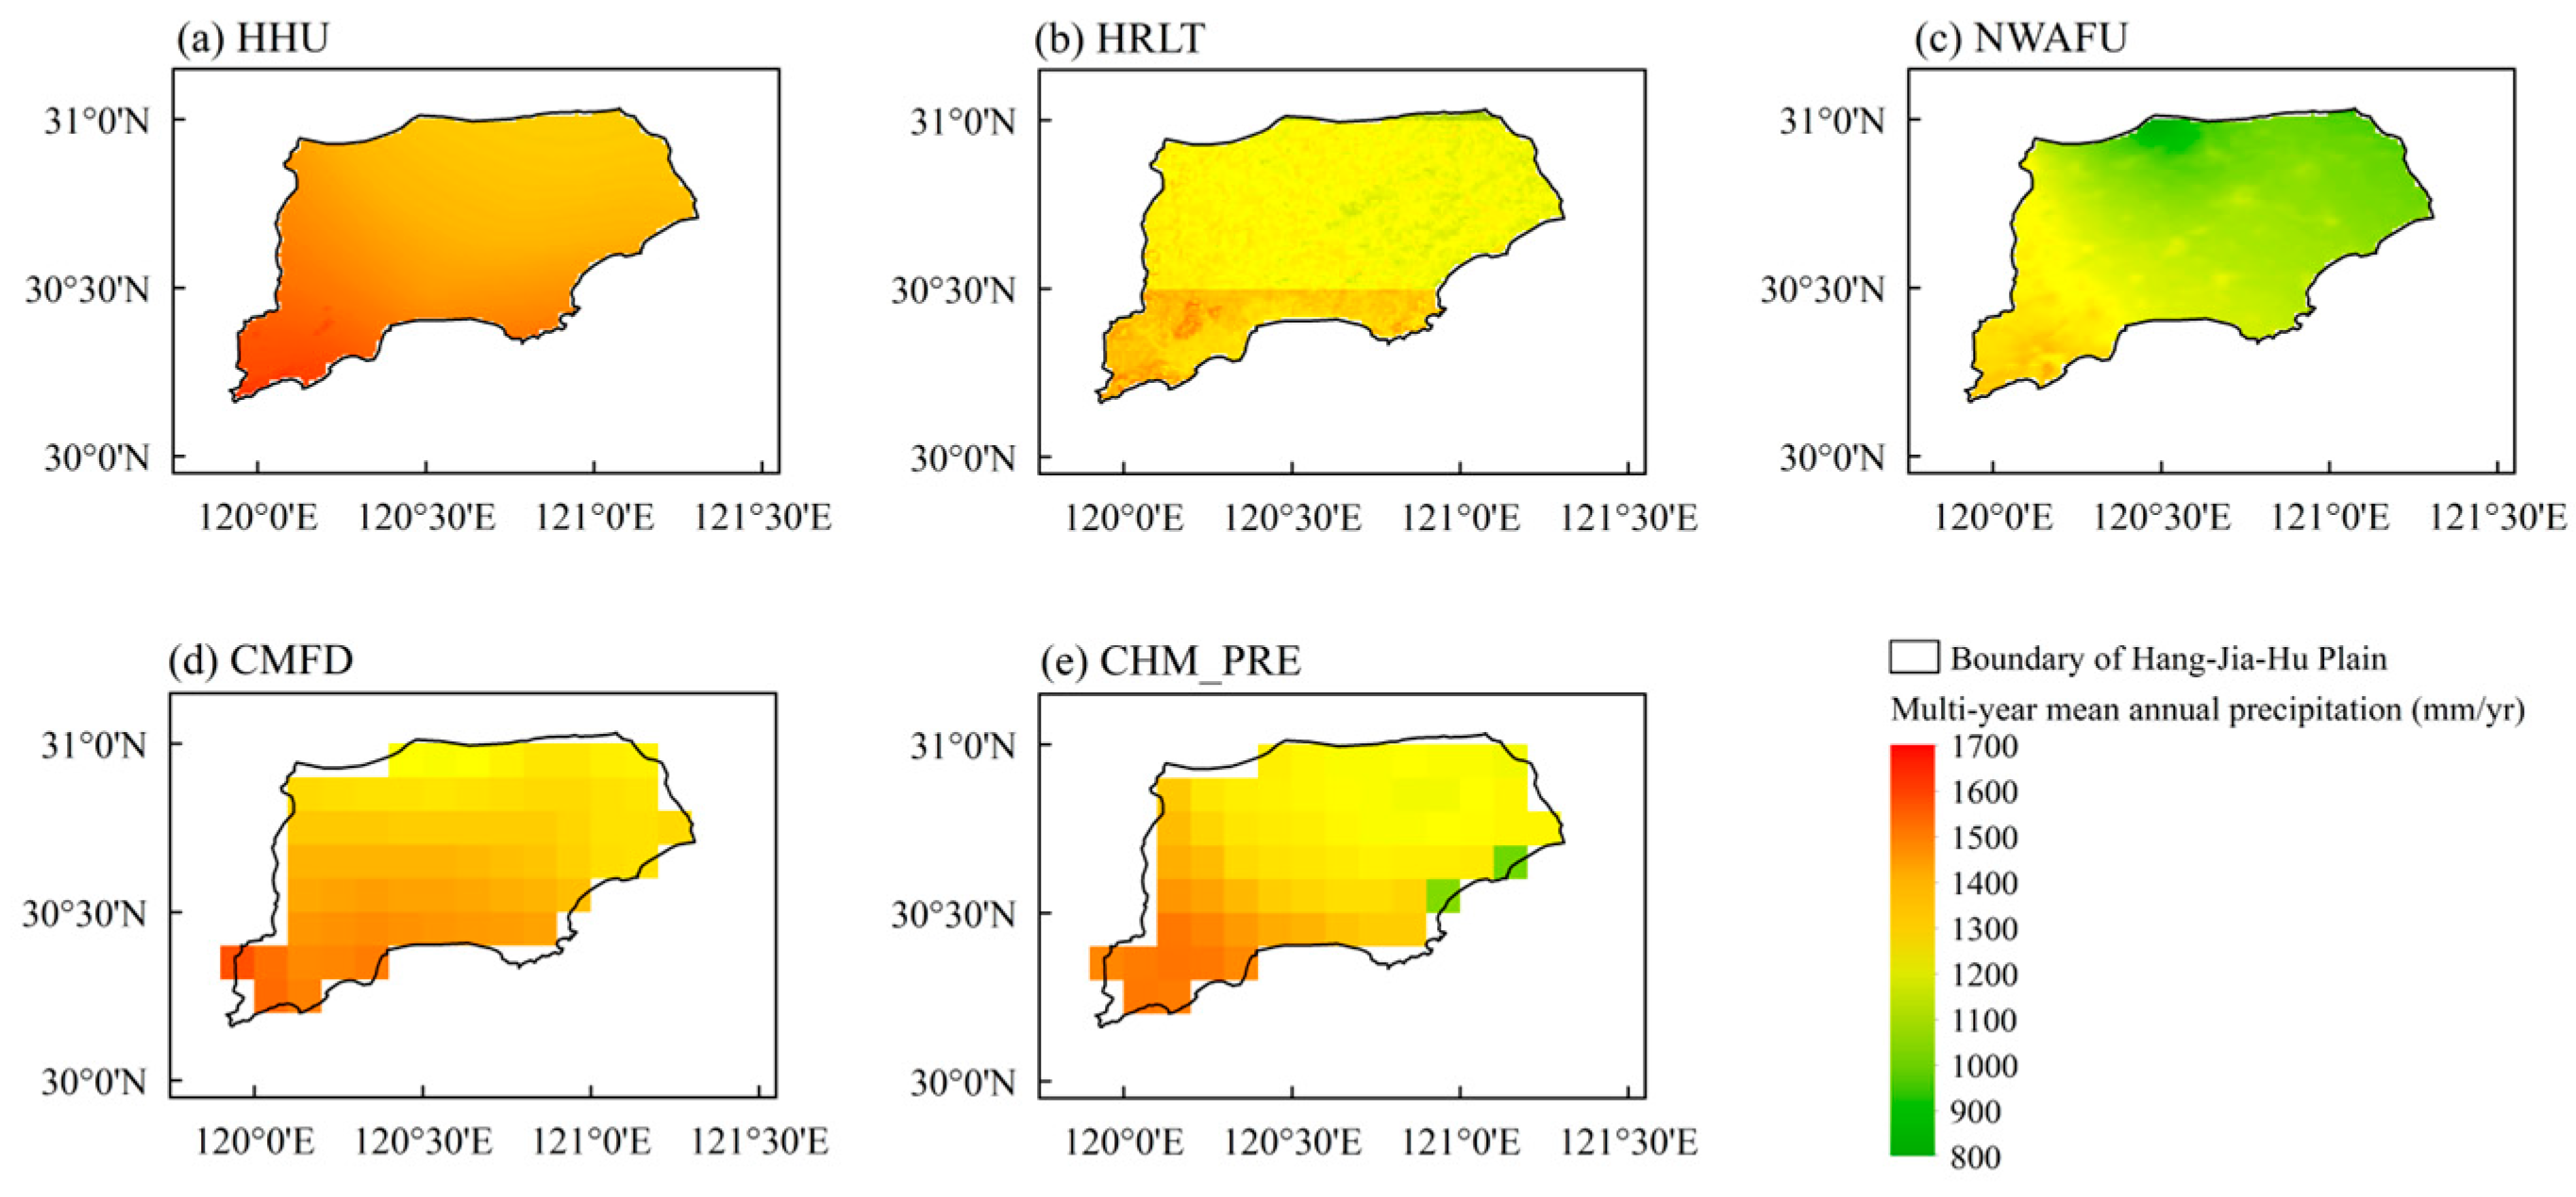
Figure 8 shows the spatial distribution of annual precipitation in Hang-Jia-Hu from 1979 to 2018 based on the five precipitation datasets. The datasets all exhibit the characteristic of spatial distribution decreasing from southwest to northeast in Hang-Jia-Hu, but there are significant differences in annual precipitation among different regions. In the southwest, the annual precipitation of HHU is between 1500 and 1650 mm, while it is concentrated between 1300 and 1400 mm in most regions of the central, northern, and northeastern Plain. The western and southern regions are mostly around 1400 mm. HRLT has annual precipitation exceeding 1300 mm in the southwestern and southern regions in the Plain, while in other regions, it is between 1200 and 1300 mm. Compared to the other datasets, NWAFU generally has lower results. In the southwestern and western regions, it is mostly between 1200 and 1400 mm, and in the northern lakeside area, it is below 1000 mm, while in other regions, it mainly appears within the range of 1000–1200 mm. CMFD and CHM_PRE have a high consistency in spatial distribution, but CMFD is higher than CHM_PRE in most areas.
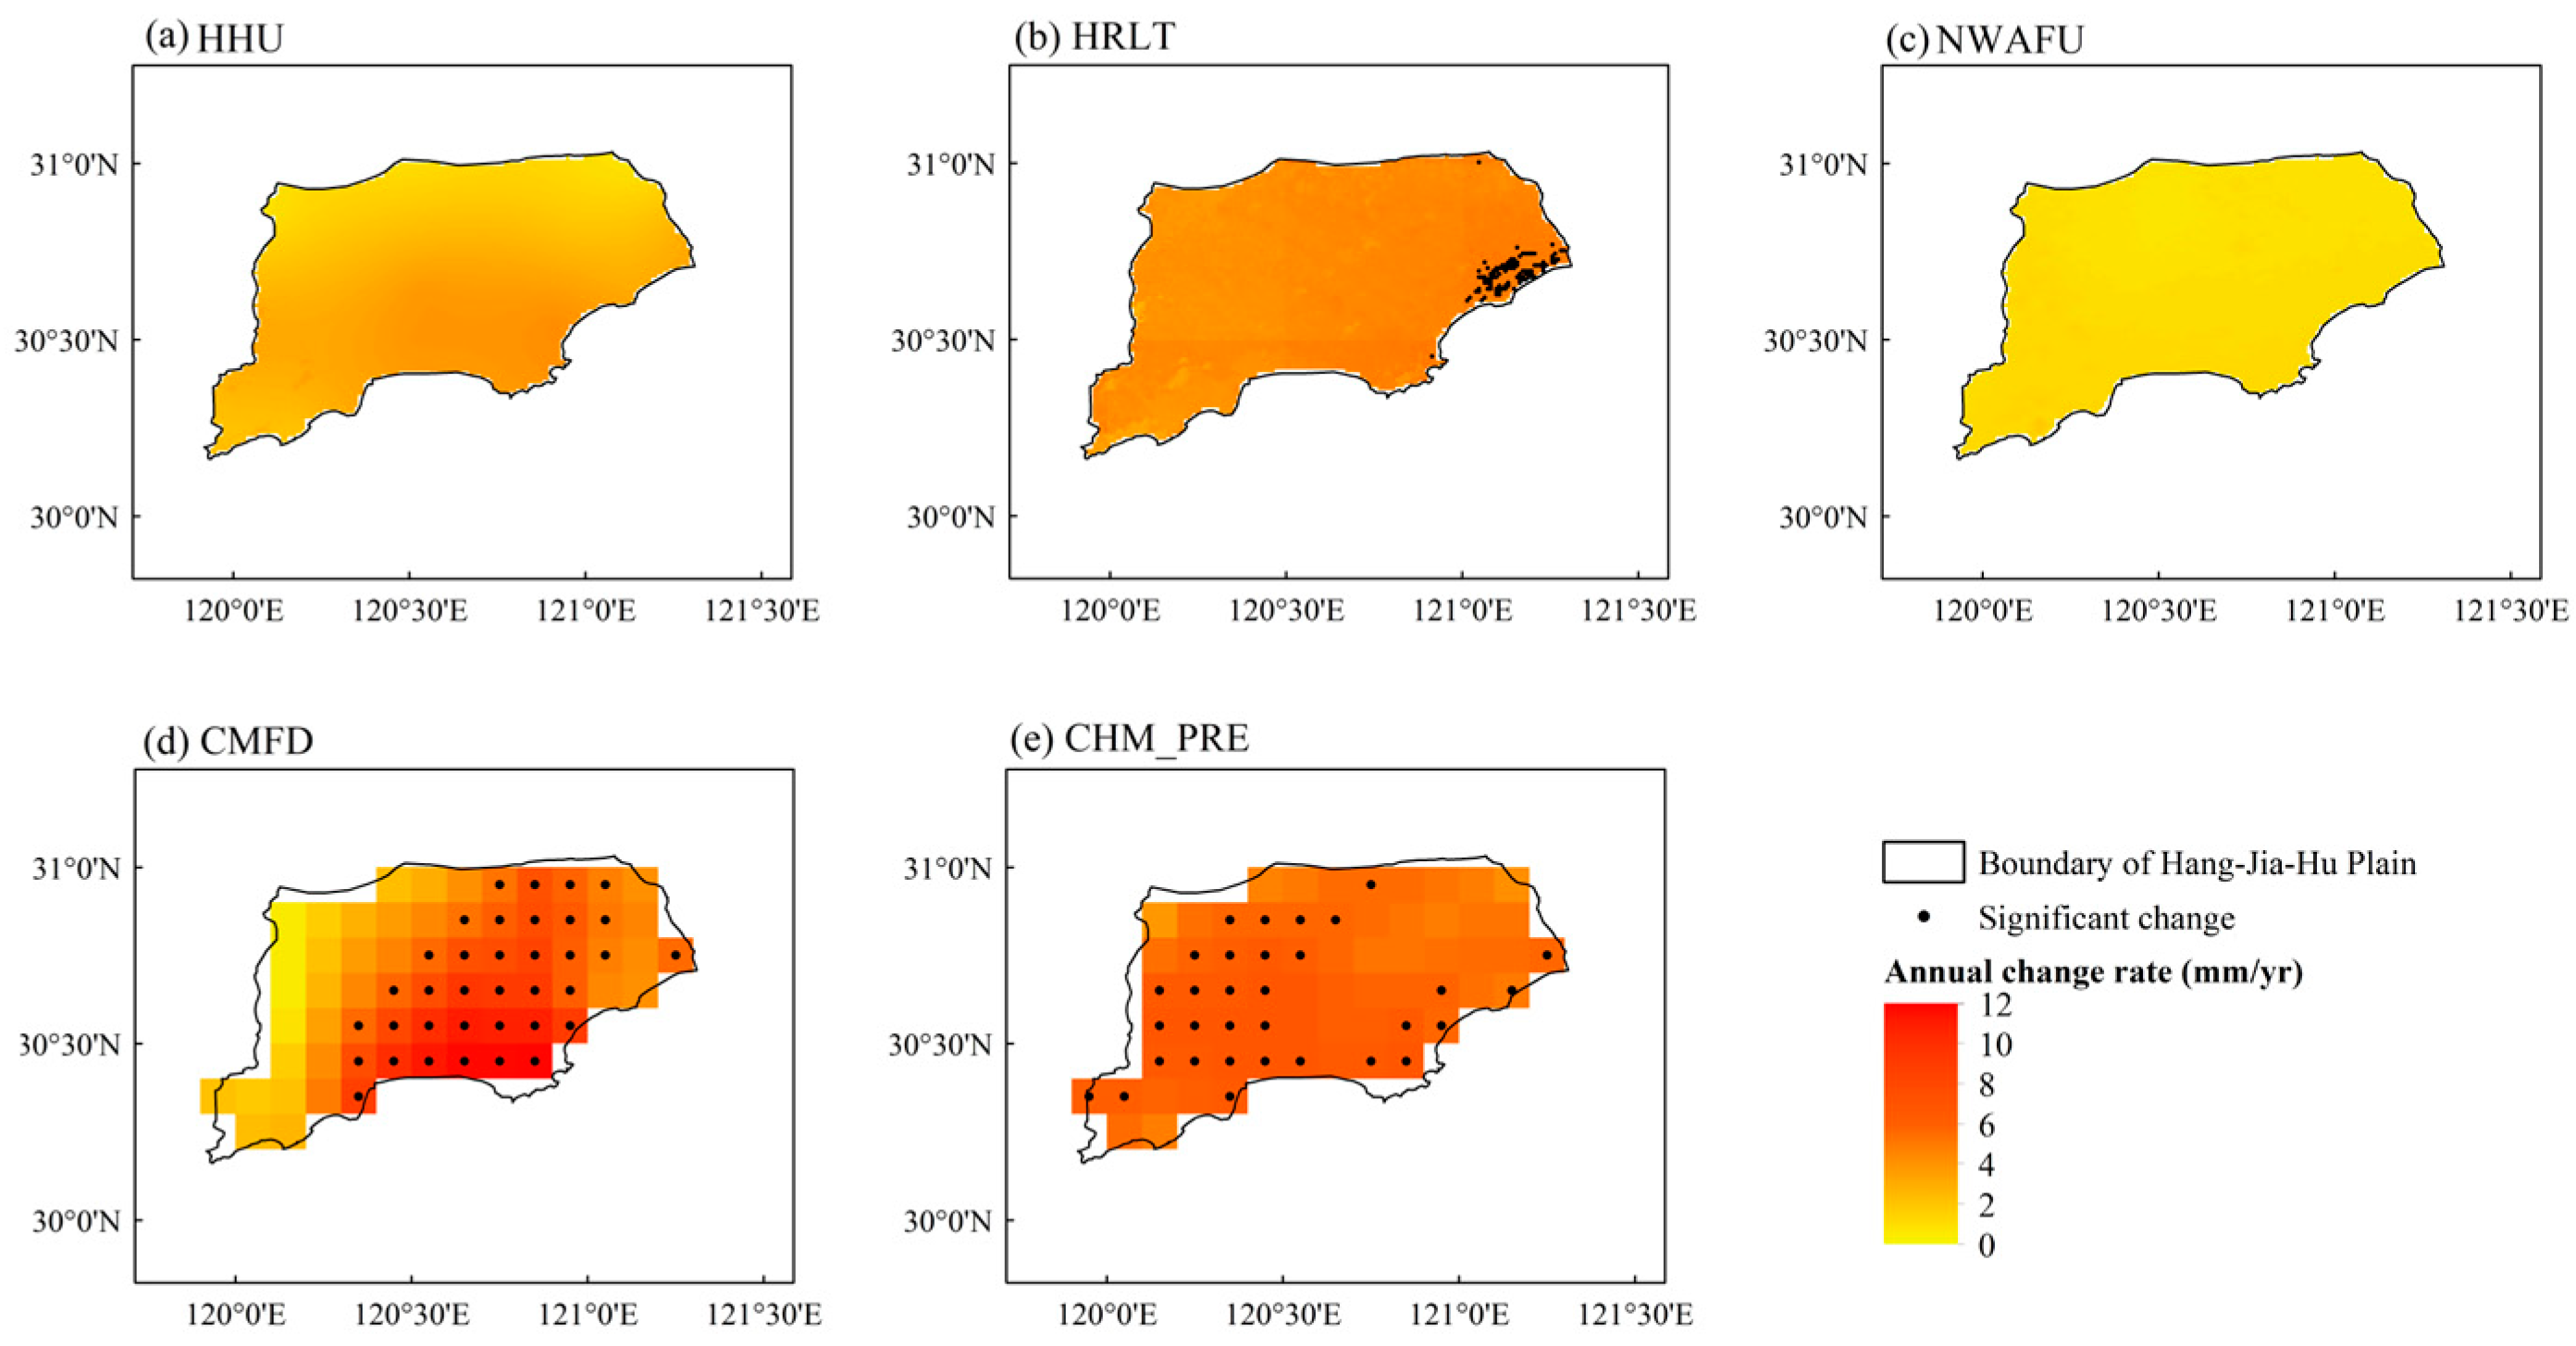
By using simple linear regression analysis and the least squares method, the characteristic of precipitation in Hang-Jia-Hu from 1979 to 2018 was analyzed, and the significance was also analyzed using the F test (Figure 9). The results showed that the interannual variability of precipitation in HHU and NWAFU did not show a significant increase across the entire region. The interannual growth rate of HHU ranged from 0.8 to 4.8 mm/yr, with higher growth rates in the central and southern parts. The interannual growth rate of NWAFU did not exceed 2 mm/yr in the study area. HRLT showed a significant increase (p < 0.05) in annual precipitation in some regions of the eastern Hang-Jia-Hu, while there was a non-significant increase in other regions. The interannual variability rate of HRLT ranged from 3.0 to 6.4 mm/yr, with higher growth rates concentrated in the eastern and southeastern regions and lower growth rates distributed in the southwestern edge, western, and northwestern regions. CMFD showed a large spatial difference in annual precipitation changes, with significant increases in the northern, central, and southern regions, especially in the southern region exceeding 10 mm/yr, while in areas with non-significant increasing trends, the interannual growth rate was below 5 mm/yr and less than 3 mm/yr in the western and southwestern regions. The interannual growth rate of CHM_PRE was similar to HRLT, with areas showing a significant increasing trend in annual precipitation mainly concentrated in the southeastern, southern, western, and northwestern regions. In summary, although the annual precipitation of the five datasets showed an increasing trend in Hang-Jia-Hu, there were large differences in the magnitude of the growth rates and spatial distribution.

3.3. Differences in the Frequency of Precipitation Events

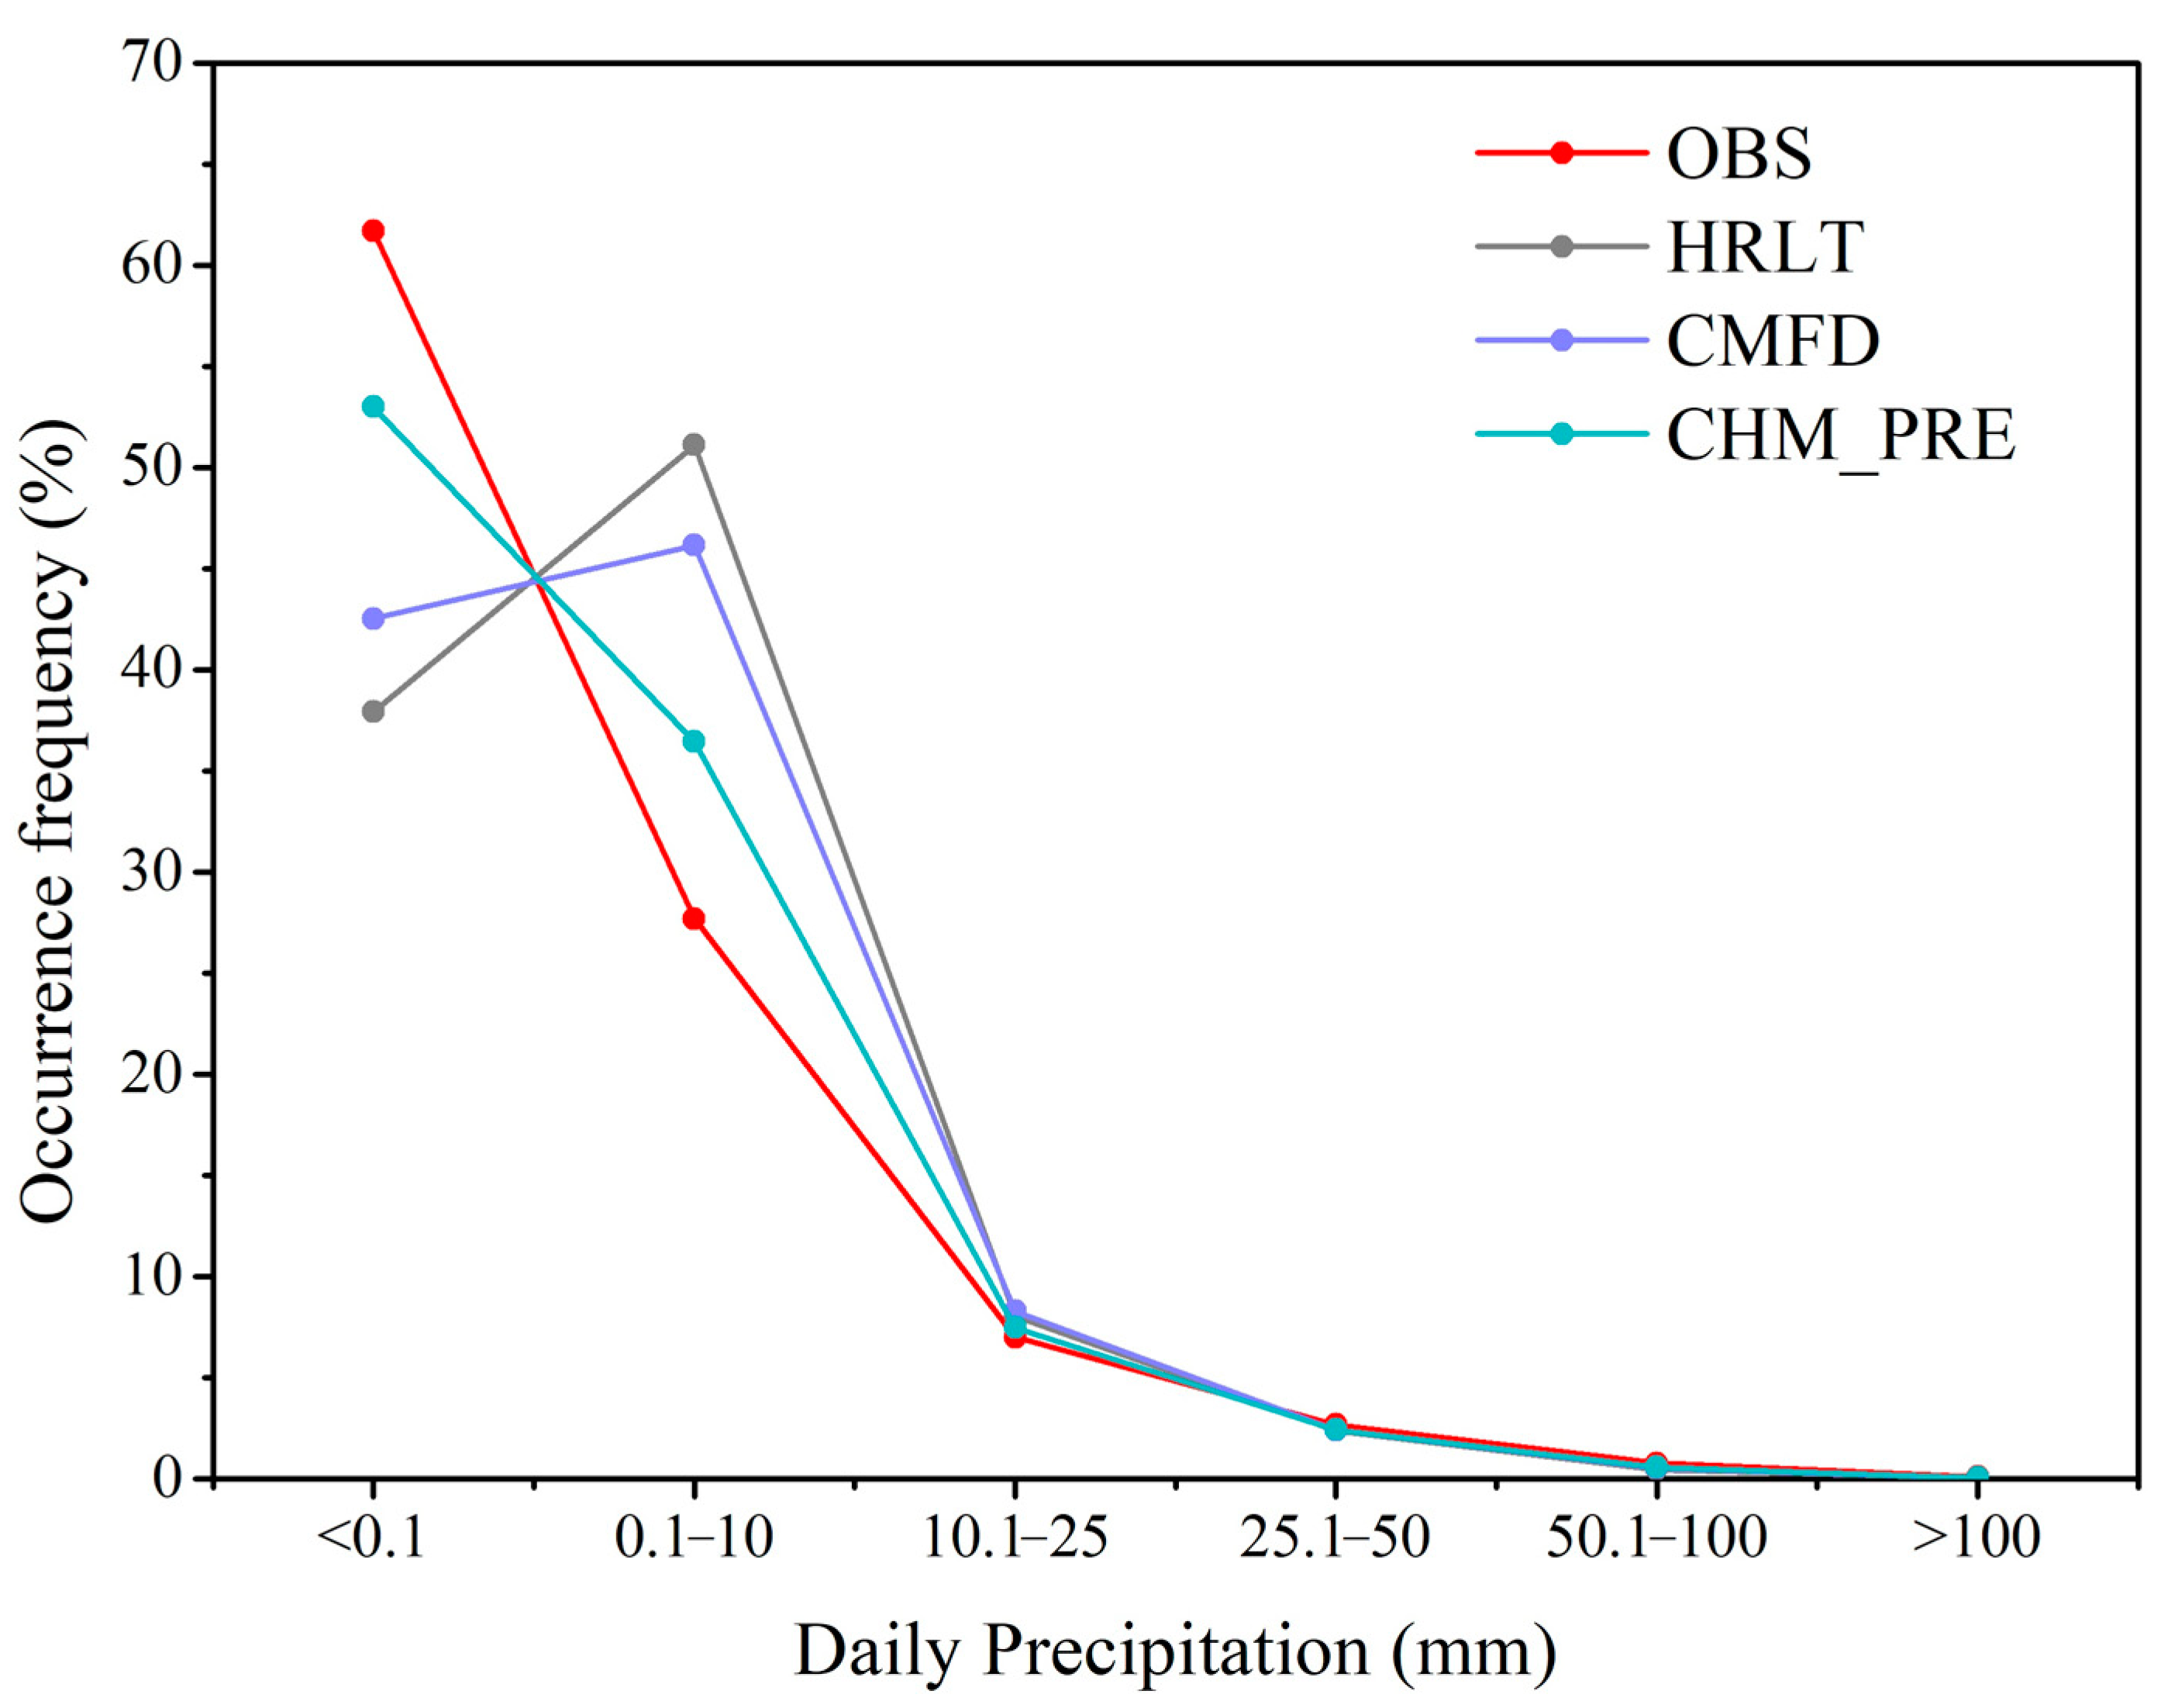
By classifying daily precipitation events as no rainfall (<0.1 mm), light rain (0.1–10 mm), moderate rain (10.1–25 mm), heavy rain (25.1–50 mm), torrential rain (50.1–100 mm), and heavy torrential rain (>100 mm), the frequency of daily precipitation amounts of HRLT, CMFD, and CHM_PRE were compared with the observed data (Figure 10). The observed data indicated that from 1979 to 2014, the number of days with no rainfall accounted for 61.7% of the total days, while the proportions of no rainfall days in the three datasets were all lower than the observed data. Among the three datasets, CHM_PRE was the closest to the observed results with 53.0%; however, the frequency of light rain was opposite to that of no rainfall, and the three datasets showed varying degrees of overestimation, in which HRLT had the highest degree of overestimation, and CHM_PRE was the closest to the observed data. The frequency of moderate rain, heavy rain, torrential rain, and heavy torrential rain in the datasets was relatively close to the observed data. CMFD was the closest to the observed frequency for heavy torrential rain, while CHM_PRE had the smallest deviation in the frequency of moderate rain, heavy rain, and torrential rain.

4. Discussion

This study employs site-observed data across Hang-Jia-Hu to validate the accuracy of five precipitation datasets. There are significant differences in the simulation accuracy over the same areas among different datasets. Compared to other datasets, NWAFU in particular features the longest time series, exceeding 100 years, and a high spatial resolution of 1 km. Its attributes make it suitable for analyzing historical variations and cyclic changes in regional precipitation. Despite a smaller deviation exhibited particularly in the complex terrain regions after integrating the reference climate dataset WorldClim [31], this study indicates that the data accuracy of NWAFU in Hang-Jia-Hu is still relatively lower than the other four datasets, and some years of heavy rainfall are not well captured. In the Tibetan Plateau [10] and the western part of China [29], NWAFU shows lower errors with RMSE values of 31.62 mm/mon and 24.9 mm/mon, respectively. However, across China, the RMSE was 54.7 mm/mon, higher than Hang-Jia-Hu, with RMSE 46.23 mm/mon. The HHU, with the same spatiotemporal resolution as NWAFU, demonstrated the highest correlation with observed values in the accuracy comparison of annual precipitation data over Hang-Jia-Hu. On the monthly scale, the RMSE and NSE were 22.47 mm/mon and 0.92, respectively. Compared to another result [29], HHU exhibits superior temporal accuracy over Hang-Jia-Hu than China and western China, and better absolute numerical accuracy than China, but slightly less than western China. As the most widely used dataset among the five products currently, CMFD has a slightly shorter temporal coverage and a lower spatial resolution than NWAFU, HRLT, and HHU, but it has a high temporal resolution of 3 h. CMFD has been utilized as meteorological input for various ecological and hydrological process simulations and climate change research. In Hang-Jia-Hu, the monthly precipitation of CMFD tends to show a degree of overestimation, which aligns with the results of the Three Gorges Reservoir area [37]. This may be related to the detection of TRMM rainfall fields in complex areas of underlying surfaces. HRLT is the only dataset that possesses both 1 km high spatial and daily temporal resolutions among the five datasets, and it exhibits the optimal comprehensive performance at the annual scale. In addition, at the daily scale, the RMSE of HRLT is 4.93 mm/mon (See in Appendix A Table A1), which is close to the findings of China [30], and lower than the southwestern mountainous areas of China [52]. Previous studies indicate that HRLT exhibits superior error, accuracy, and correlation at the daily scale compared to CMFD in Hang-Jia-Hu, the southwestern mountainous areas, or across the whole of China. This suggests that when longer time series of temperature and precipitation daily data are required, HRLT can be selected as input data. This also demonstrates the feasibility and reliability of generating high spatiotemporal resolution climate datasets by integrating machine learning and traditional interpolation methods. CHM_PRE, the best overall performance among the five datasets, exhibited the optimal RMSE, NSE, and R on both monthly and daily scales (daily results are found in Appendix A, Table A1), and its performance on an annual scale is also very close to that of the best-performing HRLT. Compared with the data evaluation results for China from 1961 to 2022 [33], CHM_PRE showed a significantly better performance in Hang-Jia-Hu. However, due to the relatively recent release of the dataset, its adaptability has not yet been assessed at the basin or regional level. It should be clarified that while analyzing the performance of precipitation datasets across different regions, this study referenced various previous results to ensure comparisons made within a uniform temporal scale. However, the time ranges of these referenced results do not entirely coincide with this study. Due to the differing adaptabilities of precipitation datasets across regions and spatiotemporal scales, and the setting of their own spatiotemporal resolution and time range, they should be appropriately selected and applied in diverse research contexts.
This study conducted a comparative analysis of the raw input data and interpolation methods used in five gridded precipitation datasets. It was found that HHU, CMFD, and HRLT all employed the thin-plate spline interpolation method. In addition, HHU utilized more ground-observed data as input and incorporated high-resolution DEM data as covariates, indicating that with the same interpolation method, more detailed observed data can effectively enhance the quality of datasets. HHU showed significant differences compared to HRLT, which may be attributed to the differences in the raw input data; the former used observed data, while the latter used gridded datasets. The raw input data for HHU and CHM_PRE are essentially consistent, but the quality of CHM_PRE is superior, likely due to differences in the interpolation methods. It should be noted that CHM_PRE performed terrain feature correction during the process of using the inverse distance weighting method to subtract station data. However, the Hang-Jia-Hu Plain is located in a plain river network area, with a very flat terrain and adjacent to the sea. The combination of terrain feature correction and the inverse distance weighting method seems to have caused significant errors in some grid areas along the coast, as can be seen from the evaluation results of the PH station. Due to the limited number of available observation stations in this study, a poor evaluation result for a certain station may directly affect the comprehensive evaluation. This also leads to a slightly inferior comprehensive performance of CHM_PRE compared to HRLT at the annual scale, although CHM_PRE performs better than HRLT at other stations. It can be inferred that, with the same interpolation method, raw input based on ground observation can generate higher-quality precipitation datasets than global climate gridded data, whereas, with the same input data, the interpolation method will directly influence the quality of the dataset. Since the study area has minimal topographical variation, the impact of topography, slope, aspect, and other precipitation-influencing factors on dataset quality was not deeply analyzed.

5. Conclusions

This study utilized observational data from various sites to assess the applicability of five precipitation datasets across different temporal scales. Additionally, it compared the spatial distribution, temporal variation, and frequency of precipitation events among these datasets across the Hang-Jia-Hu Plain. The analysis also examined the strengths and weaknesses of each precipitation product and discussed variations in accuracy across different regions, leading to the following conclusions:
(1) The assessment of data accuracy reveals that, on the annual scale, HRLT exhibits the most optimal performance overall, boasting a DISO value as low as 0.29, closely trailed by CHM_PRE, with a DISO value of 0.31. At the monthly scale, all precipitation products demonstrate high correlations and minimal deviations from observed site data, indicating consistently high data accuracy. The comprehensive performance ranking, from highest to lowest, is as follows: CHM_PRE, HHU, HRLT, CMFD, and NWAFU.
(2) The annual precipitation patterns of the five datasets are generally consistent, yet the difference between the maximum and minimum values is significant. The largest disparity occurred in 1999, at 753.67 mm, while the smallest was in 2000, at 103.53 mm. Except for NWAFU, the other products exhibit a multi-peak monthly precipitation pattern, with the highest peak in June, exceeding 200 mm, followed by the second-highest in August.
(3) The annual precipitation volumes from the five datasets all exhibit a spatial distribution pattern that progressively decreases from the southwest to the northeast across the Hang-Jia-Hu plain. However, there is a significant difference in the results concerning the spatial distribution of interannual variation rates and significance. Both the HHU and NWAFU datasets show an insignificant increasing trend in annual precipitation variation across the whole plain, while the HRLT, CMFD, and CHM_PRE datasets demonstrate significant increasing trends in different areas.
(4) For the analysis of precipitation datasets obtained from ground observation stations, the consideration of raw input data, interpolation methods, and precipitation influencing factors is key to determining the quality of the datasets. Considering the performance advantages of each precipitation dataset in different regions and spatiotemporal scales, as well as the spatiotemporal resolution and time range, it should be appropriately applied in various studies.

Author Contributions

Methodology, writing and analysis, K.W.; writing—original draft preparation and editing, Y.Q.; funding acquisition, visualization and editing, W.N.; writing—conceptualization and supervision, P.G.; review and supervision, F.W.; analysis, Y.L.; investigation, X.Z.; validation, T.Z.; software, S.W. All authors have read and agreed to the published version of the manuscript.

Funding

This research was supported by the National Natural Science Foundation of China (Grant No. 42130306) and the Science and Technology Program of Zhejiang Province (Grant No. 2022C35070).

Data Availability Statement

The data presented in this study are available on request from the corresponding author. Data available on request due to privacy.

Conflicts of Interest

The authors declare no conflicts of interest.

Appendix A

In this appendix, the evaluation metrics for CHM_PRE, CMFD, and HRLT at the daily temporal scale are shown in Table A1.
Table A1. Evaluation metrics for three precipitation datasets at the daily temporal scale.
StationsNSERMSE (mm/d)ME (mm/d)RDISO
CHM_PRE0.962.07−0.110.980.60
CMFD0.507.060.190.722.11
HRLT0.764.93−0.020.871.45
CHM_PRE represents the long-term, gauge-based gridded precipitation dataset for the Chinese mainland; CMFD represents the China Meteorological Forcing Dataset; HRLT represents the high-resolution (1 day, 1 km) and long-term (1961–2019) gridded dataset for temperature and precipitation across China. R, RMSE, ME, NSE and DISO are the Pearson correlation coefficient, root mean square error, mean error, Nash–Sutcliffe efficiency, and the CCHZ-DISO Big Data Evaluation System, respectively.

References

  1. Tang, G.; Wan, W.; Zeng, Z.; Guo, X.; Li, N.; Long, D.; Hong, Y. An overview of the Global Precipitation Measurement (GPM) mission and it’s latest development. Remote Sens. Technol. Appl. 2015, 30, 607–615. [Google Scholar] [CrossRef]
  2. Chiang, F.; Mazdiyasni, O.; AghaKouchak, A. Evidence of anthropogenic impacts on global drought frequency, duration, and intensity. Nat. Commun. 2021, 12, 2754. [Google Scholar] [CrossRef] [PubMed]
  3. Tradowsky, J.S.; Philip, S.Y.; Kreienkamp, F.; Kew, S.F.; Lorenz, P.; Arrighi, J.; Bettmann, T.; Caluwaerts, S.; Chan, S.C.; De Cruz, L.; et al. Attribution of the heavy rainfall events leading to severe flooding in Western Europe during July 2021. Clim. Change 2023, 176, 90. [Google Scholar] [CrossRef]
  4. Wang, X.Y.; Jiang, W.G.; Wu, J.J.; Hou, P.; Dai, Z.J.; Rao, P.Z.; Ling, Z.Y.; Deng, Y. Extreme hourly precipitation characteristics of Mainland China from 1980 to 2019. Int. J. Climatol. 2023, 43, 2989–3004. [Google Scholar] [CrossRef]
  5. Yuan, X.; Wang, Y.M.; Ji, P.; Wu, P.L.; Sheffield, J.; Otkin, J.A. A global transition to flash droughts under climate change. Science 2023, 380, 187–191. [Google Scholar] [CrossRef] [PubMed]
  6. Zhang, W.; Villarini, G.; Vecchi, G.A.; Smith, J.A. Urbanization exacerbated the rainfall and flooding caused by hurricane Harvey in Houston. Nature 2018, 563, 384–388. [Google Scholar] [CrossRef] [PubMed]
  7. Maggioni, V.; Meyers, P.C.; Robinson, M.D. A Review of Merged High-Resolution Satellite Precipitation Product Accuracy during the Tropical Rainfall Measuring Mission (TRMM) Era. J. Hydrometeorol. 2016, 17, 1101–1117. [Google Scholar] [CrossRef]
  8. Sun, Q.; Miao, C.; Duan, Q.; Ashouri, H.; Sorooshian, S.; Hsu, K.-L. A Review of Global Precipitation Data Sets: Data Sources, Estimation, and Intercomparisons. Rev. Geophys. 2018, 56, 79–107. [Google Scholar] [CrossRef]
  9. Westra, S.; Fowler, H.J.; Evans, J.P.; Alexander, L.V.; Berg, P.; Johnson, F.; Kendon, E.J.; Lenderink, G.; Roberts, N.M. Future changes to the intensity and frequency of short-duration extreme rainfall. Rev. Geophys. 2014, 52, 522–555. [Google Scholar] [CrossRef]
  10. Meng, N.; Yang, Y.; Qi, W.; Zhu, J.; Dai, X.; Li, R.; Ma, J.; Zheng, H. Multi-dimensional evaluation of four monthly long-term and high-resolution gridded precipitation datasets on the Qinghai-Tibet Plateau. Atmos. Res. 2024, 300, 107226. [Google Scholar] [CrossRef]
  11. Valencia, S.; Marin, D.E.; Gomez, D.; Hoyos, N.; Salazar, J.F.; Villegas, J.C. Spatio-temporal assessment of Gridded precipitation products across topographic and climatic gradients in Colombia. Atmos. Res. 2023, 285, 106643. [Google Scholar] [CrossRef]
  12. Tarek, M.; Brissette, F.P.; Arsenault, R. Evaluation of the ERA5 reanalysis as a potential reference dataset for hydrological modelling over North America. Hydrol. Earth Syst. Sci. 2020, 24, 2527–2544. [Google Scholar] [CrossRef]
  13. Wang, A.; Zeng, X.; Guo, D. Estimates of Global Surface Hydrology and Heat Fluxes from the Community Land Model (CLM4.5) with Four Atmospheric Forcing Datasets. J. Hydrometeorol. 2016, 17, 2493–2510. [Google Scholar] [CrossRef]
  14. Tapiador, F.J.; Navarro, A.; Levizzani, V.; García-Ortega, E.; Huffman, G.J.; Kidd, C.; Kucera, P.A.; Kummerow, C.D.; Masunaga, H.; Petersen, W.A.; et al. Global precipitation measurements for validating climate models. Atmos. Res. 2017, 197, 1–20. [Google Scholar] [CrossRef]
  15. Schneider, U.; Fuchs, T.; Meyer-Christoffer, A.; Rudolf, B. Global Precipitation Analysis Products of the GPCC. GPCC DWD Int. Publ. 2008, 112, 1–15. [Google Scholar]
  16. Joyce, R.J.; Janowiak, J.E.; Arkin, P.A.; Xie, P.P. CMORPH: A method that produces global precipitation estimates from passive microwave and infrared data at high spatial and temporal resolution. J. Hydrometeorol. 2004, 5, 487–503. [Google Scholar] [CrossRef]
  17. Huffman, G.J.; Adler, R.F.; Bolvin, D.T.; Gu, G.; Nelkin, E.J.; Bowman, K.P.; Hong, Y.; Stocker, E.F.; Wolff, D.B. The TRMM multisatellite precipitation analysis (TMPA): Quasi-global, multiyear, combined-sensor precipitation estimates at fine scales. J. Hydrometeorol. 2007, 8, 38–55. [Google Scholar] [CrossRef]
  18. Ashouri, H.; Hsu, K.-L.; Sorooshian, S.; Braithwaite, D.K.; Knapp, K.R.; Cecil, L.D.; Nelson, B.R.; Prat, O.P. PERSIANN-CDR Daily Precipitation Climate Data Record from Multisatellite Observations for Hydrological and Climate Studies. Bull. Am. Meteorol. Soc. 2015, 96, 69–83. [Google Scholar] [CrossRef]
  19. Beck, H.E.; van Dijk, A.I.J.M.; Levizzani, V.; Schellekens, J.; Miralles, D.G.; Martens, B.; de Roo, A. MSWEP: 3-hourly 0.25° global gridded precipitation (1979–2015) by merging gauge, satellite, and reanalysis data. Hydrol. Earth Syst. Sci. 2017, 21, 589–615. [Google Scholar] [CrossRef]
  20. Kanamitsu, M.; Ebisuzaki, W.; Woollen, J.; Yang, S.K.; Hnilo, J.J.; Fiorino, M.; Potter, G.L. NCEP-DOE AMIP-II reanalysis (R-2). Bull. Am. Meteorol. Soc. 2002, 83, 1631–1643. [Google Scholar] [CrossRef]
  21. Dee, D.P.; Uppala, S.M.; Simmons, A.J.; Berrisford, P.; Poli, P.; Kobayashi, S.; Andrae, U.; Balmaseda, M.A.; Balsamo, G.; Bauer, P.; et al. The ERA-Interim reanalysis: Configuration and performance of the data assimilation system. Q. J. R. Meteorolog. Soc. 2011, 137, 553–597. [Google Scholar] [CrossRef]
  22. Saha, S.; Moorthi, S.; Pan, H.-L.; Wu, X.; Wang, J.; Nadiga, S.; Tripp, P.; Kistler, R.; Woollen, J.; Behringer, D.; et al. The NCEP Climate Forecast System Reanalysis. Bull. Am. Meteorol. Soc. 2010, 91, 1015–1057. [Google Scholar] [CrossRef]
  23. Ebita, A.; Kobayashi, S.; Ota, Y.; Moriya, M.; Kumabe, R.; Onogi, K.; Harada, Y.; Yasui, S.; Miyaoka, K.; Takahashi, K.; et al. The Japanese 55-year Reanalysis “JRA-55”: An Interim Report. Sola 2011, 7, 149–152. [Google Scholar] [CrossRef]
  24. Kidd, C.; Levizzani, V. Status of satellite precipitation retrievals. Hydrol. Earth Syst. Sci. 2011, 15, 1109–1116. [Google Scholar] [CrossRef]
  25. Beck, H.E.; Vergopolan, N.; Pan, M.; Levizzani, V.; van Dijk, A.I.J.M.; Weedon, G.P.; Brocca, L.; Pappenberger, F.; Huffman, G.J.; Wood, E.F. Global-scale evaluation of 22 precipitation datasets using gauge observations and hydrological modeling. Hydrol. Earth Syst. Sci. 2017, 21, 6201–6217. [Google Scholar] [CrossRef]
  26. Chen, S.; Gan, T.; Tan, X.; Shao, D.Z.; Zhu, J. Assessment of CFSR, ERA-Interim, JRA-55, MERRA-2, NCEP-2 reanalysis data for drought analysis over China. Clim. Dyn. 2019, 53, 737–757. [Google Scholar] [CrossRef]
  27. Dong, W.; Wang, G.; Guo, L.; Sun, J.; Sun, X. Evaluation of Three Gridded Precipitation Products in Characterizing Extreme Precipitation over the Hengduan Mountains Region in China. Remote Sens. 2022, 14, 4408. [Google Scholar] [CrossRef]
  28. Zhou, Z.; Smith, J.A.; Wright, D.B.; Baeck, M.L.; Yang, L.; Liu, S. Storm Catalog-Based Analysis of Rainfall Heterogeneity and Frequency in a Complex Terrain. Water Resour. Res. 2019, 55, 1871–1889. [Google Scholar] [CrossRef]
  29. Qu, L.; Zhu, Q.; Zhu, C.; Zhang, J. A dataset of monthly precipitation with resolution of 1 km in China from 1960 to 2020. China Sci. Data 2023, 8, 286–297. [Google Scholar] [CrossRef]
  30. Qin, R.; Zhao, Z.; Xu, J.; Ye, J.-S.; Li, F.-M.; Zhang, F. HRLT: A high-resolution (1 d, 1 km) and long-term (1961–2019) gridded dataset for surface temperature and precipitation across China. Earth Syst. Sci. Data 2022, 14, 4793–4810. [Google Scholar] [CrossRef]
  31. Peng, S.; Ding, Y.; Liu, W.; Li, Z. 1 km monthly temperature and precipitation dataset for China from 1901 to 2017. Earth Syst. Sci. Data 2019, 11, 1931–1946. [Google Scholar] [CrossRef]
  32. He, J.; Yang, K.; Tang, W.; Lu, H.; Qin, J.; Chen, Y.; Li, X. The first high-resolution meteorological forcing dataset for land process studies over China. Sci. Data 2020, 7, 25. [Google Scholar] [CrossRef] [PubMed]
  33. Han, J.; Miao, C.; Gou, J.; Zheng, H.; Zhang, Q.; Guo, X. A new daily gridded precipitation dataset for the Chinese mainland based on gauge observations. Earth Syst. Sci. Data 2023, 15, 3147–3161. [Google Scholar] [CrossRef]
  34. Xu, W.; Ding, J.; Bao, Q.; Wang, J.; Xu, K. Improving the accuracy of precipitation estimates in a typical inland arid region of China using a dynamic Bayesian model averaging approach. J. Arid. Land 2024, 16, 331–354. [Google Scholar] [CrossRef]
  35. Li, Y.; Qin, X.; Liu, Y.; Jin, Z.; Liu, J.; Wang, L.; Chen, J. Evaluation of Long-Term and High-Resolution Gridded Precipitation and Temperature Products in the Qilian Mountains, Qinghai-Tibet Plateau. Front. Environ. Sci. 2022, 10, 906821. [Google Scholar] [CrossRef]
  36. Zhao, J.; Guo, Z.; He, X.; Xu, T.; Liu, S.; Xu, Z. Uncertainty assessment of temperature and precipitation reanalysis data in Heihe River Basin. J. Arid. Meteorol. 2019, 37, 529–539. [Google Scholar] [CrossRef]
  37. Cui, H.; Wang, H.; Xiao, W.; Gao, B. Evaluation on application accuracy of CMFD precipitation data in Three Gorges Reservoir Area. Yangtze River 2021, 52, 98–104. [Google Scholar] [CrossRef]
  38. Ren, M.; Xu, Z.; Pang, B.; Liu, W.; Liu, J.; Du, L.; Wang, R. Assessment of Satellite-Derived Precipitation Products for the Beijing Region. Remote Sens. 2018, 10, 1914. [Google Scholar] [CrossRef]
  39. Zhao, J.; Liu, Y.; Xu, J.; Wang, G.; Shao, Y.; Yang, L. Multi-source precipitation data fusion analysis and application based on Bayesian-Three Cornered Hat method. Adv. Water. Sci. 2023, 34, 685–696. [Google Scholar] [CrossRef]
  40. Xu, G.; Xu, Y.; Luo, X.; Yin, Y. Changes of Water Level Induced by Human Activities at Hangzhou-Jiaxing-Huzhou Plain in Recent 50 Years. Sci. Geog. Sin. 2012, 32, 1262–1268. [Google Scholar]
  41. Xu, G.; Xu, Y.; Wang, L. Temporal and spatial changes of river systems in Hangzhou- Jiaxing-Huzhou Plain during 1960s-2000s. Acta Geogr.Sin. 2013, 68, 966–974. [Google Scholar]
  42. Wang, J.; Xu, Y.; Wang, Y.; Wang, Q.; Yuan, J.; Gao, B.; Xiang, J.; Dai, X. Impacts of anthropogenic activity on the response of water level to rainfall in the urbanized plain river network: A case study in the Hangzhou-Jiaxing-Huzhou region of Taihu Basin. J. Lake Sci. 2019, 31, 779–787. [Google Scholar]
  43. A New Daily Gridded Precipitation Dataset for the Chinese Mainland based on Gauge Observations; National Tibetan Plateau Data, Third Pole Environment Data Center: Tibet, China, 2023.
  44. Miao, C.; Gou, J.; Fu, B.; Tang, Q.; Duan, Q.; Chen, Z.; Lei, H.; Chen, J.; Guo, J.; Borthwick, A.G.L.; et al. High-quality reconstruction of China’s natural streamflow. Sci. Bull. 2022, 67, 547–556. [Google Scholar] [CrossRef] [PubMed]
  45. Gou, J.; Miao, C.; Samaniego, L.; Xiao, M.; Wu, J.; Guo, X. CNRD v1.0: A High-Quality Natural Runoff Dataset for Hydrological and Climate Studies in China. Bull. Am. Meteorol. Soc. 2021, 102, E929–E947. [Google Scholar] [CrossRef]
  46. China Meteorological Forcing Dataset (1979–2018); National Tibetan Plateau Data, Third Pole Environment Data Center: Tibet, China, 2019.
  47. Yang, K.; He, J.; Tang, W.; Qin, J.; Cheng, C.C.K. On downward shortwave and longwave radiations over high altitude regions: Observation and modeling in the Tibetan Plateau. Agric. For. Meteorol. 2010, 150, 38–46. [Google Scholar] [CrossRef]
  48. Monthly Precipitation Data Set with 1 km Resolution in China from 1960 to 2020; Science Data Bank: Beijing, China, 2022.
  49. HRLT: A High-Resolution (1 Day, 1 km) and Long-Term (1961–2019) Gridded Dataset for Temperature and Precipitation across China; PANGAEA: Hongkong, China, 2022.
  50. 1-km Monthly Precipitation Dataset for China (1901–2022); National Tibetan Plateau Data, Third Pole Environment Data Center: Tibet, China, 2020.
  51. Hu, Z.Y.; Chen, X.; Zhou, Q.M.; Chen, D.L.; Li, J.F. DISO: A rethink of Taylor diagram. Int. J. Climatol. 2019, 39, 2825–2832. [Google Scholar] [CrossRef]
  52. Mo, C.; Lei, X.; Mo, X.; Ruan, R.; Tang, G.; Li, L.; Sun, G.; Jiang, C. Comprehensive evaluation and comparison of ten precipitation products in terms of accuracy and stability over a typical mountain basin, Southwest China. Atmos. Res. 2024, 297, 107116. [Google Scholar] [CrossRef]
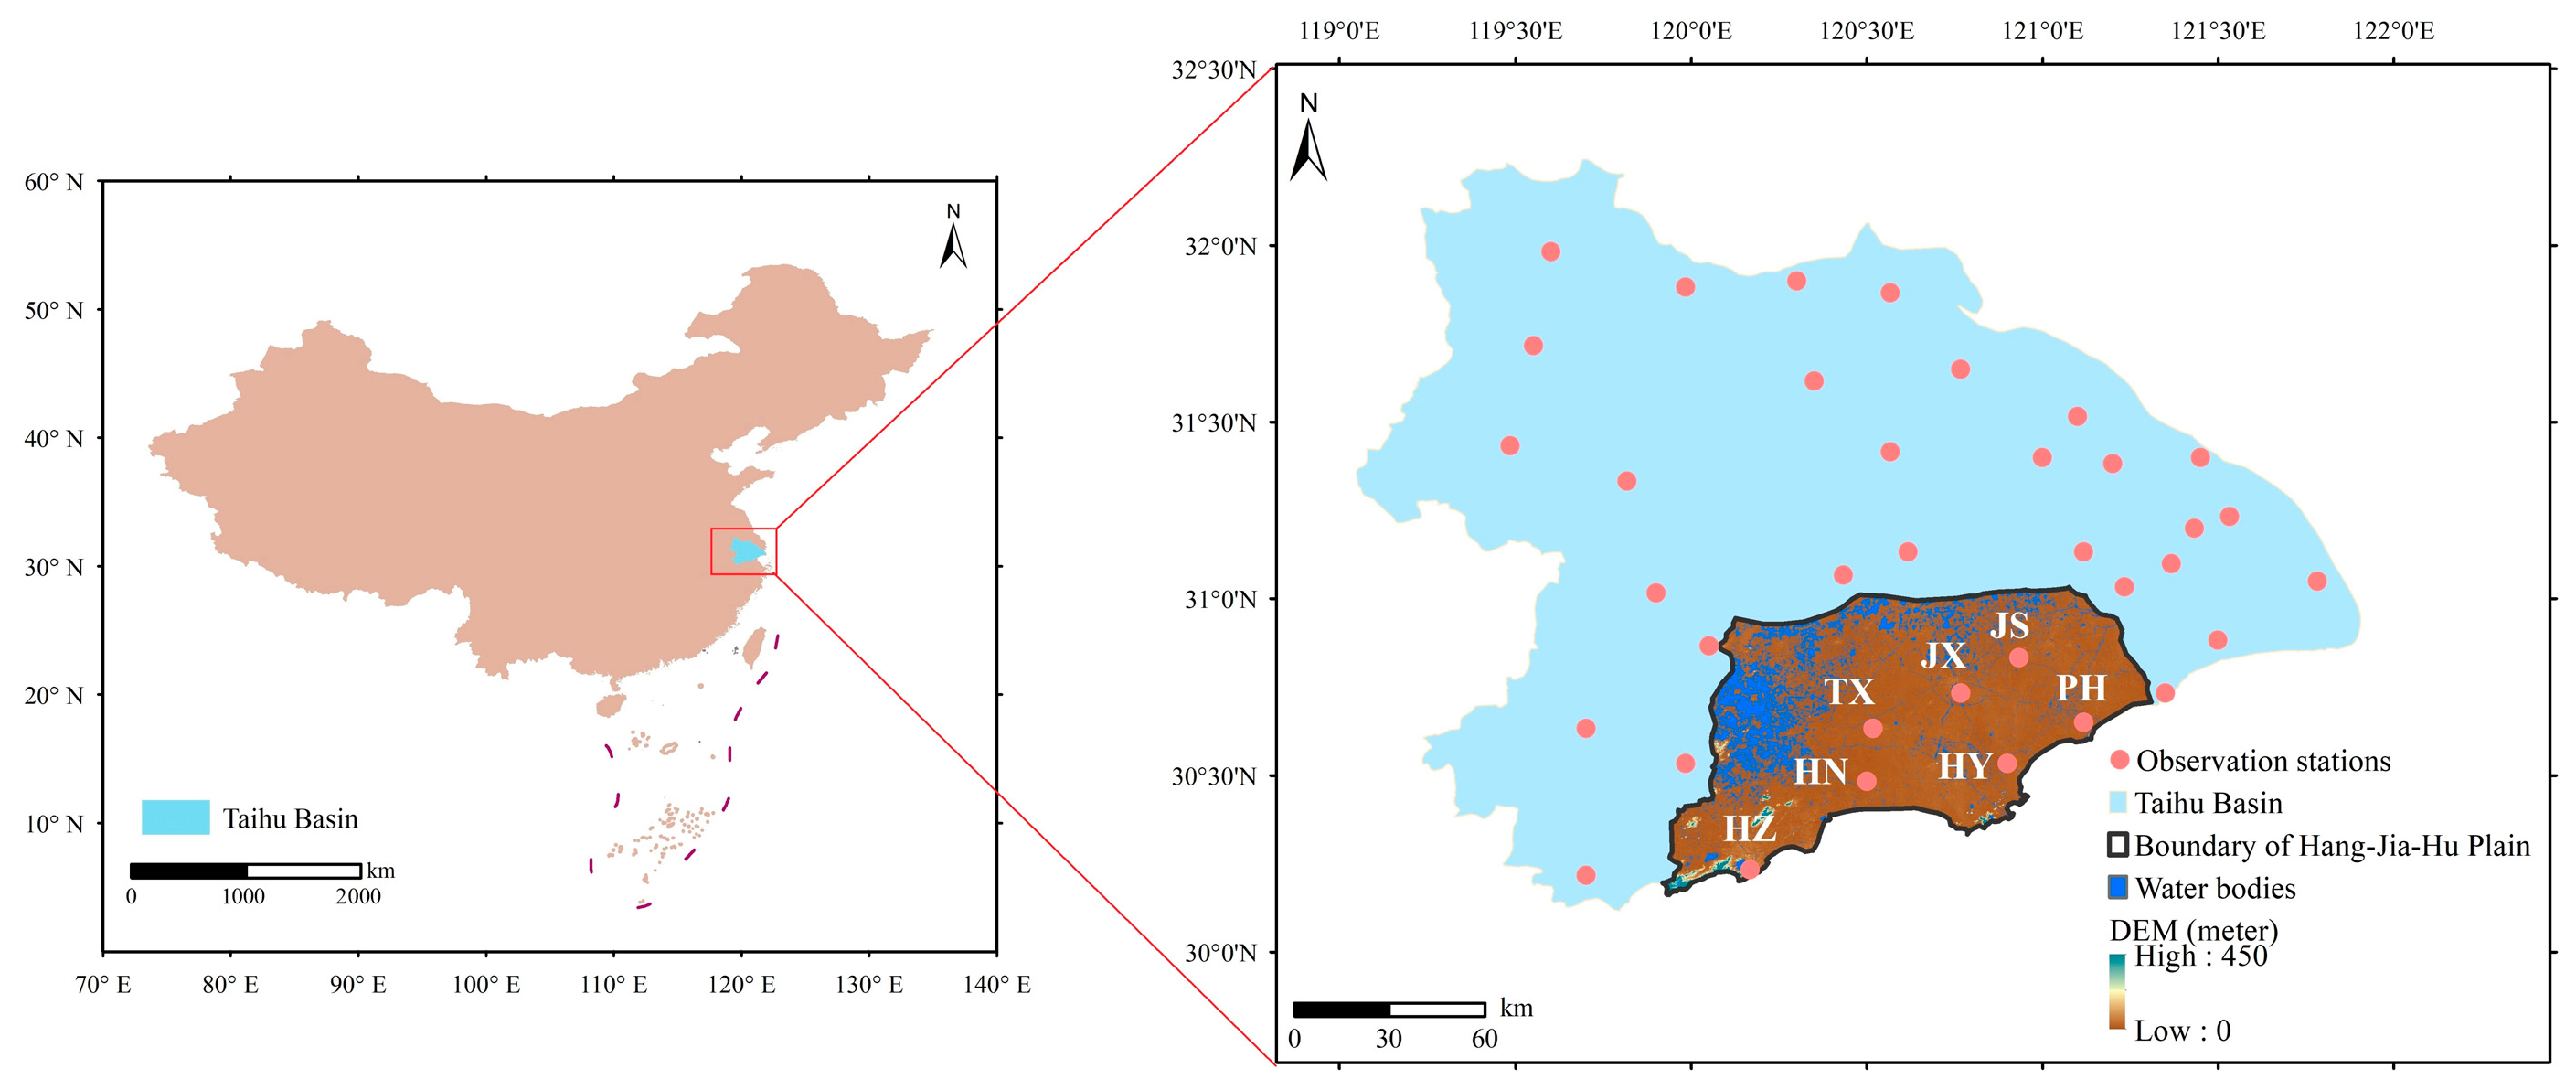
Figure 1. Geographical location map of the Hang-Jia-Hu Plain.
Water 16 02003 g001
Figure 2. Statistical metrics ((a) NSE, (b) RMSE, (c) R, (d) ME, and (e) DISO) for evaluation of precipitation datasets at the annual temporal scale for different observation stations. CHM_PRE represents the long-term, gauge-based gridded precipitation dataset for the Chinese mainland; CMFD represents the China Meteorological Forcing Dataset; HHU represents the dataset of monthly precipitation with resolution of 1 km in China from 1960 to 2020; HRLT represents the high-resolution (1 day, 1 km) and long-term (1961–2019) gridded dataset for temperature and precipitation across China; NWAFU represents the 1 km monthly precipitation dataset for China (1901–2022). R, RMSE, ME, NSE, and DISO are the Pearson correlation coefficient, root mean square error, mean error, Nash–Sutcliffe efficiency, and the CCHZ-DISO Big Data Evaluation System, respectively. The optimal value is represented by gray lines. HN, JS, HY, JX, HZ, PH, and TX are the observation station names.
Water 16 02003 g002
Figure 3. Scatterplots of annual precipitation for five precipitation datasets ((a) HHU, (b) HRLT, (c) NWAFU, (d) CMFD, and (e) CHM_PRE) and meteorological stations. CHM_PRE represents the long-term, gauge-based gridded precipitation dataset for the Chinese mainland; CMFD represents the China Meteorological Forcing Dataset; HHU represents the dataset of monthly precipitation with resolution of 1 km in China from 1960 to 2020; HRLT represents the high-resolution (1 day, 1 km) and long-term (1961–2019) gridded dataset for temperature and precipitation across China; NWAFU represents the 1 km monthly precipitation dataset for China (1901–2022). OBS is the observation value.
Water 16 02003 g003
Figure 4. Statistical metrics ((a) NSE, (b) RMSE, (c) R, (d) ME, and (e) DISO) for evaluation of precipitation datasets at the monthly temporal scale for different observation stations. CHM_PRE represents the long-term, gauge-based gridded precipitation dataset for the Chinese mainland; CMFD represents the China Meteorological Forcing Dataset; HHU represents the dataset of monthly precipitation with resolution of 1 km in China from 1960 to 2020; HRLT represents the high-resolution (1 day, 1 km) and long-term (1961–2019) gridded dataset for temperature and precipitation across China; NWAFU represents the 1 km monthly precipitation dataset for China (1901–2022). R, RMSE, ME, NSE, and DISO are the Pearson correlation coefficient, root mean square error, mean error, Nash–Sutcliffe efficiency, and the CCHZ-DISO Big Data Evaluation System, respectively. The optimal value is represented by gray lines. HN, JS, HY, JX, HZ, PH, and TX are the observation station names.
Water 16 02003 g004
Figure 5. Scatterplots of monthly precipitation for five precipitation datasets ((a) HHU, (b) HRLT, (c) NWAFU, (d) CMFD, and (e) CHM_PRE) and meteorological stations. CHM_PRE represents the long-term, gauge-based gridded precipitation dataset for the Chinese mainland; CMFD represents the China Meteorological Forcing Dataset; HHU represents the dataset of monthly precipitation with resolution of 1 km in China from 1960 to 2020; HRLT represents the high-resolution (1 day, 1 km) and long-term (1961–2019) gridded dataset for temperature and precipitation across China; NWAFU represents the 1 km monthly precipitation dataset for China (1901–2022). OBS is the observation value.
Water 16 02003 g005
Figure 6. Comparison of annual precipitation for five precipitation datasets and their annual mean results (MEAN), and annual average values of observation stations (OBS) in the Hang-Jia-Hu Plain. Among them, the time series of the precipitation dataset and their mean values are from 1979 to 2018, and the time series of the mean values of the observation stations are from 1979 to 2014. CHM_PRE represents the long-term, gauge-based gridded precipitation dataset for the Chinese mainland; CMFD represents the China Meteorological Forcing Dataset; HHU represents the dataset of monthly precipitation with resolution of 1 km in China from 1960 to 2020; HRLT represents the high-resolution (1 day, 1 km) and long-term (1961–2019) gridded dataset for temperature and precipitation across China; NWAFU represents the 1 km monthly precipitation dataset for China (1901–2022).
Water 16 02003 g006
Figure 7. Comparison of multi-year (1979–2018) mean monthly (a) and seasonal (b) precipitation for five precipitation datasets and their mean result (MEAN) in the Hang-Jia-Hu Plain. CHM_PRE represents the long-term, gauge-based gridded precipitation dataset for the Chinese mainland; CMFD represents the China Meteorological Forcing Dataset; HHU represents the dataset of monthly precipitation with a resolution of 1 km in China from 1960 to 2020; HRLT represents the high-resolution (1 day, 1 km) and long-term (1961–2019) gridded dataset for temperature and precipitation across China; NWAFU represents the 1 km monthly precipitation dataset for China (1901–2022).
Water 16 02003 g007
Figure 8. The spatial distribution of multi-year mean annual precipitation over five precipitation datasets ((a) HHU, (b) HRLT, (c) NWAFU, (d) CMFD, and (e) CHM_PRE) during 1979–2018. CHM_PRE represents the long-term, gauge-based gridded precipitation dataset for the Chinese mainland; CMFD represents the China Meteorological Forcing Dataset; HHU represents the dataset of monthly precipitation with resolution of 1 km in China from 1960 to 2020; HRLT represents the high-resolution (1 day, 1 km) and long-term (1961–2019) gridded dataset for temperature and precipitation across China; NWAFU represents the 1 km monthly precipitation dataset for China (1901–2022).
Water 16 02003 g008
Figure 9. The spatial distribution of annual precipitation change rates and their significance for five precipitation datasets ((a) HHU, (b) HRLT, (c) NWAFU, (d) CMFD, and (e) CHM_PRE) during 1979–2018. CHM_PRE represents the long-term, gauge-based gridded precipitation dataset for the Chinese mainland; CMFD represents the China Meteorological Forcing Dataset; HHU represents the dataset of monthly precipitation with resolution of 1 km in China from 1960 to 2020; HRLT represents the high-resolution (1 day, 1 km) and long-term (1961–2019) gridded dataset for temperature and precipitation across China; NWAFU represents the 1 km monthly precipitation dataset for China (1901–2022).
Water 16 02003 g009
Figure 10. The occurrence frequency of daily precipitation with different intensities for observation data (OBS) and three precipitation datasets during 1979–2014. CHM_PRE represents the long-term, gauge-based gridded precipitation dataset for the Chinese mainland; CMFD represents the China Meteorological Forcing Dataset; HRLT represents the high-resolution (1 day, 1 km) and long-term (1961–2019) gridded dataset for temperature and precipitation across China.
Water 16 02003 g010
Table 2. Validation statistical indices used to compare five precipitation datasets and the gauge observations.
Statistical IndexEquationValue RangePerfect Value
R R = i = 1 n ( P i P ¯ ) ( O i O ¯ ) i = 1 n ( P i P ¯ ) 2 i = 1 n ( O i O ¯ ) 2 (−1, 1)1
RMSE R M S E = 1 n i = 1 n ( P i O i ) 2 (0, +∞)0
ME M E = 1 n i = 1 n ( P i O i ) (−∞, +∞)0
NSE N S E = 1 i = 1 n ( P i O i ) 2 i = 1 n ( O i O ¯ ) 2 (−∞, 1)1
DISO D I S O = ( R 1 ) 2 + ( N S E 1 ) 2 + ( M E O ¯ ) 2 + ( R M S E O ¯ ) 2 (0, +∞)0
R, RMSE, ME, NSE, and DISO are the Pearson correlation coefficient, root mean square error, mean error, Nash–Sutcliffe efficiency, and the CCHZ-DISO Big Data Evaluation System, respectively. O represents the observed precipitation value, P signifies the precipitation value from the datasets, n is the number of observations, and the superscript horizontal line represents the average value.
Table 3. Evaluation metrics for five precipitation datasets at the annual temporal scale.
StationsNSERMSE (mm/yr)ME
(mm/yr)
RDISO
CHM_PRE0.74122.42−41.790.880.31
CMFD0.57156.9670.470.820.49
HHU0.60150.49132.480.960.43
HRLT0.75118.28−6.490.870.29
NWAFU0.28202.54−118.640.730.79
CHM_PRE represents the long-term, gauge-based gridded precipitation dataset for the Chinese mainland; CMFD represents the China Meteorological Forcing Dataset; HHU represents the dataset of monthly precipitation with resolution of 1 km in China from 1960 to 2020; HRLT represents the high-resolution (1 day, 1 km) and long-term (1961–2019) gridded dataset for temperature and precipitation across China; NWAFU represents the 1 km monthly precipitation dataset for China (1901–2022). R, RMSE, ME, NSE, and DISO are the Pearson correlation coefficient, root mean square error, mean error, Nash–Sutcliffe efficiency, and the CCHZ-DISO Big Data Evaluation System, respectively.
Table 4. Evaluation metrics for precipitation datasets at the monthly temporal scale.
StationsNSERMSE (mm/mon)ME
(mm/mon)
RDISO
CHM_PRE0.9616.54−3.480.980.17
CMFD0.8432.195.870.930.35
HHU0.9222.4711.040.970.25
HRLT0.8828.69−0.540.940.31
NWAFU0.6846.23−9.890.840.58
CHM_PRE represents the long-term, gauge-based gridded precipitation dataset for the Chinese mainland; CMFD represents the China Meteorological Forcing Dataset; HHU represents the dataset of monthly precipitation with resolution of 1 km in China from 1960 to 2020; HRLT represents the high-resolution (1 day, 1 km) and long-term (1961–2019) gridded dataset for temperature and precipitation across China; NWAFU represents the 1 km monthly precipitation dataset for China (1901–2022). R, RMSE, ME, NSE, and DISO are the Pearson correlation coefficient, root mean square error, mean error, Nash–Sutcliffe efficiency, and the CCHZ-DISO Big Data Evaluation System, respectively.
Disclaimer/Publisher’s Note: The statements, opinions and data contained in all publications are solely those of the individual author(s) and contributor(s) and not of MDPI and/or the editor(s). MDPI and/or the editor(s) disclaim responsibility for any injury to people or property resulting from any ideas, methods, instructions or products referred to in the content.