Article

Research on Suspended Particle Size Measurement Based on Ultrasonic Backscattered Amplitude Analysis

1
Engineering Research Center of Eco-Environment in TGR Region, Ministry of Education, College of Hydraulic and Environmental Engineering, China Three Gorges University, Yichang 443002, China
2
Changjiang River Scientific Research Institute, Wuhan 430014, China
3
Wuhan ShangShanyi Science and Technology Co., Ltd., Wuhan 430014, China
4
Changjiang Waterway Institute of Planning and Design, Wuhan 430040, China
5
College of Water Conservancy and Hydropower Engineering, Hohai University, Nanjing 211100, China
*
Author to whom correspondence should be addressed.
Water 2024, 16(14), 1973; https://doi.org/10.3390/w16141973
Submission received: 11 June 2024 / Revised: 4 July 2024 / Accepted: 6 July 2024 / Published: 12 July 2024

Abstract

:
Measuring the size of suspended particles in water is crucial in related fields such as environmental engineering, marine engineering, and hydraulic engineering. Considering the size distribution of suspended particles in real rivers, the amplitude (Amp) of the backscattering of particles with sizes ranging from 0.006 mm to 0.030 mm was analysed in this research using a lightweight ultrasonic meter developed by the authors and four probes with bandwidths ranging from 3.0 MHz to 30.0 MHz. In the analysis of Amp measurements for different particle sizes, using 0.008 mm as the reference particle size and converting to the rest of the particle sizes, if the Rayleigh scattering condition is satisfied between the particle sizes and the probe frequency, the conversion error value will be between −10% and 10%. This verifies the correctness of the theoretically derived particle size-Amp theory (the positive power relationship between the particle sizes and the Amp) and reflects the validity constraints of designing this experimental setup. The measurement method based on particle backscattering Amp analysis utilised in this study will help to achieve real-time measurements of suspended particles at river sites.

1. Introduction

Suspended particle size is one of the most important parameters in natural water testing [1]. Water research, water resource use and management, water and land use planning, the construction and maintenance of hydraulic structures, and many other areas related to natural water testing require the accurate measurement of suspended particle size [2]. Research and methods for measuring turbidity, a parameter that can characterise the number of suspended particles, have evolved more rapidly than those for measuring the suspended particle size. For example, Parra et al. [3] combined machine learning with RGB sensors to quantify and classify water turbidity, demonstrating the potential of multi-sensor approaches. Lee et al. [4] developed an in situ turbidity sensor system for residential water quality monitoring, highlighting the importance of real-time measurements for water management. Currently, there are several methods that can be used to measure the size of suspended particles, the most important of which are sieving [5], sedimentation [6], resistivity [7,8], optical [9,10,11], and acoustic [12,13,14,15] methods, in addition to nuclear magnetic resonance, electron microscopy, small angle X-ray scattering, and a large number of other new methods that are constantly being developed and improved by laboratory research [16,17,18,19]. Each of these methods has its own advantages and disadvantages, but the acoustic method is particularly favoured by the academic community. The acoustic-based ultrasonic measurement method, with its good penetration, non-invasiveness, and anti-interference, widely used in particle size measurement [20,21] to make up for the optical method, is difficult to use to achieve greater concentrations and impermeable media under the conditions of the defects of particle size measurement. This reduces the precision requirements of the measuring instrument, reduces the cost of experimental research and equipment production, and has relatively broad prospects for development [22].
The use of ultrasound to measure the size of suspended particles started relatively late compared to other particle size measurement methods, but because of its good measurement performance and broad development potential, there have been a considerable number of scholars exploring its basic principles and applications in research. Ultrasonic measurement methods can be broadly divided into the sound velocity method, the acoustic attenuation method, and the acoustic backscattering method, of which the acoustic attenuation method has a relatively wide range of applications and is more widely researched [23,24]. In 1953, Epstein proposed, for the first time, the suspension system, taking into account the viscosity of the liquid medium and the elasticity of the solids, as well as the impact of heat conduction on the mathematical model. After that, other scholars continued to improve the development of the model. The model has become the acoustic theoretical basis of the ultrasonic attenuation method, called the ECAH (Epstein–Carhart–Allegra–Hawley) model [13]. In 2003, ultrasonic attenuation became a rapid characterisation method for two-phase flow systems with high particle concentrations. However, the ultrasonic attenuation method neglects the interactions between suspended particles [25], which makes it difficult to apply further in the direction of particle size measurement, and there is a need for an efficient and applicable method for particle size measurement in suspended particles.
The acoustic backscattering method was proposed as a solution to the above problems, and the theory of the backscattering method was mainly developed by Rayleigh’s scattering theorem [26]. The following representative scholar, Weser R., designed a series of ultrasonic measuring devices to collect backscattering based on Rayleigh’s theorem, avoiding the problem of blocking large particles in the narrow transmitter–receiver gap in the case of a high concentration of measuring media with a high attenuation degree and proposed a semi-empirical equation for measuring particle size by researching two parameters, namely acoustic attenuation and equivalent Amp [27]. Through theoretical calculations, numerical simulations, and experimental simulations, Thorne took the application of backscattering to a new level for suspended particle size measurement [28,29,30,31]. To some extent, this has led to the development of backscattering-based flow meters such as the ADV, ADCP, etc., which have also demonstrated the superiority of the backscattering method [32,33]. However, the ADV and ADCP are affected by the shape of the particles and the field environment [34,35,36], so they are still not suitable for measuring the concentration and size of suspended particles in the engineering field. Z. Kuang used a self-developed ultrasonic measuring instrument with piezoelectric ultrasonic water immersion probes with nominal frequencies of 5.0 and 10.0 MHz to measure the concentration of suspended particles in a water body and once again verified the feasibility of measuring the suspended particle concentration based on the acoustic backscattering method [37]. However, if the ultrasonic backscattering method is to be applied for the measurement of suspended particles in a real river [38,39], further improvements are needed [40], such as further analysis of the applicable particle sizes corresponding to the different probes and the use of higher frequency probes to determine the relationship between the ultrasonic signal response of suspended particles in a wider frequency band.
In order to address the above deficiencies, highly homogeneous silica particles with a particle size range of 0.006–0.030 mm and a density of 2650 kg/m3 were first selected as the experimental particles to simulate the suspended sediment in a real river. Then, the measuring instrument was improved by programming the Fast Fourier Transform (FFT) module into its internal system-on-chip (SOC), which would automatically perform the FFT to quickly obtain the Amp of the measured object. The particle stirring device was improved to reduce the chance error and systematic error. Finally, the nominal frequencies of 5.0 MHz, 10.0 MHz, 15.0 MHz, and 20.0 MHz were used to improve the measurement resolution; to investigate the response of the ultrasonic signals to the suspended particles of different concentrations and sizes; and to explore the quantitative response relationship between the Amp and the particle size by combining with the relevant research theories (the particle size-Amp theory). The accuracy of the response relationship was verified by the experimental setup described above.
Overall, we investigated the principle of ultrasound-based particle measurement, paired the use of multiple frequency ultrasound probes with a modified measuring instrument, designed an experimental scheme to investigate the response relationship between particles and the amplitude of ultrasound back-echo, carried out an experimental validation of the particle size-Amp theory, and attempted to explore the limitations of the theory. This paper also helps to extend the present experimental apparatus and methodology to more scientific applications and provides data support for fundamental theoretical studies at the intersection of acoustics and river dynamics.

2. Materials

2.1. Experimental Particles

The specifications for the experimental particles included a high degree of similarity to the actual suspended sediment in rivers, strong hydrophobicity, ease of dispersion within the water body, a density of 2650 kg/m3, and a uniform particle size. The heterogeneity of suspended particles in natural river systems was temporarily disregarded. The level of homogeneity was assessed using Equation (1) [41].
C V = σ / μ
The standard coefficient of variation, denoted as C V , was calculated using the standard deviation of particle size ( σ ) and the mean value of particle size ( μ ). Equation (2) quantifies the variability in particle size within the selected material, with a smaller C V indicating a more uniform particle size distribution.
In order to achieve this objective, silica particles from two different vendors were procured, and their morphology was examined using a scanning electron microscope (SEM). The SEM images of the silica particles with a nominal diameter of 0.015 mm from both Vendor One and Vendor Two (Nano Technology Co., Ltd., Wuxi, China) are presented in Figure 1. The individual particle sizes in Figure 1 were meticulously measured, and upon substituting these measurements into Equation (1), the calculated coefficient of variation ( C V ) for the silica particles from Vendor Two was found to be less than 2.5%. This coefficient of variation is well within the acceptable range for the experimental requirements.

2.2. Experimental Setup

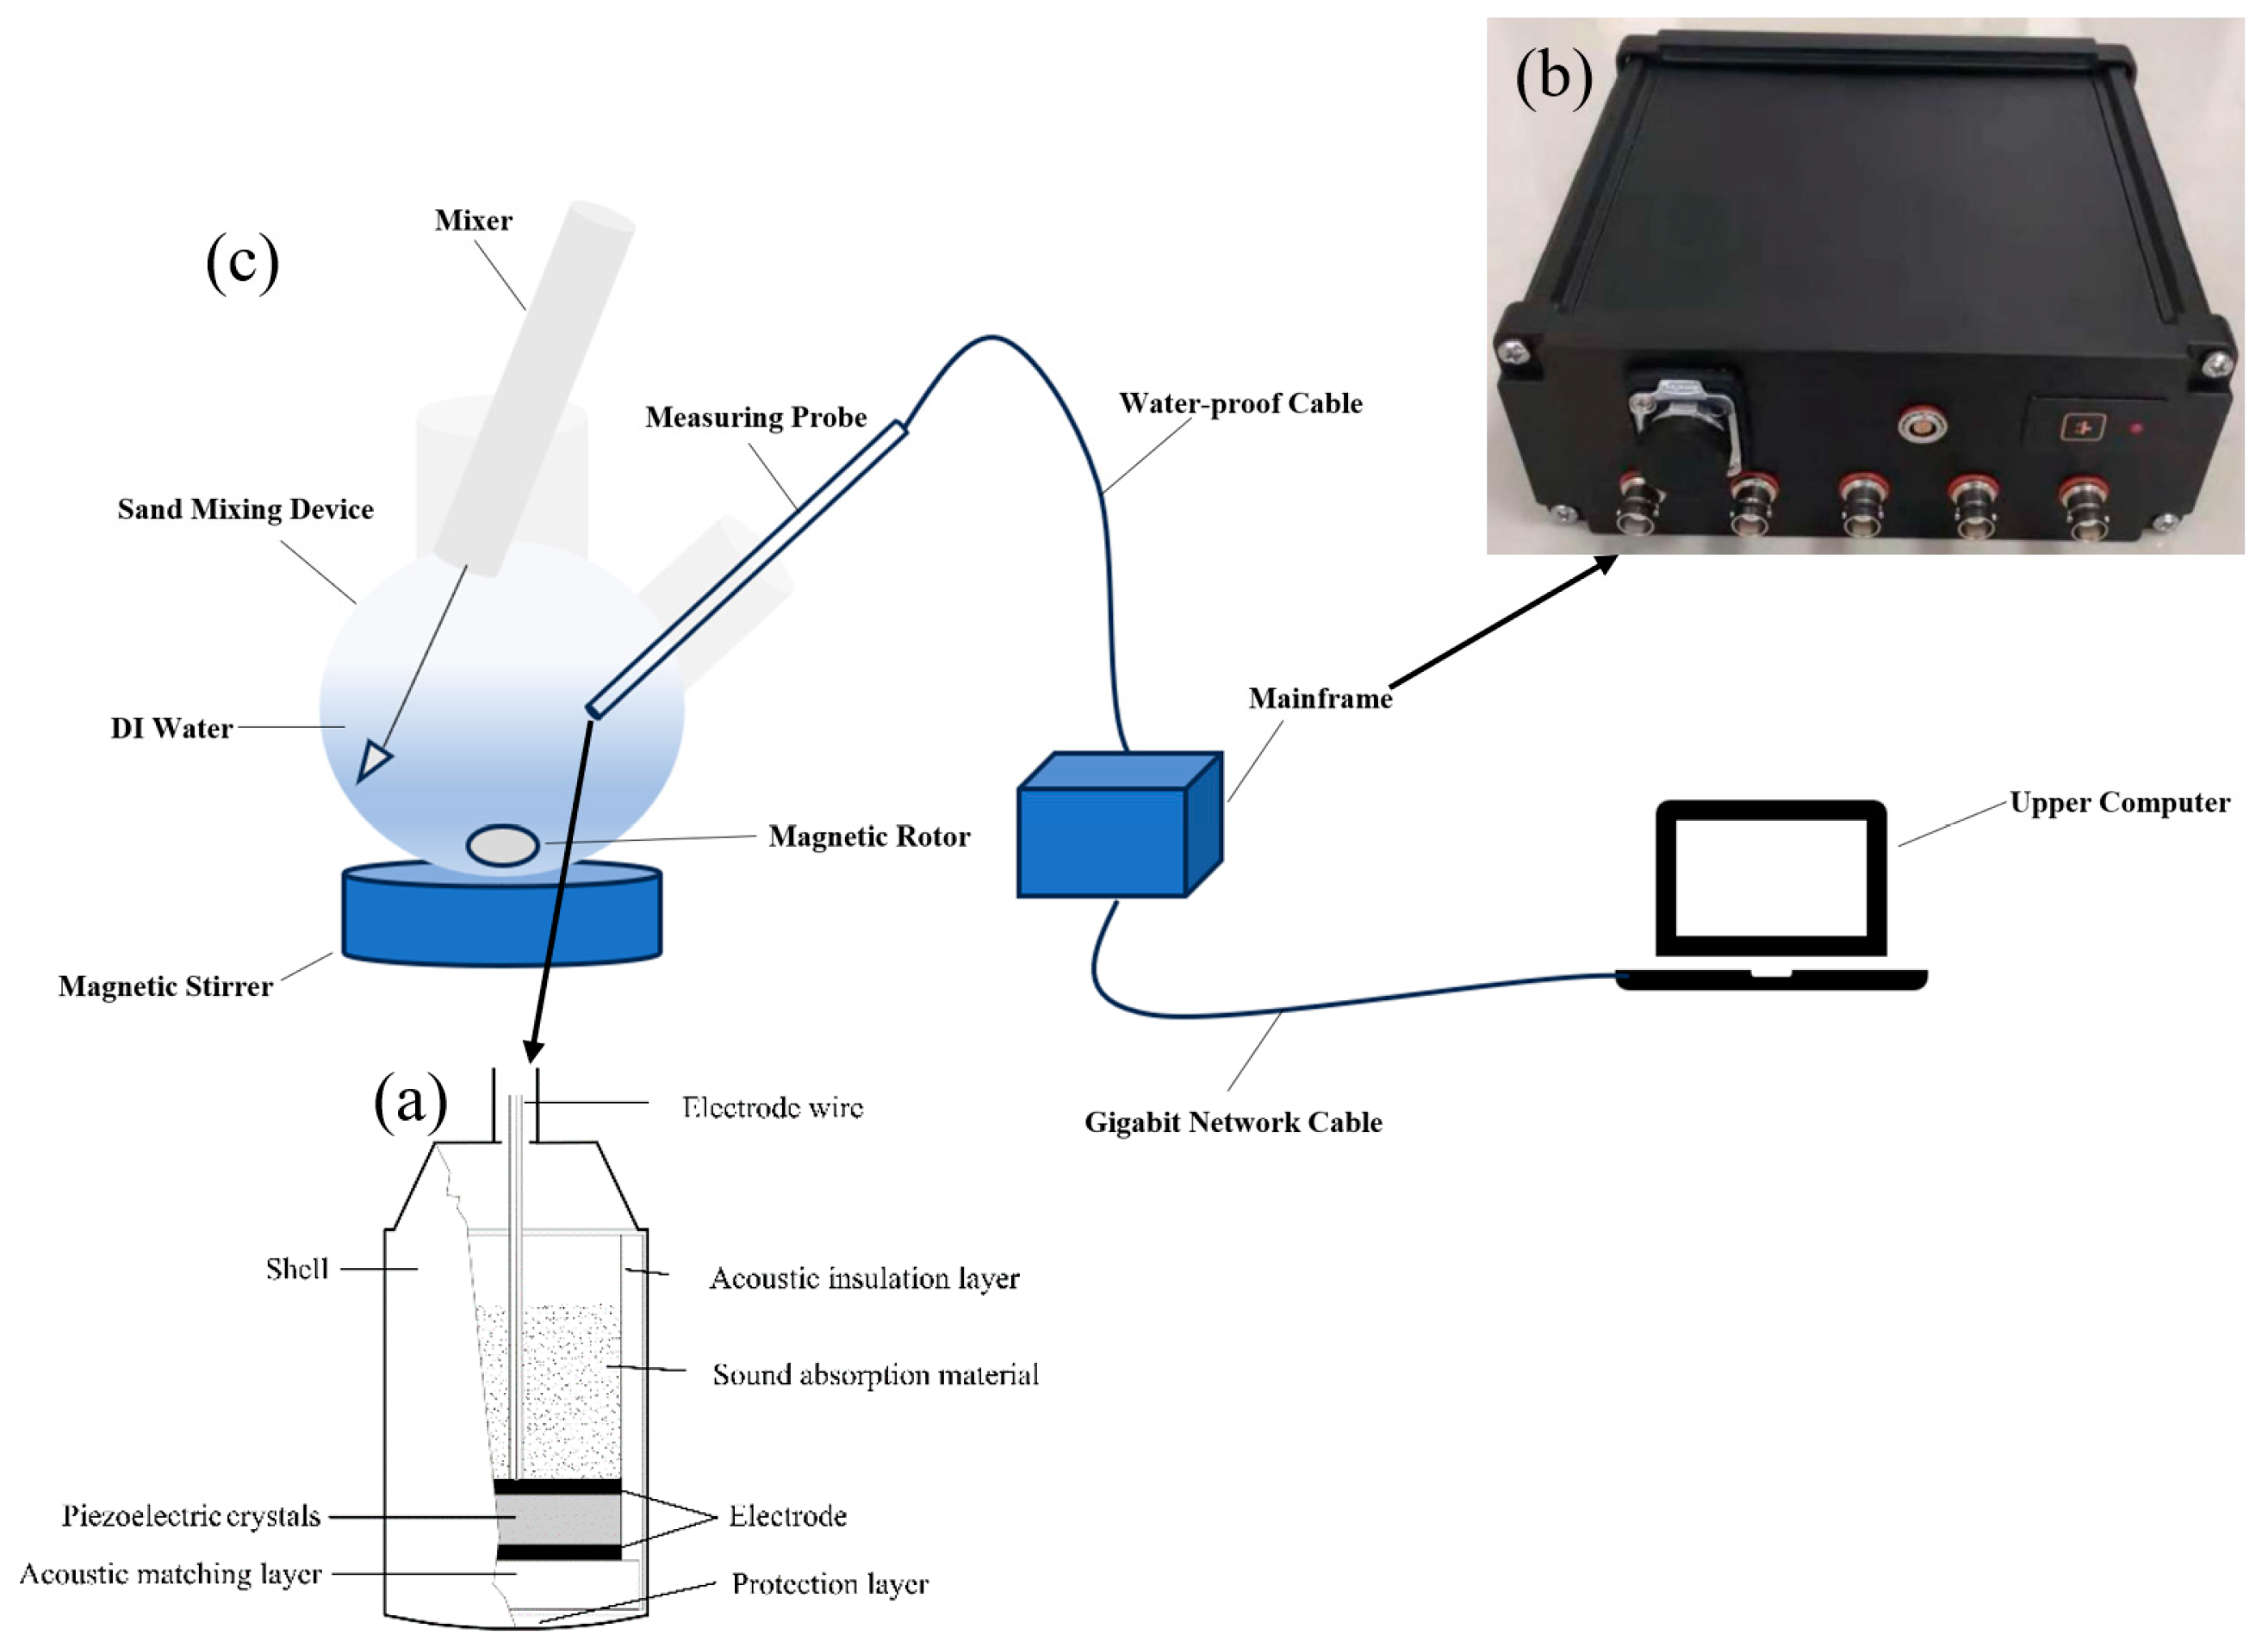
Figure 2 depicts the experimental apparatus, which includes (a) the probe (Self-developed, Changshu, China) and (b) the measuring instrument (Self-developed, Changshu, China) as the primary data collection tools. The particle stirring device was enhanced compared to the one previously used by Z. Kuang [37], featuring a five-hole spherical flat-bottomed flask with a nominal volume of 1000 mL. The base of the mixing device was fitted with a fixed stirring rotor that agitates a volume of deionised water (DI water, also known as ion-exchanged water) at a controlled temperature of 25 °C and a constant speed of 300 rpm. A stirring bar was affixed at the top to maintain a stirring rate of 300 rpm, which effectively prevented the formation of vortexes. The ultrasonic signal emitted by the probe remained unaffected by the walls of the stirring device, the stirring bar, and the stirring rotor. The probe yielded consistent measurement data at different depths, indicating that the particles remained in a stable suspended state.
A probe is a kind of energy conversion device that can be electrical and in which acoustic signals are converted to each other. The basic components of the probe include a piezoelectric crystal, an acoustic matching layer, electrodes and electrode wires, sound-absorbing materials, and a shell protection layer. The performance of the piezoelectric crystal directly determines the quality of the probe, which was procured from Q. Xue, one of the proposers of the theory of the dynamic characteristics of piezoelectric composite wafers [42,43], who helped to ensure the high quality of the probe. According to the production report of the probes, the bandwidth covered by each probe can be known using the ultrasonic principle and Rayleigh scattering theorem [26]. Equations (2) and (3) specify the range of particle sizes measured by each probe (where λ = c / f , c = 1500 m/s, and D is the particle size), listed in Table 1 together with other information.
k D = ( 2 π / λ ) × D > 0.1
k D = ( 2 π / λ ) × D < 0.6
Simultaneously, in light of the probe’s capabilities for measuring particle sizes (as detailed in Table 1), the range of particle sizes available from the particle supplier, and the distribution of suspended particles in natural rivers, seven types of spherical silica particles with a density of 2650 kg/m3 were procured. These particles span a size range from 0.006 mm to 0.030 mm, closely mimicking the particles found in actual rivers and making them suitable for use in indoor simulation experiments. The concentration in the particle-containing suspension was also set to mirror the particle concentrations found in real rivers. As a preliminary exploration of the particle size-amplitude theory, an extremely low concentration of 0.05 kg/m3 was chosen as the starting point, with a 32-fold increase (reaching 1.60 kg/m3) serving as the upper limit for particle concentration in this study. The experimental parameters of particle size and concentration are outlined in Table 2.
The measuring instrument operates by controlling the probe to transmit ultrasonic waves and receive the corresponding echo signals, achieving an integrated transceiver mode. It is capable of supporting a sampling rate of 125 MHz for independent ultrasonic signals, adhering to the Nyquist sampling theorem [44]. Inside the instrument, a Field-Programmable Gate Array (FPGA) is utilised for digital logic control, real-time signal processing, and transmission module functions, creating a SOC system. The entire SOC module connects to the outside world through a Physical Layer Protocol (PHY) extension, enabling the use of Gigabit Ethernet to receive control commands and parameters from the host computer, as well as to upload real-time measurement data generated by the ultrasound function module circuitry. Unlike other systems that require separate ultrasound pulse transmitters, power amplifiers, and other equipment, or compared to commercial devices such as the LISST-200X instrument [45,46] and an ADV, the self-developed and designed measurement device is portable and facilitates truly simple and efficient measurements. It is particularly well suited for experiments that demand precise measurements.

2.3. Experimental Procedures

The experiment was carried out in DI water at a temperature of 25 °C, and the particle backscattering signal Amp was analysed during stirring for 90 s. The experimental procedure was as follows.
(1)
Configuration of suspension: First, 0.05 kg to 1.60 kg of particles of 0.006 mm to 0.030 mm in size were weighed with an analytical balance with an accuracy of 0.001 g and put into a stirring device; then, we added 1000 mL of DI water, started the stirring device, and configured the suspension to SSC = 0.05 kg/m3 to 1.60 kg/m3.
(2)
Measurement: The control software based on QT6.5 programming was opened in the host computer and the parameters of the measuring instrument were set as follows: pulse width, 200 ns; transmit pulse wave 6; gain, 45 dB; signal acquisition frequency, 50 Hz; acquisition time, 90 s. Each group of experiments collected 4500 frames of signals.
Considering the noise effect of the device, the same parameters were used to measure the DI water without experimental particles, and the original noise Amp was obtained. Meanwhile, in order to avoid the fluctuation of acoustic wave intensity in the near-field region of the probe, the theoretical near-field lengths of the probes with different nominal frequencies ( f n i ) were calculated according to Equation (4), and the measurement areas of the different probes were set at different distances ( L n i ), as shown in Table 3.
L = φ 2 / ( 4 λ )
where L is the theoretical near-field length, φ is the wafer diameter, and λ = c / f n i is the acoustic wavelength ( c is 1500 m/s in water).
(3)
Data analysis: The internal SOC of the measuring instrument performed FFT operation. The signals from four kinds of probes covering the studied bandwidth were converted from the time domain to the frequency domain in MATLAB2023a software with reference to Equation (5) [47]. This was performed for each group of experiments with 4500 frames measuring the signal data, which underwent splicing, integration, and noise abatement after the time-averaged normalisation analysis. Then, Equation (6) was used to calculate the particle size-Amp conversion error value for the analysis and evaluation.
X n e w = ( X X min ) / ( X max X min )
E r r o r = A m p f A m p i × ( D i / D n ) A m p i × ( D i / D n ) × 100
where X n e w is the normalised value of X , X is the proposed normalised value, X max is the maximum value in the dataset, X min is the minimum value, E r r o r is the difference between the theoretical converted value and the actual measured value (%), A m p f is the actual measured Amp at a certain frequency for the converted size, A m p i is the actual measured Amp at a certain frequency for the reference size, D i is the converted size, D n is the reference size, and ( D i / D n ) is the theoretical ratio of the Amp of the converted size to the Amp of the reference size.

3. Methods

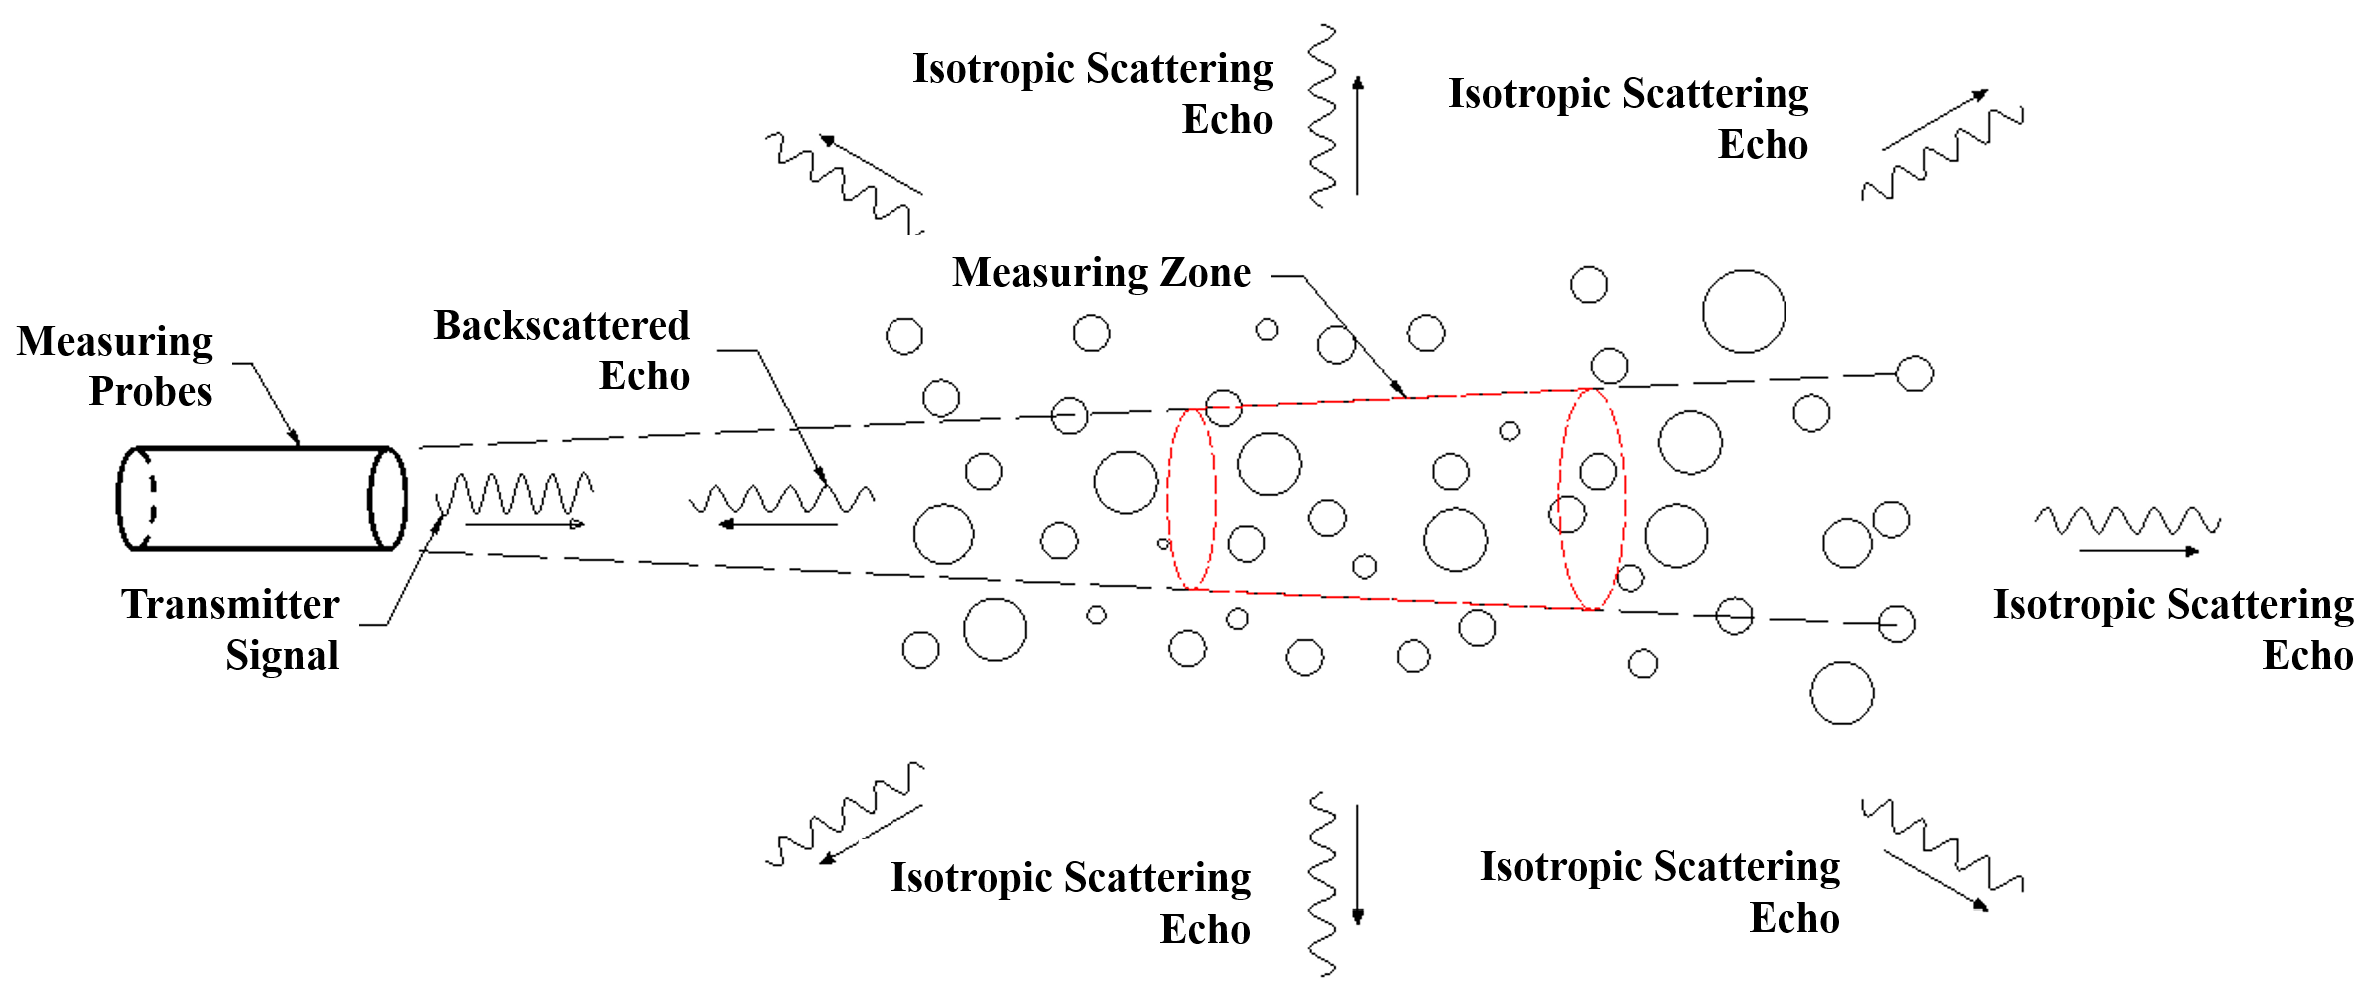
Figure 3 illustrates the fundamental concept of ultrasonic backscattering measurement employing a probe. Initially, the probe sends out a pulsed acoustic wave to the target water body. The suspended particles in the water body then scatter this signal, and the self-receiving measuring probe captures the backscattered echo signal at regular time intervals [48]. The amplitude (Amp) of the backscattered echo signal is significantly influenced by the physical properties of the suspended particles. Consequently, it is theoretically feasible to extract information about the physical characteristics of the suspended particles, such as their concentration and size, by analysing the collected backscattered echo signal.
Rayleigh firstly modelled the individual suspended particles in water bodies as movable rigid spheres and proposed the Rayleigh scattering theory, which provides a simplified model for calculating the scattering of acoustic waves by small particles. Here, the size of the small suspended particles D needs to satisfy the Rayleigh scattering function ( k D 1 , where k is the wave number of the emitted acoustic wave; k = ( 2 π ) / λ , where λ is the wavelength of the emitted acoustic wave).
Rayleigh scattering is employed to calculate the scattered sound intensity of individual particles, particularly when dealing with a small number of particles [26]. However, when measuring the scattered intensity of suspended particles in a natural river, theoretical calculations often deviate from actual measurements. To ensure measurement accuracy, additional factors must be considered, such as the shielding effect between particles within a cluster and the distance of the particles from the probe. The outcomes of these calculations are utilised to characterise the acoustic attenuation caused by particles in a natural river. To characterise the acoustic scattering of particle clusters, Sheng originally proposed the spherical scattering equation [39], which was developed to explain Flammer’s experimental data [40] on acoustic attenuation.
Building on the Rayleigh scattering theory, Thorne suggested that when the phase of the acoustic scattering signal from particles in a water body is randomly distributed between 0 and 2π, the acoustic scattering system can translate the intensity of the received backscattering signal into a concentration signal [31]. Provided that the acoustic attenuation signal is not excessively large, the following theoretical equation [28] is applied:
V E = k s × k t ψ × r × M 1 / 2 × exp 2 r ( α w + α s )
where V E is the equivalent voltage value of the backscattered echo signal received by the probe, which in this experiment is the Amp after FFT transformation; M = 4 π × a s 3 × ρ s × N / 3 ; M is the suspended sediment concentration (SSC), a s denotes the mean value of the particle size of the suspended particles; ρ s is the density of the suspended particles; N is the mass concentration of the suspended particles; k s = F / a s × ρ s ; F is known as the formal function which describes the scattering characteristics of the particles; k t is the system parameter of the measuring instrument and can be considered as a constant for the purpose of this experiment.
If the absorption attenuation and scattering attenuation coefficients are very small, combined with the mathematical point of view of the substitution of M and k s into Equation (7), V E a s can be obtained, which this paper refers to as the particle size-Amp theory. The theory shows that when factors other than the particle size remain consistent, there is a proportional relationship between the signal Amp and the average particle size, with the particle size being raised to the first power. The following section includes the experimental verification of the theory by performing multi-frequency measurement experiments on suspended particles of a single particle size.

4. Results

4.1. Time-Averaged Normalised Spectrograms

The time-averaged normalised spectra for seven different particle sizes, with SSCs ranging from 0.05 kg/m3 to 1.60 kg/m3, were recorded and are presented in Figure 4. A consistent gain criterion was applied across all experimental sets, enabling longitudinal comparisons of concentrations for the same particle size and lateral comparisons of particle sizes at the same concentration level.

4.2. Particle Size-Amp Conversion

To exploratorily validate the particle size-Amp theory and acknowledge the trend of increasingly fine river particles, the smallest particle size (0.008 mm) among the experimental group was selected as the reference particle size. The other particle sizes were considered as converted particle sizes. The concentration selected for the experiments was the more stable one depicted in Figure 4, which was 0.20 kg/m3. The corresponding error value was determined using Equation (6). Figure 5 illustrates the pink and cyan blue dotted lines, which represent error = 10% and error = −10%, respectively. These lines are defined as the upper and lower reference limits, respectively, for the theoretical conversion to particle size-Amp.

5. Discussion

Comparing Figure 4a–g, it can be seen that the spectra hardly change with concentration. However, at high concentrations (e.g., SSC > 0.20 kg/m3), because the number of suspended particles in the measurement area of the probe reaches the saturation value, the Amp will no longer increase, and a decreasing trend will be seen after the normalisation process. This is in line with the research of other scholars who called this the concentration attenuation effect [28,29]. At high frequencies (e.g., f ≥ 15.0 MHz), the ultrasound signal wavelength is shortened, the penetration of the ultrasound signal in the suspended particles in the water is reduced, and the scattering attenuation has a great impact on this; a decreasing trend is also seen in the time-averaged normalised spectra, which is in line with the research of other scholars who called this the scattering attenuation effect [30].
Further analysis showed that the peaks of the spectra correspond to lower frequencies as the size of the suspended particles increases. The smaller the particle size is, the more the ultrasonic response is concentrated in the higher frequency region and the closer the peaks appear to the higher frequencies, while the opposite is true for larger particles. This is in accordance with Rayleigh’s scattering theorem [26] and Thorne’s theory [28,29,30,31], which suggests that the Amp ratio of the backscattered echoes can be used to preliminarily determine particle size.
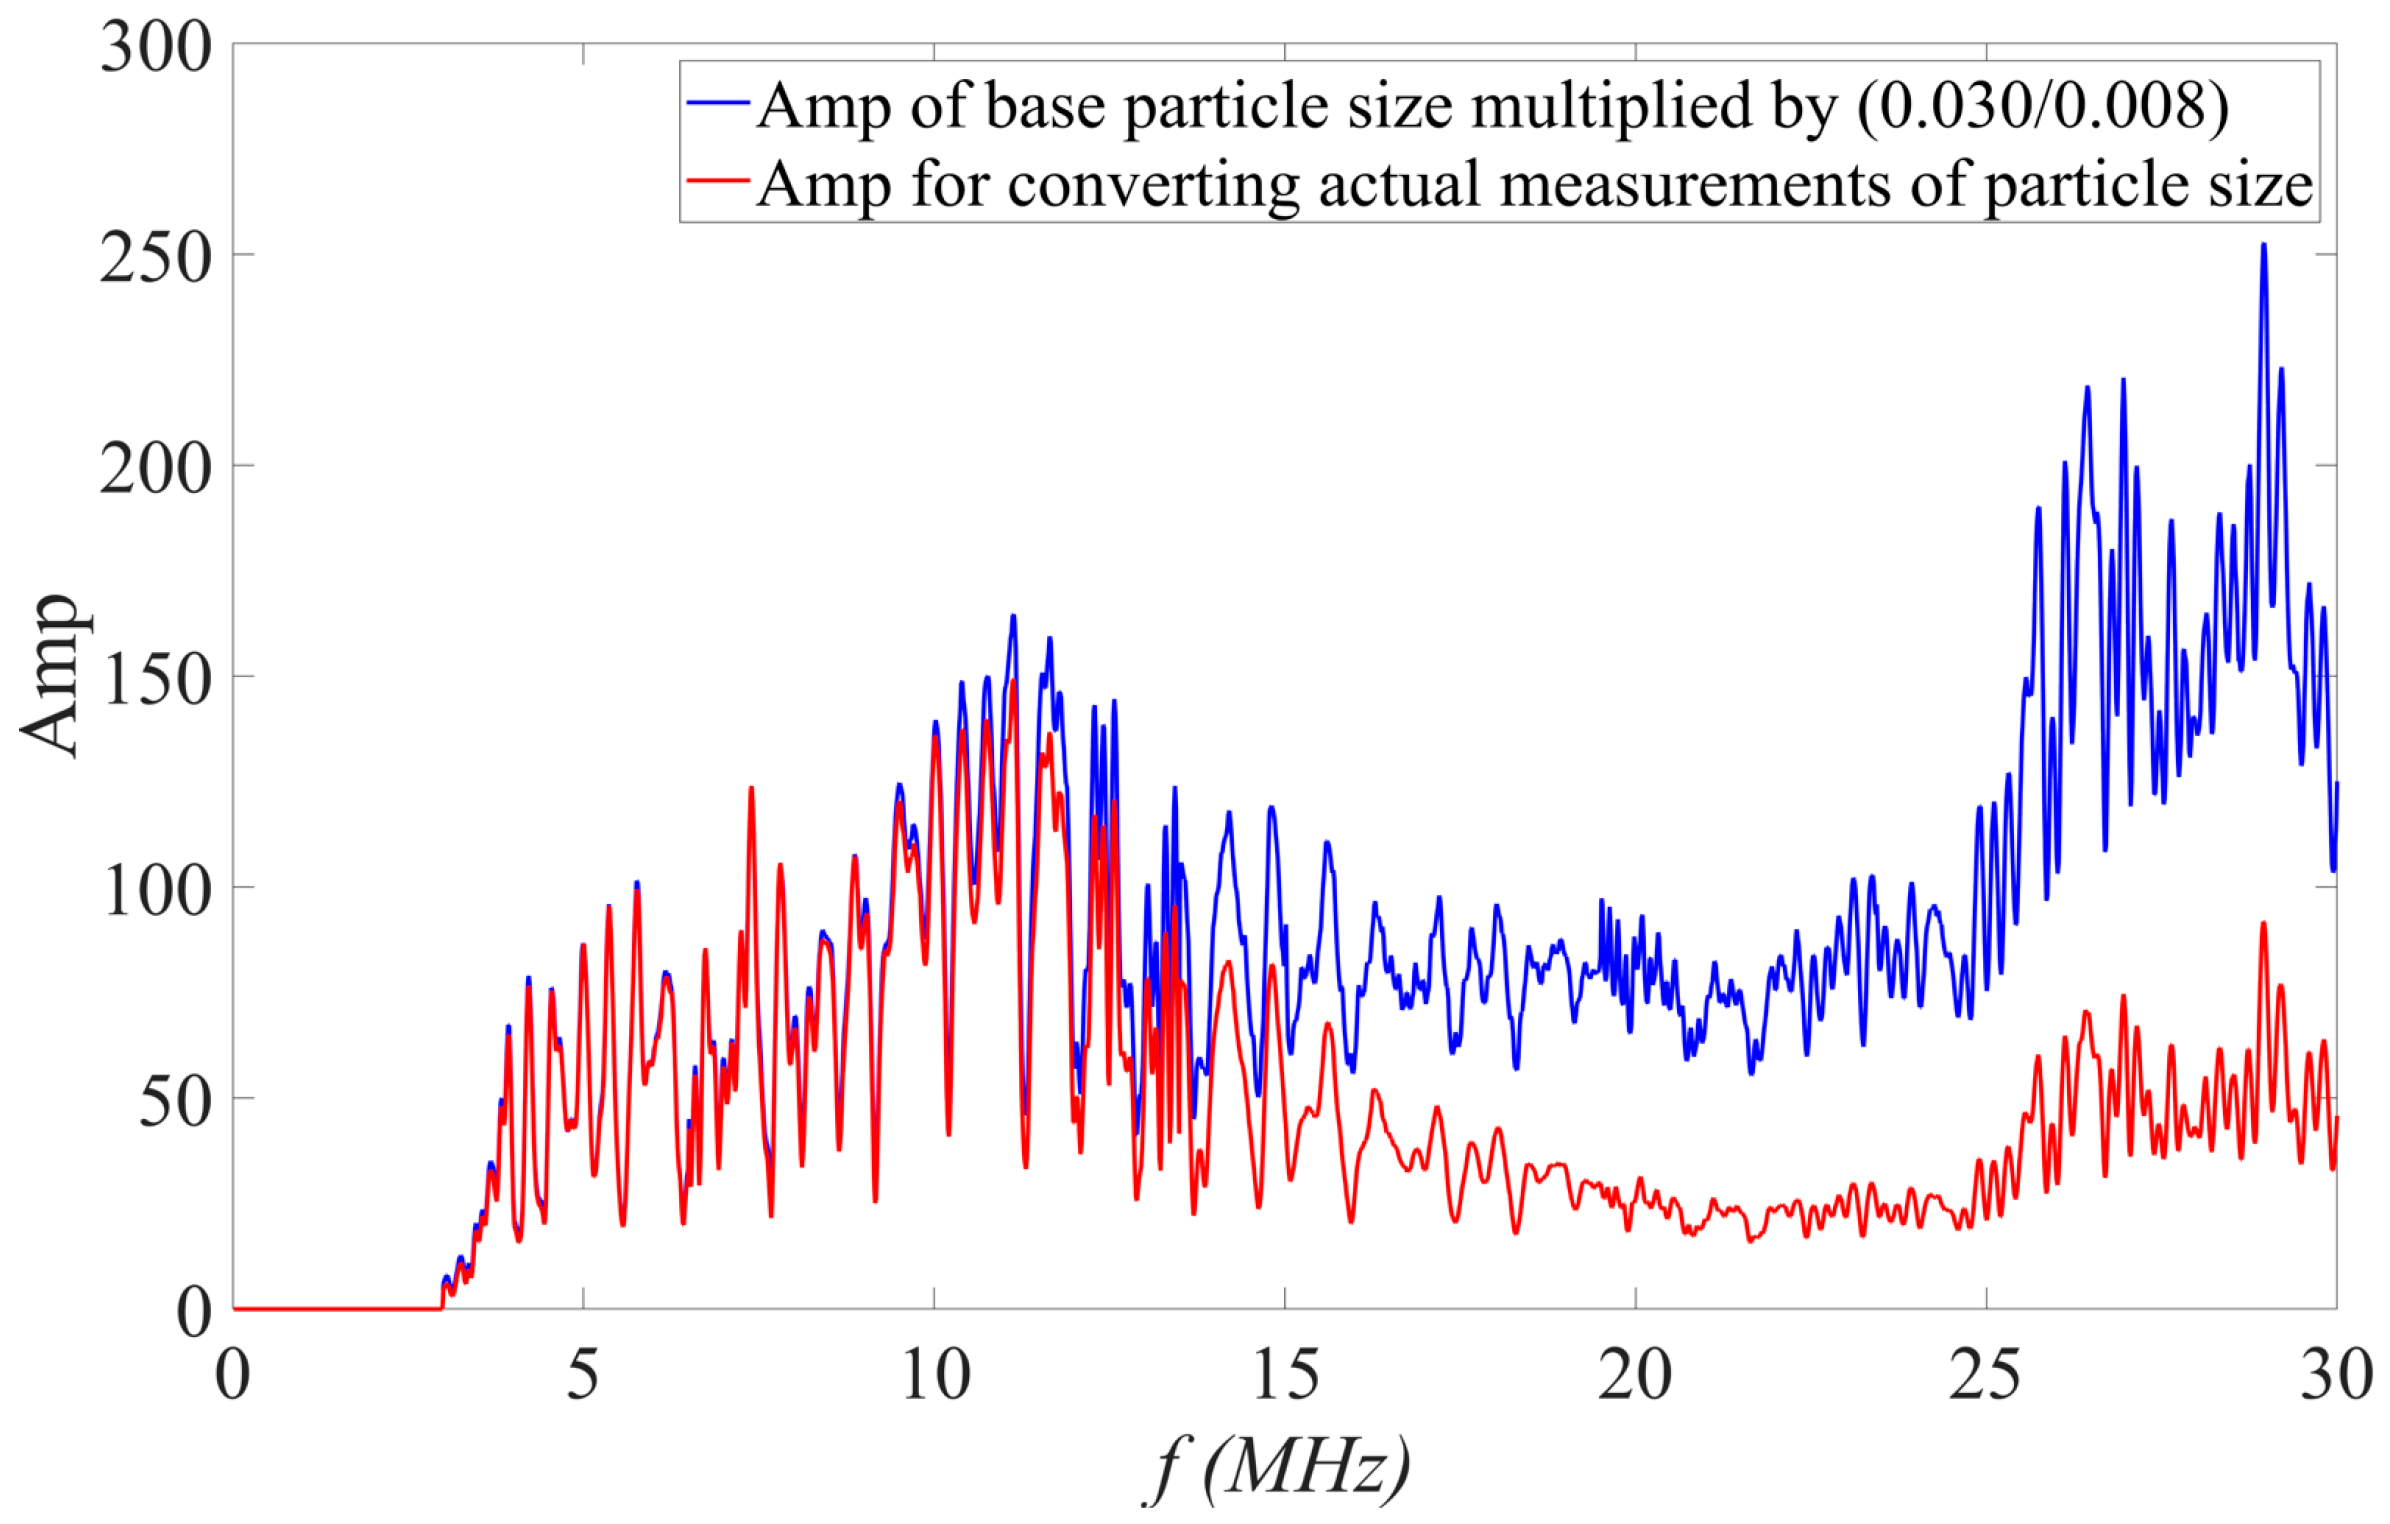
In Figure 5, it is easy to see that the smaller the ratio of the reference particle size to the converted particle size is, the higher the frequency and the corresponding error value will be. Furthermore, the conversion will have a high degree (defined in this paper as error = 10% to error = −10%) of agreement only when the measurable particle size of the probe meets the requirements, which is in accordance with the results calculated in Table 1, so lower frequency Amp data should be used for converted sizes larger than the reference size. The agreement of the measured data with the theory also proves the rationality of the design of the experimental setup. The conversion results also provide a reference for the frequency selection problem. After determining a reference particle size, if the Amp is converted over a range of particle sizes, it is only necessary to measure with one or more probes of the corresponding frequency. For example, the experimental material was only 0.008 mm in size (SSC = 0.05 kg/m3), but we wanted to know the Amp of 0.030 mm particles; we therefore used a probe with a nominal frequency of 5.0 MHz to measure the Amp of the 0.008 mm experimental material and then multiplied the measured Amp data by (0.030/0.008), which gave the relative error of Amp (blue solid line in Figure 6) and the real measurement of Amp (red solid line in Figure 6) of 0.030 mm material. The relative error of the calculated Amp (blue solid line in Figure 6) and the real Amp measurement of 0.030 mm material (red solid line in Figure 6) was very small, almost overlapping on the image as shown in Figure 6.
Figure 6 illustrates that it is not easy to distinguish the low-SSC coarse particles from the low-frequency probe measurements (e.g., 5.0 MHz/10.0 MHz) alone. If the data are processed by the normalisation method, the two curves are almost identical in shape because the converted Amp is simply multiplied by a factor (0.030/0.008) on top of the reference Amp, which is considered as one after the normalisation process. This means that the nominal frequency of 5.0 MHz for a particle size of 0.008 mm at this concentration is not the same as that for a particle size of 0.030 mm at this concentration. This also indicates that the response of the 5.0 MHz nominal frequency probe is almost the same for 0.008 mm particles as it is for 0.030 mm particles at this concentration. Therefore, it is necessary to use higher frequency measurements in combination with lower frequency measurements to quantitatively assess the ratio between, for example, the peaks of the 20.0 MHz nominal frequency probes and the peaks of the 10.0 MHz nominal frequency probe measurements.
Overall, the above analyses show that the present experimental method is reasonable, the instrumentation is reliable, and the experimental results are both in line with other scholars’ studies and validate the particle size-Amp theory, which has not been mentioned by other scholars. It should be noted that when the concentration is low (e.g., SSC < 0.20 kg/m3), especially for the small size particles (e.g., D = 0.006 mm), the number of particles in the measurement zone may not be large; additionally, the probe used in this experiment is self-generating and self-receiving, and the measurement frequency is very high. This may result in the superposition of the backscattered signals or interference, which may be reflected in the shape of the spectral lines on the spectral normalisation diagrams, which is not the same as that of the other concentrations. The shape of the spectral lines in the normalised spectrum is not the same as that of other concentrations, which is not the case for larger particle sizes. Further, the particle size-Amp theory is currently only validated for the presence of only a single particle size. These are the limitations of this research, and the probe will be improved and the experimental protocol optimised to further improve the accuracy of the measurements and the wide applicability of the measurement method.

6. Conclusions

The ultrasonic signal response of suspended particles was investigated using an ultrasonic measuring instrument developed by our group, which was equipped with four high-quality probes covering a range of frequencies from low to high. We conducted a series of multi-frequency ultrasonic measurement experiments on a single particle size, based on the Rayleigh scattering theorem and Equation (7) proposed by Thorne et al. These experiments aimed to establish a quantitative relationship between particle size and acoustic amplitude (particle size-Amp). The results of these multi-frequency ultrasonic measurement experiments were utilised to corroborate the accuracy of the particle size-Amp theory. The key findings are as follows:
(a)
The multi-frequency measurement experiments of a single particle size showed that the shape of the time-averaged normalised spectral map will not change with the change in concentration; only the corresponding Amp value will change at a certain proportion. The law of change in the Amp value is in line with the relevant studies of other scholars [12,15,37,48,49]; the smaller the particle size is, the higher the frequency corresponding to the peak is, and the larger the particle size is, the lower the frequency corresponding to the peak is.
(b)
The particle size-Amp theory (the positive correlation between the Amp of the backscattered signal of suspended particles and the first power of the particle size) was verified on the basis of the measured results, which is useful for verifying the actual range of measurable particle sizes of the probes and for converting the Amp for other sizes when only the Amp for a certain particle size is available.
The analytical method of particle size measurement demonstrated in this paper provides a new possible way for on-line measurement of particle sizes in an actual river site. We will continue to deepen the research, establish a standard database of SSC-particle size-Amp, explore the coupling relationship between the three, and explore the SSC-particle size-Amp inversion algorithm. In the future, it is hoped to further explore the ultrasonic signal response characteristics corresponding to multiple particles, a wide range of particle sizes, very low and very high concentrations, and a variety of water turbulence patterns of suspended particles, so as to truly realise real-time particle measurements at the river site.

Author Contributions

Conceptualisation, Y.L.; methodology, Y.L.; software, H.L.; validation, H.L.; formal analysis, Y.L.; investigation, Y.L.; resources, H.L.; data curation, Z.K. and Y.C.; writing—original draft, Y.L.; supervision, W.Y.; project administration, W.Y., C.H., Y.G. and T.L.; funding acquisition, W.Y. All authors have read and agreed to the published version of the manuscript.

Funding

This work was supported by the National Major Scientific Instrument Investigation and development project (grant number 51527809).

Data Availability Statement

The data that support the findings of this research are available within the article and also from the corresponding authors upon reasonable request.

Acknowledgments

The authors express their gratitude to the instrument development team and the electronic circuit design team.

Conflicts of Interest

Author Haili Lin was employed by the company Wuhan ShangShanyi Science and Technology Co., Ltd. The remaining authors declare that the research was conducted in the absence of any commercial or financial relationships that could be construed as a potential conflict of interest.

References

  1. Ahammad, M.; Czuba, J.; Curran, C. In-Stream Laser Diffraction for Measuring Suspended Sediment Concentration and Particle Size Distribution in Rivers: Insights from Field Campaigns. J. Hydraul. Eng. 2023, 149, 05022007. [Google Scholar] [CrossRef]
  2. Dutu, F.; Dutu, L.T.; Catianis, I.; Ispas, B.A. Sediment dynamics and hydrodynamical processes in the Danube Delta (Romania): A response to hydrotechnical works. Z. Fur Geomorphol. 2022, 63, 365–378. [Google Scholar] [CrossRef]
  3. Parra, L.; Ahmad, A.; Sendra, S.; Lloret, J.; Lorenz, P. Combination of Machine Learning and RGB Sensors to Quantify and Classify Water Turbidity. Chemosensors 2024, 12, 34. [Google Scholar] [CrossRef]
  4. Lee, J.; Kwon, J.H.; Kim, J.; Koo, J.; Lee, S. In-situ turbidity sensor system for residential water quality monitoring. Int. J. Nanotechnol. 2024, 21, 9. [Google Scholar] [CrossRef]
  5. Dishman, K.L.; Doolin, P.K.; Hoffman, J.F. Comparison of particle size of cracking catalyst determined by laser light scattering and dry sieve methods. Ind. Eng. Chem. Res. 1993, 32, 1457–1463. [Google Scholar] [CrossRef]
  6. Faers, M.A.; Kneebone, G.R. Application of rheological measurements for probing the sedimentation of suspension concentrate formulations. Pestic. Sci. 1999, 55, 312–325. [Google Scholar] [CrossRef]
  7. Graham, M.D. The Coulter Principle: Foundation of an Industry. J. Assoc. Lab. Autom. 2003, 8, 72–81. [Google Scholar] [CrossRef]
  8. Saleh, O.A.; Sohn, L.L. Quantitative sensing of nanoscale colloids using a microchip Coulter counter. Rev. Sci. Instrum. 2001, 72, 4449–4451. [Google Scholar] [CrossRef]
  9. Bin Omar, A.F.; Bin MatJafri, M.Z. Turbidimeter Design and Analysis: A Review on Optical Fiber Sensors for the Measurement of Water Turbidity. Sensors 2009, 9, 8311–8335. [Google Scholar] [CrossRef] [PubMed]
  10. White, D. The Measurement of Particle Size Distribution Using the Single Particle Optical Sizing (SPOS) Method; Cambridge University Department of Engineering: Cambridge, UK, 2002. [Google Scholar]
  11. Ochiai, S.; Kashiwaya, K. Measurement of suspended sediment for model experiments using general-purpose optical sensors. Catena 2010, 83, 1–6. [Google Scholar] [CrossRef]
  12. Challis, R.E.; Povey, M.J.W.; Mather, M.L.; Holmes, A.K. Ultrasound techniques for characterizing colloidal dispersions. Rep. Prog. Phys. 2005, 68, 1541. [Google Scholar] [CrossRef]
  13. Epstein, P.S.; Carhart, R.R. The Absorption of Sound in Suspensions and Emulsions. I. Water Fog in Air. J. Acoust. Soc. Am. 1953, 25, 553–565. [Google Scholar] [CrossRef]
  14. Yuan, A.; Mingxu, S.U.; Yongming, L.I.; Cai, X.; Yin, P. Application of ultrasonic method on particle concentration in gas-liquid two-phase flow. In Proceedings of the UK-China International Particle Technology Forum, Shanghai, China, 30 June 2014. [Google Scholar]
  15. Kulon, J.; Malyan, B.E.; Balachandran, W. Simultaneous measurement of particle size and electrostatic charge distribution in DC electric field using phase Doppler anemometry. IEEE Trans. Ind. Appl. 2003, 39, 1522–1528. [Google Scholar] [CrossRef]
  16. Harris, R.A.; Shi, Y.; Cina, J.A. On the measurement of superpositions of chiral amplitudes by polarized light scattering. J. Chem. Phys. 1994, 101, 3459–3463. [Google Scholar] [CrossRef]
  17. Fei, S. Several Commonly Used Powder Size Test Methods. In Physical Testing and Chemical Analysis (Part A: Physical Testing); Oriprobe: Windsor, ON, Canada, 2012. [Google Scholar]
  18. Nishiguchi, K.; Utani, K.; Gunther, D.; Correction, M.O. to Gas to Particle Conversion-Gas Exchange Technique for Direct Analysis of Metal Carbonyl Gas by Inductively Coupled Plasma Mass Spectrometry. Anal. Chem. 2014, 86, 11925–11926. [Google Scholar] [CrossRef]
  19. Kang, R.; Wang, X.; Zhao, M.; Henihan, L.E.; O’Donnell, C.P. A comparison of benchtop and micro NIR spectrometers for infant milk formula powder storage time discrimination and particle size prediction using chemometrics and denoising methods. J. Food Eng. 2022, 329, 111087. [Google Scholar] [CrossRef]
  20. Deines, K.L. Backscatter Estimations Using Broadband Acoustic Doppler Current Profilers. Application Note. In Proceedings of the IEEE Sixth Working Conference on Current Measurement, Stoughton, WI, USA, 11–13 March 1999. [Google Scholar]
  21. Guerrero, M.; Rüther, N.; Archetti, R. Comparison under controlled conditions between multi-frequency ADCPs and LISST-SL for investigating suspended sand in rivers. Flow Meas. Instrum. 2014, 37, 73–82. [Google Scholar] [CrossRef]
  22. Ji, X.; Su, M.; Chen, J.; Wang, X.; Cai, X. A novel method for plastic particle sizing in suspension based on acoustic impedance spectrum. Ultrasonics 2017, 77, 224–230. [Google Scholar] [CrossRef]
  23. Mingxu, S.U.; Anli, Y.; Jianming, Z.; Yongming, L.I.; Xiaoshu, C. Measurement of steam droplet size and content: A comparison of ultrasonic attenuation and light scattering. J. Cent. South Univ. (Sci. Technol.) 2016, 47, 654–660. [Google Scholar]
  24. Lang, M.J.; Duarte-Dominguez, M.; Arnold, W. Extension of frequency spectrum methods for phase velocity measurements in ultrasonic testing. Rev. Sci. Instrum. 2000, 71, 3470–3473. [Google Scholar] [CrossRef]
  25. Urick, R.J. The Absorption of Sound in Suspensions of Irregular Particles. J. Acoust. Soc. Am. 1948, 20, 283–289. [Google Scholar] [CrossRef]
  26. Rayleigh, L.; Nachtrieb, N.H. The Theory of Sound. Phys. Today 1856, 10, 32–34. [Google Scholar] [CrossRef]
  27. Weser, R.; Wöckel, S.; Wessely, B.; Hempel, U. Particle characterisation in highly concentrated dispersions using ultrasonic backscattering method. Ultrasonics 2013, 53, 706–716. [Google Scholar] [CrossRef] [PubMed]
  28. Thorne; Peter, D.; Hanes; Daniel, M. A review of acoustic measurement of small-scale sediment processes. Cont. Shelf Res. 2002, 22, 603–632. [Google Scholar] [CrossRef]
  29. Thorne, P.D.; Agrawal, Y.C.; Cacchione, D.A. A Comparison of Near-Bed Acoustic Backscatter and Laser Diffraction Measurements of Suspended Sediments. IEEE J. Ocean. Eng. 2007, 32, 225–235. [Google Scholar] [CrossRef]
  30. Thorne, P.D.; Hardcastle, P.J. Acoustic measurements of suspended sediments in turbulent currents and comparison with in-situ samples. J. Acoust. Soc. Am. 1997, 101, 2603–2614. [Google Scholar] [CrossRef]
  31. Thorne, P.D.; Vincent, C.E.; Hardcastle, P.J.; Rehman, S.; Pearson, N.D. Measuring suspended sediment concentrations using acoustic backscatter devices. Mar. Geol. 1991, 98, 7–16. [Google Scholar] [CrossRef]
  32. Rai, A.K.; Kumar, A. Continuous measurement of suspended sediment concentration: Technological advancement and future outlook. Measurement 2015, 76, 209–227. [Google Scholar] [CrossRef]
  33. Fugate, D.C.; Friedrichs, C.T. Determining concentration and fall velocity of estuarine particle populations using ADV, OBS and LISST. Cont. Shelf Res. 2002, 22, 1867–1886. [Google Scholar] [CrossRef]
  34. Arora, N.; Kumar, A.; Singal, S.K. Technological advancement in measurements of suspended sediment and hydraulic turbine erosion. Measurement 2022, 190, 110700. [Google Scholar] [CrossRef]
  35. Li, W.; Yang, S.; Yang, W.; Xiao, Y.; Fu, X.; Zhang, S. Estimating instantaneous concentration of suspended sediment using acoustic backscatter from an ADV. Int. J. Sediment Res. 2018, 34, 422–431. [Google Scholar] [CrossRef]
  36. Holdaway, G.P.; Thorne, P.D.; Flatt, D.; Jones, S.E.; Prandle, D. Comparison between ADCP and transmissometer measurements of suspended sediment concentration. Cont. Shelf Res. 1999, 19, 421–441. [Google Scholar] [CrossRef]
  37. Kuang, Z.; Yang, W.; Lin, H.; Bi, S.; Chen, Y.; Gao, Y.; Jing, S.; Li, J. Research on sediment concentration measurement based on multi-frequency ultrasonic signal response. Measurement 2023, 208, 112485. [Google Scholar] [CrossRef]
  38. Chen, Y.; Yang, W.; Lin, H.; Li, B.; Jing, S. Modified kernel density-based algorithm for despiking acoustic Doppler velocimeter data. Measurement 2022, 204, 112043. [Google Scholar] [CrossRef]
  39. Hay, A.E.; Sheng, J. Vertical profiles of suspended sand concentration and size from multifrequency acoustic backscatter. J. Geophys. Res. Ocean. 1992, 97, 15661–15677. [Google Scholar] [CrossRef]
  40. Flammer, G.H. Ultrasonic Measurement of Suspended Sediment; Us Geological Survey Bulletin A Government Printing Office: Washington, DC, USA, 1962. [Google Scholar]
  41. Rajaee, T.; Jafari, H. Two decades on the artificial intelligence models advancement for modeling river sediment concentration: State-of-the-art. J. Hydrol. 2020, 588, 125011. [Google Scholar] [CrossRef]
  42. Shui, Y.; Xue, Q. A dynamic model for piezoelectric composite transducers and coupling coefficient kt. J. Acoust. Soc. Am. 1994, 96, 3299. [Google Scholar] [CrossRef]
  43. Shui, Y.; Xue, Q. Dynamic characteristics of 2-2 piezoelectric composite transducers. IEEE Trans. Ultrason. Ferroelectr. Freq. Control 2002, 44, 1110–1119. [Google Scholar] [CrossRef]
  44. Nyquist, H. Certain topics in Telegraph Transmission Theory. Trans. Am. Inst. Electr. Eng. 1928, 47, 617–644. [Google Scholar] [CrossRef]
  45. Sun, H.; Nie, S.; Packman, A.I.; Zhang, Y.; Chen, D.; Lu, C.; Zheng, C. Application of Hausdorff fractal derivative to the determination of the vertical sediment concentration distribution. Int. J. Sediment Res. 2022, 38, 12–23. [Google Scholar] [CrossRef]
  46. Santos, A.I.; Carinhas, D.; Oliveira, A.; Pinto, J.P.; Hanes, D.M. A statistical interpretation of acoustic backscatter and laser responses to suspended particle variations in the coastal shelf. Mar. Geol. 2021, 436, 106474. [Google Scholar] [CrossRef]
  47. Panda, S.K.; Nag, S.; Jana, P.K. Normalization-Based Task Scheduling Algorithms for Heterogeneous Multi-Cloud Environment. In Proceedings of the International Conference on Parallel, Beijing, China, 1–4 September 2015. [Google Scholar]
  48. Yuyang, S.; Jerome, M. Comparisons of Different Instruments for Measuring Suspended Cohesive Sediment Concentrations. Water 2017, 9, 968. [Google Scholar] [CrossRef]
  49. Wang, W.; Xu, Z.; Zhang, C.; Liu, G.; Tian, J. Study of Coal Water Slurry Particle Size Distribution with Ultrasonic Testing Theory. In Proceedings of the Power and Energy Engineering Conference (APPEEC), 2010 Asia-Pacific, Chengdu, China, 28–31 March 2010. [Google Scholar]
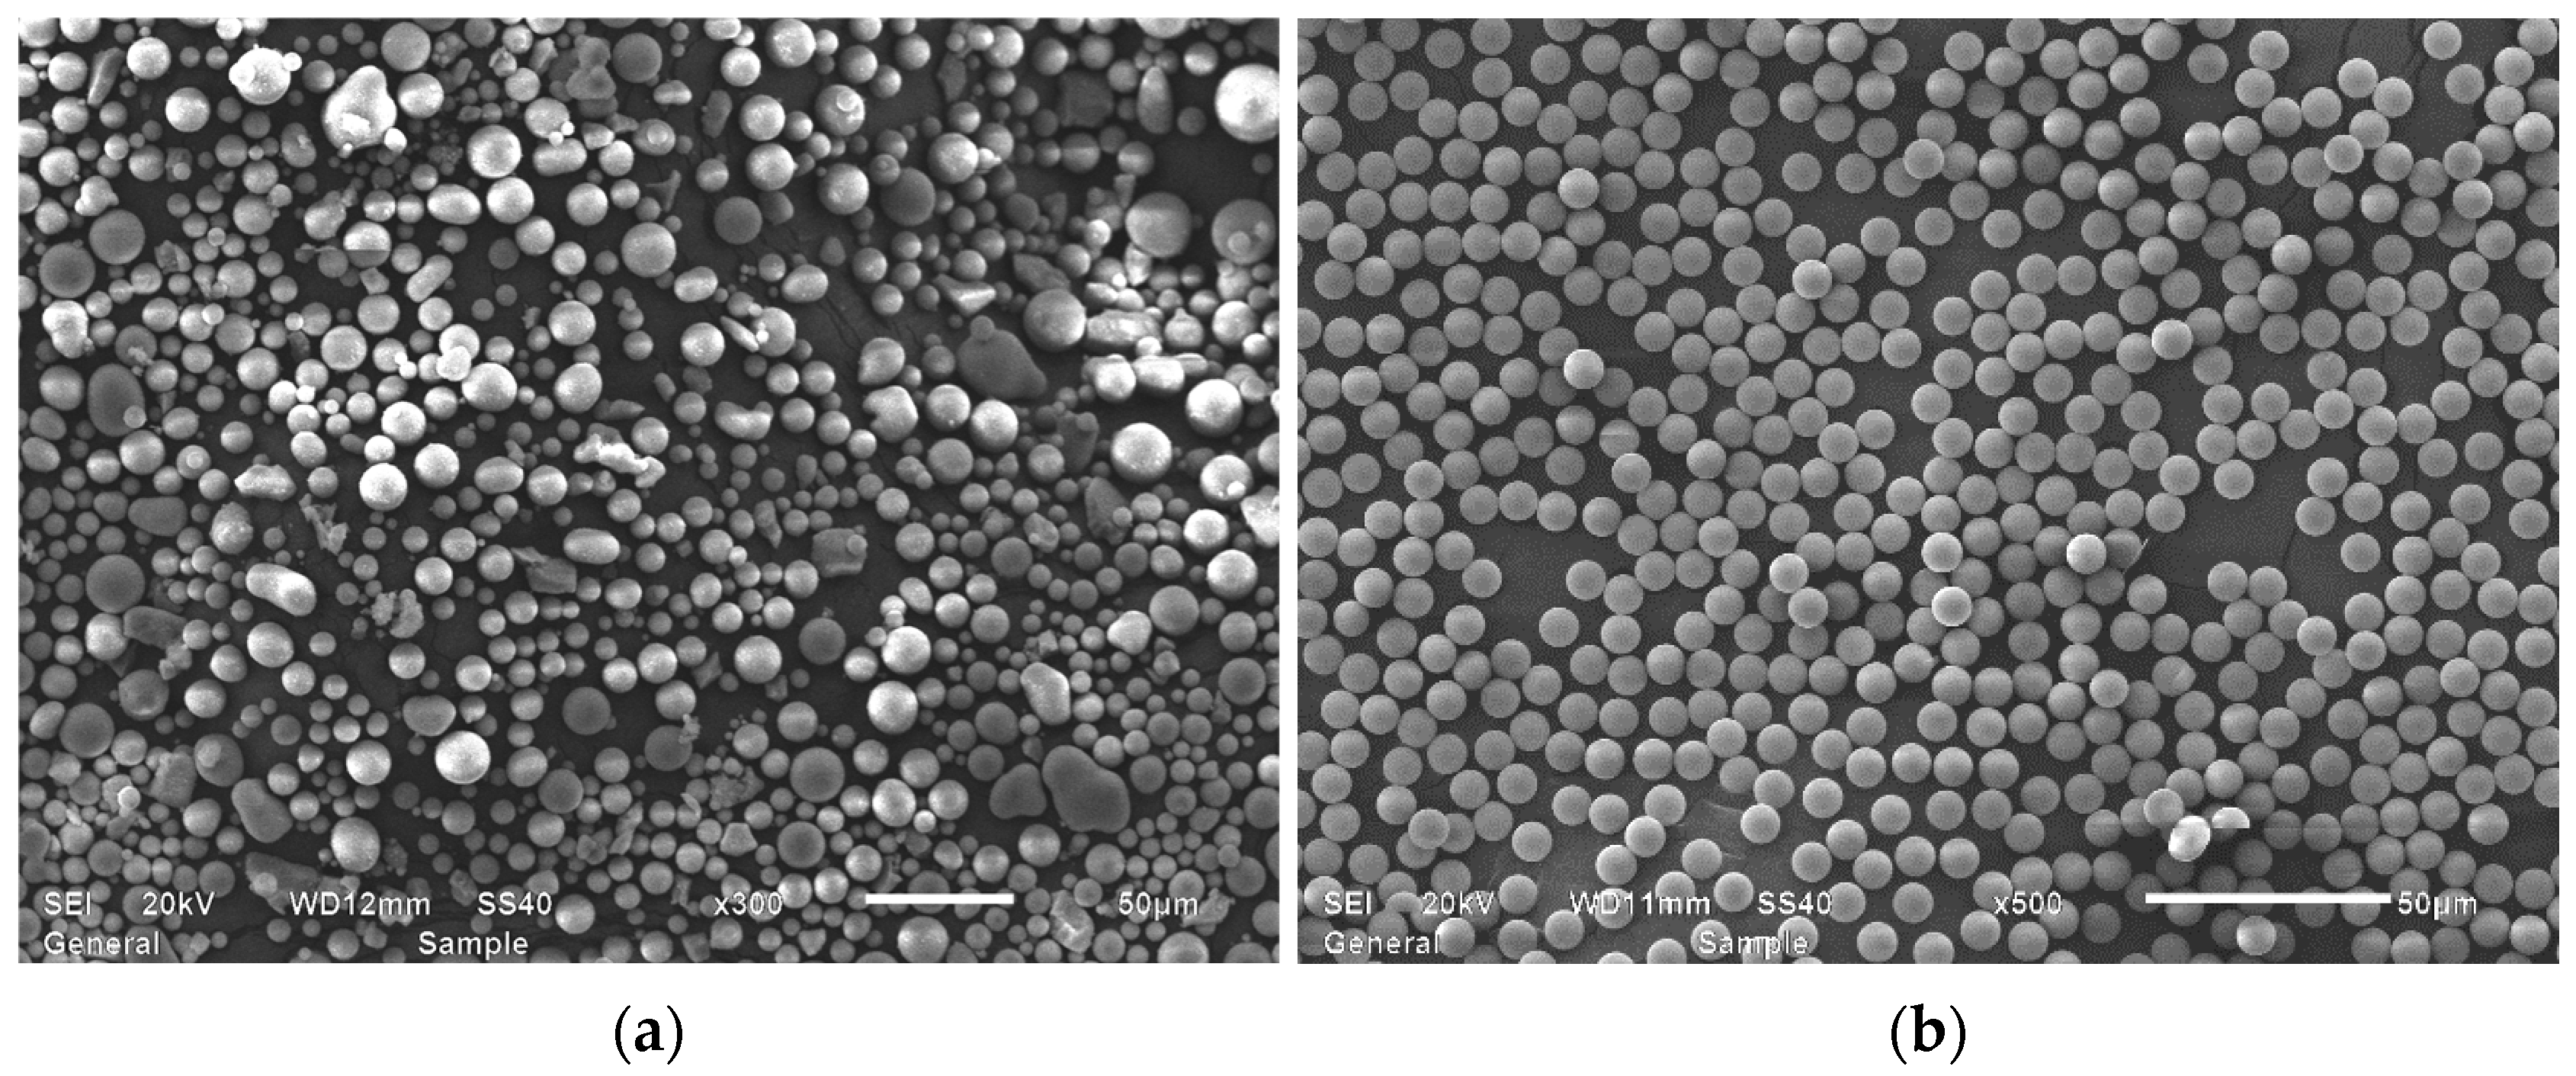
Figure 1. SEM observation of silica particles with nominal particle size of 0.015 mm from Vendor One (a) and Vendor Two (b).
Water 16 01973 g001
Figure 2. Diagram of the experimental setup. (a) Internal structure of the probe. (b) Exterior of the measuring instrument. (c) Overall schematic of the experimental setup.
Water 16 01973 g002
Figure 3. Fundamentals of ultrasonic backscatter measurements.
Water 16 01973 g003
Figure 4. Time-averaged normalised spectra for each particle size. (a) D = 0.006 mm. (b) D = 0.008 mm. (c) D = 0.012 mm. (d) D = 0.015 mm. (e) D = 0.020 mm. (f) D = 0.025 mm. (g) D = 0.030 mm. Note: The different coloured solid lines represent SSC = 0.05 kg/m3 to 1.60 kg/m3.
Water 16 01973 g004
Figure 5. Error plots for each converted particle size versus reference size. (a) Di = 0.006 mm. (b) Di = 0.012 mm. (c) Di = 0.015 mm. (d) Di = 0.020 mm. (e) Di = 0.025 mm. (f) Di = 0.030 mm. Note: Only the legend in (a) is written—the legends in (bf) are the same. The pink and cyan blue dotted lines represent error = 10% and error = −10%, respectively.
Water 16 01973 g005
Figure 6. Converted Amp vs. actual Amp.
Water 16 01973 g006
Table 1. Probe parameter information.
f n i (MHz) f min (MHz) f max (MHz) D c min (mm) D c max (mm)
5.03.06.50.0070.094
10.06.513.50.0040.043
15.013.519.50.0020.020
20.019.530.00.0020.014
Note: f min is the lower limit of the probe coverage bandwidth, f max is the upper limit of the probe coverage bandwidth, D c min is the lower limit of the theoretical measurable particle size of the probe, and D c max is the upper limit of the theoretical measurable particle size of the probe.
Table 2. Experimental settings of the particles.
Experimental Group D (mm)SSC (kg/m3)
Single particle size group0.0060.05, 0.10, 0.20, 0.40, 0.80, 1.60
0.008
0.012
0.015
0.020
0.025
0.030
Note: SSC, suspended sediment concentration.
Table 3. Near-field length calculation.
f n i (MHz) φ (mm) L (mm) L n i (mm)
5.06.030.035.0
10.05.042.065.0
15.01.89.023.0
20.01.811.023.0
Disclaimer/Publisher’s Note: The statements, opinions and data contained in all publications are solely those of the individual author(s) and contributor(s) and not of MDPI and/or the editor(s). MDPI and/or the editor(s) disclaim responsibility for any injury to people or property resulting from any ideas, methods, instructions or products referred to in the content.