Abstract
Surface runoff flows must be drained safely through culverts in ephemeral flow streams and bridges in perennial streams without any damage to the road or highway infrastructure stability. In practice, bridges cross drainage basin channels reliably, and they are more carefully planned, designed, constructed, and maintained against extreme water passages, but culverts are subject to even less frequent and intensive rainfall consequent surface runoff occurrences with higher risk potential. It is, therefore, necessary to design culverts more carefully in such a way that they drain down the upstream surface water without any critical problem to the road downstream of the road stream channels. Most of the hydrological, hydraulic, and sedimentological formulations are empirical expressions that are widely valid for locations where culverts are suitably developed based on simple bivalent logical rules between factors involved in upstream inlet locations of culverts. One of the first logic rule-based methods in the literature is Talbot’s procedural approach to culvert design. This approach is based not only on an explicit equation, but also on a set of linguistically proposed design rules that are expressed deterministically to effectively eliminate most of the ambiguities. This paper proposes a modified approach with additional logistic structural features based on a bivalent logic inference system, which is an improved version of the Talbot procedure and leads to better culvert transition surface flow prediction. The proposed method is applied to a local area in Tekirdağ City, Türkiye, where a serious train accident occurred due to a poorly maintained culvert.
1. Introduction
Highway and railway routes have numerous intersections with small or large-scale permanent and temporary drainage basins that carry water and, thus, distort the nature of surface runoff. In terms of road safety, in order to protect and ensure the sustainability of roads, highways, and railways, it is necessary to prevent and stop the water flow from damaging the routes and ensure that it passes from the upstream to the downstream side through hydraulic structures such as culverts. Pencol Engineering Consultants [1] mentioned maintenance, environmental conditions, installation errors, erosion, volume, and capacity calculation errors among the culvert failures. On the other hand, Chanson and Wang [2] concluded that a safe and steady flow through a culvert can accommodate and protect wildlife while reducing expensive erosion and structural damage.
A culvert is defined as a hydraulic structure that allows water to flow from one side to the other side under roads, railways, paths, or similar obstacles [3]. Kilgore et al. [4] wrote that culverts operate under a wide range of hydraulic and non-hydraulic conditions. They also stated that the lifespan of the culvert should be suitable for the purpose of installation. Kailan [5] stated that a full analytical analysis of the culvert based on a rational equation is very difficult, because changes in flow conditions over time due to periods of extreme flooding can cause degradation of the sedimentation material. Additionally, a study examining the interaction between groundwater and surface water showed that the partial exchange between surface and groundwater causes lateral flow from groundwater to surface water, which increases surface flow [6]. In regions where this situation occurs, surface flows must be analyzed very well, and culvert structures of appropriate sizes must be constructed. According to the Civil Engineering Portal website [7], the best culvert cross-section shape has circular geometry. The culvert design report should include the culvert type, length, design dimensions, cross-sectional area, and related elements required for complete design plans and maintenance [8]. According to Garg [9], box culverts are designed similarly to bridges, and new bridge designs are based on the load and resistance factor design determined by AASHTO [10]. Kumar and Srinivas [11] provided a definition of a box culvert consisting of four parts: upper and lower floors exposed to dead and live loads and two vertical sides. This is the simplest form of design, but the subfloor should be wedge-shaped, as suggested in this paper. Although the dead weight of the ground is the main design force in deep buried culvert structures, the effect of live load is not significantly taken into account [12]. Using the moment distribution method, Oyenuga [13] suggested that the box culvert should be considered as a rigid structure with moment formations at its corners. In general, culverts are defined and designed as drainage structures for storm drainage structures for road crossings under highways and railroads consisting of different materials, such as concrete and plastic. It must not be forgotten that culverts have certain functional life durations, which can be augmented by careful and systematic maintenance. For example, a study showed that even just improving the inlets in existing culverts significantly increases the performance [14].
The original Talbot method was developed in the late 19th century, at a time when rainfall records were not available and even the well-known rationally formulated runoff calculation approach, applicable only in small drainage basins, was not available. Talbot methodology is based on the geomorphological characteristics of the drainage basin in the upstream part of the culvert’s structure. It is time to update the classic Talbot culvert design and calculation methodology for today’s applications, especially in locations where surface flow measurement records are not available.
The main purpose of this article is to update the classical Talbot culvert design and calculation methodology with the application of advanced logical inference system principles, as well as to demonstrate the effectiveness of the proposed methodology despite the lack of rainfall records, since it is based on expert opinions. Linguistic information and interpretation lead to mathematical formulations and to numerical calculations. It shows that the proposed updated Talbot method is valid within ±10% error compared to some of today’s methodologies, such as the rational method. The application of this proposed method is presented for a railway culvert accident site located on the European side of Tekirdağ province of Turkey, next to the metropolitan city of Istanbul.
2. Culvert Design and Types
Control measures along highway and railroad routes can be classified as either non-structural or structural. Structural measures include physical interventions, such as the construction of culverts, levees, bridges, channel improvements, stream diversions, and other embankments. These are implemented to prevent floods from affecting sensitive areas. On the other hand, non-structural measures focus on planning, analyzing flood situations, floodplain zoning, and protection against floods. The aim is to reduce the risk of flood damage by keeping people and important engineering structures away from areas prone to devastating floods. Non-structural measures generally result in much lower costs than structural interventions.
Although the local and central government envisages building some culverts and bridges to reduce and protect against flood hazards during the project phase of the proposed infrastructure investments, unfortunately, these existing methods may not fully protect the working area due to uncertainty; thus, interferences prevent the accurate prediction of the behavior of natural phenomena such as inundation and flash floods. The construction of inappropriate and improperly designed drainage structures, such as culverts, bridges, floodwalls, gullies, and levees, as well as human interventions, can cause detrimental effects on transport infrastructure during inundation or exaggeration of floods. Therefore, the design of drainage structures must be planned, operated, and maintained according to scientific engineering rules.
As a first step in transport infrastructure drainage design, it is appropriate to divide the area of interest into different sections using digital elevation model (DEM) maps. It is important to pay special attention to surface (runoff) and subsurface (groundwater) issues in each section. In addition to considering flow, in mountainous and rolling terrain, sections should also not cover large areas, because such lands have steep slopes with the potential of possible rock falls, landslides, and debris flow risks. During periods of heavy rainfall, the culverts operate at full capacity. In other words, not the cross-sectional area of the culverts (for security reasons), but a large part of them, is filled not only with water but also with sedimentation, to a certain extent. As shown in Figure 1 on a horizontal plane, culverts connect the upper part of the same drainage basin to the lower part. In the vertical plane, the same configuration is shown in Figure 2.
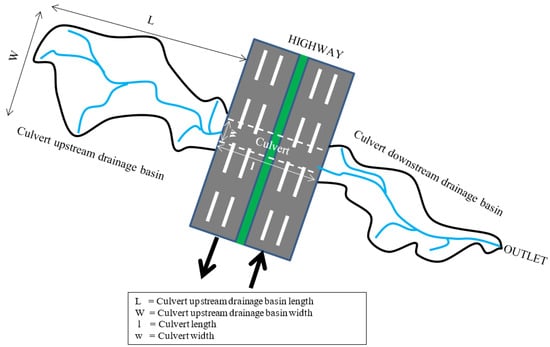
Figure 1.
Culvert’s upstream and downstream parts on a horizontal plane.

Figure 2.
Culvert and highway cross-sectional area.
In very small drainage basins, the rational method can be applied for surface discharge calculations, but the surface near the culvert entrance and exit consists mainly of rubble, which accumulates like a dam as a result of heavy rainfall, possibly causing blockage of the flow. Therefore, both upstream and downstream areas of culverts should be checked regularly for debris accumulation.
Extreme floods such as those in this study consist of excessive surface water flowing over natural or artificial riverbanks or transportation infrastructures due to inadequate culvert design. In the early stages of hydrological rainfall-runoff modeling, simplified approaches are often adopted. The following simplifying factor assumptions are considered in empirical flood prediction studies.
- Storm precipitation that produces floods is distributed evenly throughout the drainage basin during the storm period;
- The peak time of the hydrograph is considered equal to the concentration time, and the time taken for a water drop falling at the farthest point of the drainage basin to reach the outlet is considered;
- In heavy rains, the runoff coefficient should be the same throughout the drainage basin;
- The basin slope is taken as uniform throughout the whole drainage basin.
Culverts are made of stone, steel, or concrete pipes with rectangular, trapezium, triangular, circular, or oval sections; pipe arches; and corrugated metal construction plates that allow water to pass through the structure. Culverts are used in normal bridge construction, where the main water channel is usually dry and narrow. The road passing through the drainage basin meets some requirements that can be summarized as follows.
- At the points where the drainage basin channels intersect with the road, culverts of appropriate type and size should be placed, designed, and constructed to allow flood waters to pass underneath the road without erosion;
- Concrete head and wing walls should be built on the upstream side of the culvert to reduce the flood speed and erosion process.
In addition to being empty, full, or overcharged, culverts are exposed to different loads due to factors such as effective sizes, live loads, impact, sediment transport, and water pressure. Therefore, the structure must be designed to withstand maximum bending moment. The followings are required for culvert drainage area calculation [15]:
- (1)
- Rainfall intensity–duration–frequency (IDF) curves;
- (2)
- Analysis of wet and dry periods;
- (3)
- Assessment of debris and gullies risk along the road;
- (4)
- Culvert capacity calculations;
- (5)
- Calculations regarding the volume and risk of rivers and stream flows;
- (6)
- Sediment transport calculations;
- (7)
- Assessment of rock fall and landslide, as well as their probability and risk;
- (8)
- Morphological study and instability analysis;
- (9)
- Calculations regarding infiltration, subsurface, and groundwater flow.
In addition, even the general drainage basin (catchment) and small sub-basins located along the road alignment (route) are important in terms of surface runoff calculations. Flow discharges at each borehole provide useful information not only on hazard and risk probabilities, but also on the sizing of roadside channels and culvert capacities. Watershed features such as areas, slopes, and other important quantities can be obtained from DEM, as well as geological maps and Google Earth surface features. The combination of all the data can be used for the necessary hydrogeological calculations of local undrained areas along the road or railroad alignment. Utilizing this, the necessary measures, plans, designs, and management strategies can be implemented for future maintenance and protection. Management here means managing the risk of debris flow, rockfall, slope failure, and wedge failure along the road.
3. Culvert Dimension Calculations
A culvert consists of an inlet for water intake, an outlet for water discharge, and a barrel-shaped structure connecting the two ends (Figure 1). The term “tailwater” refers to the water depth on the downstream side, while “headwater” refers to the water depth on the upstream side.
A culvert acts as a passage connecting two open-channel sections during dry periods and two water bodies during wet periods. The widely recognized type is the rectangular cross-section box culvert (Figure 2).
Culvert length and slope should be appropriate for the surrounding topography. The culvert entrance must be compatible with the fill slope of the embankment. In general, the slope of a culvert should be suitable for the average stream bed slope. This rule is not applicable on steep terrains, and therefore, the culvert slope should be determined based on experts’ judgement, considering past experience, field studies, expected sedimentation, debris flow and mud-flow forecasts, local geology, and storm runoff. Unfortunately, the previously built culverts were not designed properly. The reason for improper culvert design was mainly due to misconsideration of topographic, meteorological, climatologic, engineering geologic, hydrologic, and hydrogeological factors as a whole. Therefore, the consequences of incorrect or inadequate design can result in tragic accidents. The following statements summarize the primary disadvantages of both current and past designs for drop inlets and culverts [15].
- (1)
- Drop inlets have vertical walls that lack the additional gravity and culvert-directed forces for downward debris flow and rock fragments;
- (2)
- The bottom of a drop inlets includes a horizontal flat surface that allows debris flow and rock fragments to accumulate without any assistance as they enter the headwater portion of the culvert;
- (3)
- Horizontal dimensions of drop inlets do not have enough space for the entry of debris flow;
- (4)
- Classical rectangular box culverts that do not show significant performance in wet and dry periods;
- (5)
- There may not be enough slope in the culvert to facilitate easy rolling of rock pieces or debris gravel pieces;
- (6)
- The box culvert surface slope is enough for water flow, but insufficient to provide the appropriate gravitational force to move solid material flow.
In order to eliminate the mentioned disadvantages, a special design obtained as a result of a comprehensive scientific study is recommended for both drop inlet and box culvert water flow surfaces and cross-sections [15]. Box culverts designed for highways in this study area have notable and distinctive features when compared to other components in most global highway water drainage systems.
- (1)
- The drop inlet section of the drainage system has inclined walls on three sides, except for the box culvert entrance;
- (2)
- The bottom of the drop inlet is also inclined, albeit at a gentler slope, which facilitates the entry of debris flow or rock fragments into the headwater section of the culvert;
- (3)
- The horizontal size of the drop inlets is determined according to the results obtained depending on the peak discharge, debris flow volume, rock fragment quantities, and 50% safety factor, as well as the recommendations obtained from the findings previously presented in the relevant engineering culvert design reports;
- (4)
- The cross-sections of the culverts can be rectangular, triangular, or especially circular. This design allows for the functionality of water, mud, debris, and rock flow even during dry periods or low-intensity rainfall–runoff situations;
- (5)
- The longitudinal slopes of the culvert are maximized from the upstream water to the tailwater section, thus facilitating movement by ensuring that any debris entering the culvert is exposed to additional gravitational force, facilitating downstream movement;
- (6)
- The additional weight applied upstream along the length of the culvert helps to stabilize the culvert under the road surface covering;
- (7)
- The cooperation function of the drop inlet and culvert system is improved by incorporating varied slopes throughout the entire system.
Depending on the availability of space at the top of the road, the drop inlet area can be rather big. In general, it is recommended that the drop inlet dimensions for each box culvert be at least as 5.0 × 1.5 × 0.9 m3 [16].
Talbot [17] provided the culvert design procedure when rainfall records were not available, and therefore, all his calculations are empirical based solely on the relationships between the geometrical parameters of the drainage basin and culvert area. The method called the classical Talbot (CT) method was later developed as the modified Talbot (MT) method. In this study, a simple new graphical method based on a practical statistical inference system is proposed and explained as the improved innovative Talbot (IT) method.
3.1. Calculation of Culvert Dimensions by CT Method
In the original Talbot method, the area, A (ft2), of the water passing through the culvert is expressed in terms of the directly proportional and non-linear basin area, D (acre), as follows [17]:
where C is the Talbot coefficient. When the units in the formula are converted to the SI system, Equation (1) takes the following form, with A in m2 and D in km2.
In this context, C values, depending on the topographic features of the drainage basin, are given in Table 1.

Table 1.
Talbot coefficient values [17].
For example, if the area of the catchment basin is 1.45 km2 and the terrain is slightly wavy, the cross-sectional area of the culvert below is calculated according to Equation (2) for the required cross-sectional area of the culvert. .
3.2. Calculation of Culvert Dimensions by MT Method
The CT method was developed and further improved as the modified Talbot method (MT) by classifying three different classes of watersheds, namely, “medium”, “large”, and “regional”, as drainage basin areas of 400–1258 hectares, 1258–35,944 hectares, and larger than 35,944 hectares, respectively [18,19]. The basic equation giving the maximum discharge value, Q (m3/s), in the modified method is as follows.
Q = K C An Rf Ff
Here, the constant K takes values of 0.558 for medium-sized basins, 3.561 for large basins, and 10.166 for regional basins. C is a flow coefficient claimed to be the sum of C1, C2, and C3, where C1 is a coefficient of field conditions, C2 is the drainage area slope coefficient, and C3 is the shape coefficient of the catchment area. Depending on the field conditions, Table 2 shows the values of C1, C2, and C3. In the given formula, A represents the drainage area in hectares, and n is an exponent determined by the size of the drainage area, with values of 0.75, 0.50, and 0.40 for medium, large, and regional basins, respectively. Rf = 1.5 for the middle-class basin and 1.4 for the large and regional basins is the recommended precipitation coefficient, and finally, Ff = a frequency coefficient based on the design storm frequency, which is shown in Table 3.

Table 2.
C1, C2, and C3 coefficients [18].

Table 3.
Design storm frequency coefficient Ff [18].
The storm frequencies of the proposed designs are given in Table 3 according to the values expressed as recurrence times over the years.
The MT method gives the peak discharge, but in practical applications, the Manning’s formula is used to calculate the maximum flow velocity, V (m/s), that can pass through the existing culvert. The formula is expressed as:
Here, n is the Manning roughness coefficient, Rh is the hydraulic radius (wet area (m2)/wet perimeter (m), and S is the hydraulic slope (%).
3.3. Calculation of Culvert Dimensions by IT Method
The relevant information in Table 1, Table 2 and Table 3 is presented in discretely spaced numerical forms, but applications may require any values within these ranges. Therefore, in order to take into account any number in each range for applications, the information in the table must be converted to mathematical functional forms. For this purpose, graphs corresponding to this table and the data in Figure 2 were obtained by applying simple regression methodology, and Figure 3, Figure 4 and Figure 5 were obtained.
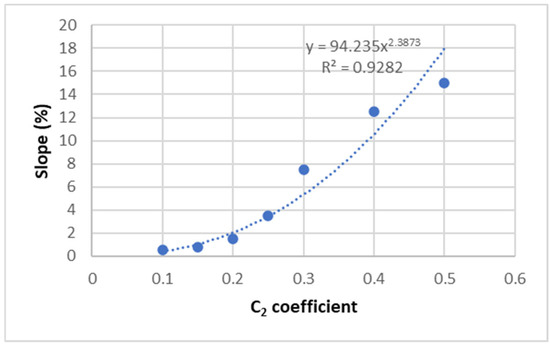
Figure 3.
C2 coefficient versus slope (%).
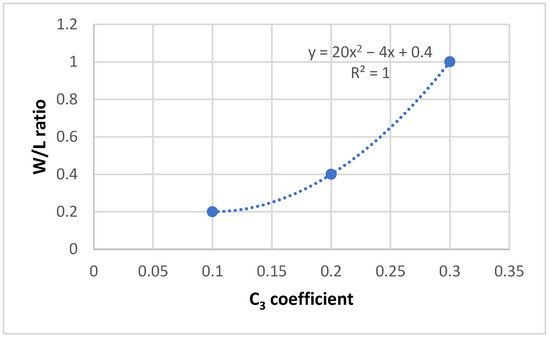
Figure 4.
C3 coefficient versus width–length (W/L) ratio.
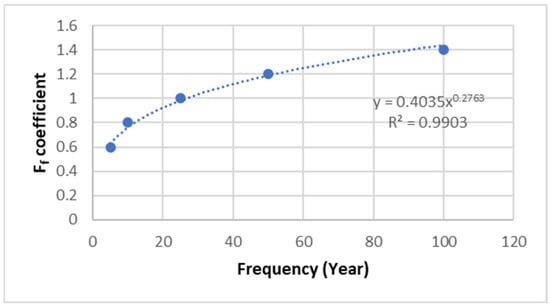
Figure 5.
Frequency (year) versus Ff coefficient.
The mathematical relationship between coefficient C2 and the drainage basin slope is in the form of a power function expressing a straight line on double logarithmic paper, which expresses the concept of self-similarity in fractal geometry, according to Mandelbrot [20].
This relationship is parabolic, meaning that as the width–length ratio increases, C3 also increases.
The general form of the relationship is a power function, implying that such a relationship shows the property of fractal geometrical self-similarity [20].
In each of these last three figures, classical regression methodology gives mathematical expressions with coefficients of determination above 0.95, so the model predicts more than 95% of the relationship.
Sensitivity analysis of these parameters was performed to confirm the appropriateness of the improved method. One-way sensitivity analysis was used as the sensitivity analysis method, and is presented for each parameter in Figure 6, Figure 7 and Figure 8.
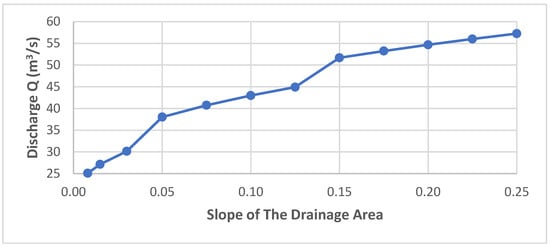
Figure 6.
One-way sensitivity analysis of slope of the drainage area.
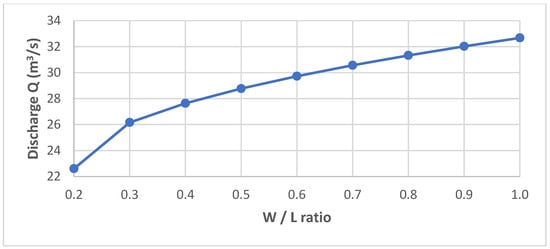
Figure 7.
One-way sensitivity analysis of width–length (W/L) ratio.
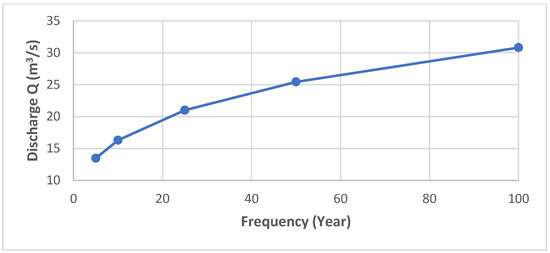
Figure 8.
One-way sensitivity analysis of frequency (year).
When the analysis is examined, it is seen that the W/L ratio is quite sensitive in the discharge prediction, despite the relatively more limited range.
4. Application
The results of the Talbot method, one of the oldest methods used in culvert design, are investigated with actual application at the location of the culvert that caused the train accident in Tekirdağ Province, adjacent to the metropolitan city of Istanbul on the European side of Turkey. Here, the values obtained from the developed method are compared with the existing Talbot culvert water passage results. The culvert is located at km:161 + 955 around Sarılar Village, between Balabanlı and Çorlu railway stations in the Çorlu district of Tekirdağ Province (see Figure 9).
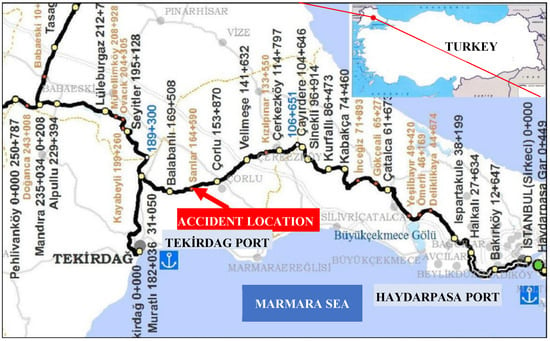
Figure 9.
Culvert accident location [21].
It is estimated that the culvert was built in 1873, approximately 151 years ago. The culvert, with an opening of 1.5 m, has a debushing of 2 m, as shown in Figure 10. When looking at the cross-section of the culvert, it is possible to say that there is an area of approximately 3 m2 for water passage.
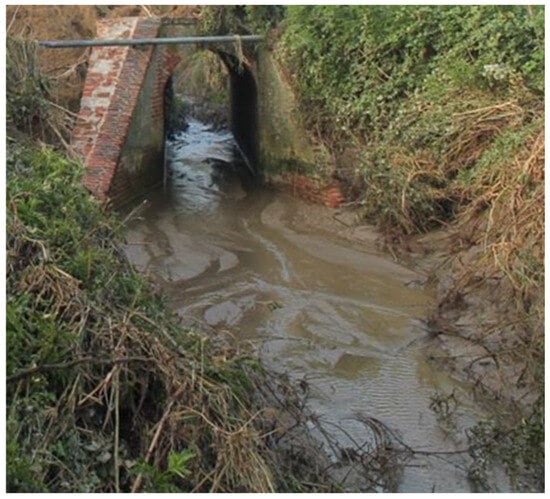
Figure 10.
Sarılar village culvert appearance at km: 161 + 955 [21].
The basin served by the culvert was determined using the 12.5 m high-resolution digital elevation model (DEM) data of the region in the Watershed Modeling System (WMS) program. Accordingly, the area of the basin is 1.45 km2. Satellite images of the basin and water collection lines are shown in Figure 11 and Figure 12, respectively, considering the current land conditions. It can be seen that the basin, which generally consists of agricultural land, has a slightly undulating topography.
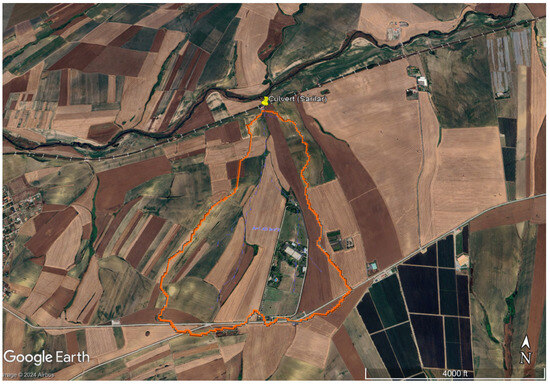
Figure 11.
Satellite view of the drainage basin [22].
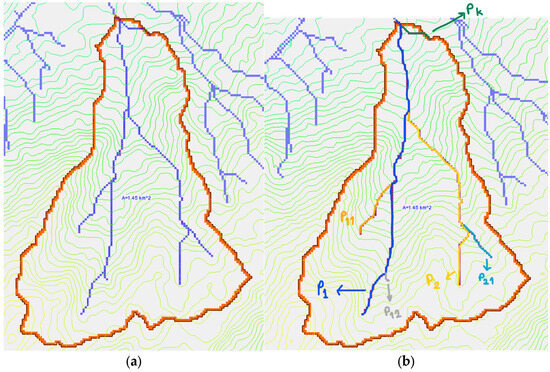
Figure 12.
(a) Drainage basin area and water divide line. (b) Given names for the channels in the drainage basin.
The longitudinal section of the basin is drawn through the points where the main channel line intersects with the contour lines. Accordingly, the average slope (grade) of the basin is about 3.4% (see Figure 13).
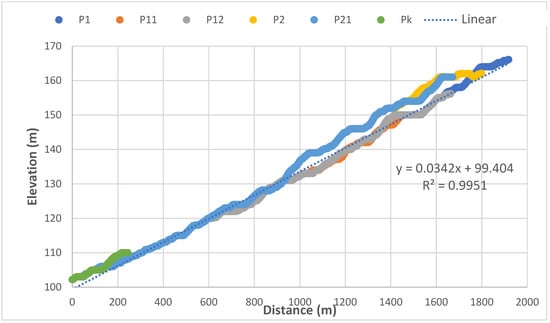
Figure 13.
Longitudinal cross-sections along the main channel.
Considering the topography of the basin, the numerical values of the coefficients explained above can be considered as C1 = 0.10 (low land), C2 = 0.25 (2% < S = 3.4% < 5%), and C3 = 0.30 (acceptable as W = L), and thus, C = C1 + C2 + C3 = 0.65. The design storm frequency coefficient is Ff = 1.40 (100 years). In addition, since the K, n, and Rf coefficients do not have values specific to small-class basins, the coefficients for the middle-class basin were used as K = 0.558, n = 0.75, and Rf = 1.5. Accordingly, the maximum discharge value that passes through the culvert is calculated as follows.
Initially, the average velocity of the cross-sectional area of the flow is determined; then, this value is multiplied by the culvert area to find the maximum flow rate passing through the existing culvert.
For the application of the Manning formula, the roughness coefficient of the culvert for brick surfaces coated with cement mortar in partially filled closed channels is adapted as 0.015, according to the recommendation by Chow [23]. For the hydraulic radius value, it is assumed that flow covers a full section of the culvert. The average slope of the basin and the hydraulic slope are assumed to be the same. Accordingly, the maximum discharge that the existing culvert can pass is calculated as follows.
In addition to the sample study, discharges calculated using the classical Talbot (CT) and modified Talbot (MT) methods in various virtual basins with different characteristics are compared in Table 4. Accordingly, it has been observed that the modified Talbot (MT) method calculates higher discharge when the slope of the drainage area is low. On the other hand, it has been concluded that the discharge obtained using the classical Talbot (CT) method is higher in areas with a high slope.

Table 4.
Comparison of the classical Talbot (CT) and modified Talbot (MT) methods.
5. Debris Flow Calculation
From a logical perspective, there exists a direct relationship between peak discharge and debris flow. Evaluating peak discharge, especially in terms of flow velocity, plays a vital role in evaluating the carrying capacity of stream channel sections and critical locations such as under bridges or culverts. It has been shown by Hungr et al. [24], Mizuyama et al. [25], and Takahashi et al. [26] that empirical relationships are valid between the peak discharge, Qp, of a debris flow and the debris flow volume, VD. Table 5 proposes a set of equations for calculating debris flow.

Table 5.
Debris flow volume, V, and peak discharge relationships [15].
Rickenmann and Koch [29] suggested using a double logarithmic paper plot to show the relationship between peak discharge and debris flow volume, as shown in Figure 14.
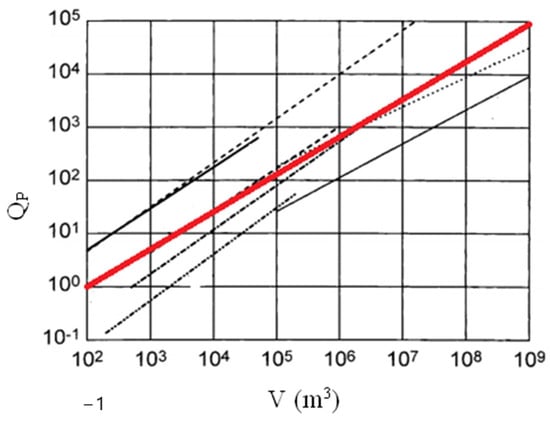
Figure 14.
Empirical relationship between QP and V [15].
In this figure, the red line represents the average expression between the peak discharge and debris flow volume described by Şen [15]. This relationship is represented by the following equation:
This expression is for debris flow calculations, and final values for gullies are given in Table 5. This table provides the total debris flow efficiency from the entire gully area.
Alternatively, the debris flow volume can be expressed as the inverse of this equation, which has the following expression:
If the water volume per second and debris flow amounts are known, the inlet cross-sectional area of the culvert can be calculated. In addition, in safety studies, the final volume per second is increased by 50%, which is a safety factor used in many civil engineering projects. The cross-sectional areas of the culverts are required in order to calculate the two types of debris flow assessments.
- (1)
- Sudden debris flow before the entrance of each culvert;
- (2)
- Gradual spread of debris flow along culverts.
6. Discussion
Multiplying the classical Talbot (CT) culvert area expression in Equation (1) with the Manning flow velocity formulation leads to the culvert discharge as follows:
Here, C is a coefficient taken according to Table 1 based on the topographic feature definition. On the other hand, the discharge calculation made by using the modified Talbot (MT) method, taking into account the characteristics of the culvert’s upstream drainage area, can only be calculated using Equation (3) [18].
A comparison of the CT and MT methods shows the following important differences.
- (1)
- There is no rainfall amount or intensity parameter in either approach, but in the MT method, rainfall is empirically expressed by the storm frequency factor, Ff. In the CT procedure, the hydraulic velocity formulation is used as in Equation (4).
- (2)
- In the CT method, the C coefficient depends on topographic features without making any determination regarding the drainage basin slope or dimensional sizes, while in the MT approach, the slope and width–length ratio are taken into account.
- (3)
- n refers to the Manning coefficient depending on the flow canal material types, but in the MT approach, it depends on the drainage basin size, which is “medium”, “large”, or “regional”.
- (4)
- Empirically, a precipitation coefficient is entered in the MT method, whereas there is no precipitation representative factor in the CT procedure.
- (5)
- In the MT procedure, return periods are considered with an empirical addition in the name of the frequency coefficient, Ff, but there is no such a concept in the CT method.
- (6)
- Equation (7) gives the culvert discharge calculation for the CT procedure, whereas the Equation (3)-based discharge calculation originates from the culvert’s upstream drainage area.
- (7)
- The empirical formulation of MT is very similar to the present-day flood calculation considering intensity–duration–frequency (IDF) curves, whereas CT has no similarity.
It is also important and meaningful to compare the MT method discharge formulation with the rational method expression, which can be expressed as follows:
where C is the runoff coefficient, A is the culvert’s upstream drainage basin area, and I is the rainfall intensity. The main difference of the rational formulation from CT and MT approaches is that each variable on the right-hand side is linearly related to the discharge, which is quite simple, but cannot be applied to large drainage basin areas of more than 5 km2 [23].
7. Conclusions
Culvert design planning is very important to allow water passage under highway and railway routes, reducing the risk of runoff and excessive flooding. This is one of the most uncertain aspects of road construction, and thus, there are many empirical formulations, some of which are locally valid and others of which have wider validity, but still carry a vestige of uncertainty. This paper focuses on one of the oldest culvert design calculation methodologies, known in the literature as the classical Talbot (CT) method, which was first developed without any precipitation records and was later modified by better approximations to the modified Talbot (MT) method. Both the CT and MT methods have been proven to be empirical and only take into account drainage basin morphology, along with the empirical implications of the precipitation factor in terms of the storm frequency coefficient and frequency within the year, which are similar to the existing recurrence intervals based on the intensity–duration–frequency (IDF) curves. An application of the CT and MT methods is presented for the culvert fault location under the railway route in Tekirdağ. The methodology proposed in this paper is recommended for further applications in different parts of the world, especially where rainfall–runoff records are not available. On the other hand, since the entire study is based on bivalent (crisp) logic with expert systems, it is suggested that, in future studies, the fuzzy logic inference system be used as a productive path for future research works.
Author Contributions
Ö.U.: investigation, formal analysis and data collection, writing—original draft, writing—review and editing. A.H.L.: writing—original draft, writing—review. Z.Ş.: writing—original draft, writing—review. All authors have read and agreed to the published version of the manuscript.
Funding
The APC was funded by Istanbul Medipol University.
Data Availability Statement
Some or all data, models, or code that support the findings of this study are available from the corresponding author upon reasonable request.
Conflicts of Interest
The authors declare no conflicts of interest.
References
- Pencol Engineering Consultants. Design Manual for Irrigation and Drainage; Ministry of Irrigation: Baghdad, Iraq, 1983; p. 530. [Google Scholar]
- Wang, H.; Chanson, H. Baffle systems to facilitate upstream fish passage in standard box culverts: How about fish-turbulence interplay? In Proceedings of the 37th IAHR World Congress, Kuala Lumpur, Malaysia, 13–18 August 2017; Ghani, A.A., Chan, N.W., Ariffin, J., Wahab, A.K., Harun, S., Kassim, A.H., Karim, O., Eds.; IAHR & USAINS HOLDING SDN BHD Publication: Kuala Lumpur, Malaysia, 2017; Volume 3, Theme 3.1. pp. 2586–2595. [Google Scholar]
- Creamer, P.A. Culvert Hydraulics: Basic Principle, Professional Development Series (PDF); CONTECH Bridge Solutions Inc.: Butler County, OH, USA, 2007. [Google Scholar]
- Kilgore, R.T.; Morris, J.L.; Schall, J.D.; Thompson, P.L.; Zerges, S.M. Hydraulic Design of Highway Culverts, 3rd ed.; Federal Highway Administration (FHWA): Washington, DC, USA, 2012; p. 326. [Google Scholar]
- Kailan, A.L. Hydraulic Structures, Water Resources Engineering Lectures; Department of Civil Engineering, Al-Mansour University College: Baghdad, Iraq, 2015; Chapter 5. [Google Scholar]
- Lu, C.; Ji, K.; Wang, W.; Zhang, Y.; Ealotswe, T.K.; Qin, W.; Lu, J.; Liu, B.; Shu, L. Estimation of the Interaction between Groundwater and Surface Water Based on Flow Routing Using an Improved Nonlinear Muskingum-Cunge Method. Water Resour Manag. 2021, 35, 2649–2666. [Google Scholar] [CrossRef]
- Civil Engineering Portal. What Are the Differences in Applications between Pipe Culverts and Box Culverts? 2012. Available online: http://www.engineeringcivil.com/what-are-the-differences-in-applications-between-pipe-culverts-and-box-culverts.html (accessed on 22 August 2023).
- Bolden, J.; Carroll, T.; Muller, D.; Snoke, D. Structural Management Unit Manual; North Carolina Department of Transportation (NCDOT): Newton, NC, USA, 2016; p. 180. [Google Scholar]
- Garg, A.K. Experimental and Finite Element Based Investigations of Shear Behavior of Reinforced Concrete Box Culverts. Ph.D. Dissertation, Department of Civil Engineering, The University of Texas at Arlington, Arlington, TX, USA, 2007. [Google Scholar]
- American Association of State Highway and Transportation Officials. AASHTO LRFD Bridge Design Specifications SI Units, 4th ed.; American Association of State Highway and Transportation Official: New York, NY, USA, 2007; p. 1590. [Google Scholar]
- Kumar, Y.V.; Srinivas, C. Analysis and Design of Box Culvert by using Computational Methods. Int. J. Eng. Sci. Res. 2015, 5, 850–861. [Google Scholar]
- Kim, K.; Yoo, C. Design Loading for Deeply Buried Box Culverts; Highway Research Center Auburn University, Auburn University: Auburn, AL, USA, 2002. [Google Scholar]
- Oyenuga, V.O. Fundamentals of Reinforced Concrete Design; Agros Limited: Lagos, Nigeria, 2001; p. 415. [Google Scholar]
- Jaeger, R.; Tondera, K.; Pather, S.; Porter, M.; Jacobs, C.; Tindale, N. Flow Control in Culverts: A Performance Comparison between Inlet and Outlet Control. Water 2019, 11, 1408. [Google Scholar] [CrossRef]
- Şen, Z. Flood Design Discharge and Case Studies. In Flood Modeling, Prediction and Mitigation; Springer: Cham, Switzerland, 2017. [Google Scholar] [CrossRef]
- Şen, Z. (Istanbul Medipol University, Istanbul, Turkey). Personal communication, 2023.
- Talbot, A.N. The Determination of Water-Way for Bridges and Culverts; Selected Papers of the Engineers’ Club, Technograph No. 2; University of Illinois: Chicago, IL, USA, 1887–1888; pp. 14–22. [Google Scholar]
- Wilson-Murrow. Drainage Report; A Report Submitted to Ministry of Communications: Riyadh, Saudi Arabia, 1971; p. 217. [Google Scholar]
- Quraishi, A.A.; Al-Hassoun, S.A. Use of Talbot formula for estimating peak discharge in Saudi Arabia. J. King Abdulaziz Univ. 1996, 8, 73–75. [Google Scholar] [CrossRef]
- Mandelbrot, B.B. Les Objects Fractals: Forme, Hasard et Dimension [Fractal Objects: Form, Chance and Dimension]; Flammarion: Paris, France, 1975. [Google Scholar]
- UEİM. 8 Temmuz 2018 Tarihindeki 12703 Numaralı Trenin Deray Kazasına İlişkin Kaza İnceleme Raporu NO:1/DMY-5/2019. (Assessment Report on Train Accident on 8 July 2018 with Report NO:1/DMY-5/2019). 2019. Available online: https://ulasimemniyeti.uab.gov.tr/uploads/pages/12703-yolcu-treni-deray-kazasina-iliskin-kaza-ince/tekirdag-deray-heyet-onayli-5d64d42bc63ae.pdf (accessed on 9 July 2023).
- Google. Google Earth. [5M4Q+CGR Çorlu, Tekirdağ]. Available online: https://earth.google.com/web/search/41%C2%B009%2722%22N+27%C2%B041%2719.6%22E (accessed on 9 July 2023).
- Chow, V.T. Open Channel Hydraulics; McGraw-Hill Book Company: New York, NY, USA, 1959. [Google Scholar]
- Hungr, O.; Morgan, G.C.; Kellerhals, R. Quantitative analysis of debris torrent hazards for design of remedial measures. Can. Geotech. J. 1984, 21, 663–677. [Google Scholar] [CrossRef]
- Mizuyama, T.; Kobashi, S.; Ou, G. Prediction of debris flow peak discharge. In Proceedings of the Symposium Interpraevent, Bern, Switzerland, 29 June–3 July 1992; Volume 4, pp. 99–108. [Google Scholar]
- Takahashi, T.; Sawada, T.; Suwa, H.; Mizuyama, T.; Mizuhara, K.; Wu, J.; Tang, B.; Kang, Z.; Zhou, B. Japan-China joint research on the prevention from debris flow hazards. In Research Report; Japanese Ministry of Education, Science and Culture, International Scientific Research Program No. 03044085; Japanese Ministry of Education: Tokyo, Japan, 1994. [Google Scholar]
- Costa, J.E. Rheologic, geomorphic, and sedimentological differentiation of water floods, hyper concentrated flows, and debris flows. In Flood Geomorphology; Baker, V.R., Kochel, R.C., Patton, P.C., Eds.; Wiley: New York, NY, USA, 1988; pp. 113–122. [Google Scholar]
- Costa, J.E. Floods from dam failures. In Flood Geomorphology; Baker, V.R., Kochel, R.C., Patton, P.C., Eds.; Wiley: New York, NY, USA, 1988; pp. 439–463. [Google Scholar]
- Rickenmann, D.; Koch, T. Comparison of debris flow modelling approaches. In Proceedings of the First International Conference on Debris Flow Hazards Mitigation, San Francisco, CA, USA, 7–9 August 1997; ASCE: Reston, VA, USA, 1997; pp. 576–585. [Google Scholar]
Disclaimer/Publisher’s Note: The statements, opinions and data contained in all publications are solely those of the individual author(s) and contributor(s) and not of MDPI and/or the editor(s). MDPI and/or the editor(s) disclaim responsibility for any injury to people or property resulting from any ideas, methods, instructions or products referred to in the content. |
© 2024 by the authors. Licensee MDPI, Basel, Switzerland. This article is an open access article distributed under the terms and conditions of the Creative Commons Attribution (CC BY) license (https://creativecommons.org/licenses/by/4.0/).