Article

Inversion Method for Monitoring Daily Variations in Terrestrial Water Storage Changes in the Yellow River Basin Based on GNSS

Key Laboratory of Mine Spatio-Temporal Information and Ecological Restoration, Henan Polytechnic University, Jiaozuo 454000, China
*
Author to whom correspondence should be addressed.
Water 2024, 16(13), 1919; https://doi.org/10.3390/w16131919
Submission received: 3 June 2024 / Revised: 28 June 2024 / Accepted: 1 July 2024 / Published: 5 July 2024

Abstract

:
The uneven distribution of global navigation satellite system (GNSS) continuous stations in the Yellow River Basin, combined with the sparse distribution of GNSS continuous stations in some regions and the weak far-field load signals, poses challenges in using GNSS vertical displacement data to invert terrestrial water storage changes (TWSCs). To achieve the inversion of water reserves in the Yellow River Basin using unevenly distributed GNSS continuous station data, in this study, we employed the Tikhonov regularization method to invert the terrestrial water storage (TWS) in the Yellow River Basin using vertical displacement data from network engineering and the Crustal Movement Observation Network of China (CMONOC) GNSS continuous stations from 2011 to 2022. In addition, we applied an inverse distance weighting smoothing factor, which was designed to account for the GNSS station distribution density, to smooth the inversion results. Consequently, a gridded product of the TWS in the Yellow River Basin with a spatial resolution of 0.5 degrees on a daily scale was obtained. To validate the effectiveness of the proposed method, a correlation analysis was conducted between the inversion results and the daily TWS from the Global Land Data Assimilation System (GLDAS), yielding a correlation coefficient of 0.68, indicating a strong correlation, which verifies the effectiveness of the method proposed in this paper. Based on the inversion results, we analyzed the spatial–temporal distribution trends and patterns in the Yellow River Basin and found that the average TWS decreased at a rate of 0.027 mm/d from 2011 to 2017, and then increased at a rate of 0.010 mm/d from 2017 to 2022. The TWS decreased from the lower-middle to lower reaches, while it increased from the upper-middle to upper reaches. Furthermore, an attribution analysis of the terrestrial water storage changes in the Yellow River Basin was conducted, and the correlation coefficients between the monthly average water storage changes inverted from the results and the monthly average precipitation, evapotranspiration, and surface temperature (AvgSurfT) from the GLDAS were 0.63, −0.65, and −0.69, respectively. This indicates that precipitation, evapotranspiration, and surface temperature were significant factors affecting the TWSCs in the Yellow River Basin.

1. Introduction

The Yellow River, also known as the Mother River of China, plays a pivotal role in maintaining the stability of the ecosystem and supporting economic and social development [1]. However, the Yellow River Basin faces severe water scarcity, uneven spatial distribution of water, and frequent occurrences of floods and droughts. Therefore, studying the spatial and temporal distribution patterns of the terrestrial water storage (TWS) in the Yellow River Basin can provide scientific evidence for the rational management and regulation of water resources, as well as the prevention and control of flood and drought disasters.
Changes in the TWS can cause variations in the Earth’s gravitational field and surface deformation, due to load changes, thus enabling the inversion of TWS changes via the monitoring of the changes in the gravity field and surface deformation [2]. In March 2002, the successful launch of the Gravity Recovery and Climate Experiment (GRACE) satellite promoted the development of large-scale water storage monitoring technology. Some scholars have successfully applied GRACE/GRACE-follow-on (FO) data to monitor TWSCs globally, including in Europe, North and South America, and the northeastern part of Australia [3,4]. Other scholars have used GRACE data to invert the terrestrial water storage in the Yellow River Basin. Shengnan et al. used the GRACE data of 2002–2011 to invert the 10-year TWS changes in the Yellow River Basin and found that the TWS in the basin exhibited fluctuations in spring, the most significant changes in autumn, and clear seasonal and annual patterns [5]. Ding et al. used GRACE data from 2005–2010 to invert the 5-year TWSCs in the Yellow River Basin and identified annual variations with a wet and dry cycle period of 2.37 a [6]. Xie et al. utilized GRACE data from 2003–2015 to invert the 13-year TWSCs in the Yellow River Basin and concluded that the upstream region exhibited an overall decreasing trend, with distinct seasonal characteristics, and the changes were greater in autumn than those observed in spring [7]. Zhao et al. analyzed GRACE data from 2002–2018 to invert the 17-year TWSCs in the Yellow River Basin and found that the TWS decreased at a rate of 2.65 ± 0.8 mm equivalent water column height per year [8]. Xie et al. employed GRACE/GRACE-FO data from 2004–2021 to invert the 18-year TWSCs in the Yellow River Basin and concluded that the TWS decreased at a rate of 0.56 cm/a, exhibiting a seasonal periodicity of surplus in summer and autumn and deficit in spring and winter [9]. Although existing studies have successfully inverted the TWS in the Yellow River Basin using GRACE/GRACE-FO and have analyzed its change trends and distribution characteristics, the spatial resolution of GRACE/GRACE-FO data is limited to a maximum of 0.5 degrees, and the temporal resolution is of 1 month. In addition, issues such as north–south stripe noise, signal leakage, and missing data for some months pose limitations in inverting the TWS in the Yellow River Basin using GRACE/GRACE-FO data [10,11].
The continuous global navigation satellite system (GNSS) station data include surface deformation at the millimeter level and are sensitive to mass load changes within approximately 100 km of the station [12]. Compared with using GRACE/GRACE-FO data for water storage inversion, these data are more suitable for inverting TWSCs at the regional or basin scale [13,14]. Davis et al. were the first to identify the strong correlation between the terrestrial water load deformation in the Amazon Basin and the time series of global positioning system (GPS) coordinate displacement [15]. Wahr et al. pioneered the use of GNSS horizontal and vertical displacements to analyze the mass changes in two large outlet glaciers in southeastern Greenland and inverted the water level changes in Shasta Lake [16]. Argus et al. inverted and validated the effectiveness of using GPS continuous station data to estimate the TWS in California, USA, with a temporal resolution of 1 day and a spatial resolution of 50 km [17]. Heki et al. found that the seasonal and periodic patterns of dense GPS continuous data for Japan were strongly correlated with changes in the snow, reservoir storage, atmospheric loading, and soil moisture and concluded that GPS continuous data can be applied to invert TWSCs [18]. Jiang et al. achieved good results by inverting TWSCs in Yunnan Province using data for 55 GNSS continuous stations and utilizing the principal component analysis method [19,20]. The above studies, which inverted TWSCs using dense GNSS vertical displacement data, achieved good inversion results. However, in areas with an uneven distribution of GNSS stations, especially in regions with a sparse station distribution, it is difficult to achieve reliable TWSC inversion based on GNSS vertical displacement data [21]. Zhong et al. used GNSS to invert the TWSCs in southwestern China, analyzed the impact of different station distributions on the GNSS inversion results, and reported the uncertainty of the inversion accuracy in sparse areas [22]. In regions with uneven GNSS station distributions, most studies have improved the reliability of the inversion results at the edges and sparse station distribution areas of the study area by constructing different Laplacian matrices and introducing optimal regularization parameters. However, these methods do not consider the differences in the load deformation signals in regions with different distribution densities, and the use of a single optimal regularization parameter can lead to issues such as excessive smoothing in areas with a dense station distribution and insufficient smoothing in areas with a sparse station distribution [2,21,23]. Currently, more than 70 GNSS continuous stations are located near the Yellow River Basin, with an average spacing of about 120 km, providing the basic conditions for inverting the water storage in the Yellow River Basin using GNSS continuous stations. However, the uneven distribution of the GNSS continuous stations in the Yellow River Basin, that is, fewer stations in some areas, results in weak load deformation signals from far-field loads, making it difficult to invert the TWSCs in the Yellow River Basin using vertical displacement data from the GNSS stations.
To realize the daily TWSC inversion in the Yellow River Basin using the vertical displacement data from GNSS stations, in this study, we obtained vertical displacement change data from 2011–2022 from 70 GNSS continuous stations within and near the Yellow River Basin from the Eastern Geophysical Service Center. The Tikhonov regularization method was adopted to invert the TWSCs in the Yellow River Basin. An inverse distance-weighted smoothing parameter that considers the density of the GNSS stations was designed to weigh and smooth the inversion results. This approach enabled the inversion of the spatiotemporal distribution changes in the TWS in the Yellow River Basin over the past 12 years using unevenly distributed GNSS vertical displacement data. The spatial resolution of the inversion was 0.5 degrees, and the temporal resolution was 1 day.

2. Materials

2.1. Overview of the Study Area

The Yellow River is located between 32° N and 42° N and between 96° E and 119° E. It flows through nine provinces and regions in northern China. It has a total length of approximately 5464 km and a drainage area of 795,000 km2 [24]. The climate in the Yellow River Basin can be divided into the following three zones: arid, semi-arid, and semi-humid. Summer and autumn are the wet periods, and spring and winter are the dry periods. The annual average precipitation ranges from 300 to 850 mm, and the annual water surface evaporation ranges from 1300 to 1600 mm [25,26]. Based on natural factors such as topography, geomorphology, and hydrology, the Yellow River can be divided into the following three sections: the upper, middle, and lower reaches. The upper and middle reaches are separated by Hekou, in Tuoketuo County, Inner Mongolia, while the middle and lower reaches are separated by the Taohuayu Garden Mouth in Zhengzhou, Henan Province. The upper reaches contain a vast area with less precipitation, resulting in relatively stable runoff, and the surface water accounts for about 70% of the total area. The middle reaches experience frequent heavy rainfall and intense precipitation, and the surface water accounts for approximately 20% of the area. The area of the lower reaches is narrow, and the surface water accounts for roughly 10% of the total area [27]. An overview map of the study area is shown in Figure 1.

2.2. Selection of Experimental Data

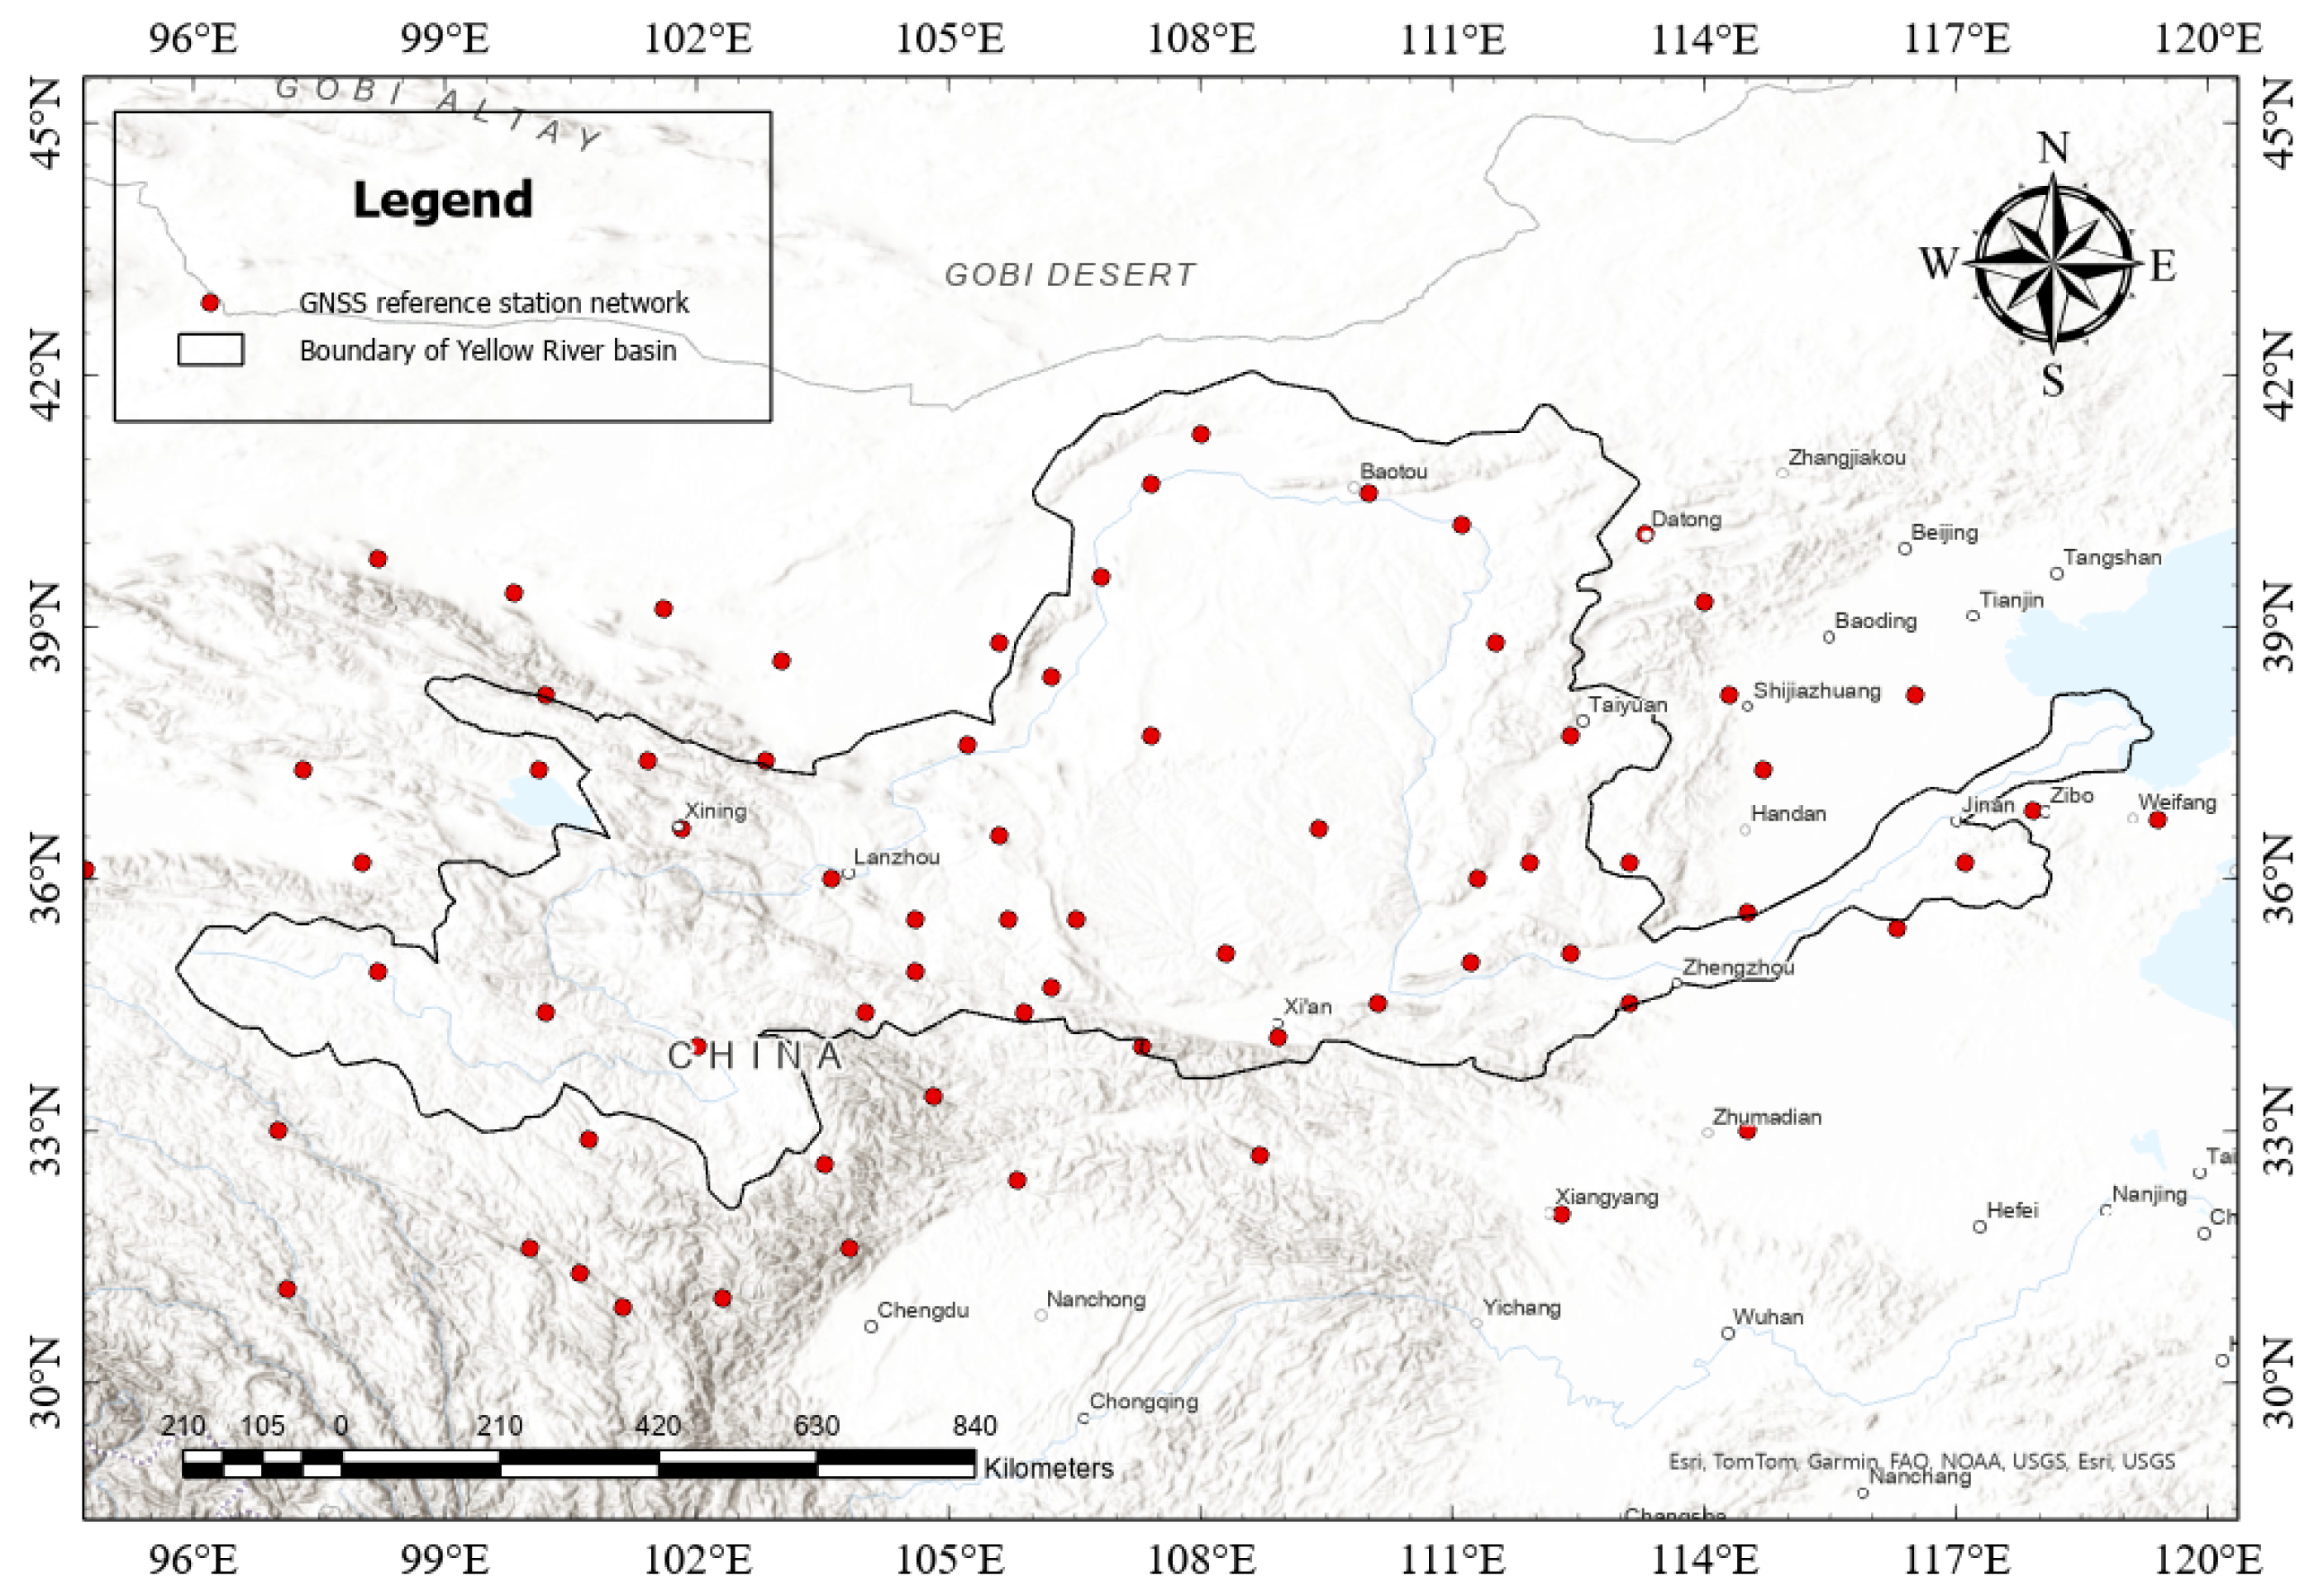
The vertical displacement data from the GNSS continuous stations used to retrieve the water storage information were obtained from the Eastern Crustal Deformation Data Center (https://www.eqdsc.com ( accessed on 5 March 2024)), and the boundary of the Yellow River Basin was extended by 1 degree. Time series data of the vertical displacements from 70 GNSS continuous stations were acquired. The spatial distribution of these stations is shown in Figure 2.
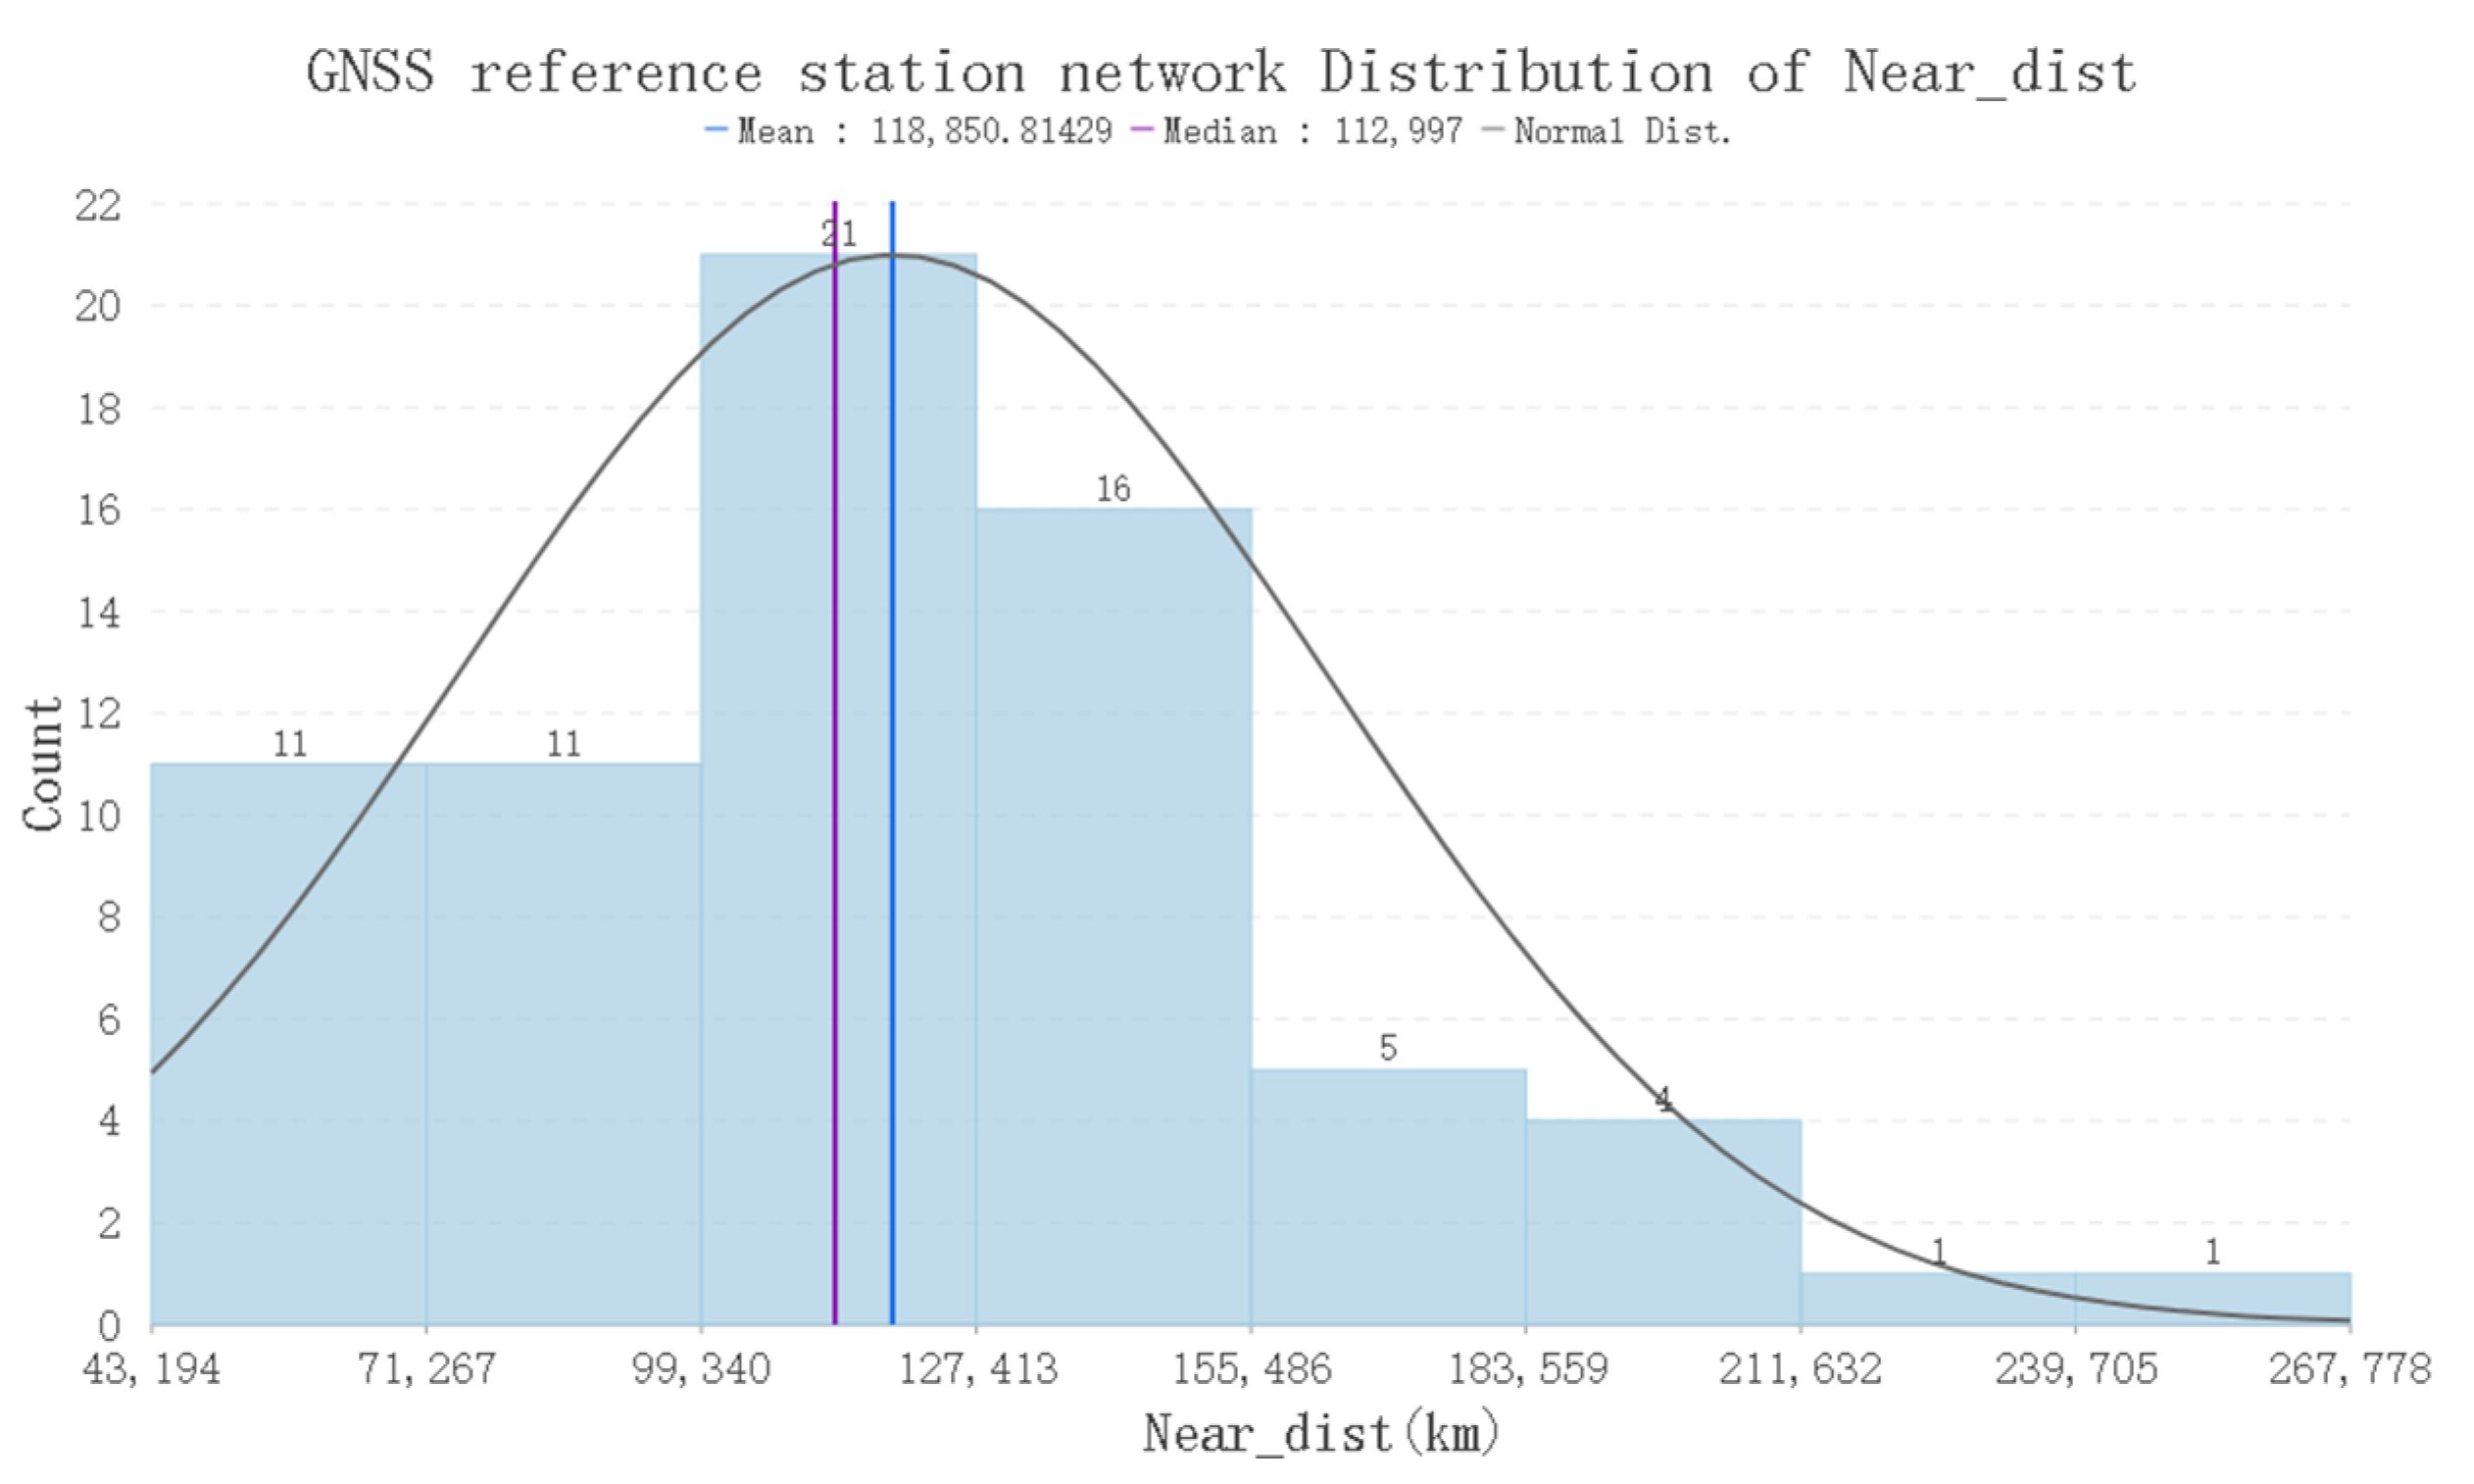
The average distance between consecutive GNSS stations was 118 km, with minimum and maximum distances of 43 and 267 km, respectively (Figure 3). This was particularly noticeable in the northern part of the upper and middle reaches, where the distribution of the stations was extremely sparse. This affected the accuracy of the inversion.
Using the land water processing, evapotranspiration, and surface temperature from the global land surface data assimilation system (GLDAS) for comparison and verification data, a daily dataset with a resolution of 0.1 degrees from 90° E to 120° E and from 30° N to 42° N was obtained from the system developed jointly by the National Aeronautics and Space Administration (NASA) Goddard Space Flight Center and the National Oceanic and Atmospheric Administration (NOAA) Environmental Prediction Center (https://disc.gsfc.nasa.gov accessed on 11 March 2024) during the study period.

2.3. Preprocessing of Experimental Data

The vertical displacement data from the GNSS continuous stations included problems such as gross observation errors caused by external interference, steps caused by seismic activity, and data gaps caused by equipment failure. Before inverting the equivalent water height (EWH), it was necessary to remove the gross errors, repair the step point data, and fit the missing data [28,29,30].
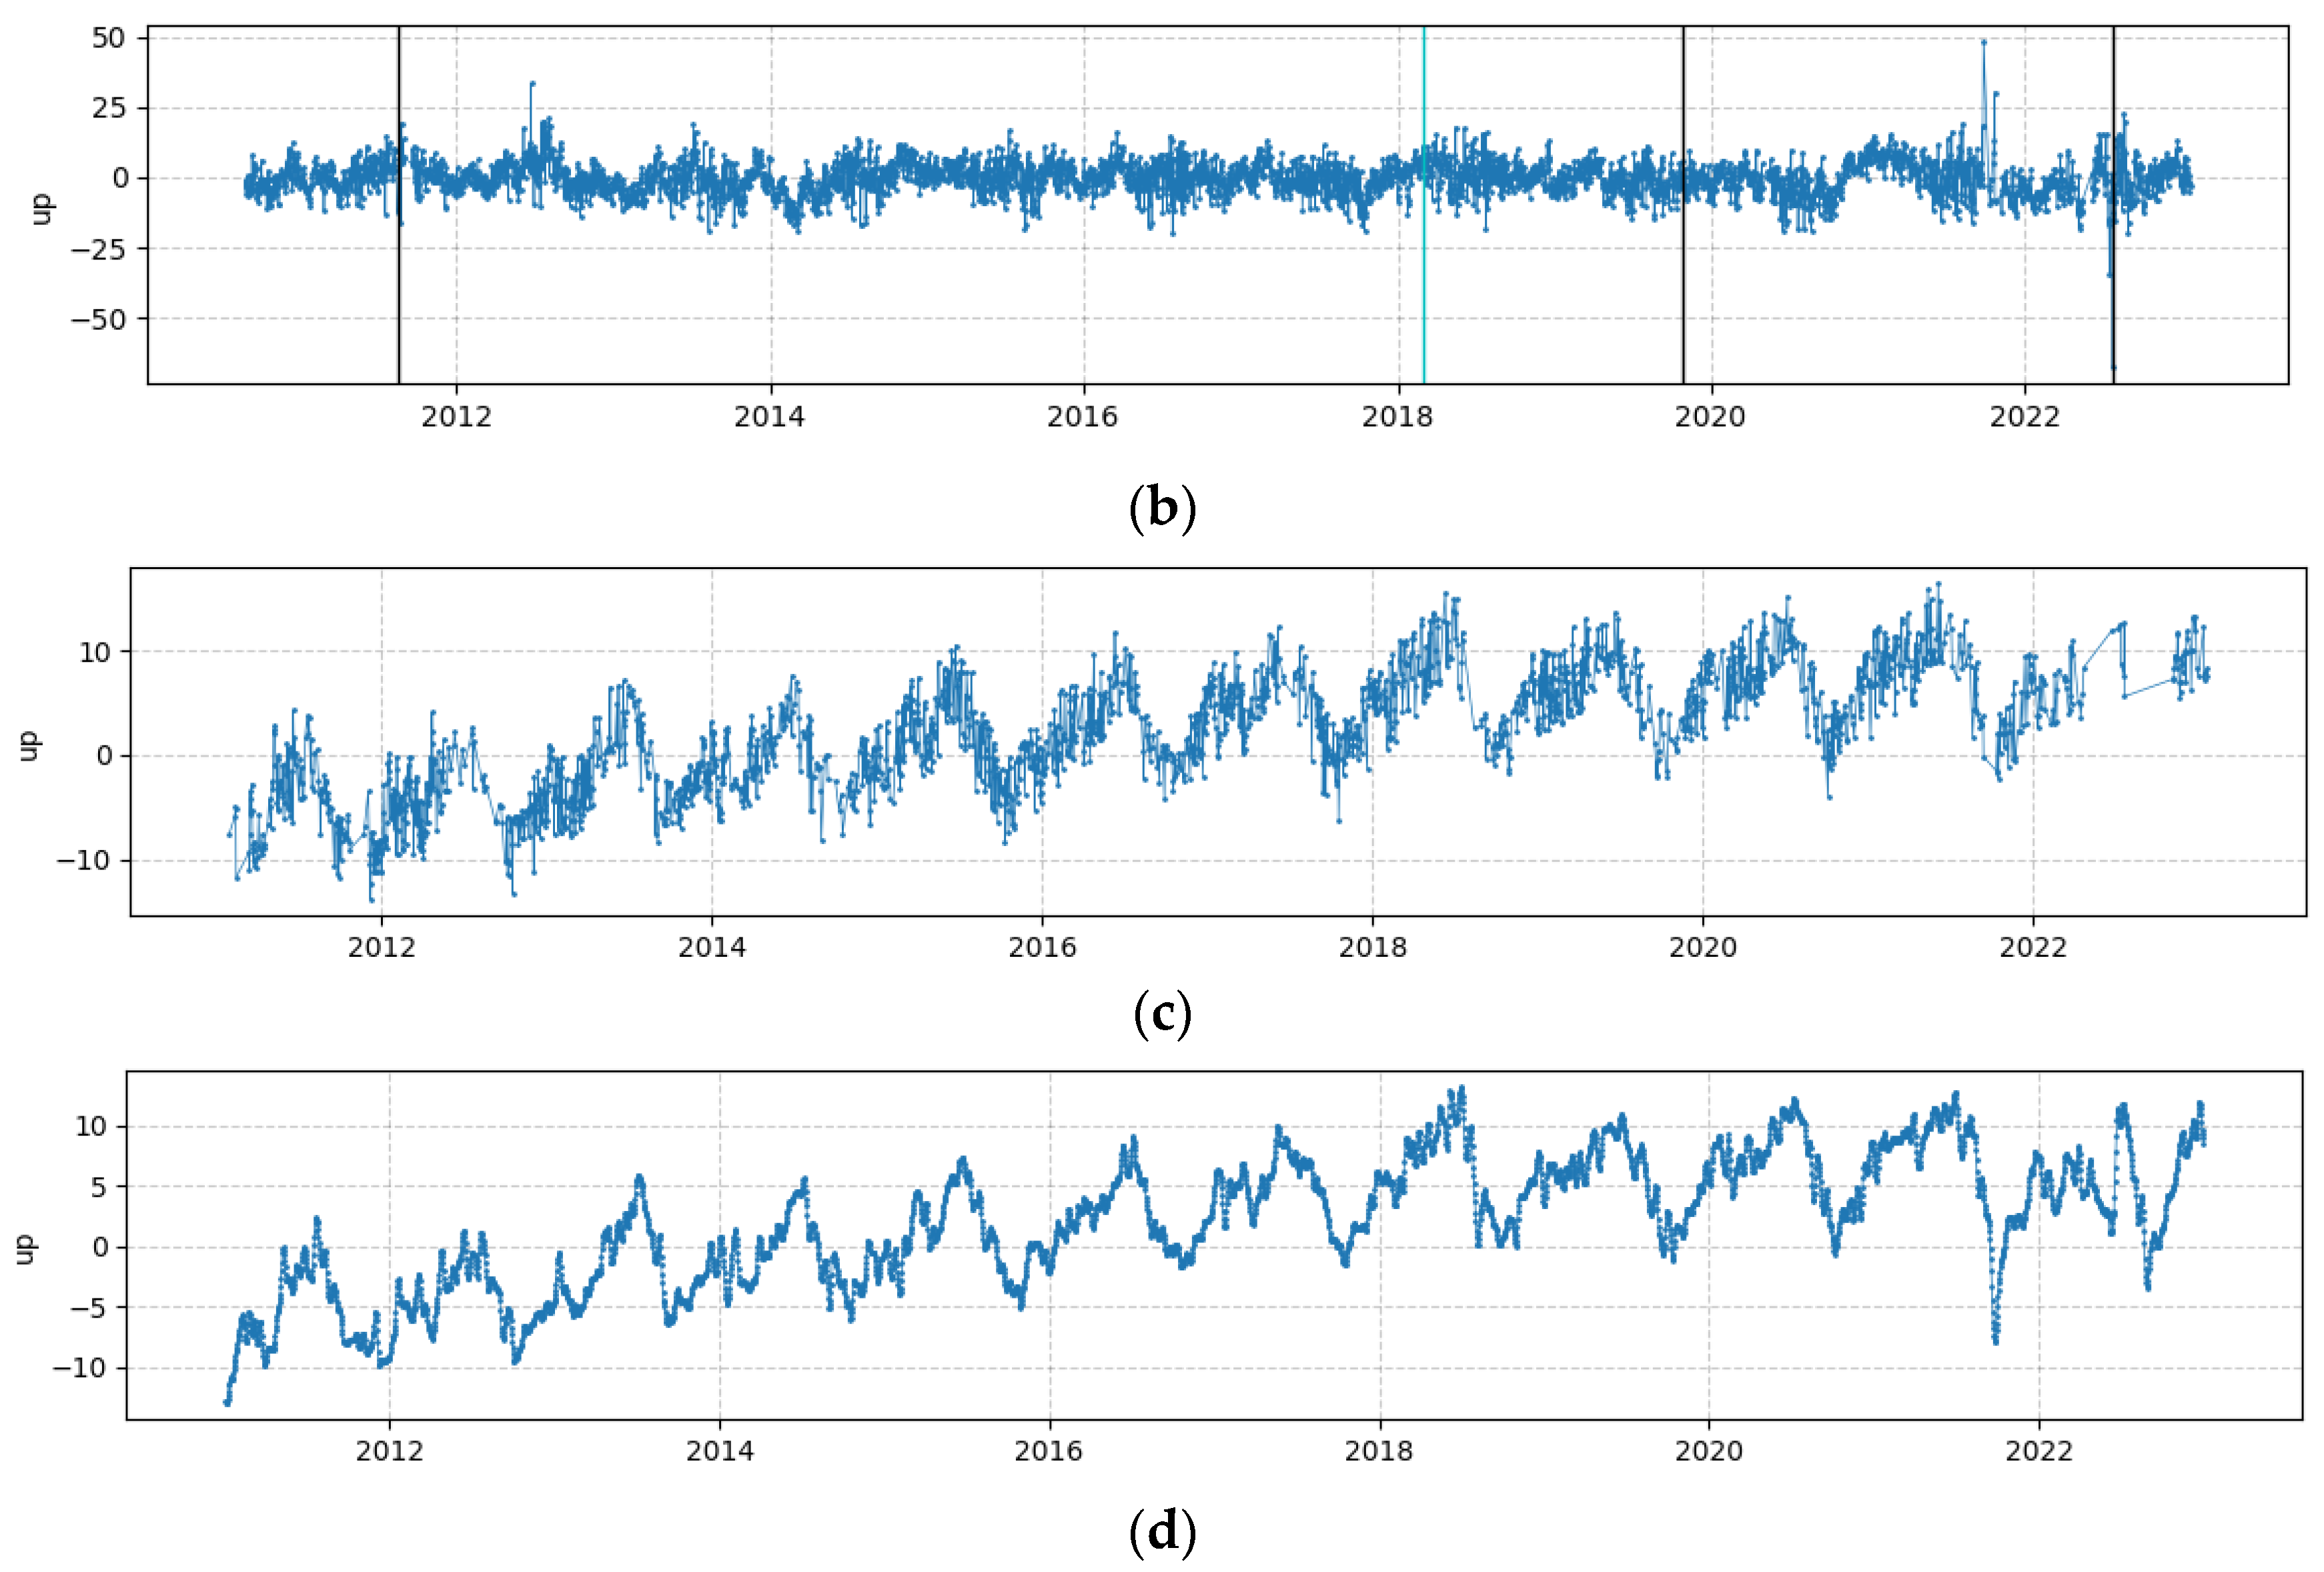
The data preprocessing steps were as follows: step data detection and repair, observation gross error removal, and fitting of the missing data. In the experiment, the L1 regularization method (also known as Lasso regularization), which is a technique that adds the L1 norm of the weights as a penalty term to the model’s loss function to control the complexity of the model and avoid overfitting, was used. The principle is expressed in the formula as follows:   L ( L 1 ) = L d a t a + λ i = 1 n ω i , where   L ( L 1 ) is the regularized loss function, L d a t a represents the data loss of the model, λ is the regularization parameter, and ω i represents the absolute value of the model’s weights. Reference [28] was used to perform discontinuity detection on the data (Figure 4a) to obtain the locations of offset steps and then to repair the step points (Figure 4b). The gross observation error was addressed using the quartile range (IQR) outlier detection method to detect and remove the abnormal data points in the vertical displacement dataset from the measurement stations one by one (Figure 4c). Finally, using the Kalman filter method, interpolation was conducted to supplement the missing data (Figure 4d).

3. Methods

3.1. Load Green’s Function Theory

The flow of liquids causes elastic deformation of the Earth’s crust, due to changes in the loading, which can be described using elastic loading theory. Among these deformations, vertical elastic deformation is the most sensitive to changes in the loading mass [31,32]. Vertical deformation can be expressed as the convolution of the mass loading and the vertical displacement Green’s function.
The formula is given as follows:
U ( φ ) = Δ M × R M e l = 0 h l P l ( cos φ ) ,
where U(φ) is the vertical deformation; ΔM is the loading mass; Me is the mass of the Earth; R is the radius of the Earth; hl is the load Love numbers; Pl is the Legendre polynomials of order l; and φ is the angular distance between the loading point and the observation station.
Based on this, the relationship between the GNSS vertical displacement and the TWSC can be derived as follows:
y = G x + e ,   e   ~   σ 2 I ,
where y is the observed value of the GNSS vertical displacement, G is the design matrix of Green’s function, x is the unknown vector of the TWSC (usually expressed as the EWH), e is the residual error of observation y, σ2 is the variance of observation y, and I is the corresponding unit matrix.

3.2. Method for Solving for the Equivalent Water Height

The inversion of the water storage within a region using GNSS vertical displacement observations, which is similar to other geophysical models, belongs to the category of discrete ill-posed problems [33]. To obtain a stable solution, appropriate methods need to be adopted. Tikhonov regularization is the most commonly used method [34]. Tikhonov regularization utilizes a regularization constraint matrix to reduce the ill-posedness of the normal equation matrix GTG, thereby improving the stability of the solution results, as follows:
G x u 2 + a 2 L x 2 = min ,
where L is the regularization smoothing matrix (the Laplacian balancing matrix is commonly used); a is the regularization parameter, which is often determined via generalized cross-validation; and ‖·‖ is the L2 norm. The single-epoch estimate of the TWS changes is determined using the following equation:
x = ( G T G + σ 2 a 2 L T L ) 1 G T y .
When solving this for the EWH using time-series observed vertical displacement data from stations within the study area, the principal-component-analysis-based method (PCAIM) can be employed, which improves the computational efficiency [20]. This method decomposes the vertical displacement data into multiple principal components and then retrieves the corresponding EWH for each component. Finally, the corresponding final EWH for each station is obtained via linear combination, avoiding the need to estimate each period separately.

3.3. Key Issues in Inverting the EWH

According to Equation (4), the inversion of the EWH using GNSS data requires the selection of an appropriate Green’s function design matrix, a regularization smoothing matrix, and a smoothing factor. In addition, the inversion resolution determines the accuracy of the inversion. Therefore, three key issues in inverting the EWH are determining an appropriate Green’s function design matrix for the study area, determining the regularization smoothing matrix, and selecting a suitable EWH resolution.

3.3.1. Determination of Green’s Function Design Matrix

Green’s function design matrix reflects the degree of elastic deformation response of the Earth model in the study area to load changes. Its determination requires calculations based on an Earth model suitable for the study area. Currently, one-dimensional Earth models are commonly used to calculate the displacement of mass loads. According to the research conducted by Li et al., who investigated the effects of different load models on load displacement in mainland China, the preliminary reference Earth model (PREM) yields better results [35]. Therefore, in this study, the PREM, which is more suitable for the Chinese region, was selected as the Earth model for the EWH inversion in the experiment.
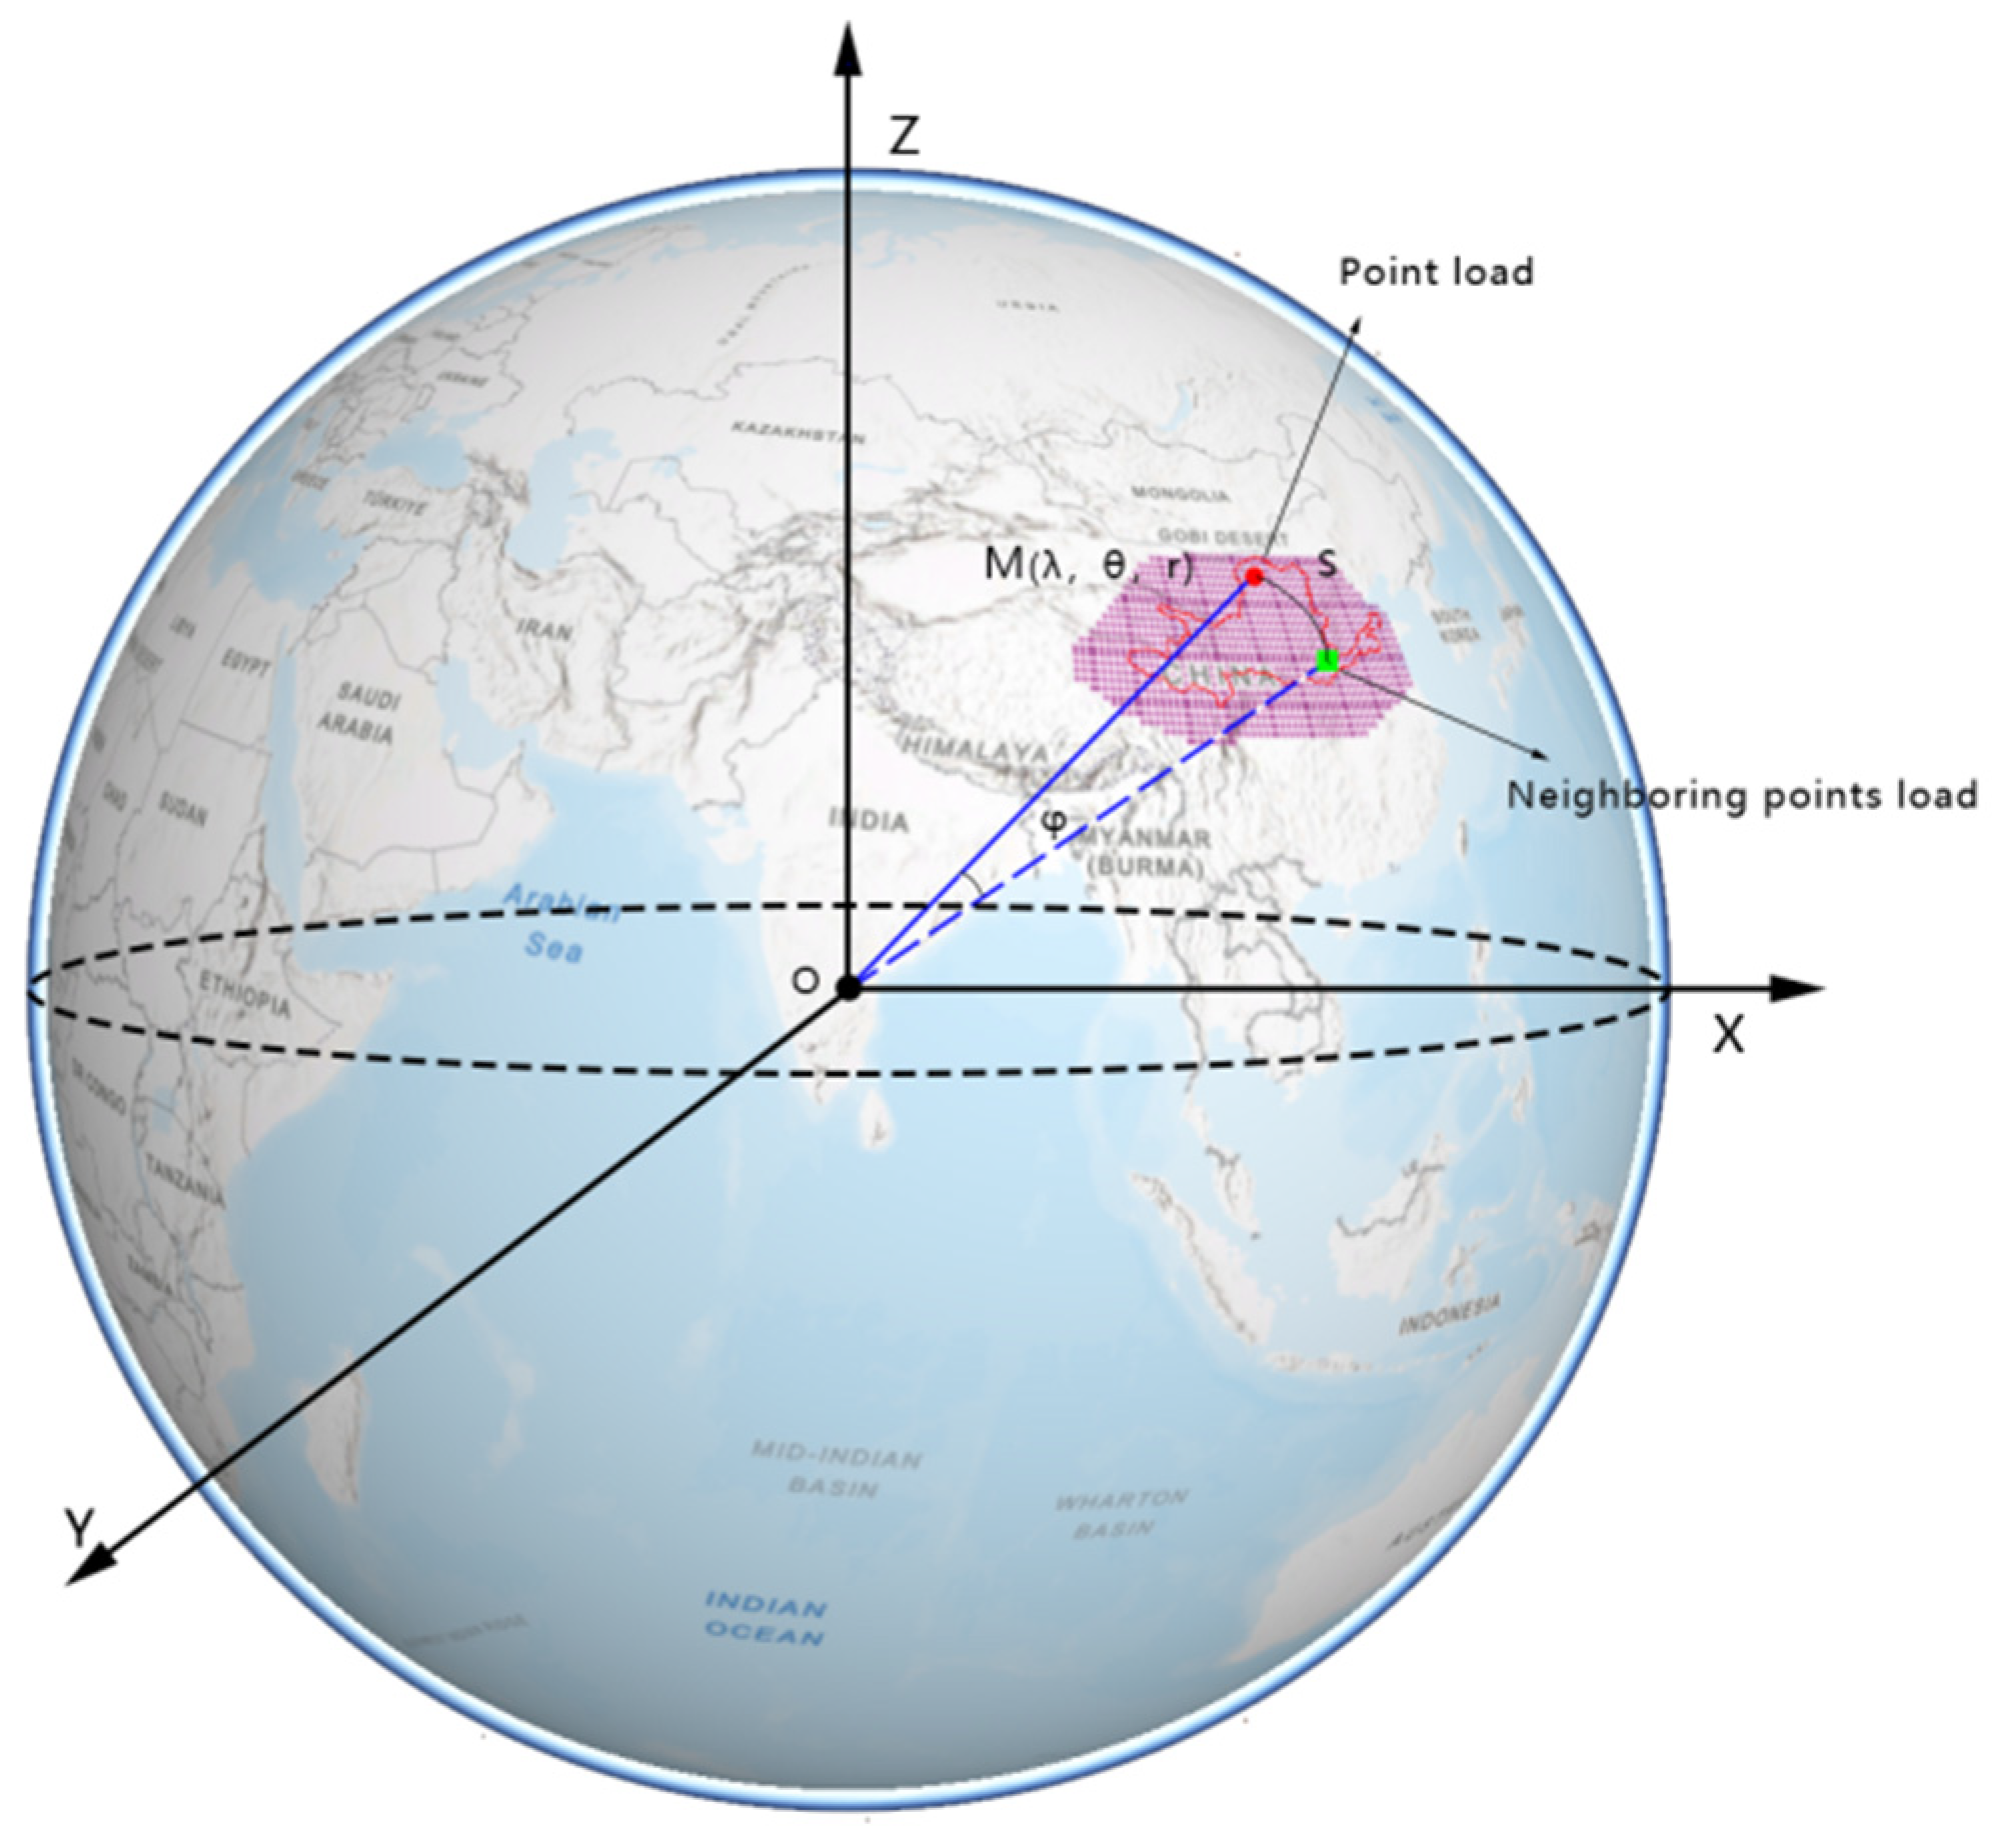
Figure 5 depicts the principle of how a load point responds to nearby grid points. Assuming that the load at point M has a radius of r, longitude of λ, and latitude of θ, Green’s function coefficient G, which represents the vertical deformation response of the load point to neighboring points, can be expressed as follows:
G i , j = k = 1 k max u ( φ ) ρ R 2 sin λ d θ u ( φ ) = R M n = 0 N h h h n P n ( cos φ ) + h 1 2 sin φ / 2 h ln ( sin φ / 2 + sin 2 φ / 2 )
where Gi,j is Green’s function coefficient for the grid point in the ith row and jth column; k is the number of grid points; ρ is the density of the load body; R is the radius of the Earth; M is the mass of the Earth; u(φ) is the vertical displacement caused by the point load; n and N are the order numbers in the Earth model; and h′, h , and h are the vertical displacement coefficients and the first- and second-order derivatives of the ∞-order h in the PREM.

3.3.2. Determination of Regularized Smoothing Matrix and Smoothing Factor

The regularized smoothing matrix and smoothing factor can achieve noise suppression, and selecting an appropriate smoothing method can improve the effect and accuracy of the inversion. The Laplace smoothing matrix is a commonly used smoothing matrix. In this paper, an L4 Laplacian matrix L 4 = 0 1 0 1 4 1 0 1 0 is selected for the internal research area regularized smoothing matrix kernel, while an L2 Laplacian matrix L 2 = 1 2 1 is chosen for the boundary points. The smoothing factor determines the degree of roughness of the inversion results and the fit with the data accuracy. Given the uneven distribution of the GNSS stations in the study area, it is not suitable to adopt a unified smoothing factor.
For regions with a sparse GNSS station distribution, it is necessary to increase the weight of the smoothing factor to achieve better inversion results. In this paper, the selected basic smoothing factor (set as a) is taken as the minimum threshold for the smoothing factor. When the grid with the shortest distances (set as s) to a GNSS continuous station exceeds the mode (set as p), if the number of GNSS stations within a range of 100 km from a grid node (where the load deformation response is sensitive within this range [12,13]) is denoted as n, and the maximum value of n is set as N, an inverse distance weighting method that considers the density of the GNSS stations is used to weight the smoothing factor (set as q), thereby increasing the weight of the smoothing factor in the regions with a sparse GNSS station distribution. This can be expressed as follows:
q = max ( max ( N n , 1 ) × s p × a , a ) .

3.3.3. Determination of EWH Resolution

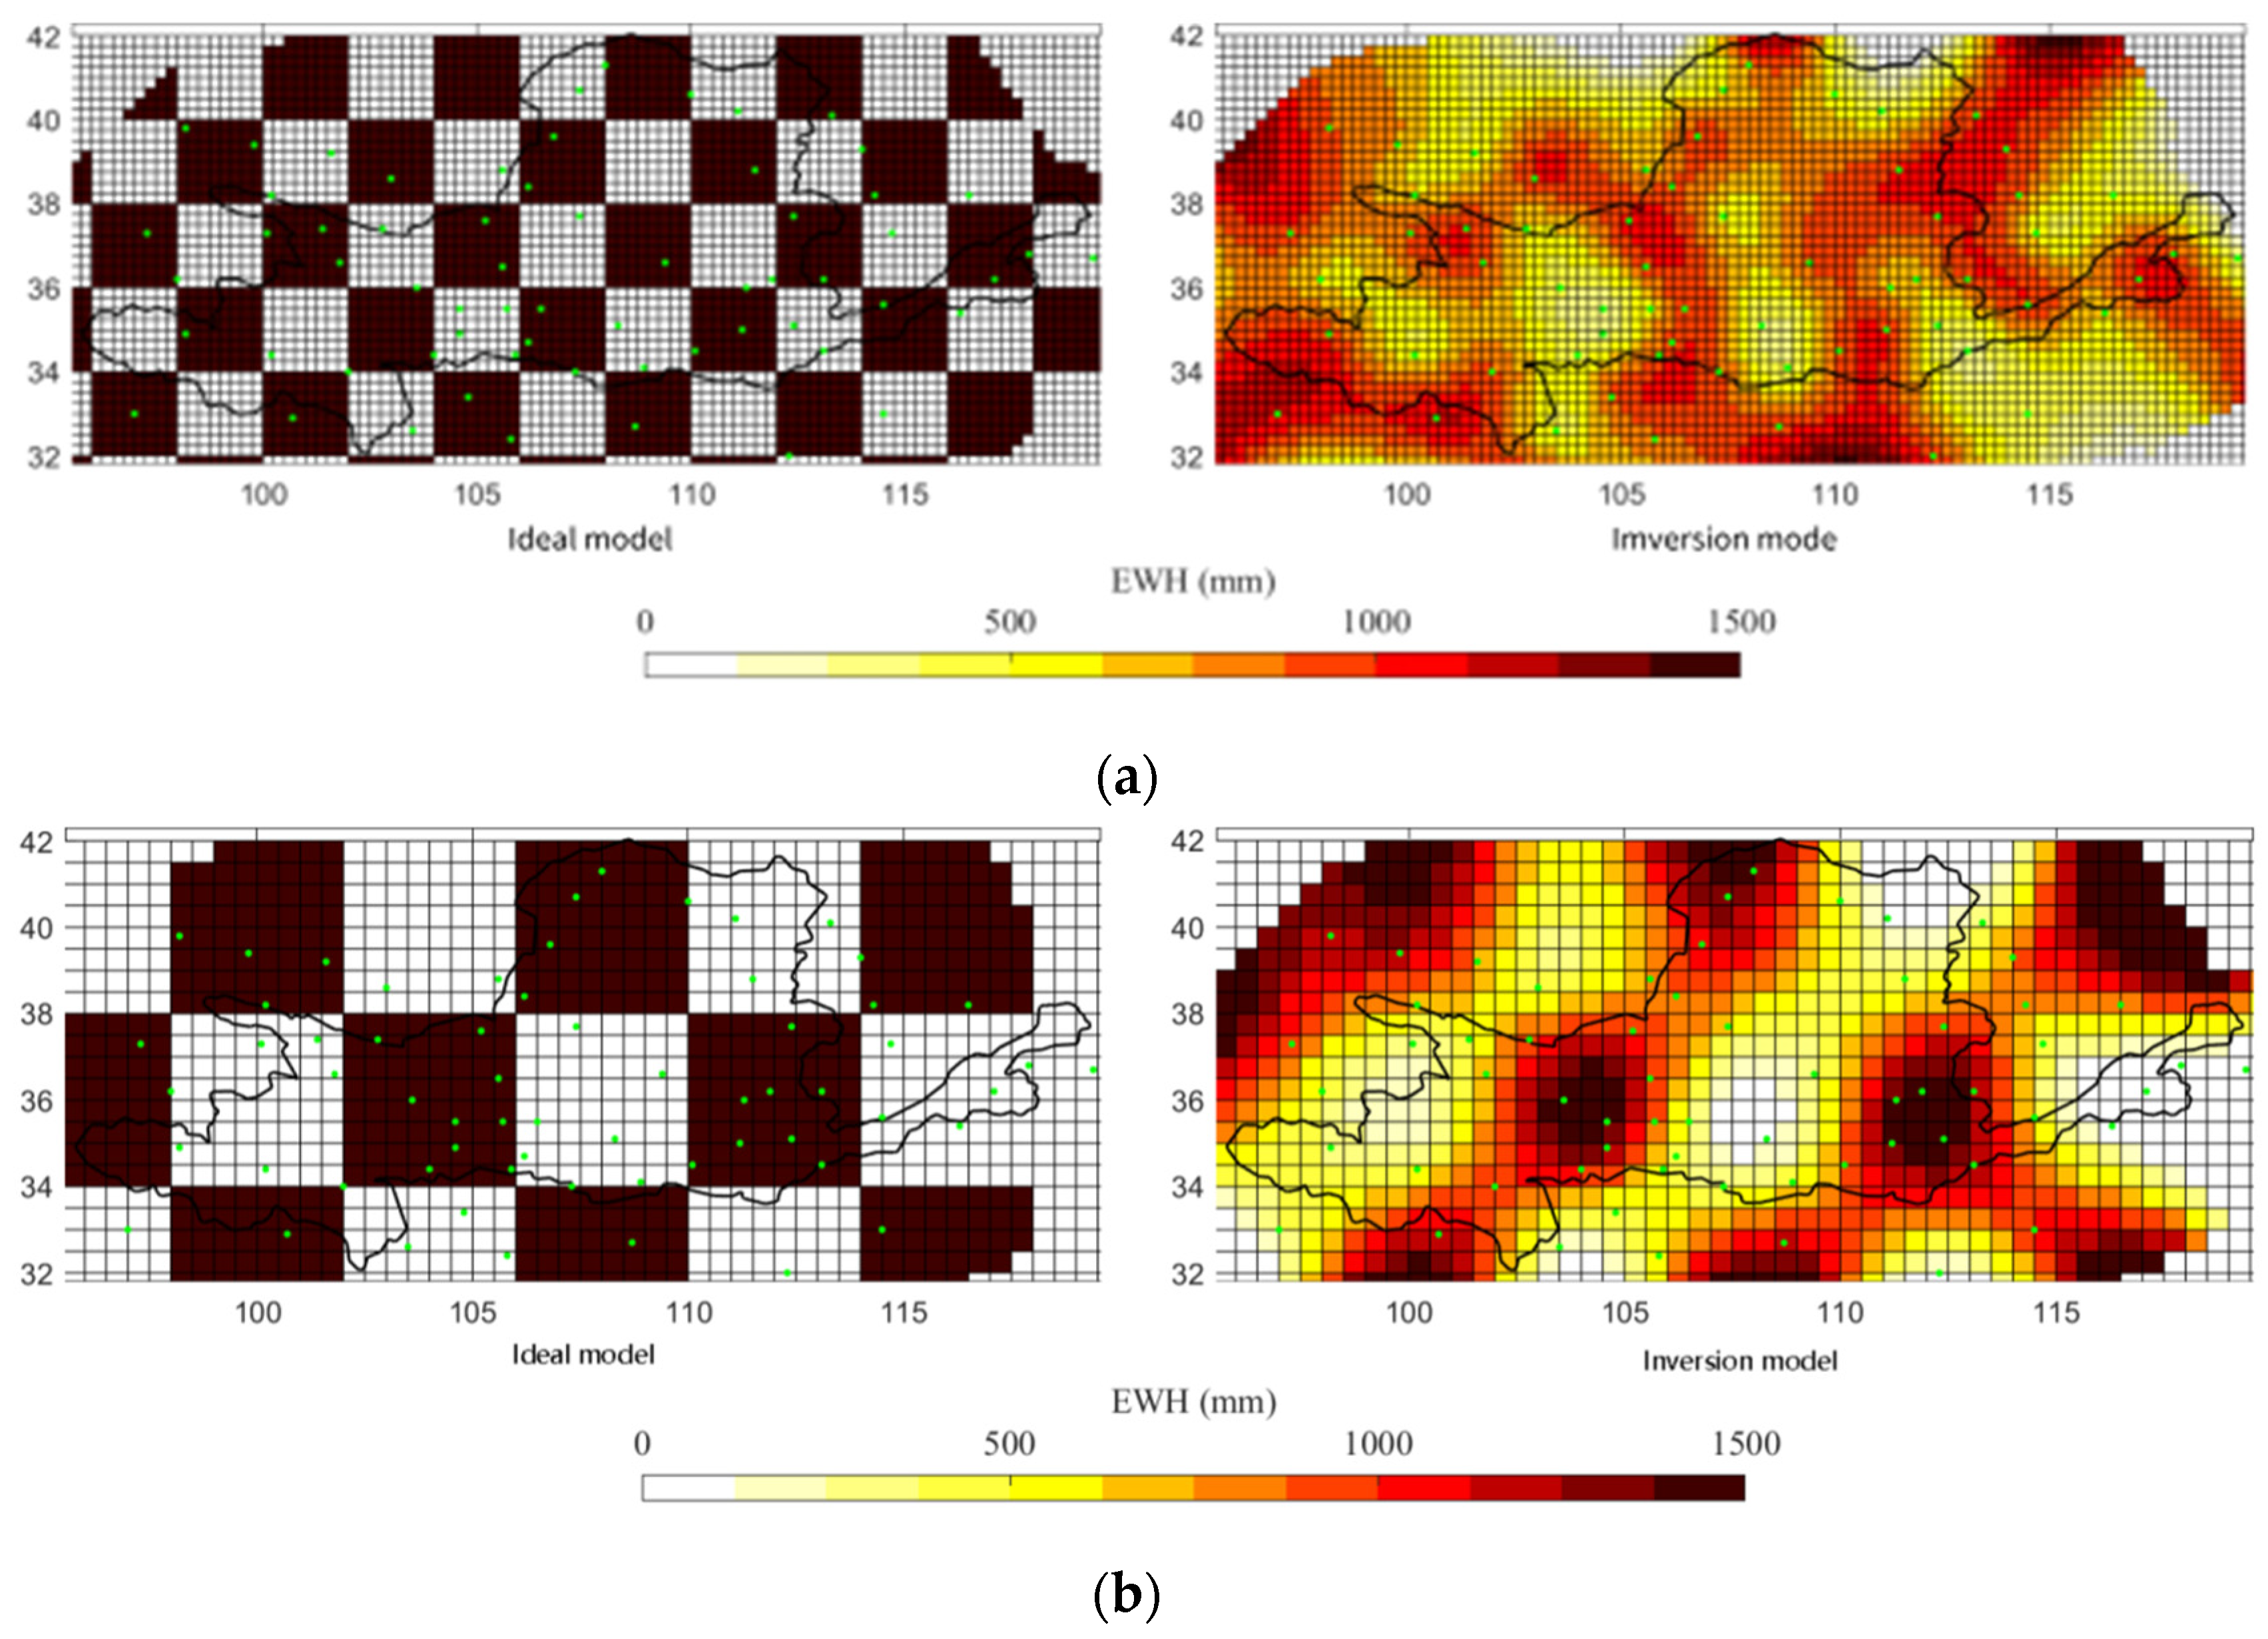
The spatial resolution and reliability of the inverted EWH are correlated with the distribution of GNSS observation stations within the study area. The effectiveness of the inversion can be assessed using a checkerboard test. This method divides the study area into regular grids (checkerboard cells) and defines an ideal signal model, in which each cell consists of multiple minimum resolution squares representing a test point. Then, based on the actual observation data from the stations, an inversion model is generated at the grid points. The effect of the inversion is evaluated based on the similarity between the inverted model and the ideal model.

3.4. Methods of Verifying the Inversion Results

Common verification methods for water storage inversion include Pearson correlation coefficient analysis of time series data, error analysis, Nash–Sutcliffe efficiency (NSE) analysis, spatial distribution characteristics of amplitude and change rate, etc. Since this paper focuses on the inversion of daily changes in water storage, rather than the true value of water storage, we chose the commonly used Pearson correlation method when using the GLDAS true water storage values to validate our inverted time series data of water storage changes. In this paper, the inverted water storage data are denoted as x G N S S _ E W H , and the water storage data from the GLDAS data are denoted as y GLDAS _ TWS . The correlation coefficient R is calculated as follows:
i = 1 n ( x G N S S _ E W H x ˜ G N S S _ E W H ) ( y GLDAS _ TWS y ˜ GLDAS _ TWS ) / ( n 1 ) i = 1 n ( x G N S S _ E W H x ˜ G N S S _ E W H ) 2 / ( n 1 ) · i = 1 n ( y GLDAS _ TWS y ˜ GLDAS _ TWS ) 2 / ( n 1 ) ,
where n is the total number of data points, x ˜ G N S S _ E W H is the average value of x G N S S _ E W H , and y ˜ GLDAS _ TWS is the average value of y GLDAS _ TWS .
To evaluate the strength of the correlation, we utilize the correlation coefficient grading method proposed by Cohen (Table 1) to qualitatively evaluate the correlation of the inversion results [36].

4. Results

4.1. Experiments on Key Issues of Inversion

4.1.1. Determination of Vertical Displacement Response Coefficients of Load Green’s Function

In this experiment, utilizing the vertical displacement of the PREM, the vertical displacement response coefficients of the load Green’s function for 70 stations utilized as point load sources for 1145 0.5° grid points covering the entire study area were iteratively solved up to 2000 orders. The cumulative sum of the coefficients for each grid point is visualized in Figure 6.

4.1.2. Determination of Regularization Smoothing Matrix and Smoothing Factor

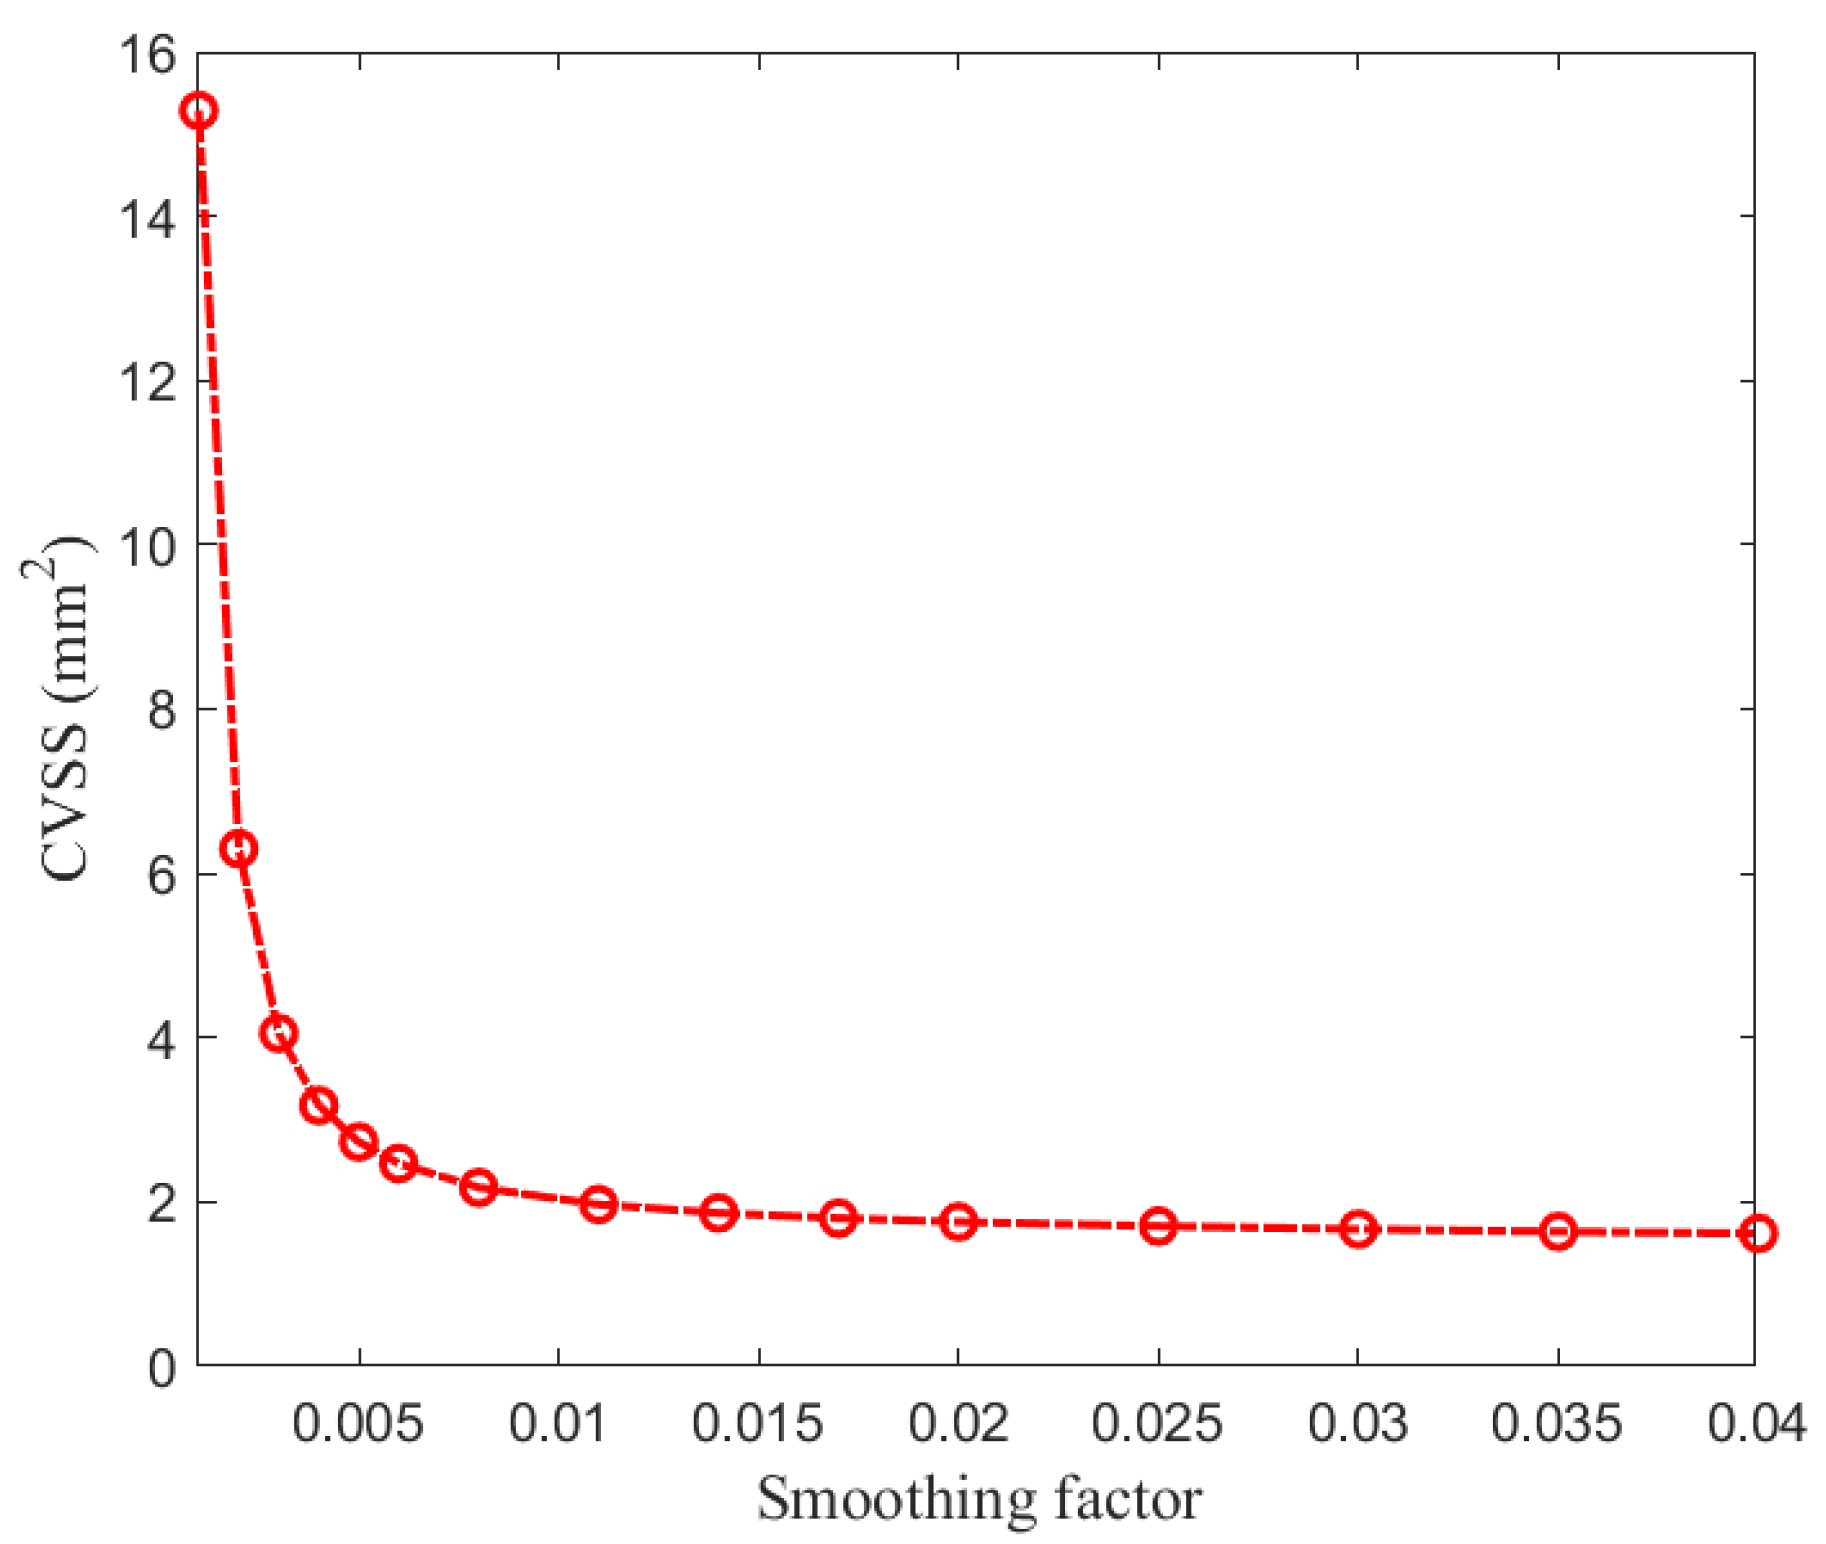
In this experimental study, three sets of varying factors, namely, [0.001, 0.001, 0.006], [0.008, 0.003, 0.017], and [0.020, 0.05, 0.040], were initially selected, which can make the result present in the shape of an L-curve, enabling us to find the slowly changing turning points, i.e., the optimal smoothing factor. Using the generalized cross-validation (GCV) method, each smoothing factor is validated by rotating each of the 70 stations to serve as a sample value, testing the inversion results of the remaining 69 stations. This means that each smoothing factor undergoes 70 rounds of spot checks and comparisons. By examining the relationship between the sum of the squared residuals (between the inversion values and predicted values) and the smoothing factor, a basic smoothing factor can be identified. According to the experiments (Figure 7), when the basic smoothing factor was set to 0.008, the root mean square error tended to stabilize as the smoothing factor increased, resulting in a better smoothing effect in the Yellow River Basin.

4.1.3. Determination of EWH Resolution

In this experimental study, a checkerboard grid with a size of 8a × 8a was used to conduct the partitioning, where ‘a’ represents the selected spatial resolution for retrieving the EWH. Using the checkerboard detection method, it was found that, when the spatial resolution of the retrieved EWH was 0.25°, the similarity between the retrieved model and the ideal model was low. However, when the spatial resolution of the retrieved EWH reached 0.5°, the shape similarity between the ideal model and the retrieved model was high, achieving a better retrieval effect (Figure 8). Therefore, the spatial resolution of the retrieved water storage product in this experiment was determined to be 0.5°.

4.2. Verification of Inversion Results

To verify the reliability of the inversion results, we conducted Pearson correlation coefficient (PCC) verification and evaluation on the daily average EWH temporal variation data for the Yellow River Basin, inverted using the daily water storage data from GLDAS. In addition, a spatial distribution map of the correlation coefficient between the inversion results and the GLDAS water storage dataset was plotted.

4.2.1. PCC Correlation Verification

Considering that the inversion in this paper is a product of daily water storage changes, rather than the true value of water storage, the conventional nonlinear regression with a non-zero intercept was selected to fit the inversion result GNSS_EWH and the true value GLDAS_TWS. The R obtained using this method was the PCC correlation coefficient. Based on the results of the linear fitting experiments, the correlation coefficient between the daily average equivalent water height changes inverted from the GNSS data for the past 12 years and the daily water storage data from GLDAS was 0.68 (Figure 9). According to Cohen’s classification of the correlation level, the inversion results have a strong correlation.

4.2.2. Verification of Spatial Distribution Characteristics of the GNSS_EWH

(1)
Verification of spatial distribution of correlation
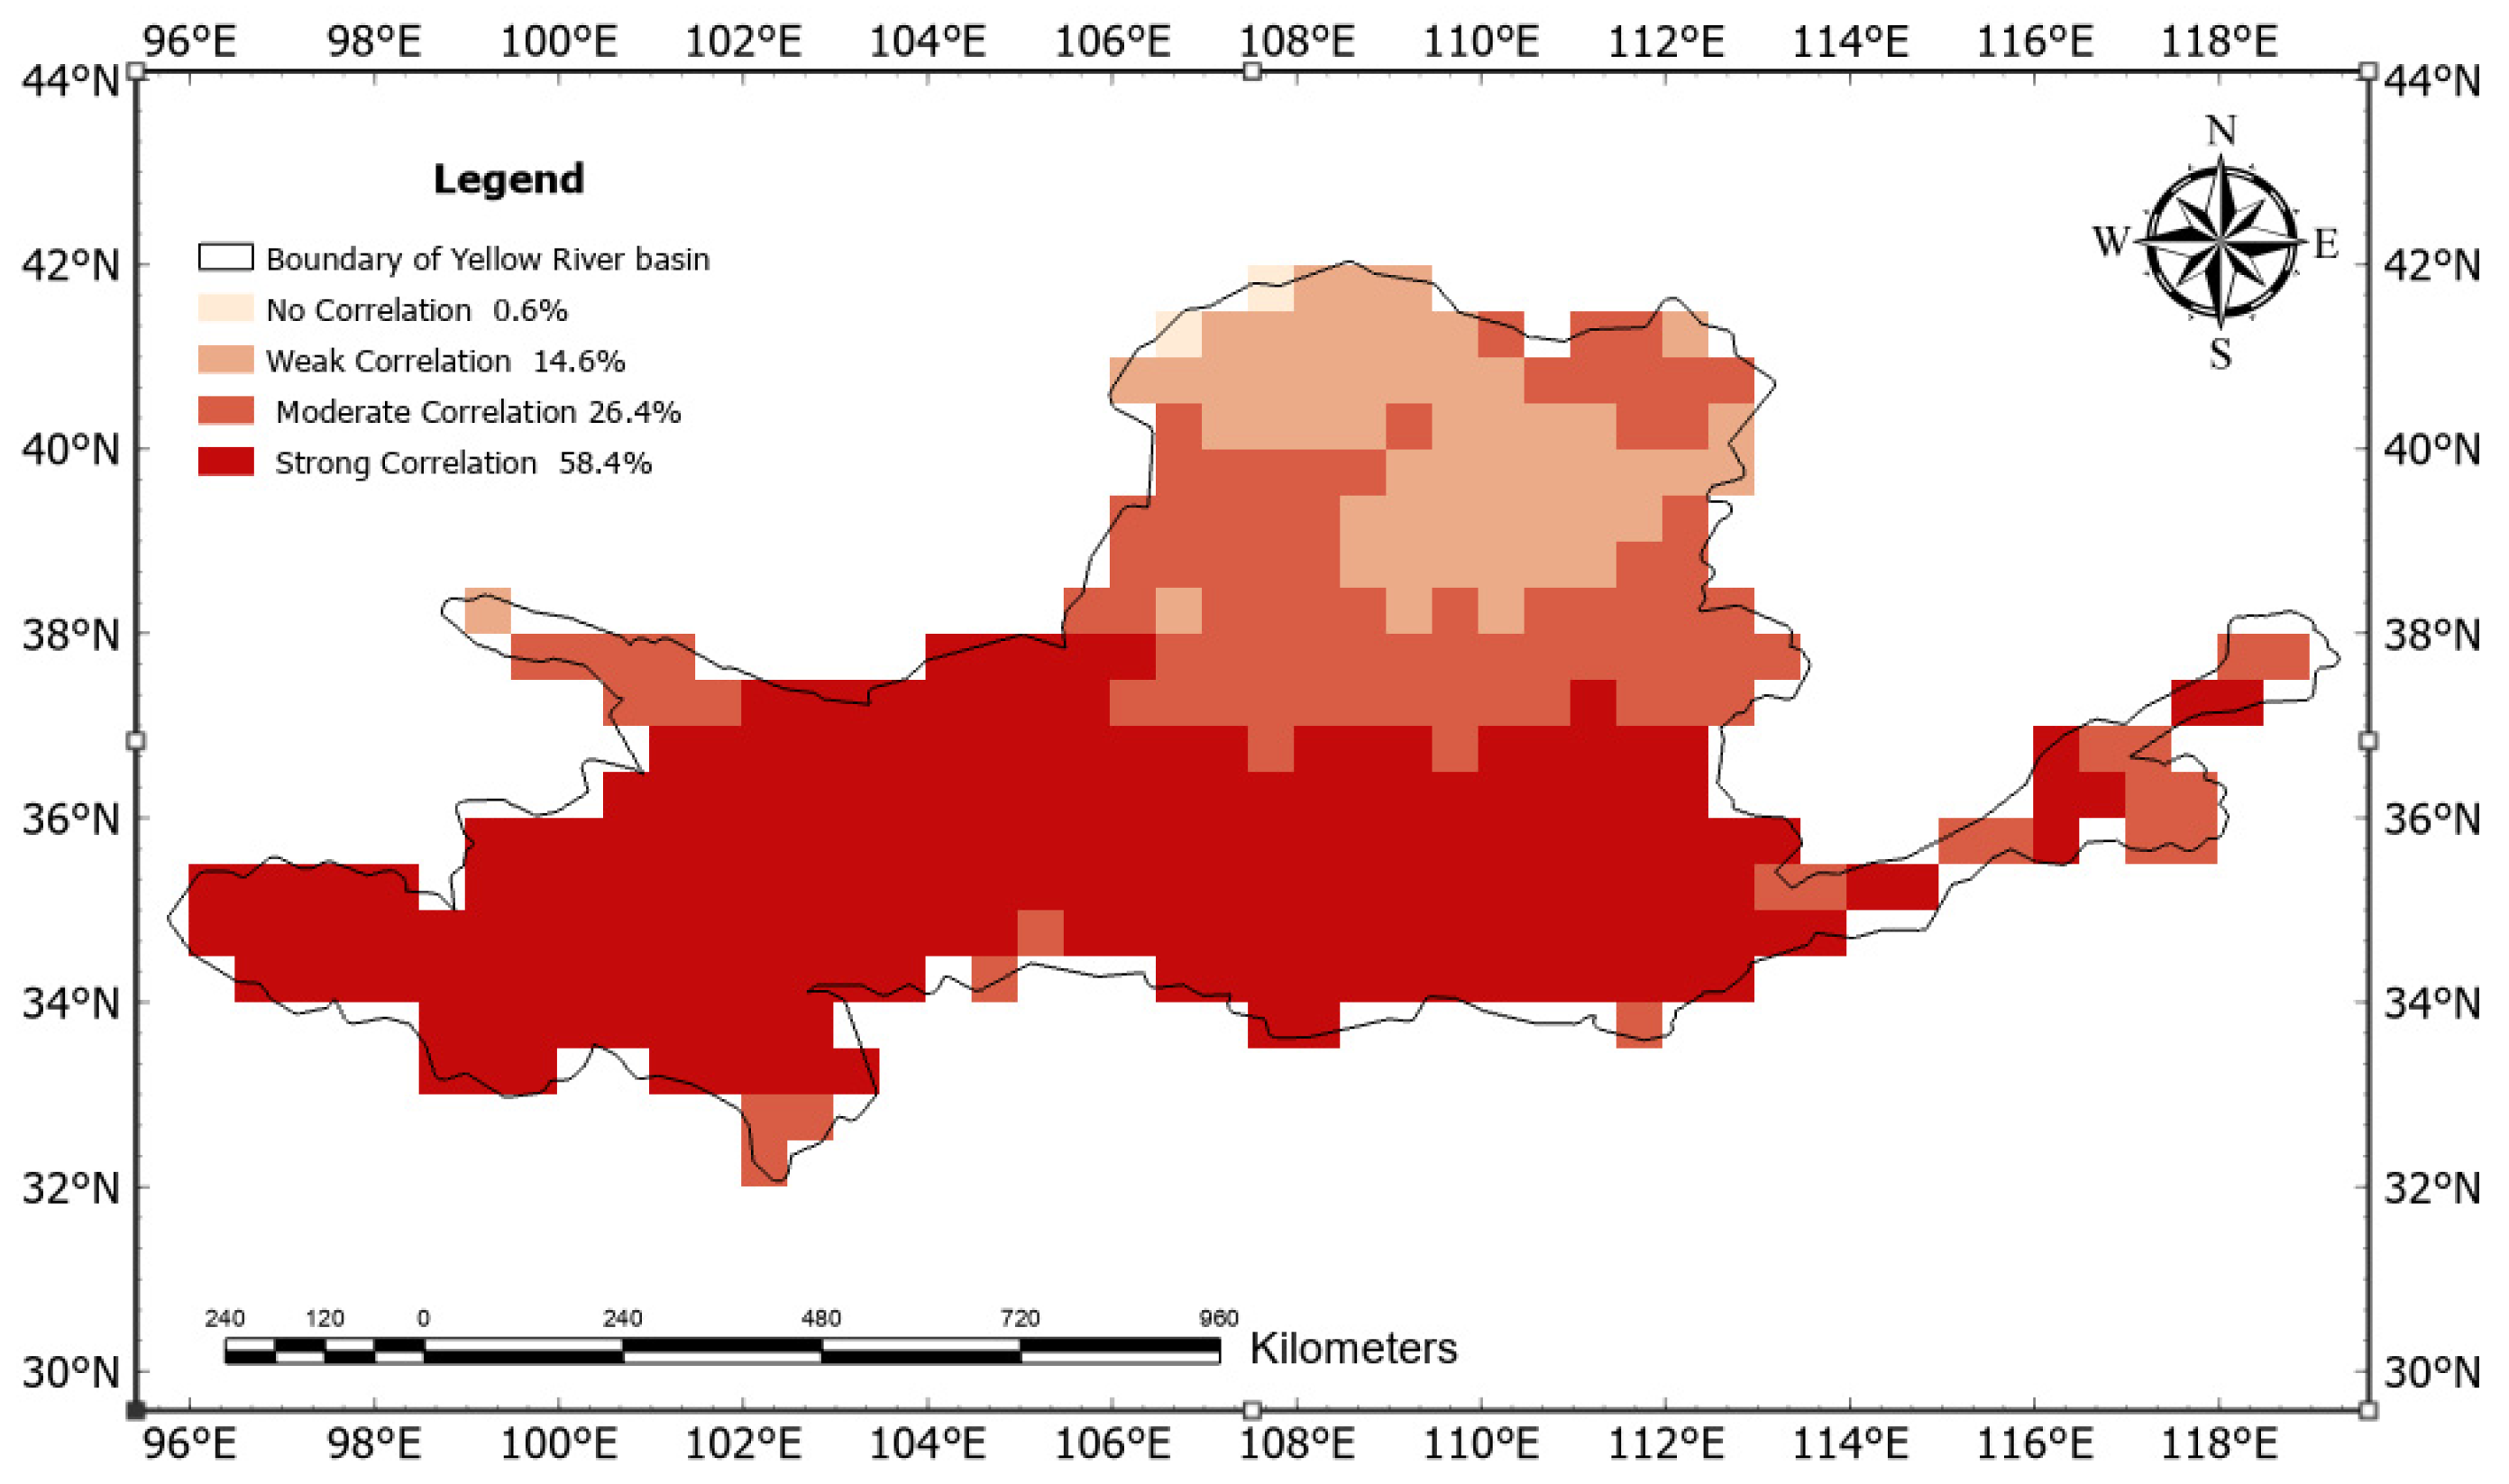
The spatial distribution map of the GNSS_EWH amplitude reflects the distribution of the terrestrial water storage change characteristics. The PCC method was utilized to calculate the PCC between the GNSS_EWH and GLDAS_TWS at each grid point within the study area using MATLAB2021a, and the correlation levels were classified accordingly. The proportions of the grid points with strong, moderate, weak, and no correlation were 58.4%, 26.4%, 14.6%, and 0.6%, respectively. As can be seen from Figure 10, drawn using ARCpro3.0.1 the grid points with weak correlations were located in areas with extremely sparse GNSS observation stations, while the individual grid points with no correlation were distributed in the marginal areas (Figure 10).
(2)
Verification of Spatial Distribution Characteristics of Amplitudes
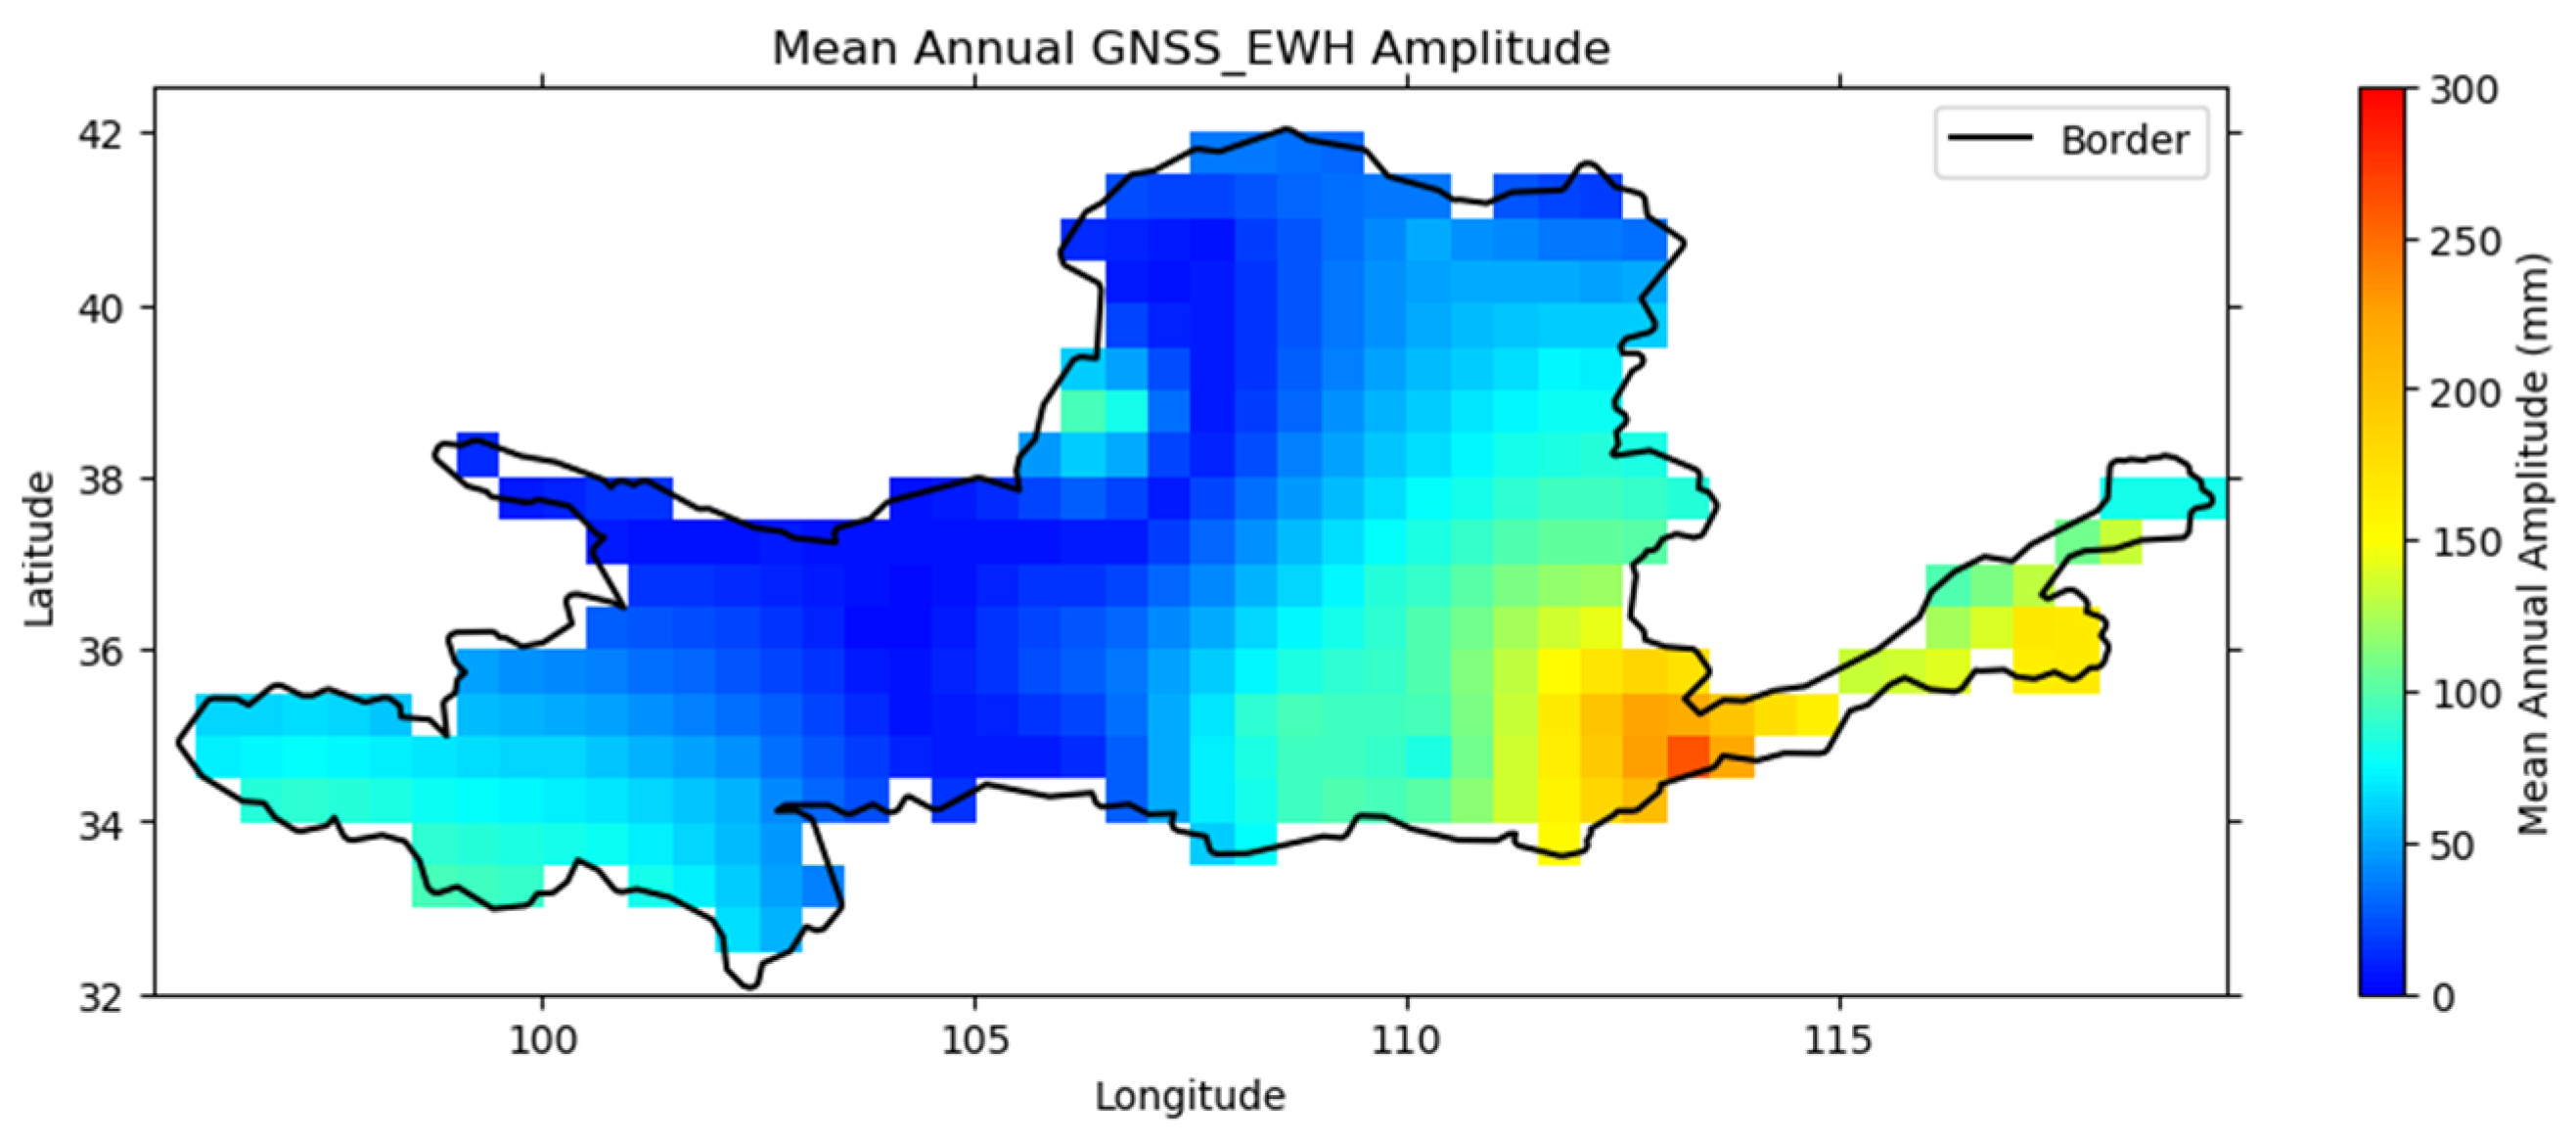
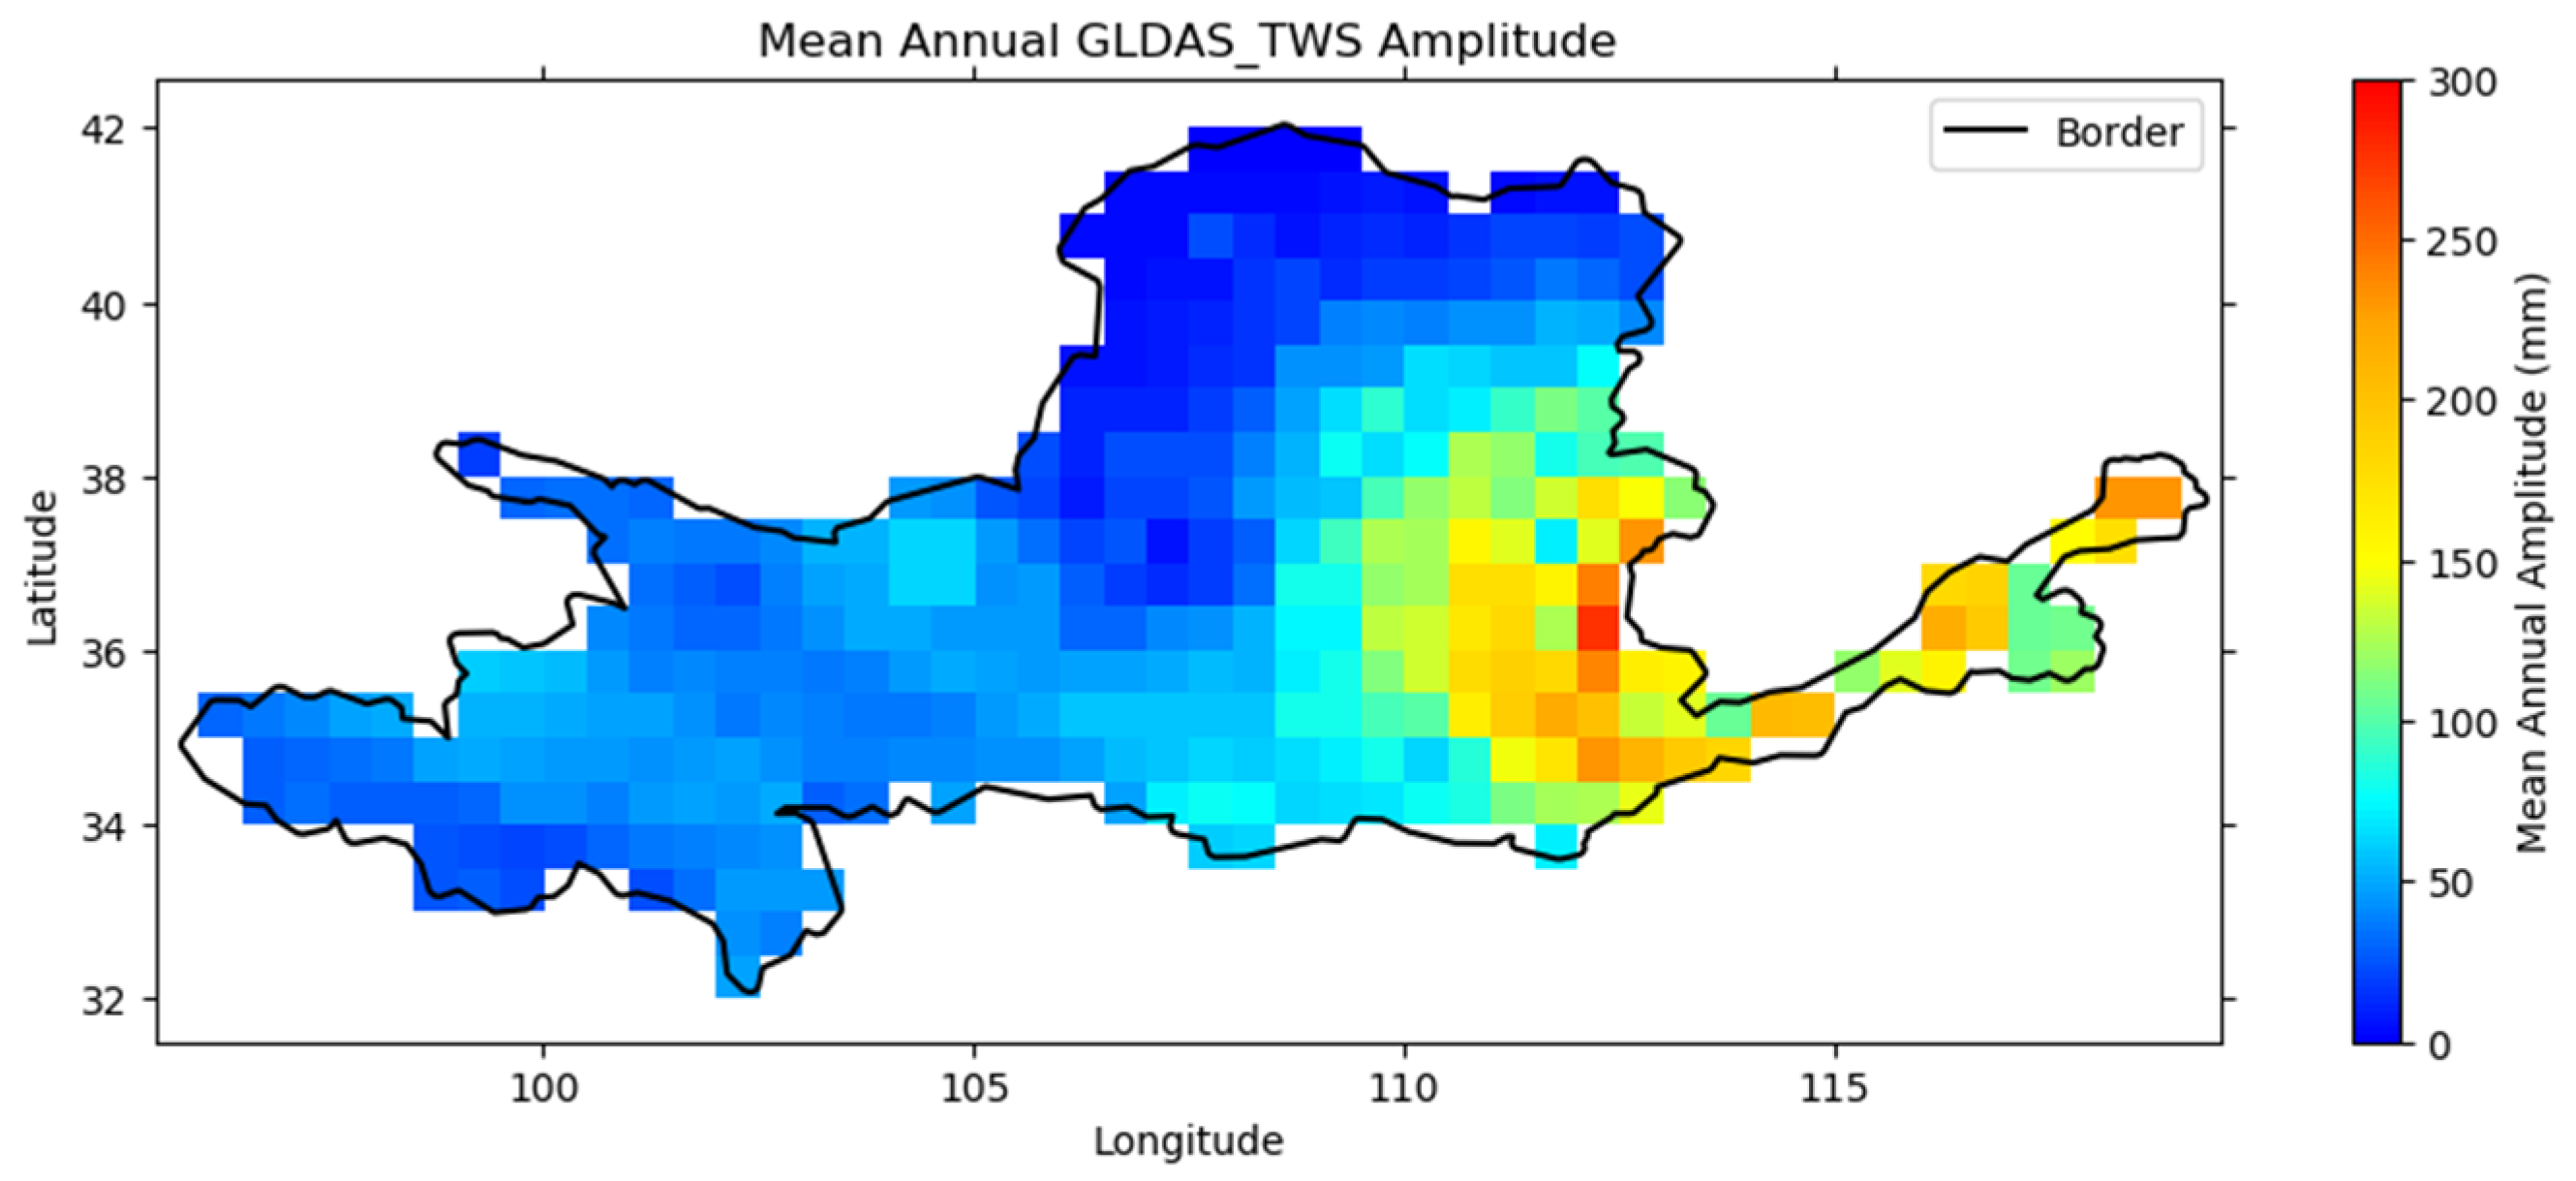
The spatial distribution map of the GNSS_EWH amplitudes in the Yellow River Basin over the past 12 years (Figure 11), which was made using MATLAB2021a, shows that the amplitudes of the water storage in the middle and lower reaches of the Yellow River Basin were larger (greater than 100 mm), while the amplitudes in the upper and middle reaches were smaller (less than 50 mm). This distribution pattern of the amplitudes is generally consistent with the spatial distribution characteristics of the GLDAS_TWS (Figure 12), which was made using MATLAB2021a. It should be noted that, due to the influences of various external factors on the signals retrieved from GNSS, the amplitudes of the GNSS_EWH tend to be significantly larger than those of the GLDAS_TWS. In order to better compare the spatial distribution of the amplitudes, the amplitudes of the GLDAS_TWS were doubled in this study.
(3)
Verification of Spatial Distribution Characteristics of the Rate of Change
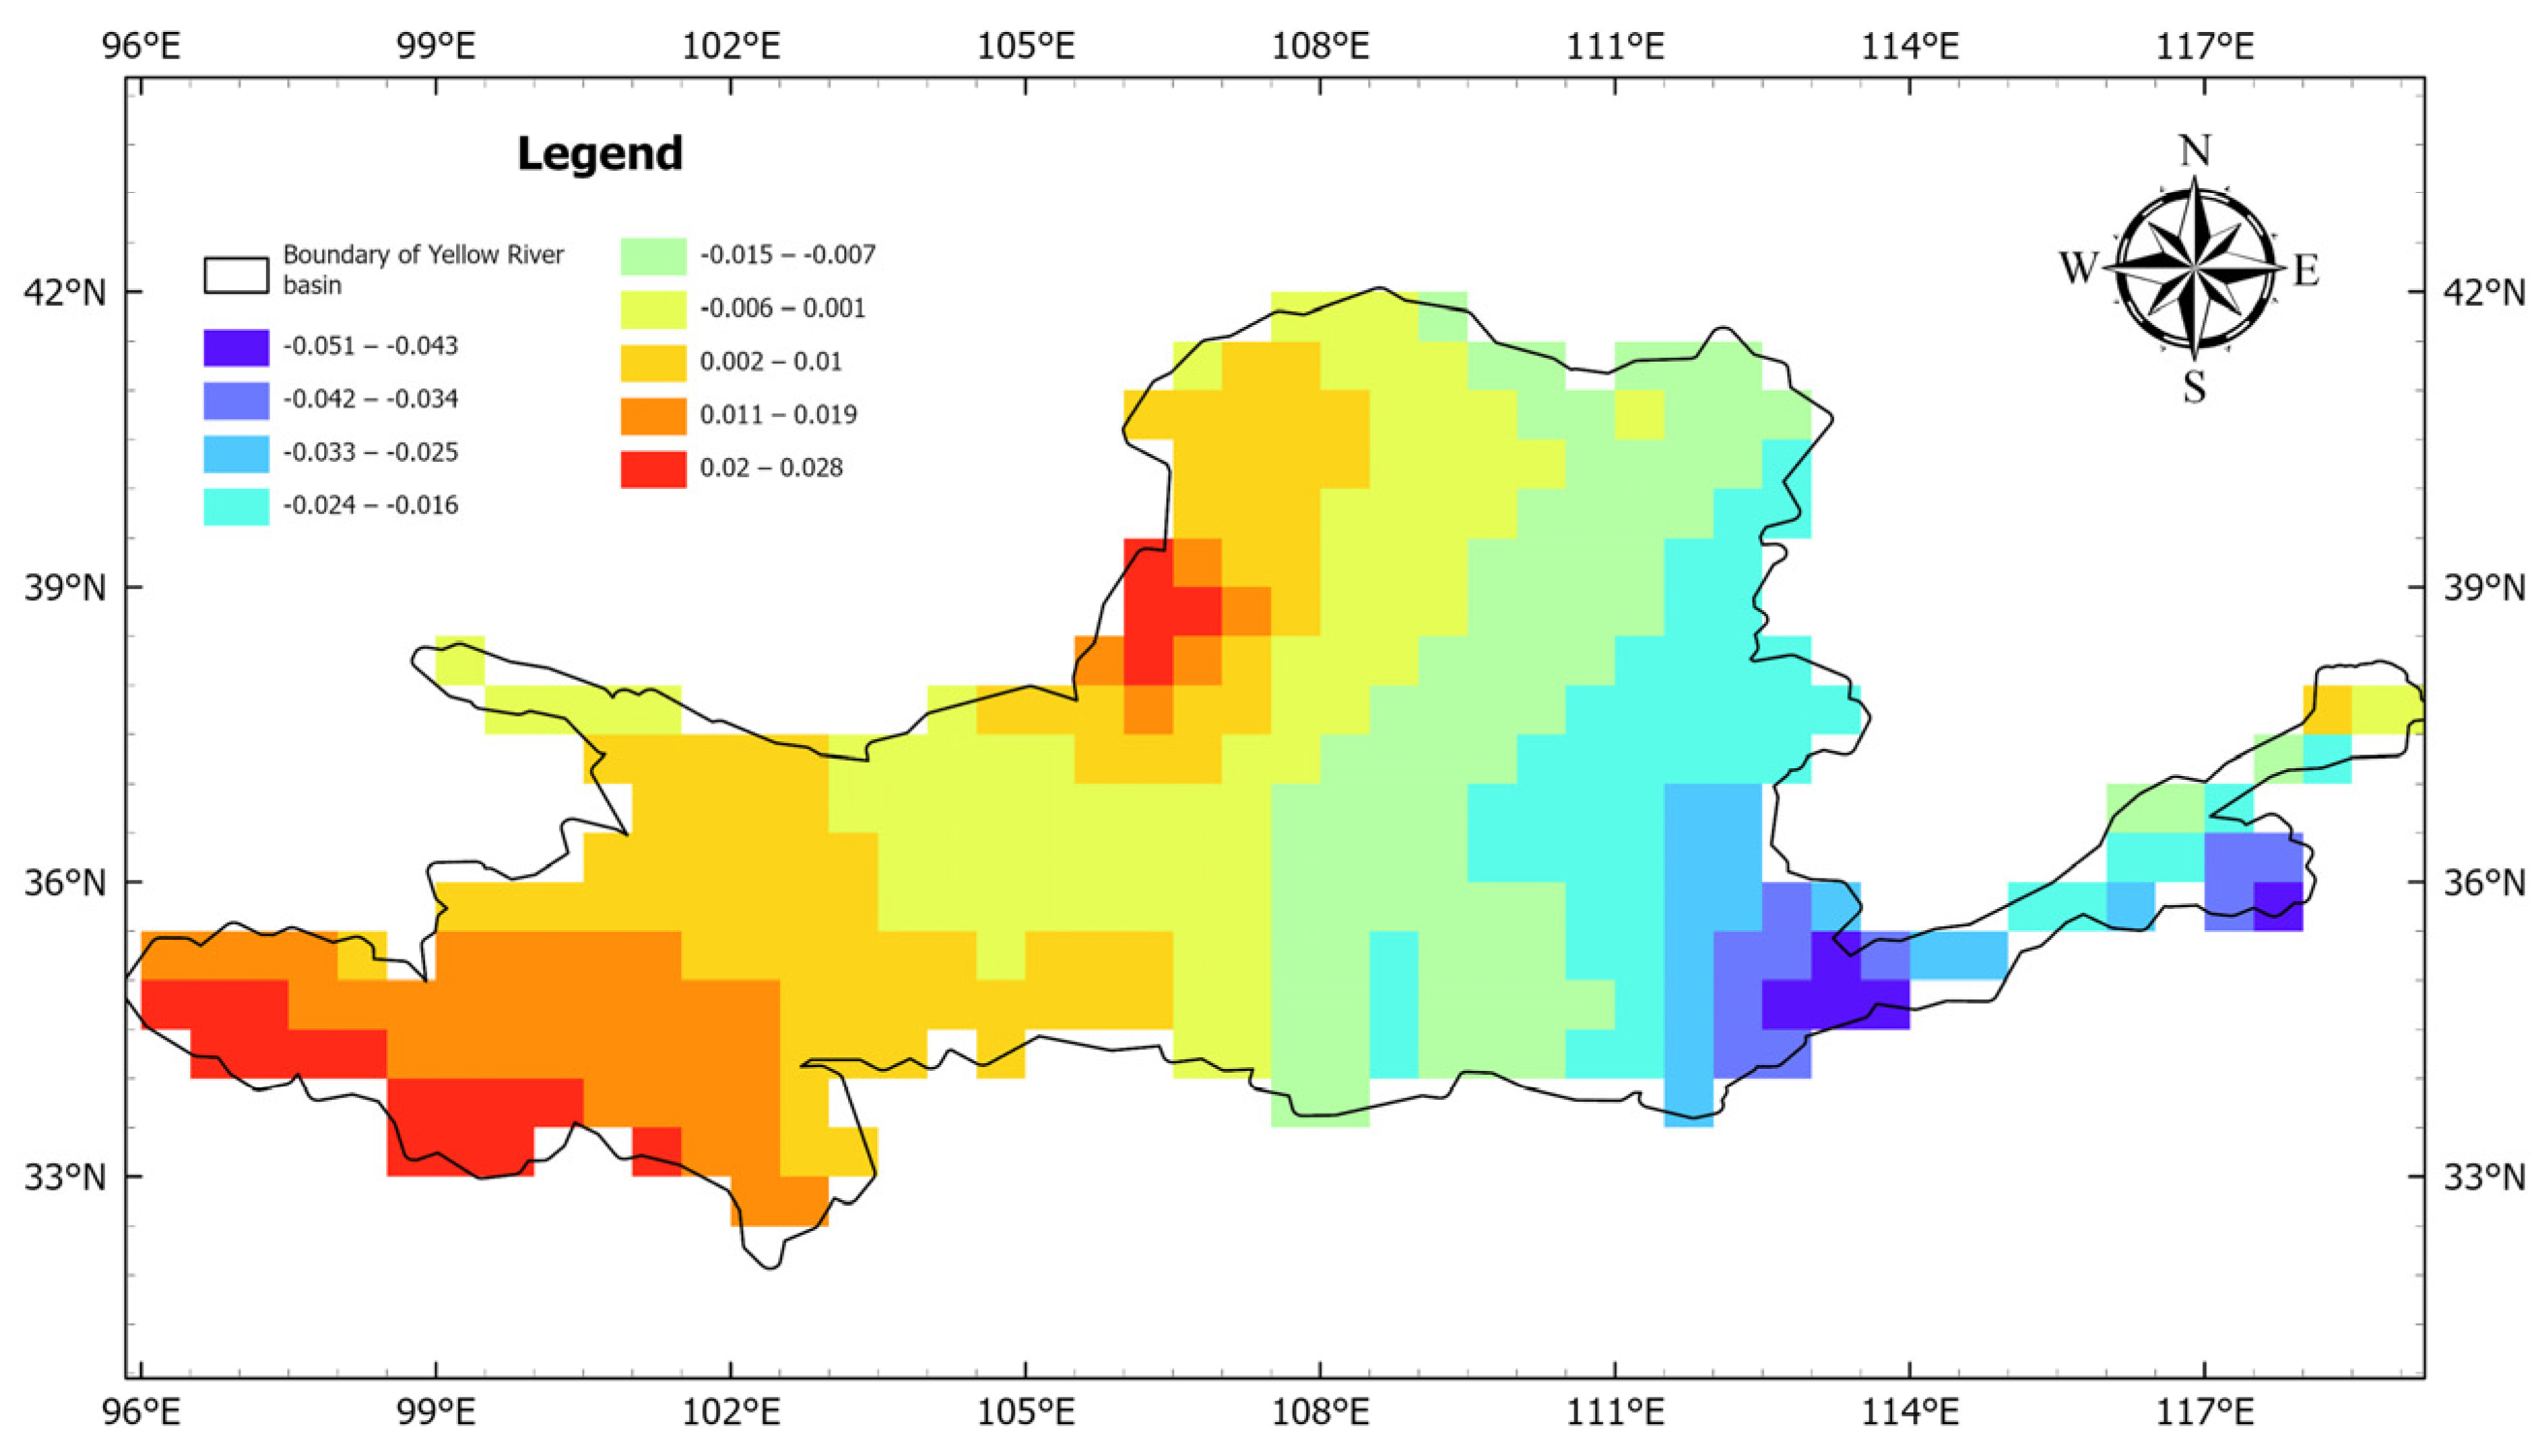
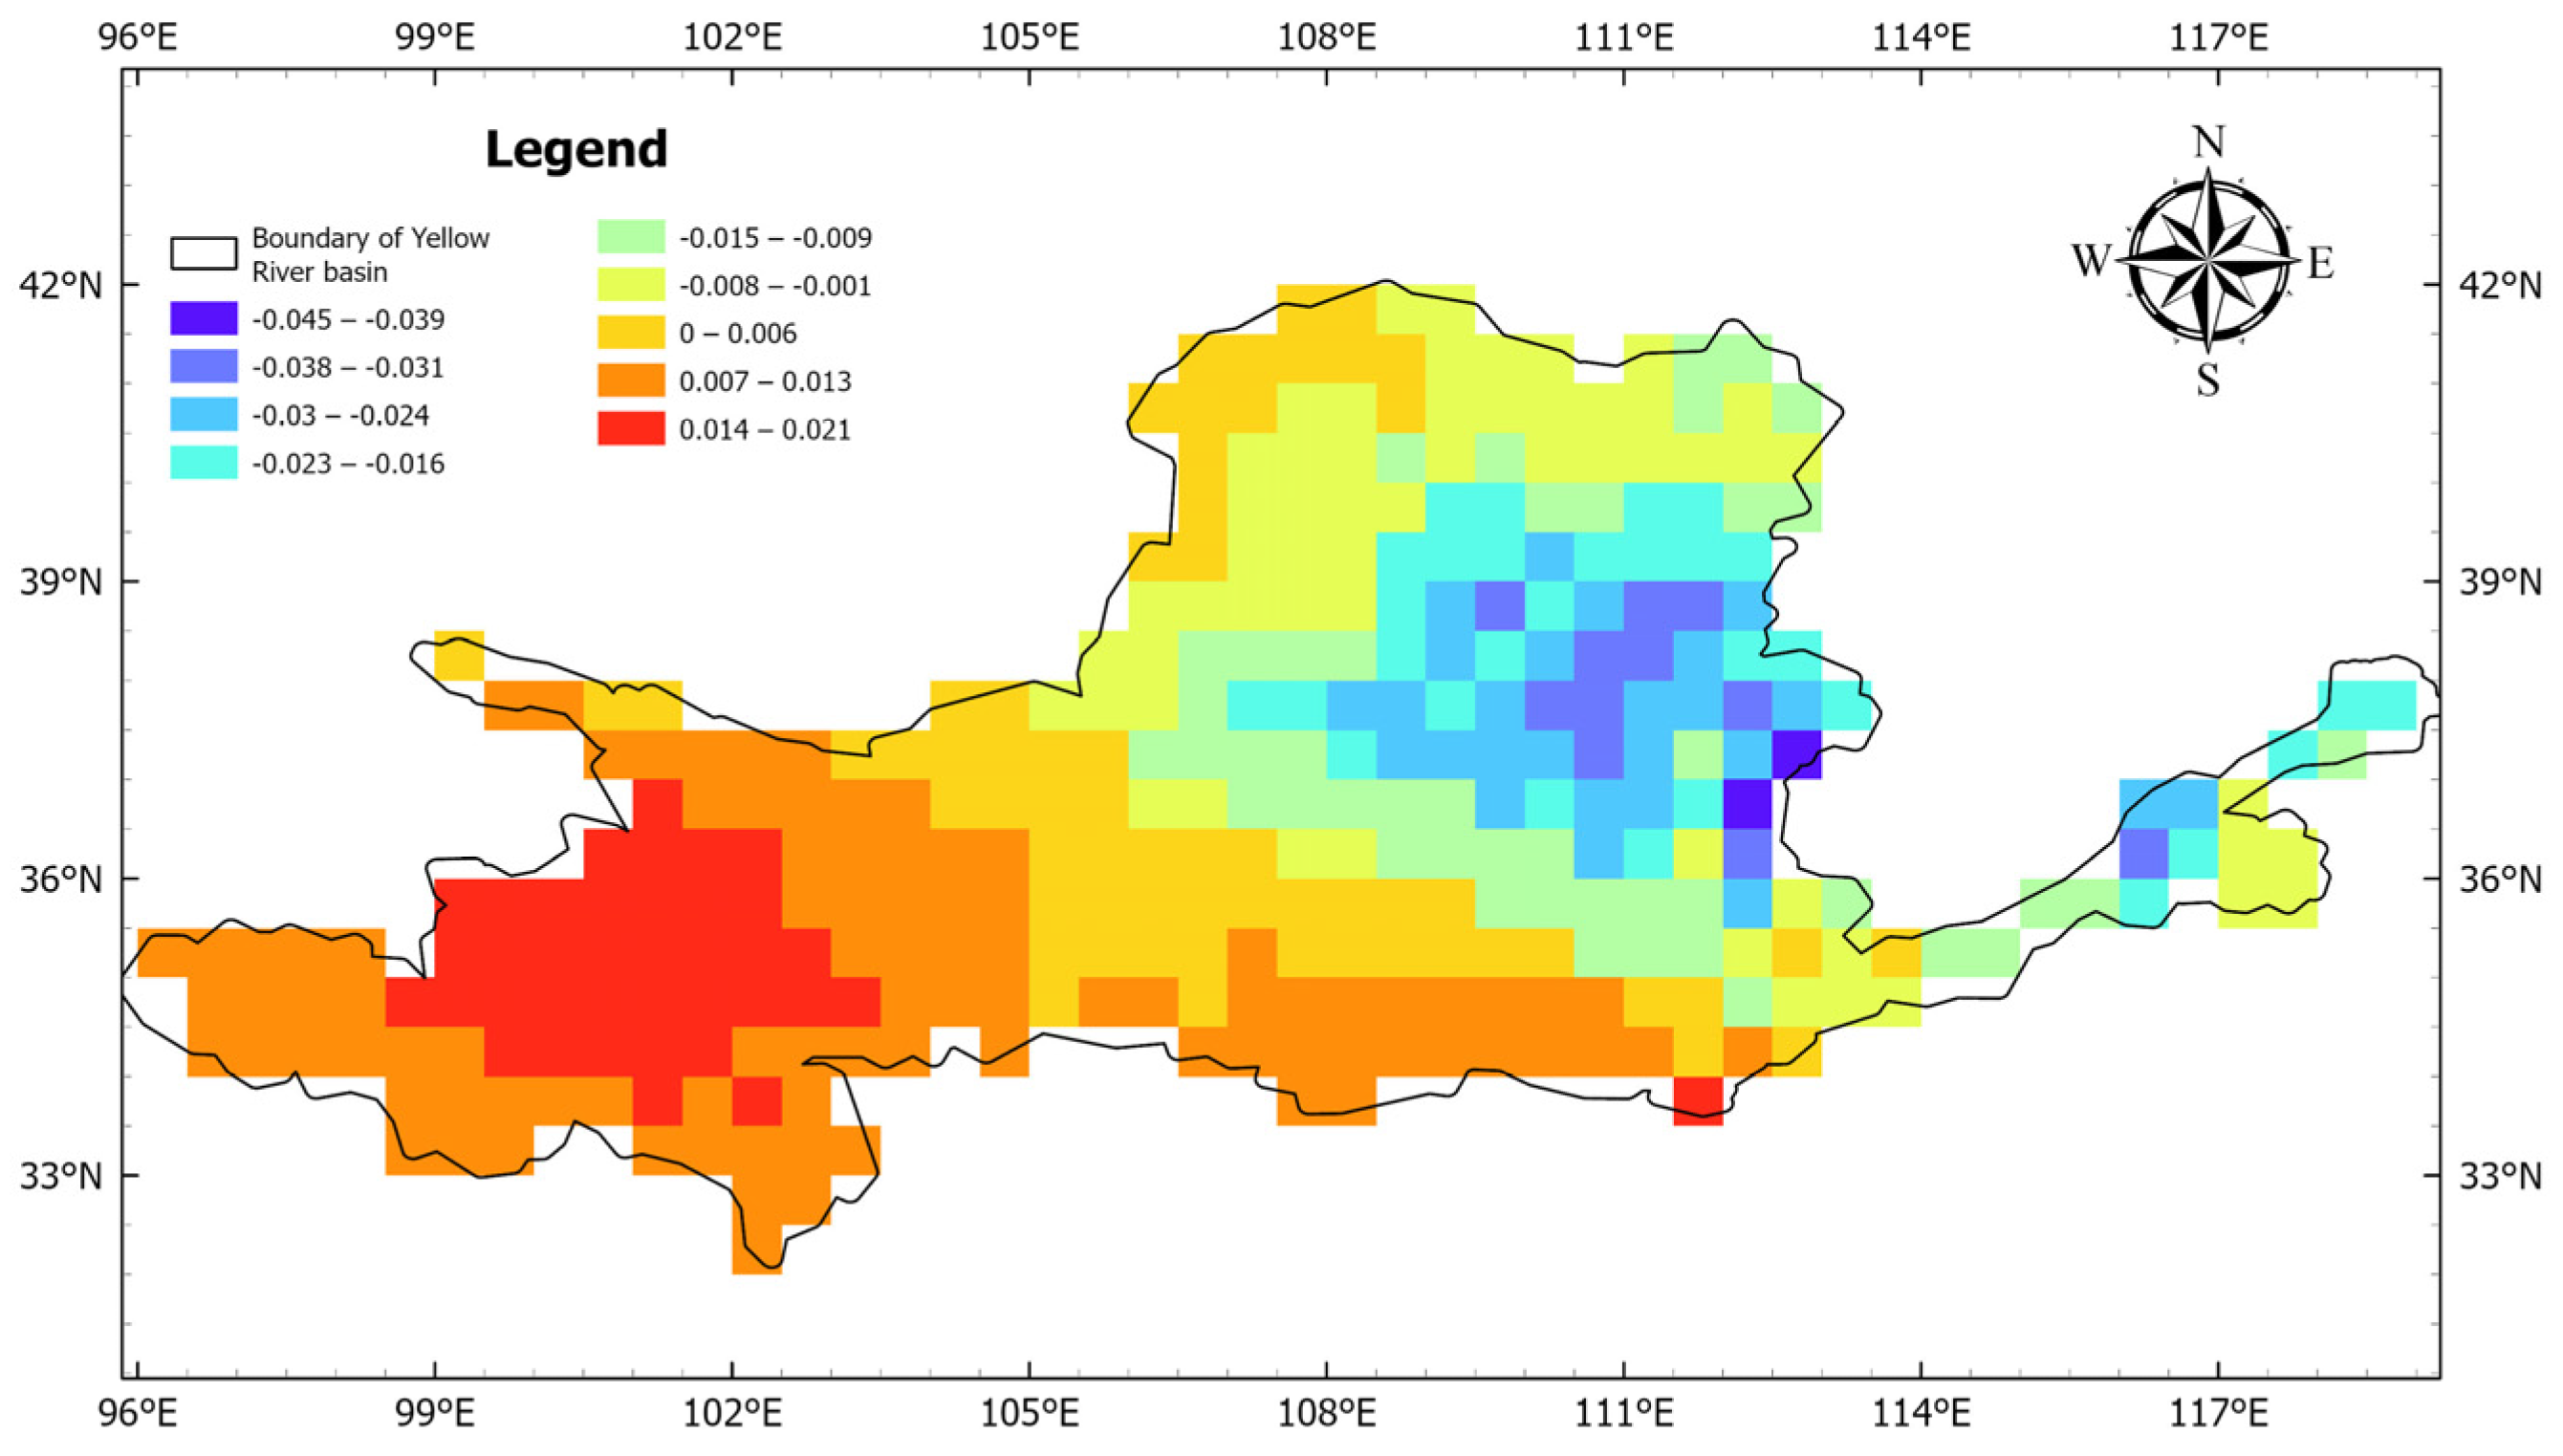
The rate of change reflects the trend of the water storage variations. In this study, we first calculated the change rate using MATLAB2021a, and then created a rate of change map of the GNSS_EWH retrieved in the Yellow River Basin over the past 12 years using ARCpro3.0.1 and compared it with a map of the rate of change in the GLDAS_TWS. As can be seen from Figure 13, the water storage in the upper and upper-middle reaches of the Yellow River Basin exhibited an increasing trend, while that in the lower-middle and lower reaches exhibited a decreasing trend. This is generally consistent with the trend of the rate of change in the GLDAS_TWS (Figure 14).
From the comparison results of the spatial correlation grade distribution shown on the map, the amplitude distribution characteristics, and the rate of change map, it was found that the GNSS_EWH retrieved in this study has good credibility.

5. Discussion

After verifying the credibility of the inversion results, we analyzed the temporal variations in the GNNS_EWH, including an analysis of the trends and periodicity of the water storage changes in the Yellow River Basin, such as the annual water storage change trends and monthly variation patterns. In addition, an attribution analysis of the water storage changes in the Yellow River Basin was conducted.

5.1. Trends and Periodicity Analysis of Water Storage Changes in the Yellow River Basin

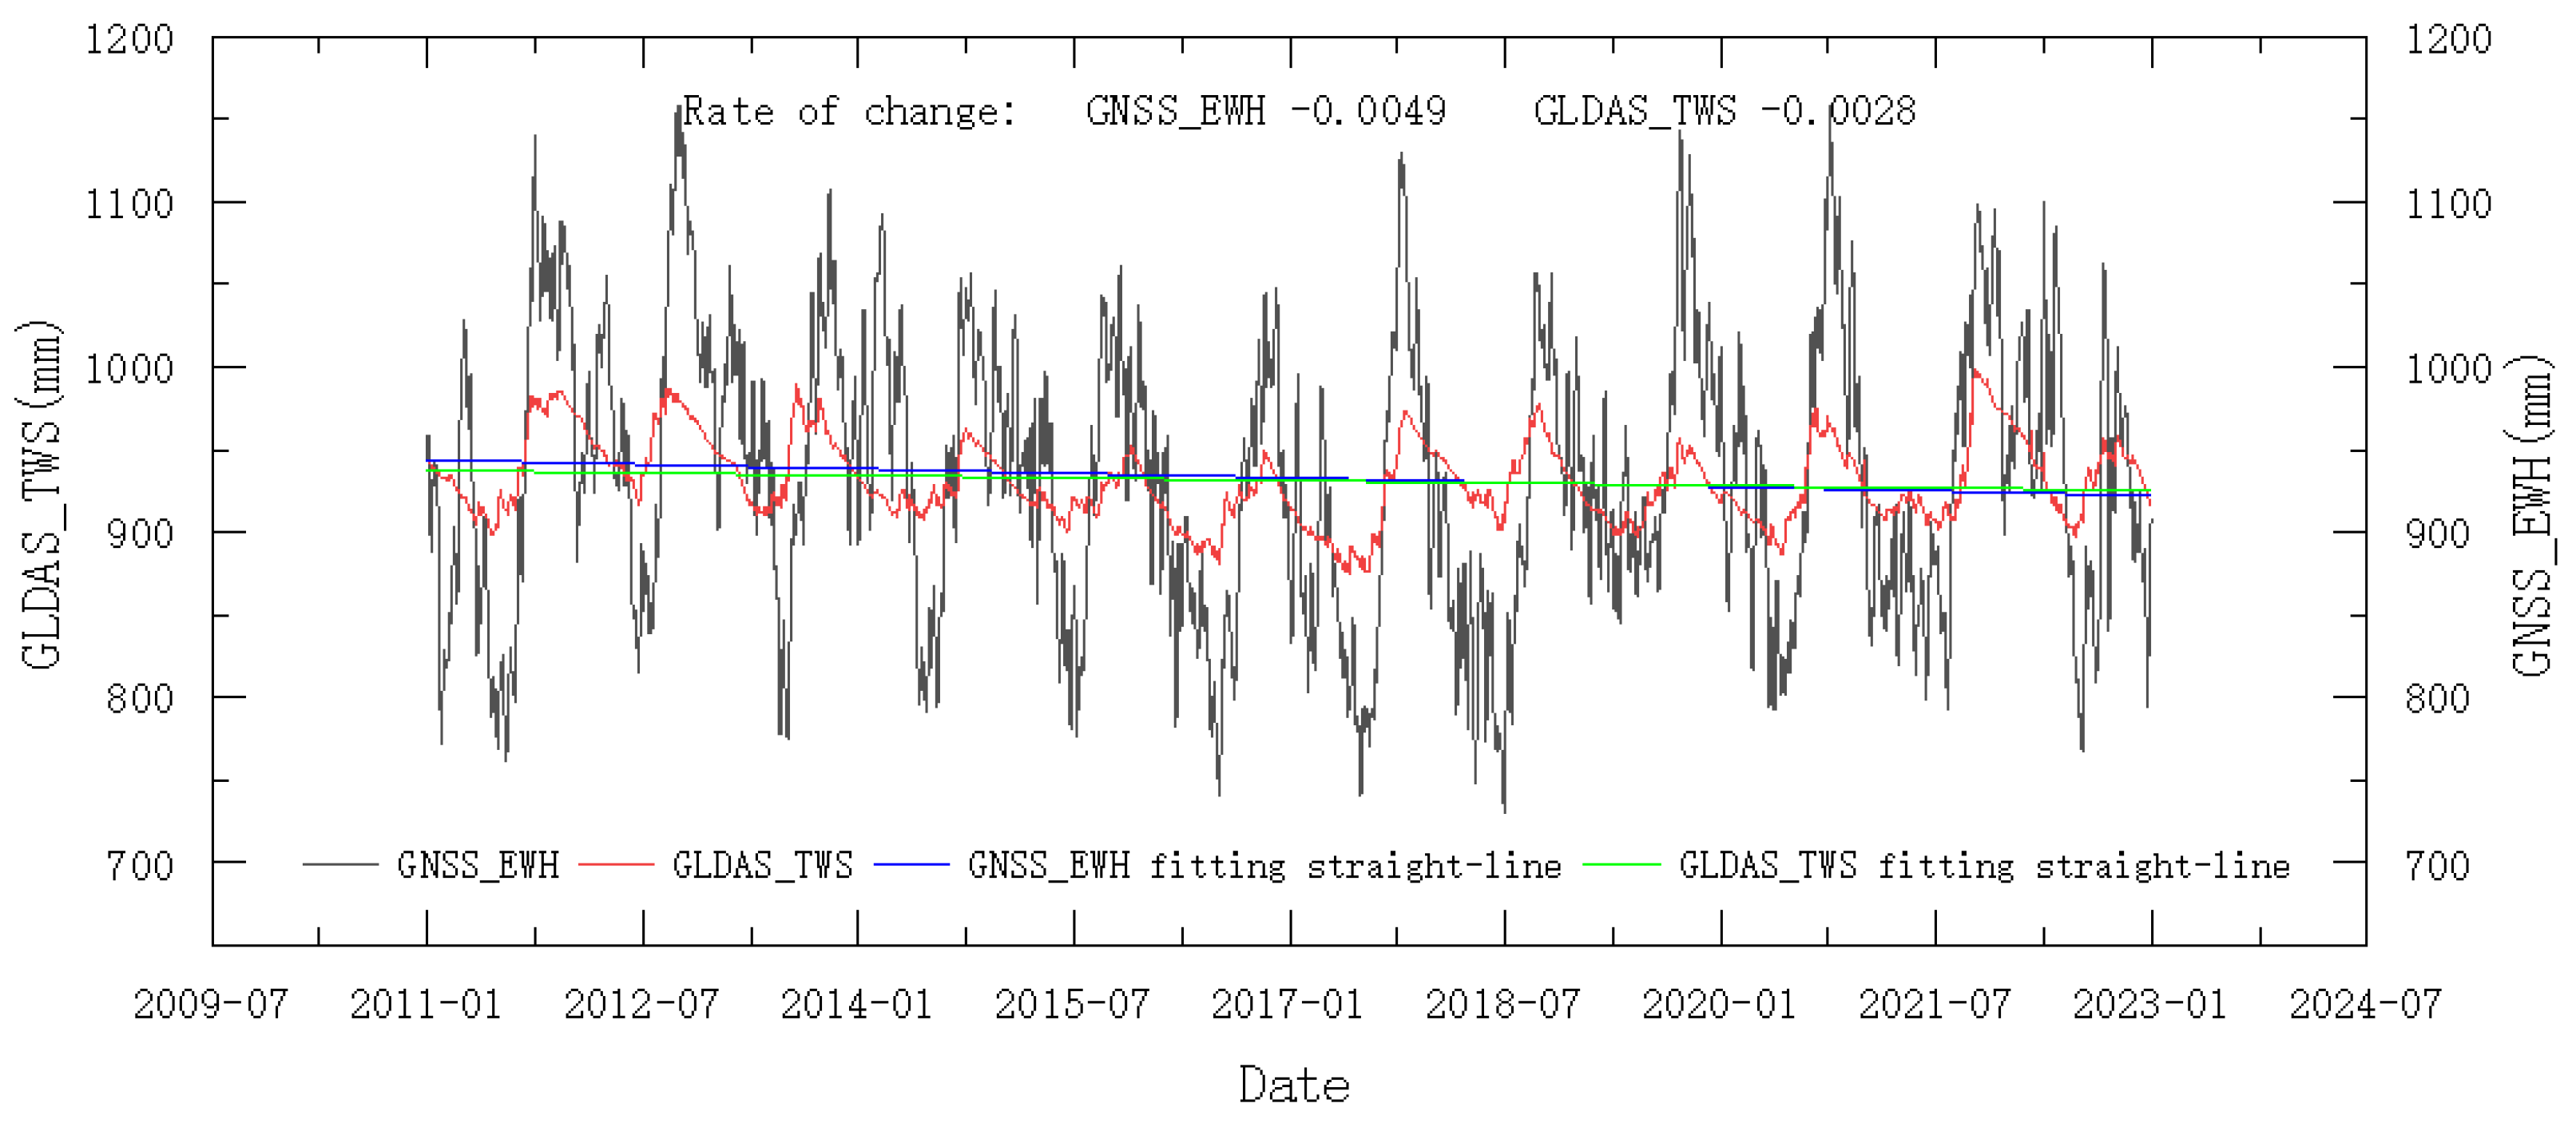
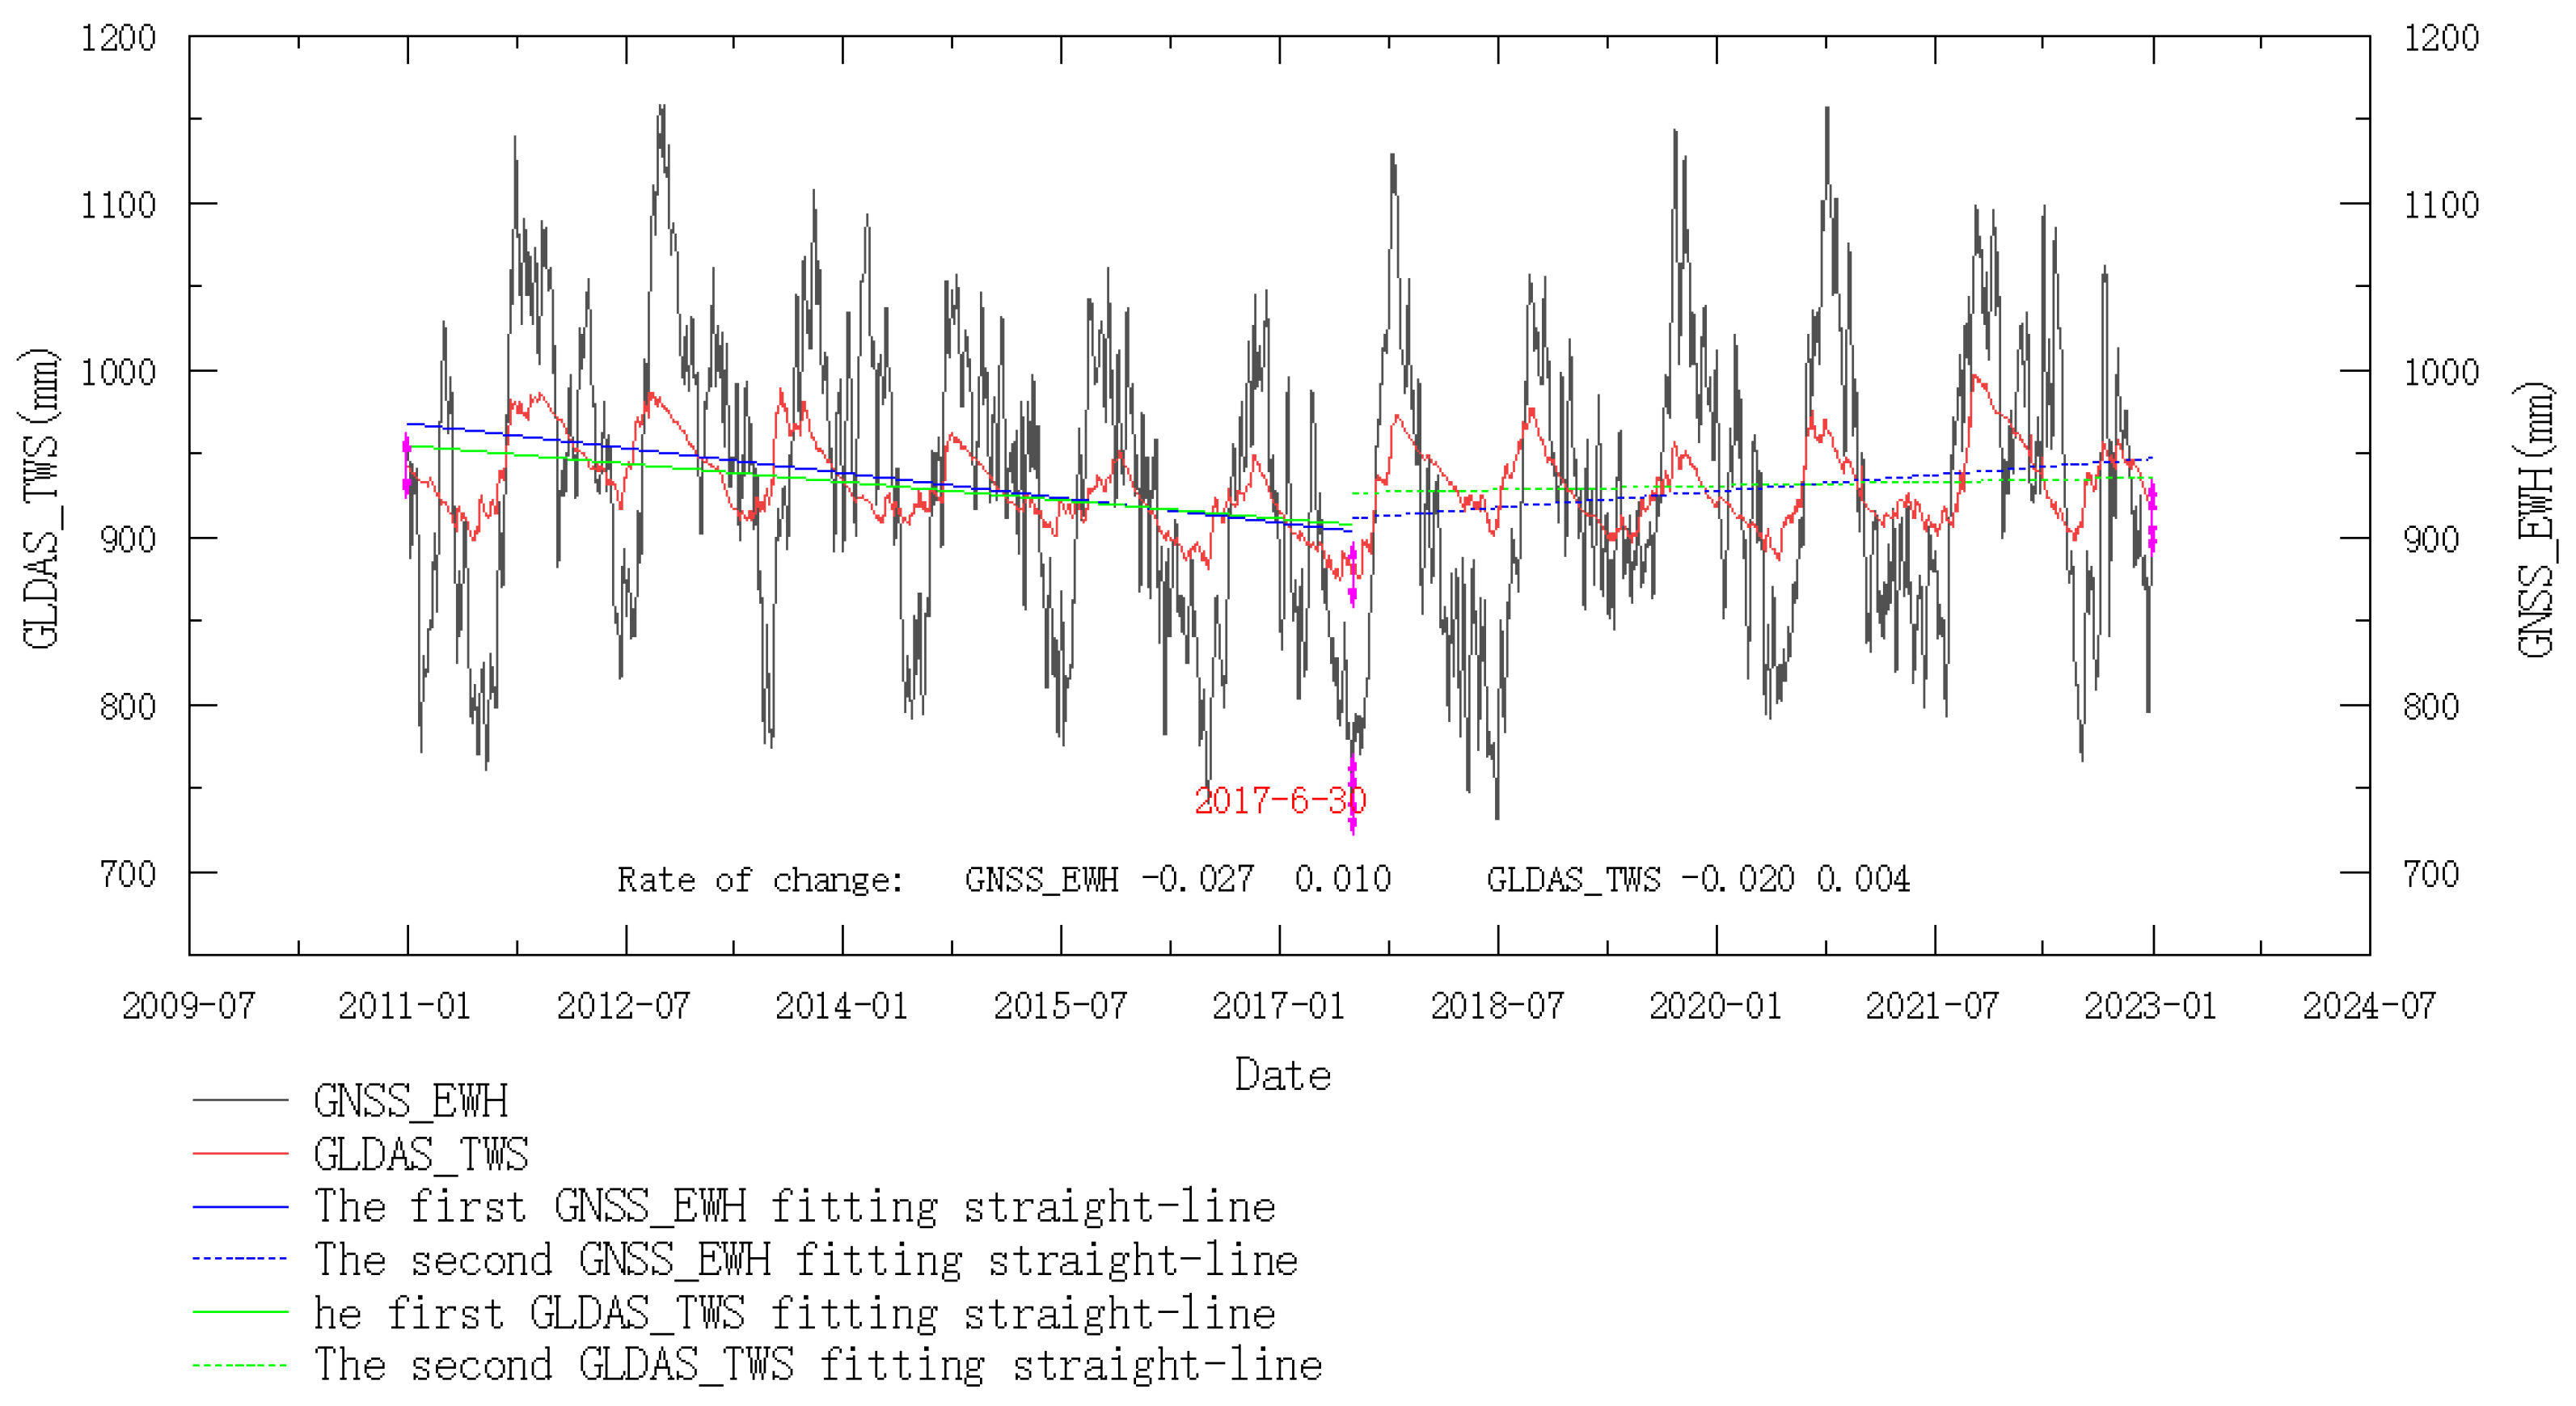
We used Origin2021 to create a time series plot of water storage and conducted a trend analysis based on this water storage time series. The water storage in the Yellow River Basin exhibited an overall decreasing trend during 2011–2022 (Figure 15), which was consistent with the trend observed in the GLDAS_TWS. The rate of decrease was 0.0049 mm/d, which was 0.0021 mm/d faster than that of the GLDAS_TWS. As can be seen from the segmented fitting plot of the EWH variations over time (Figure 16), the water storage decreased at a rate of 0.027 mm/d during 2011–2017 and increased at a rate of 0.010 mm/d during 2017–2022. In addition, the months with the highest water storage in the Yellow River Basin were concentrated from September to November, while the months with the lowest water storage were concentrated from June to August. These trends are generally consistent with those reported in previous studies that used GRACE data in the Yellow River Basin. However, our methodology provides the daily variations in water storage, allowing for the retrieval of more detailed information about the water storage changes in the Yellow River Basin. For instance, there was a sudden peak in water storage from February to April each year, which may have been related to the increased water storage resulting from the melting of ice in the upstream area.

5.2. Attribution Analysis of Water Storage Changes in the Yellow River Basin

In this study, a correlation analysis was performed on precipitation, evapotranspiration, and surface temperature data, which are factors related to water storage changes. In addition, a comparative plot of the retrieved EWH, precipitation, evapotranspiration, and surface temperature over time was created. The phenomena identified using the correlation analysis, as well as the time series data plot, which was made using Python3.8, are discussed below, as follows:
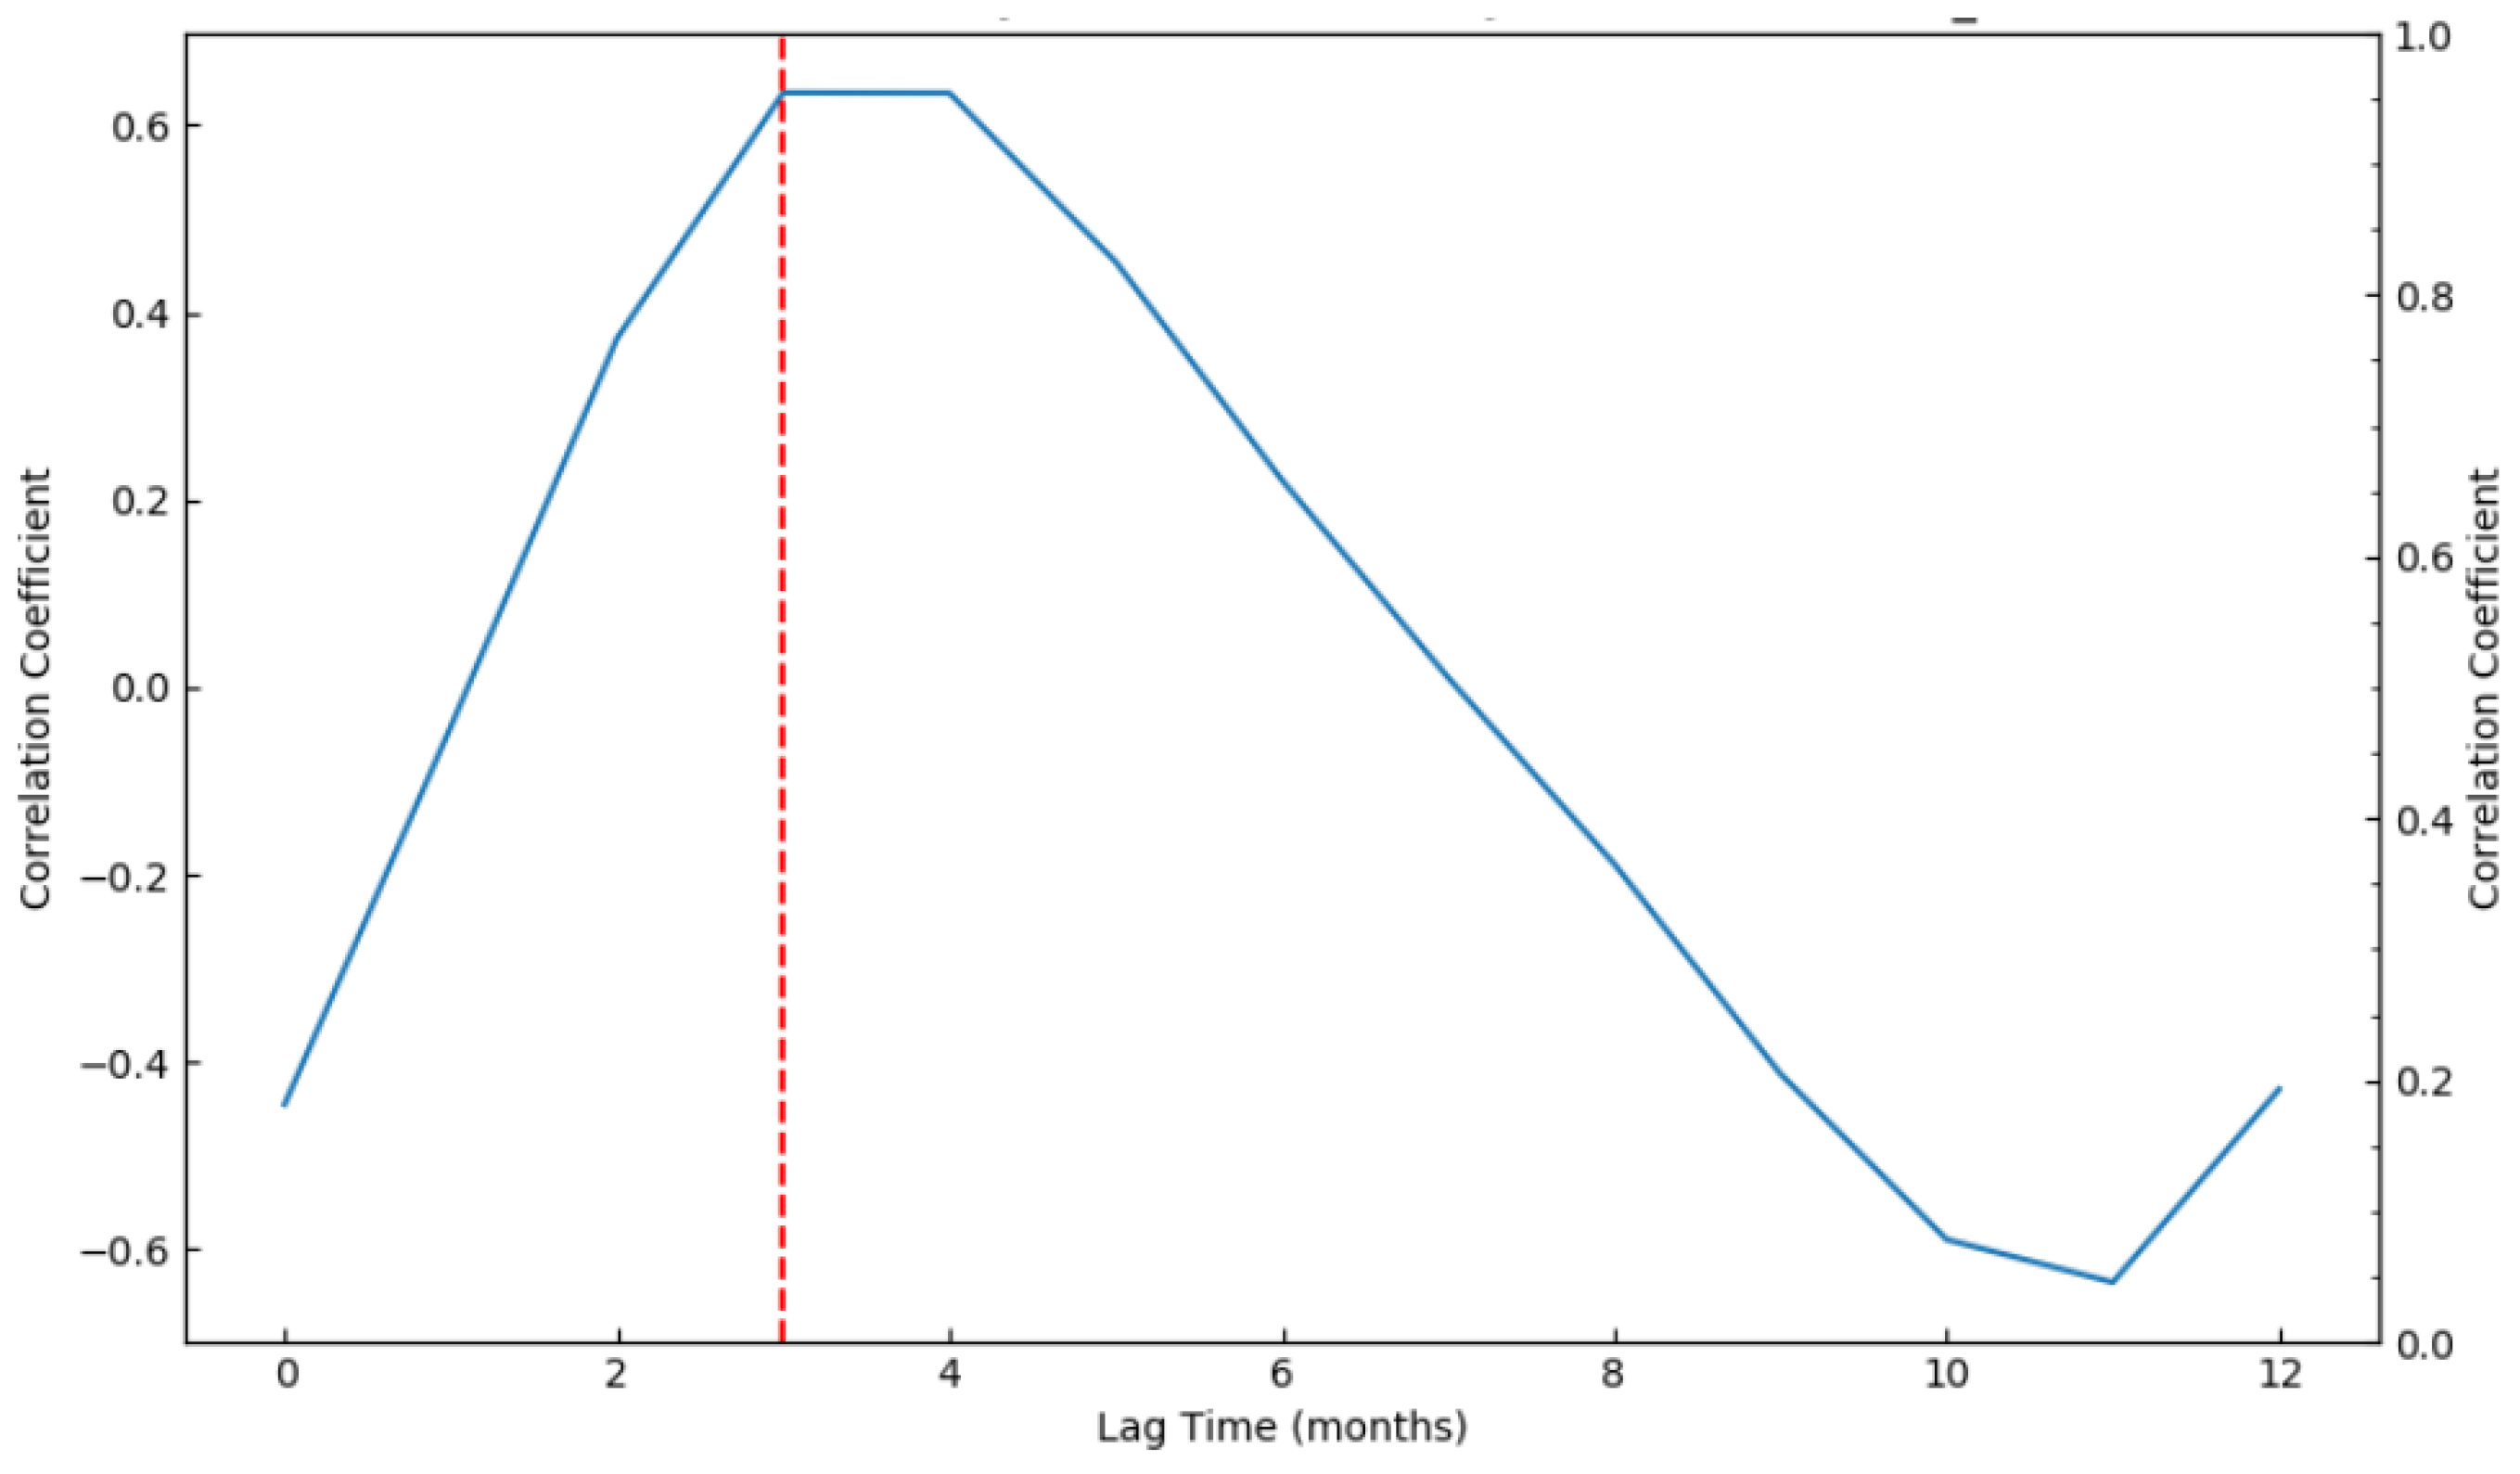
(1) According to the model of the hydrological cycle, precipitation replenishes the terrestrial water storage and is the primary reason for the increase in the TWS. The water storage gradually increases after precipitation, but there is a lag effect. By calculating and plotting the correlation coefficient between the monthly average precipitation and the monthly average water storage when considering different lag times, it was found that the correlation coefficient between the water storage and the precipitation reached a maximum of 0.63 for a lag time of three months after precipitation (Figure 17). This indicates that the retrieved GNSS_EWH was strongly correlated with precipitation, and there was a three-month lag in the changes in water storage relative to the occurrence of precipitation.
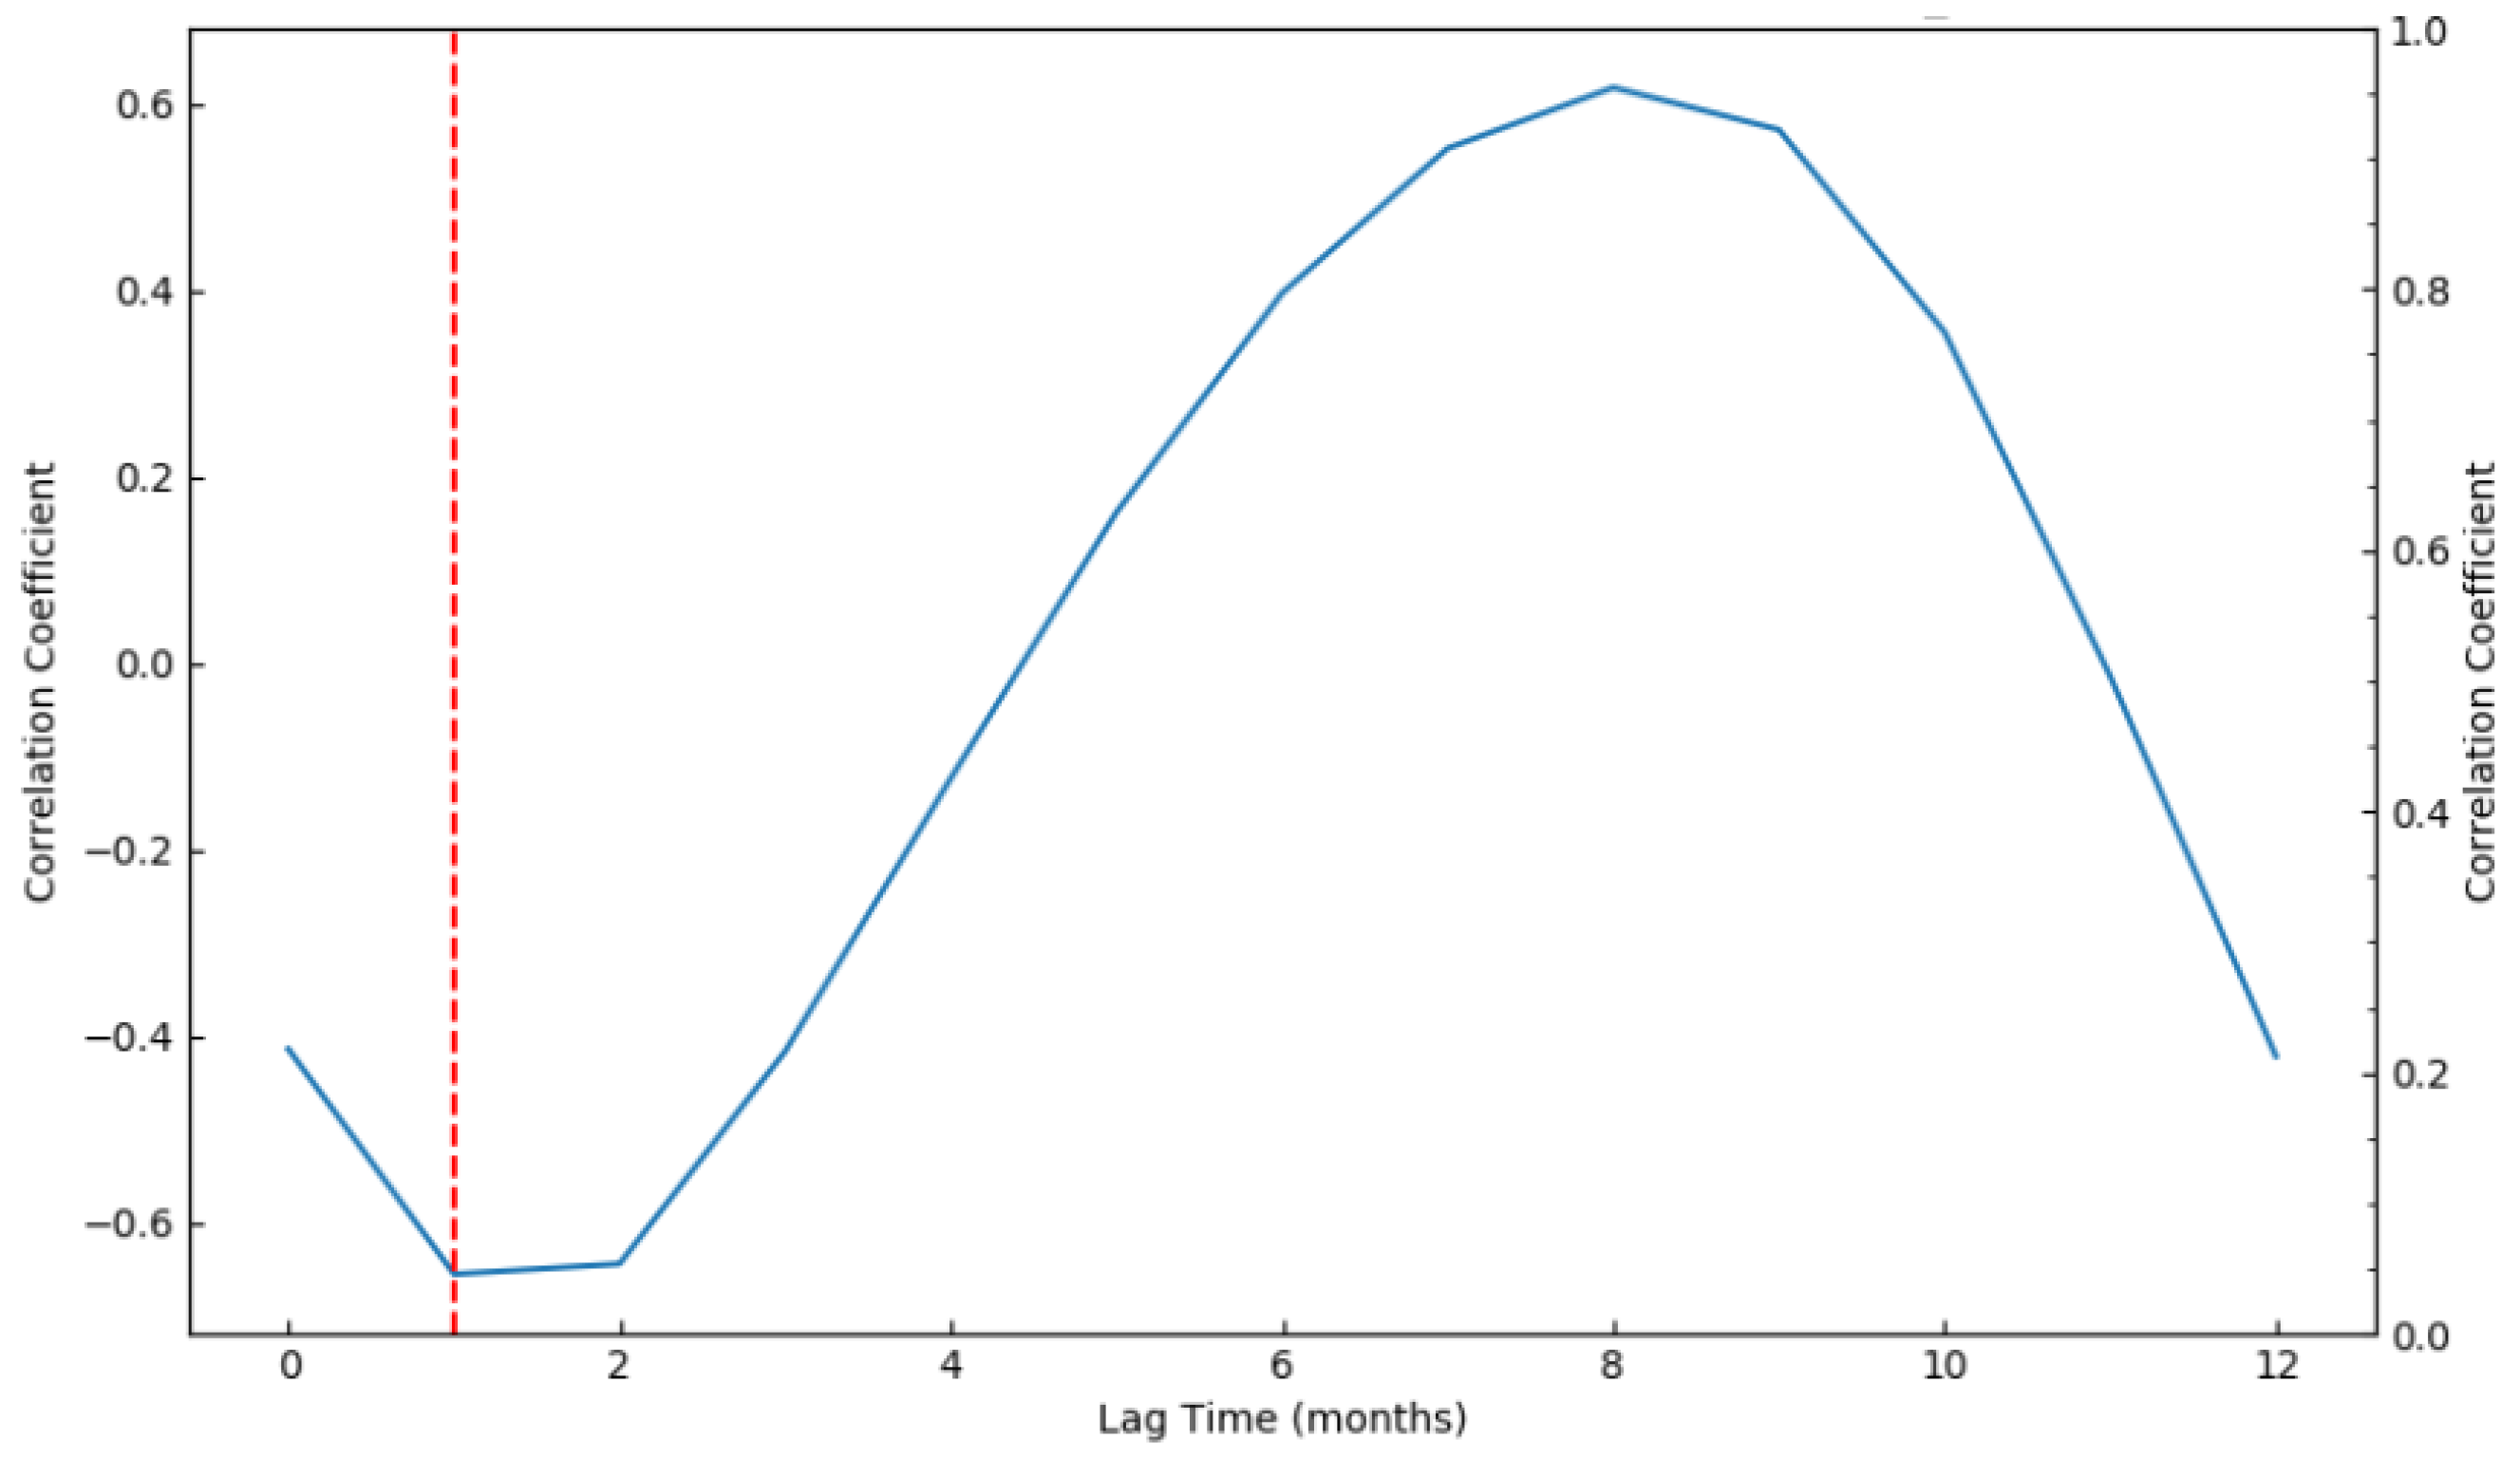
(2) Evapotranspiration leads to a gradual decrease in water storage, and the larger the water storage, the greater the amount of evapotranspiration. By shifting the retrieved GNSS_EWH back one month, the correlation coefficient with evapotranspiration reached a maximum of −0.65 (Figure 18), indicating that there was a strong negative correlation between the GNSS_EWH and evapotranspiration. This suggests that the decrease in water storage in the Yellow River Basin was significantly influenced by evapotranspiration.
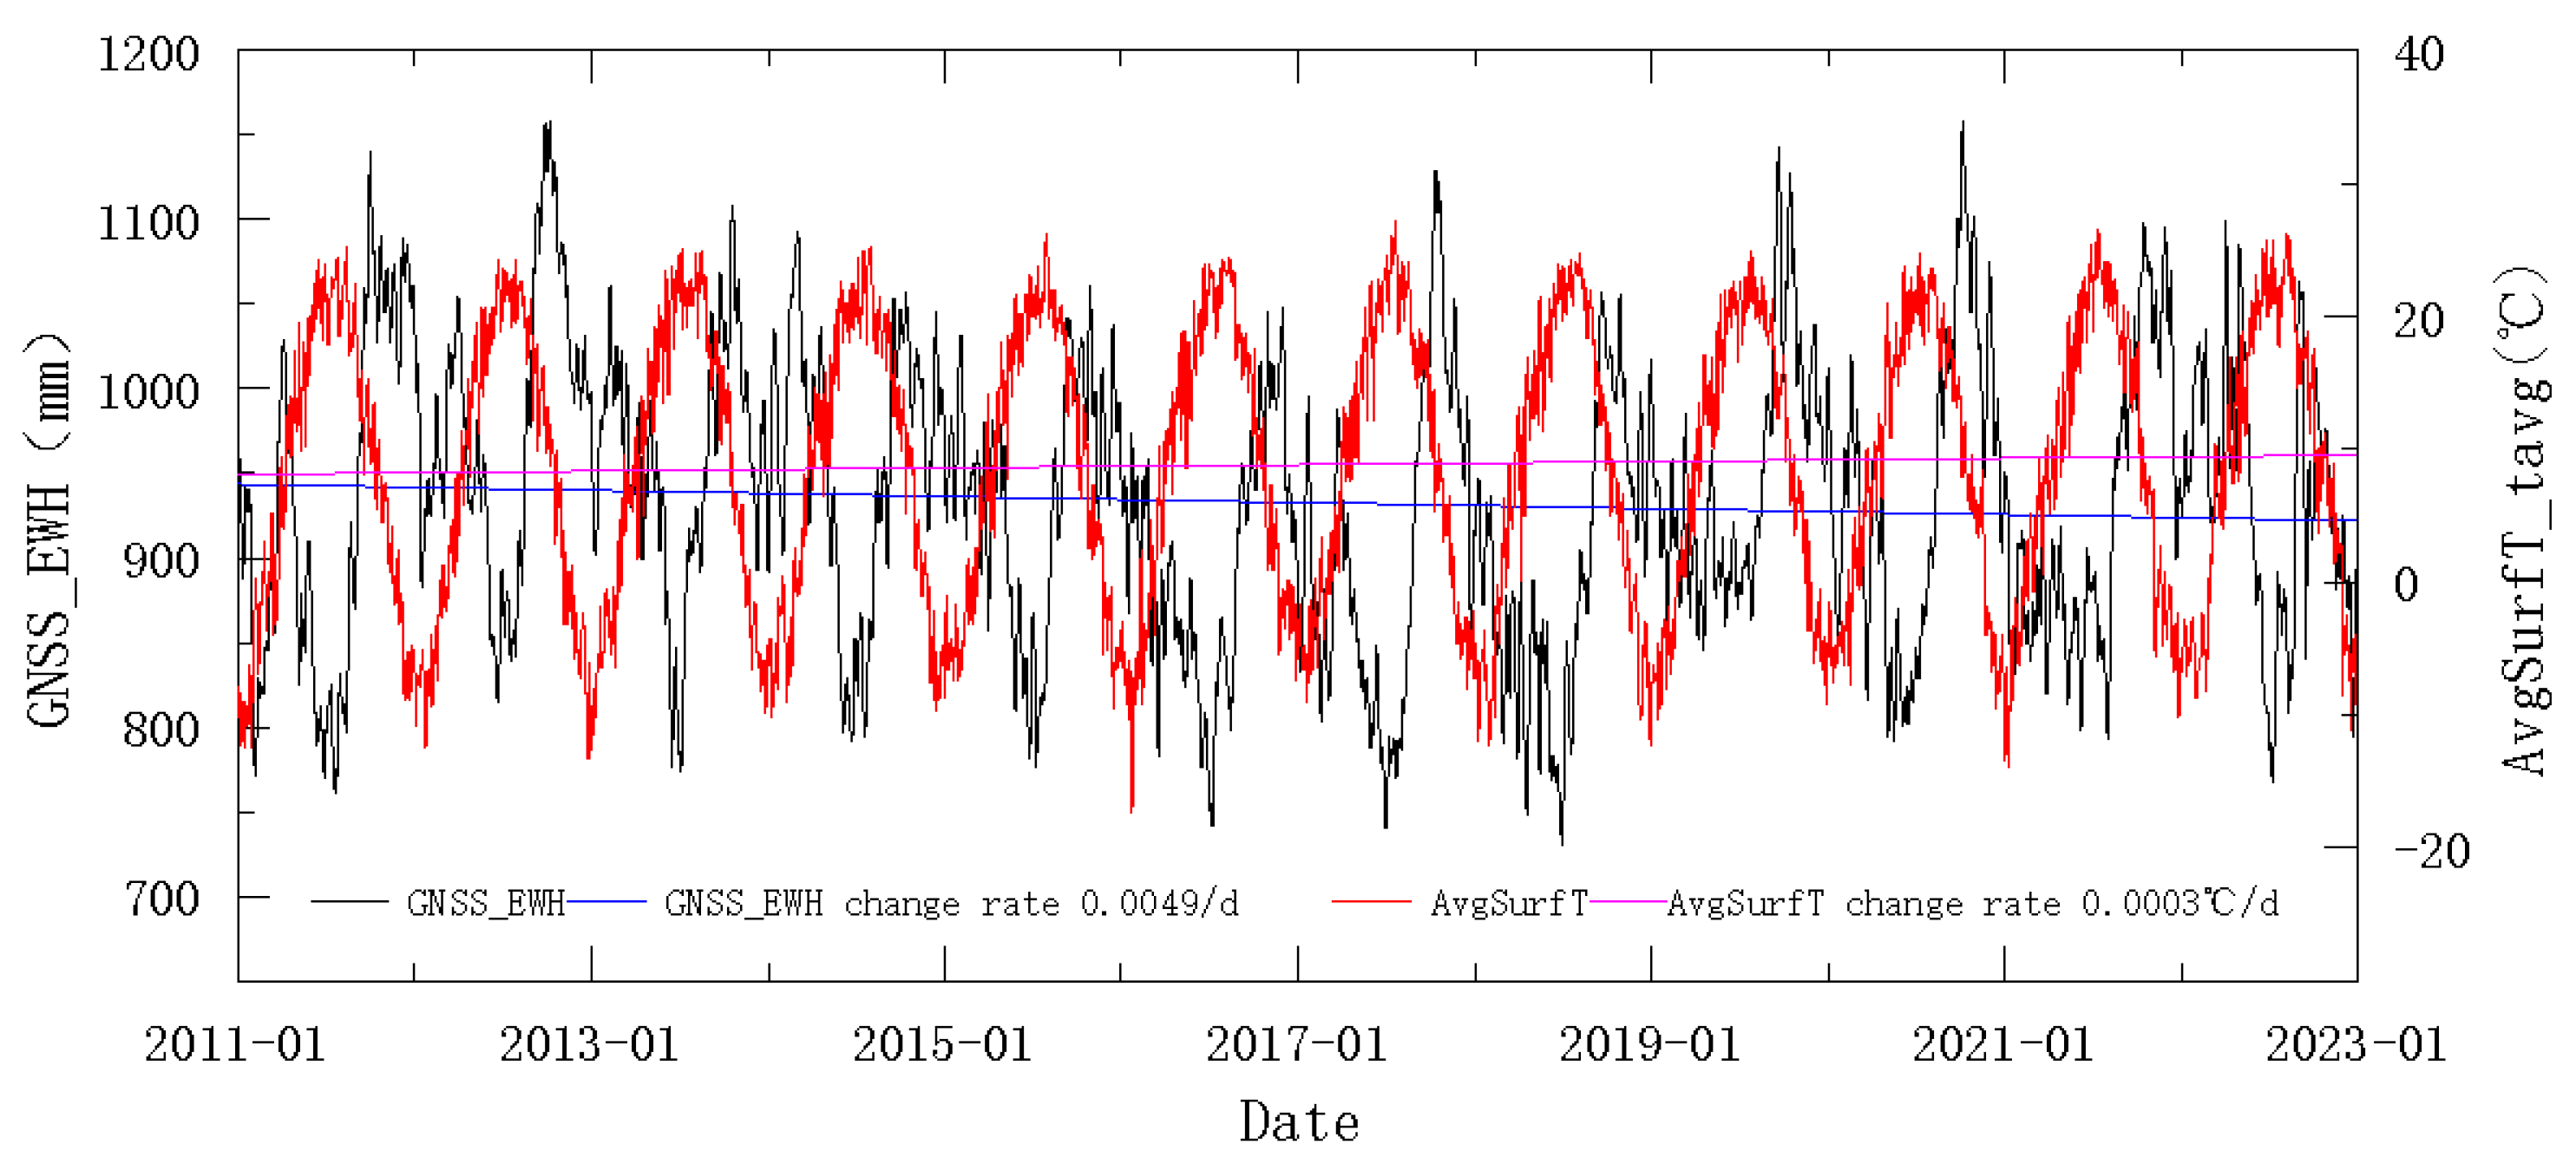
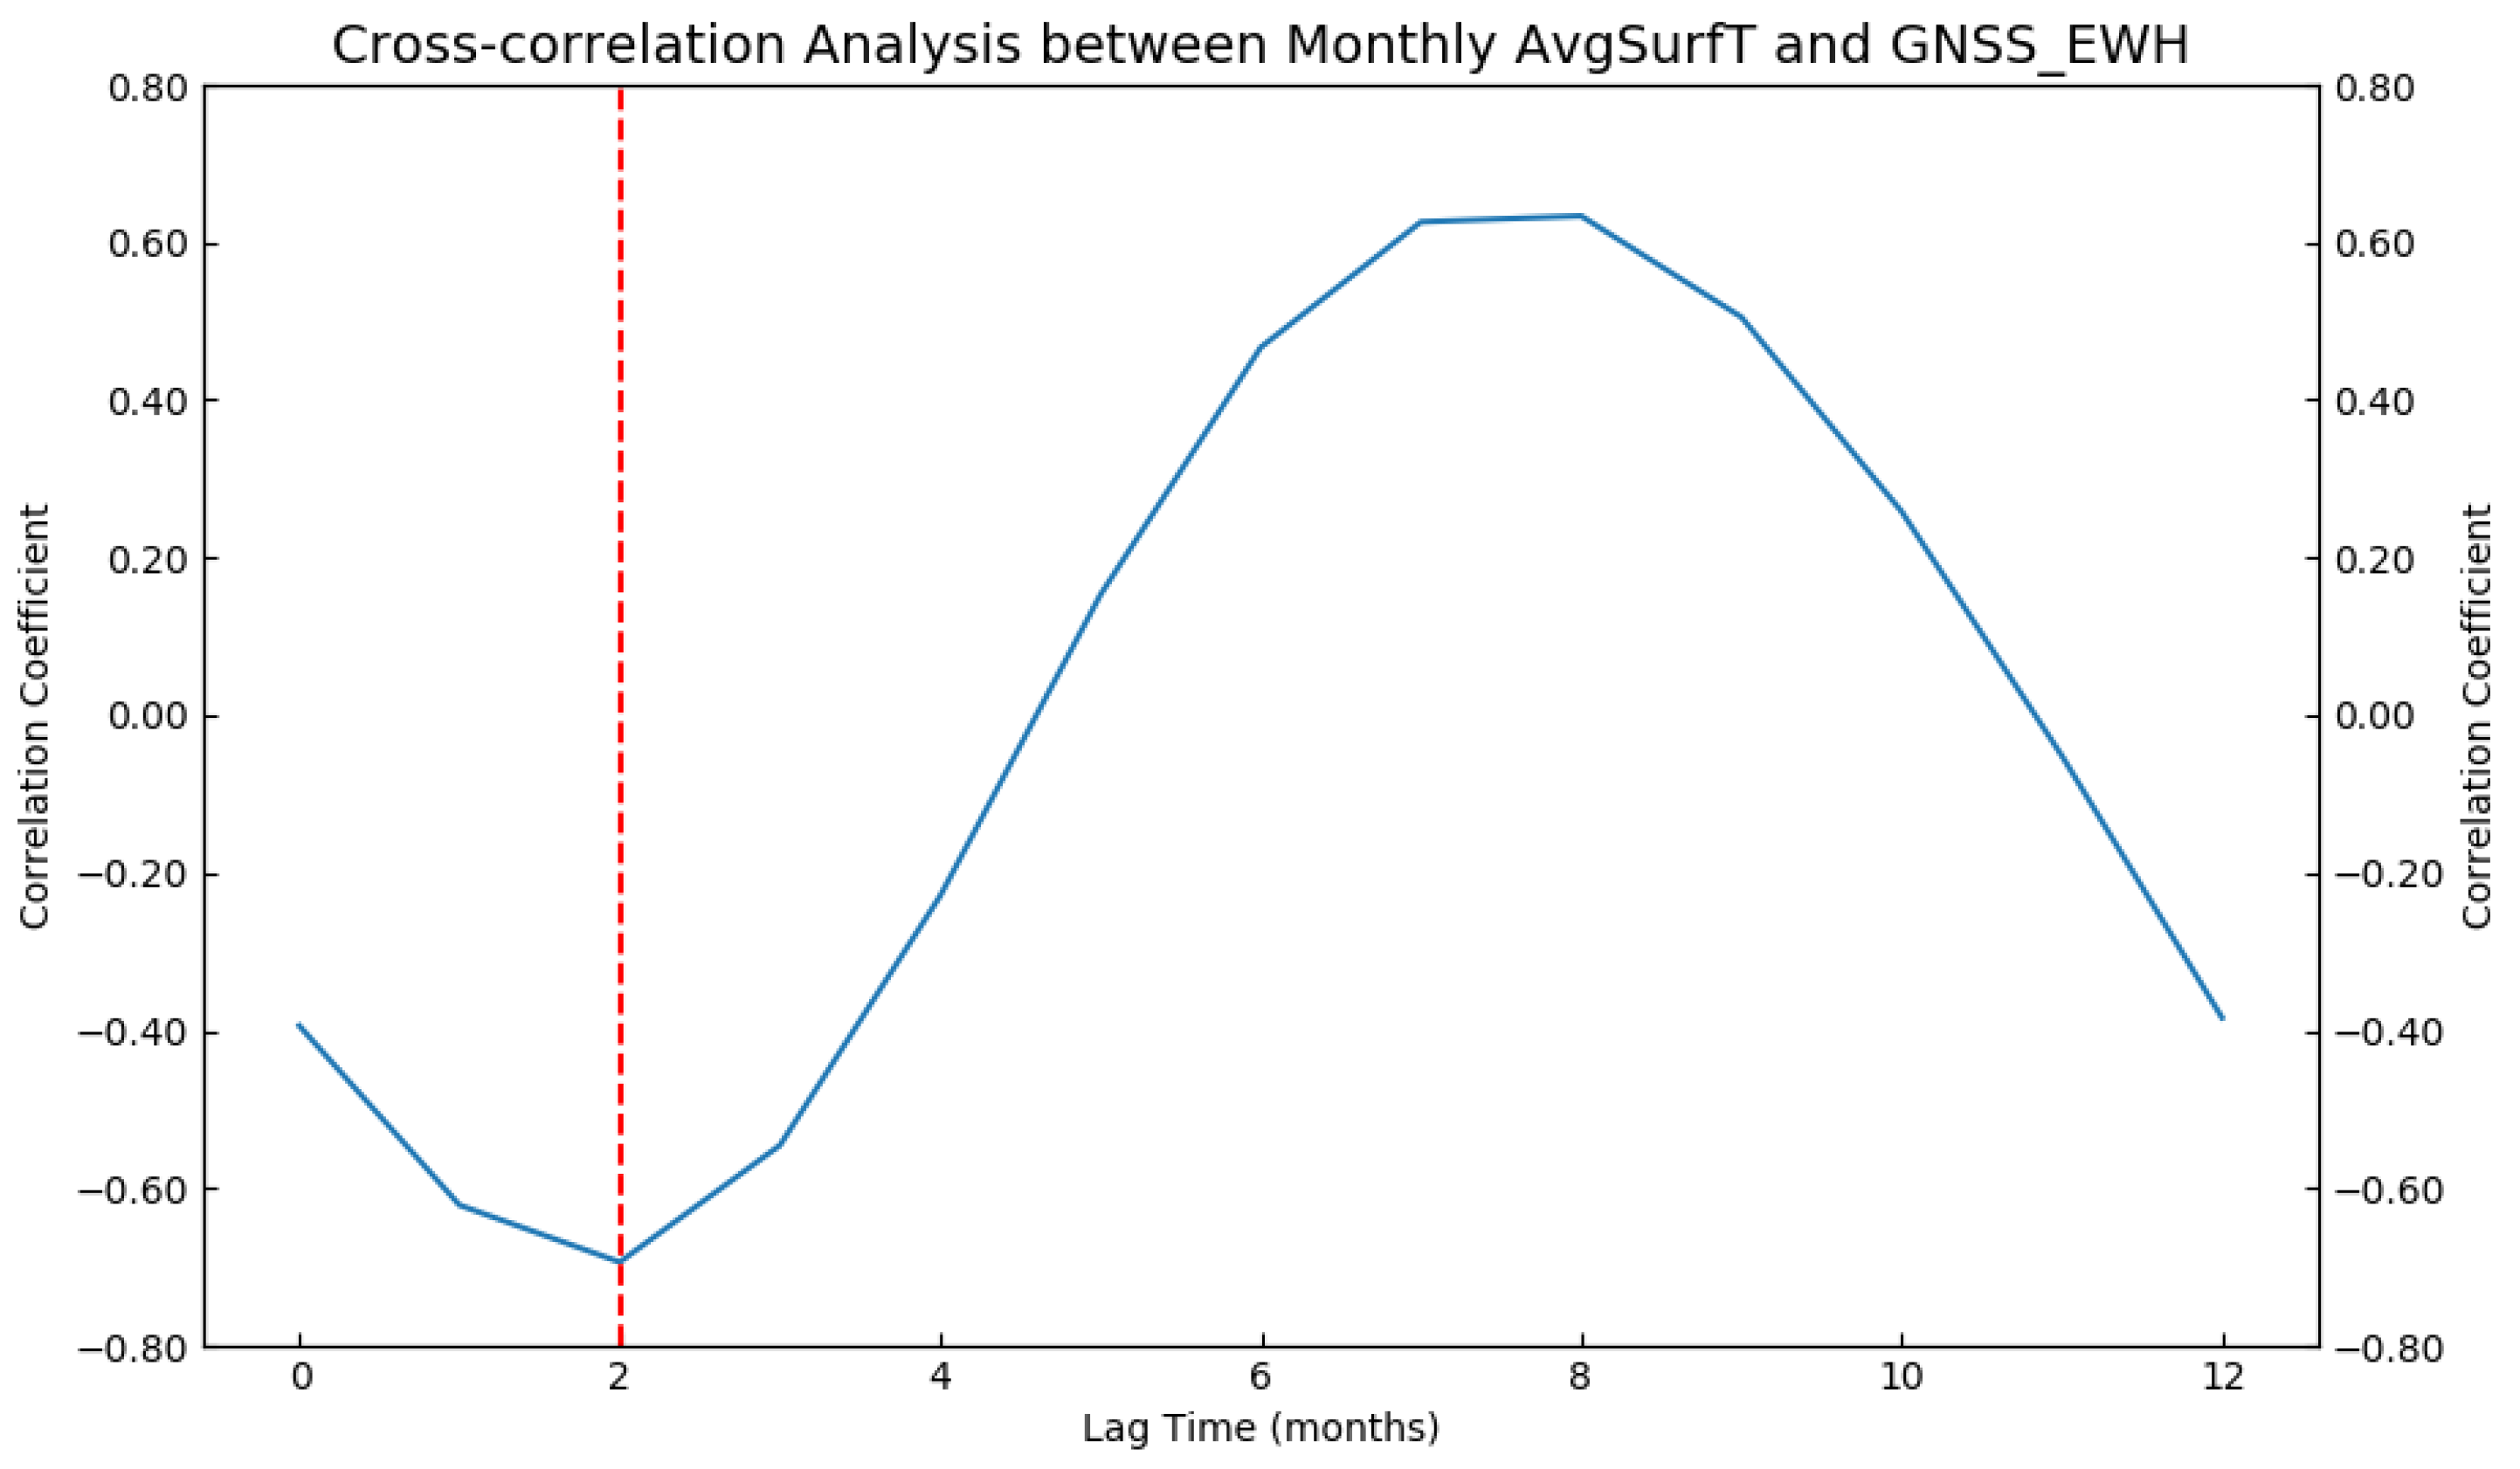
(3) Temperature changes affect the water cycle. In this study, a time series plot of the GNSS_EWH and average surface temperature was created (Figure 19), and a linear fit of the daily variations over the past 12 years was obtained. The rate of change in the temperature over the past 12 years was 0.0003 °C/d, i.e., an increasing trend, which was inversely correlated with the rate of change in the water storage (−0.0049 mm/d) retrieved using the GNSS_EWH. This suggests that, as the temperature increased, the water storage decreased. In addition, the correlation between the temperature and the water storage was analyzed (Figure 20), and the maximum correlation coefficient between the temperature and the water storage reached −0.69 when the water storage was shifted back by two months, indicating a strong correlation.

6. Conclusions

In this study, we developed a new method for estimating the water storage changes in the Yellow River Basin using vertical displacement data from GNSS continuous stations. Based on the inversion results, we explored the impacts of factors such as rainfall, evapotranspiration, and surface temperature on the changes in the water storage in the Yellow River Basin. The conclusions of this study are as follows:
(1)
In the Yellow River Basin, where GNSS stations are unevenly distributed, the proposed method can effectively derive daily water storage products with a spatial resolution of 0.5°. The inverse distance weighted smoothing method designed in this study takes into account the density of the GNSS stations near the grid points and the distance between the grid points and the GNSS stations, and it adjusts the smoothing factor to emphasize the influences of near-field signals on far-field signals. This method enabled the inversion of the water storage changes in the Yellow River Basin during the past 12 years using vertical displacement data from the unevenly distributed GNSS stations. Experimental validation confirmed the reliability of the results.
(2)
Compared with water storage products derived from GRACE, the spatial resolution of the water storage products for the Yellow River Basin estimated in this study did not improve, but the temporal resolution was significantly improved from monthly to daily. The analysis of the water storage products estimated in this study revealed that the TWS in the Yellow River Basin exhibited an overall decreasing trend, and it was correlated with the changes in rainfall, evapotranspiration, and surface temperature. The trend analysis of the GNSS_EWH revealed that the water storage in the Yellow River Basin decreased at a rate of 0.027 mm/day from 2011 to 2017 and increased at a rate of 0.010 mm/day from 2017 to 2022, with an overall rate of decrease of 0.0049 mm/day during the last 12 years. Moreover, the map of the annual values in the Yellow River Basin showed that the water storage decreased in the lower-middle and lower reaches and increased in the upper and upper-middle reaches over the past 12 years. The correlation analysis between the estimated water storage in the Yellow River Basin and the rainfall, evapotranspiration, and surface temperature data from GLDAS indicates that there were strong correlations, suggesting that these factors were significant drivers of the water storage changes in the Yellow River Basin.

Author Contributions

Conceptualization, W.Z. and X.L.; methodology, W.Z. and X.L.; software, W.Z.; validation, X.L. and W.Z.; formal analysis, W.Z. and X.L.; investigation, W.Z.; resources, W.Z.; data curation, W.Z.; writing—Origin2021al draft preparation, W.Z.; writing—review and editing, W.Z. and X.L.; visualization, W.Z. and X.L.; supervision, X.L.; project administration, X.L.; funding acquisition, X.L. All authors have read and agreed to the published version of the manuscript.

Funding

This research was funded by the 2016 National Key Research and Development Plan (grant number 2016YFC0803103) and Research on the Digital Twin Smart Drainage Model for Typical Areas in Kunming Based on Machine Learning (grant number KLM202304).

Data Availability Statement

The data presented in this study are available upon request from the corresponding author.

Conflicts of Interest

The authors declare no conflicts of interest.

References

  1. Wang, F.; Wang, Z.; Yang, H.; Zhao, Y. Study of the temporal and spatial patterns of drought in the Yellow River basin based on SPEI. Sci. China Earth Sci. 2018, 61, 317–331. [Google Scholar] [CrossRef]
  2. Shen, Y.; Yan, H.; Peng, P.; Feng, W.; Zhang, Z.; Song, Y.; Bai, X. Boundary-Included Enhanced Water Storage Changes Inferred by GPS in the Pacific Rim of the Western United States. Remote Sens. 2020, 12, 2429. [Google Scholar] [CrossRef]
  3. Chen, J.L.; Wilson, C.R.; Tapley, B.D.; Yang, Z.L.; Niu, G.Y. 2005 drought event in the Amazon River basin as measured by GRACE and estimated by climate models. J. Geophys. Res. Solid Earth 2009, 114, B05404. [Google Scholar] [CrossRef]
  4. Chen, J.; Wilson, C.; Tapley, B.; Scanlon, B.; Güntner, A. Long-term groundwater storage change in Victoria, Australia from satellite gravity and in situ observations. Glob. Planet. Chang. 2016, 139, 56–65. [Google Scholar] [CrossRef]
  5. Ni, S.N.; Chen, J.L.; Li, J.; Chen, C.; Liang, Q. Terrestrial Water Storage Change in the Yangtze and Yellow River Basins from GRACE Time-Variable Gravity Measurements. J. Geod. Geodyn. 2014, 34, 49–55. [Google Scholar]
  6. Ding, Y.; Huang, D.; Jiang, Z.; Luo, C.; Tang, W. The Periods of Terrestrial Water Storage Changes of China’s Four Basins Derived from GRACE. J. Geod. Geodyn. 2018, 38, 603–608. [Google Scholar]
  7. Xie, J.; Xu, Y.-P.; Wang, Y.; Gu, H.; Wang, F.; Pan, S. Influences of climatic variability and human activities on terrestrial water storage variations across the Yellow River basin in the recent decade. J. Hydrol. 2019, 579, 124218. [Google Scholar] [CrossRef]
  8. Zhao, Y.; Shen, Q.; Feng, W.; Wang, H.; Gao, F.; Lai, W.; Liu, T. Changes and Spatio-Temporal Characteristics of Terrestrial Water Storage Variation in China’s Seven Main River Basins during 2002–2018. J. Geod. Geodyn. 2022, 8, 796–801. [Google Scholar]
  9. Xie, X.; Xing, M.; Wang, L.; Xu, G.; Wen, H. Using GRACE/GRACE-FO Gravity Satellite to Detect the Water Storage Capacity and the Possibility of Extreme Climate in the Yellow River Basin. J. Geod. Geodyn. 2022, 42, 1269–1275. [Google Scholar]
  10. Gyawali, B.; Ahmed, M.; Murgulet, D.; Wiese, D.N. Filling Temporal Gaps within and between GRACE and GRACE-FO Terrestrial Water Storage Records: An Innovative Approach. Remote Sens. 2022, 14, 1565. [Google Scholar] [CrossRef]
  11. Wu, X.; Heflin, M.B.; Ivins, E.R.; Argus, D.F.; Webb, F.H. Large-scale global surface mass variations inferred from GPS measurements of load-induced deformation. Geophys. Res. Lett. 2003, 30. [Google Scholar] [CrossRef]
  12. Bevis, M.; Alsdorf, D.; Kendrick, E.; Fortes, L.P.; Forsberg, B.; Smalley, R.; Becker, J. Seasonal fluctuations in the mass of the Amazon River system and Earth’s elastic response. Geophys. Res. Lett. 2005, 32. [Google Scholar] [CrossRef]
  13. Heki, K. Seasonal modulation of interseismic strain buildup in northeastern Japan driven by snow loads. Science 2001, 293, 89–92. [Google Scholar] [CrossRef] [PubMed]
  14. White, A.M.; Gardner, W.P.; Borsa, A.A.; Argus, D.F.; Martens, H.R. A Review of GNSS/GPS in Hydrogeodesy: Hydrologic Loading Applications and Their Implications for Water Resource Research. Water Resour. Res. 2022, 58, e2022WR032078. [Google Scholar] [CrossRef] [PubMed]
  15. Davis, J.L. Climate-driven deformation of the solid Earth from GRACE and GPS. Geophys. Res. Lett. 2004, 31. [Google Scholar] [CrossRef]
  16. Wahr, J.; Khan, S.A.; van Dam, T.; Liu, L.; van Angelen, J.H.; Broeke, M.R.v.D.; Meertens, C.M. The use of GPS horizontals for loading studies, with applications to northern California and southeast Greenland. J. Geophys. Res. Solid Earth 2013, 118, 1795–1806. [Google Scholar] [CrossRef]
  17. Argus, D.F.; Fu, Y.; Landerer, F.W. Seasonal variation in total water storage in California inferred from GPS observations of vertical land motion. Geophys. Res. Lett. 2014, 41, 1971–1980. [Google Scholar] [CrossRef]
  18. Heki, K. Dense GPS array as a new sensor of seasonal changes of surface loads. Geophys. Monogr. Ser. 2004, 150, 177–196. [Google Scholar] [CrossRef]
  19. Jiang, Z.; Hsu, Y.-J.; Yuan, L.; Huang, D. Monitoring time-varying terrestrial water storage changes using daily GNSS measurements in Yunnan, southwest China. Remote Sens Environ. 2021, 254, 112249. [Google Scholar] [CrossRef]
  20. Jiang, Z.; Hsu, Y.-J.; Yuan, L.; Feng, W.; Yang, X.; Tang, M. GNSS2TWS: An open-source MATLAB2021a-based tool for inferring daily terrestrial water storage changes using GNSS vertical data. GPS Solut. 2022, 26, 114. [Google Scholar] [CrossRef]
  21. Li, J.; Li, X.; Zhong, B. Review of Inverting GNSS Surface Deformations for Regional Terrestrial Water Storage Changes. Geomat. Inf. Sci. Wuhan. Univ. 2023, 48, 1724–1735. [Google Scholar]
  22. Zhong, B.; Li, X.; Chen, J.; Li, Q.; Liu, T. Surface Mass Variations from GPS and GRACE/GFO: A Case Study in Southwest China. Remote Sens. 2020, 12, 1835. [Google Scholar] [CrossRef]
  23. Enzminger, T.L.; Small, E.E.; Borsa, A.A. Accuracy of Snow Water Equivalent Estimated From GPS Vertical Displacements: A Synthetic Loading Case Study for Western U. S. Mountains. Water Resour. Res. 2018, 54, 581–599. [Google Scholar] [CrossRef]
  24. Ji, G.; Lai, Z.; Yan, D.; Wu, L.; Wang, Z. Spatiotemporal patterns of future meteorological drought in the Yellow River Basin based on SPEI under RCP scenarios. Int. J. Clim. Chang. Strateg. Manag. 2021, 14, 39–53. [Google Scholar] [CrossRef]
  25. Si, J.; Li, J.; Lu, S.; Qi, X.; Zhang, X.; Bao, W.; Zhang, X.; Zhou, S.; Jin, C.; Qi, L.; et al. Effects of Climate Change on Surface Runoff and Soil Moisture in the Source Region of the Yellow River. Water 2023, 15, 2104. [Google Scholar] [CrossRef]
  26. Wang, L.; Shu, Z.; Wang, G.; Sun, Z.; Yan, H.; Bao, Z. Analysis of Future Meteorological Drought Changes in the Yellow River Basin under Climate Change. Water 2022, 14, 1896. [Google Scholar] [CrossRef]
  27. Zhao, Z.-K.; Tian, Y.-S.; Weng, X.-X.; Li, H.-W.; Sun, W.-Y. Temporal and spatial variation characteristics of surface water area in the Yellow River Basin from 1986 to 2021. Ying Yong Sheng Tai Xue Bao 2023, 34, 761–769. [Google Scholar] [CrossRef] [PubMed]
  28. Wu, D.; Yan, H.; Yuan, S. L1 regularization for detecting offsets and trend change points in GNSS time series. GPS Solut. 2018, 22, 88. [Google Scholar] [CrossRef]
  29. Wu, D.; Yan, H.; Shen, Y. TSAnalyzer, a GNSS time series analysis software. GPS Solut. 2017, 21, 1389–1394. [Google Scholar] [CrossRef]
  30. Liu, N.; Dai, W.; Santerre, R.; Kuang, C. A MATLAB2021a-based Kriged Kalman Filter software for interpolating missing data in GNSS coordinate time series. GPS Solut. 2018, 22. [Google Scholar] [CrossRef]
  31. Farrell, W.E. Deformation of the Earth by surface loads. Rev. Geophys. 1972, 10, 761–797. [Google Scholar] [CrossRef]
  32. Zhang, D.; Zhang, Q.; Werner, A.D.; Liu, X. GRACE-Based Hydrological Drought Evaluation of the Yangtze River Basin, China. J. Hydrometeorol. 2016, 17, 811–828. [Google Scholar] [CrossRef]
  33. Yin, P.; Mu, D.; Xu, T. Water Storage Variations Recovered from Global Navigation Satellite System Network Using Spatial Constraints: A Case Study of the Contiguous United States. Remote Sens. 2023, 15, 5753. [Google Scholar] [CrossRef]
  34. Tikhonov, A.N. On the Solution of Ill-Posed Problems and the Method of Regularization. Russ. Acad. Sci. 1963, 151, 501–504. [Google Scholar]
  35. Li, C.; Zhong, P.; Jiang, Z.; Tang, M.; Yang, X.; You, X. The influence of different earth models on atmospheric load displacement modeling in Chinese continent. Chin. Geophys. 2023, 66, 973–985. [Google Scholar]
  36. Cohen, J. Statistical Power Analysis for the Behavioral Sciences, 2nd ed.; Lawrence Erlbaum Associates: Hillsdale, NJ, USA, 1988; p. 83. [Google Scholar]
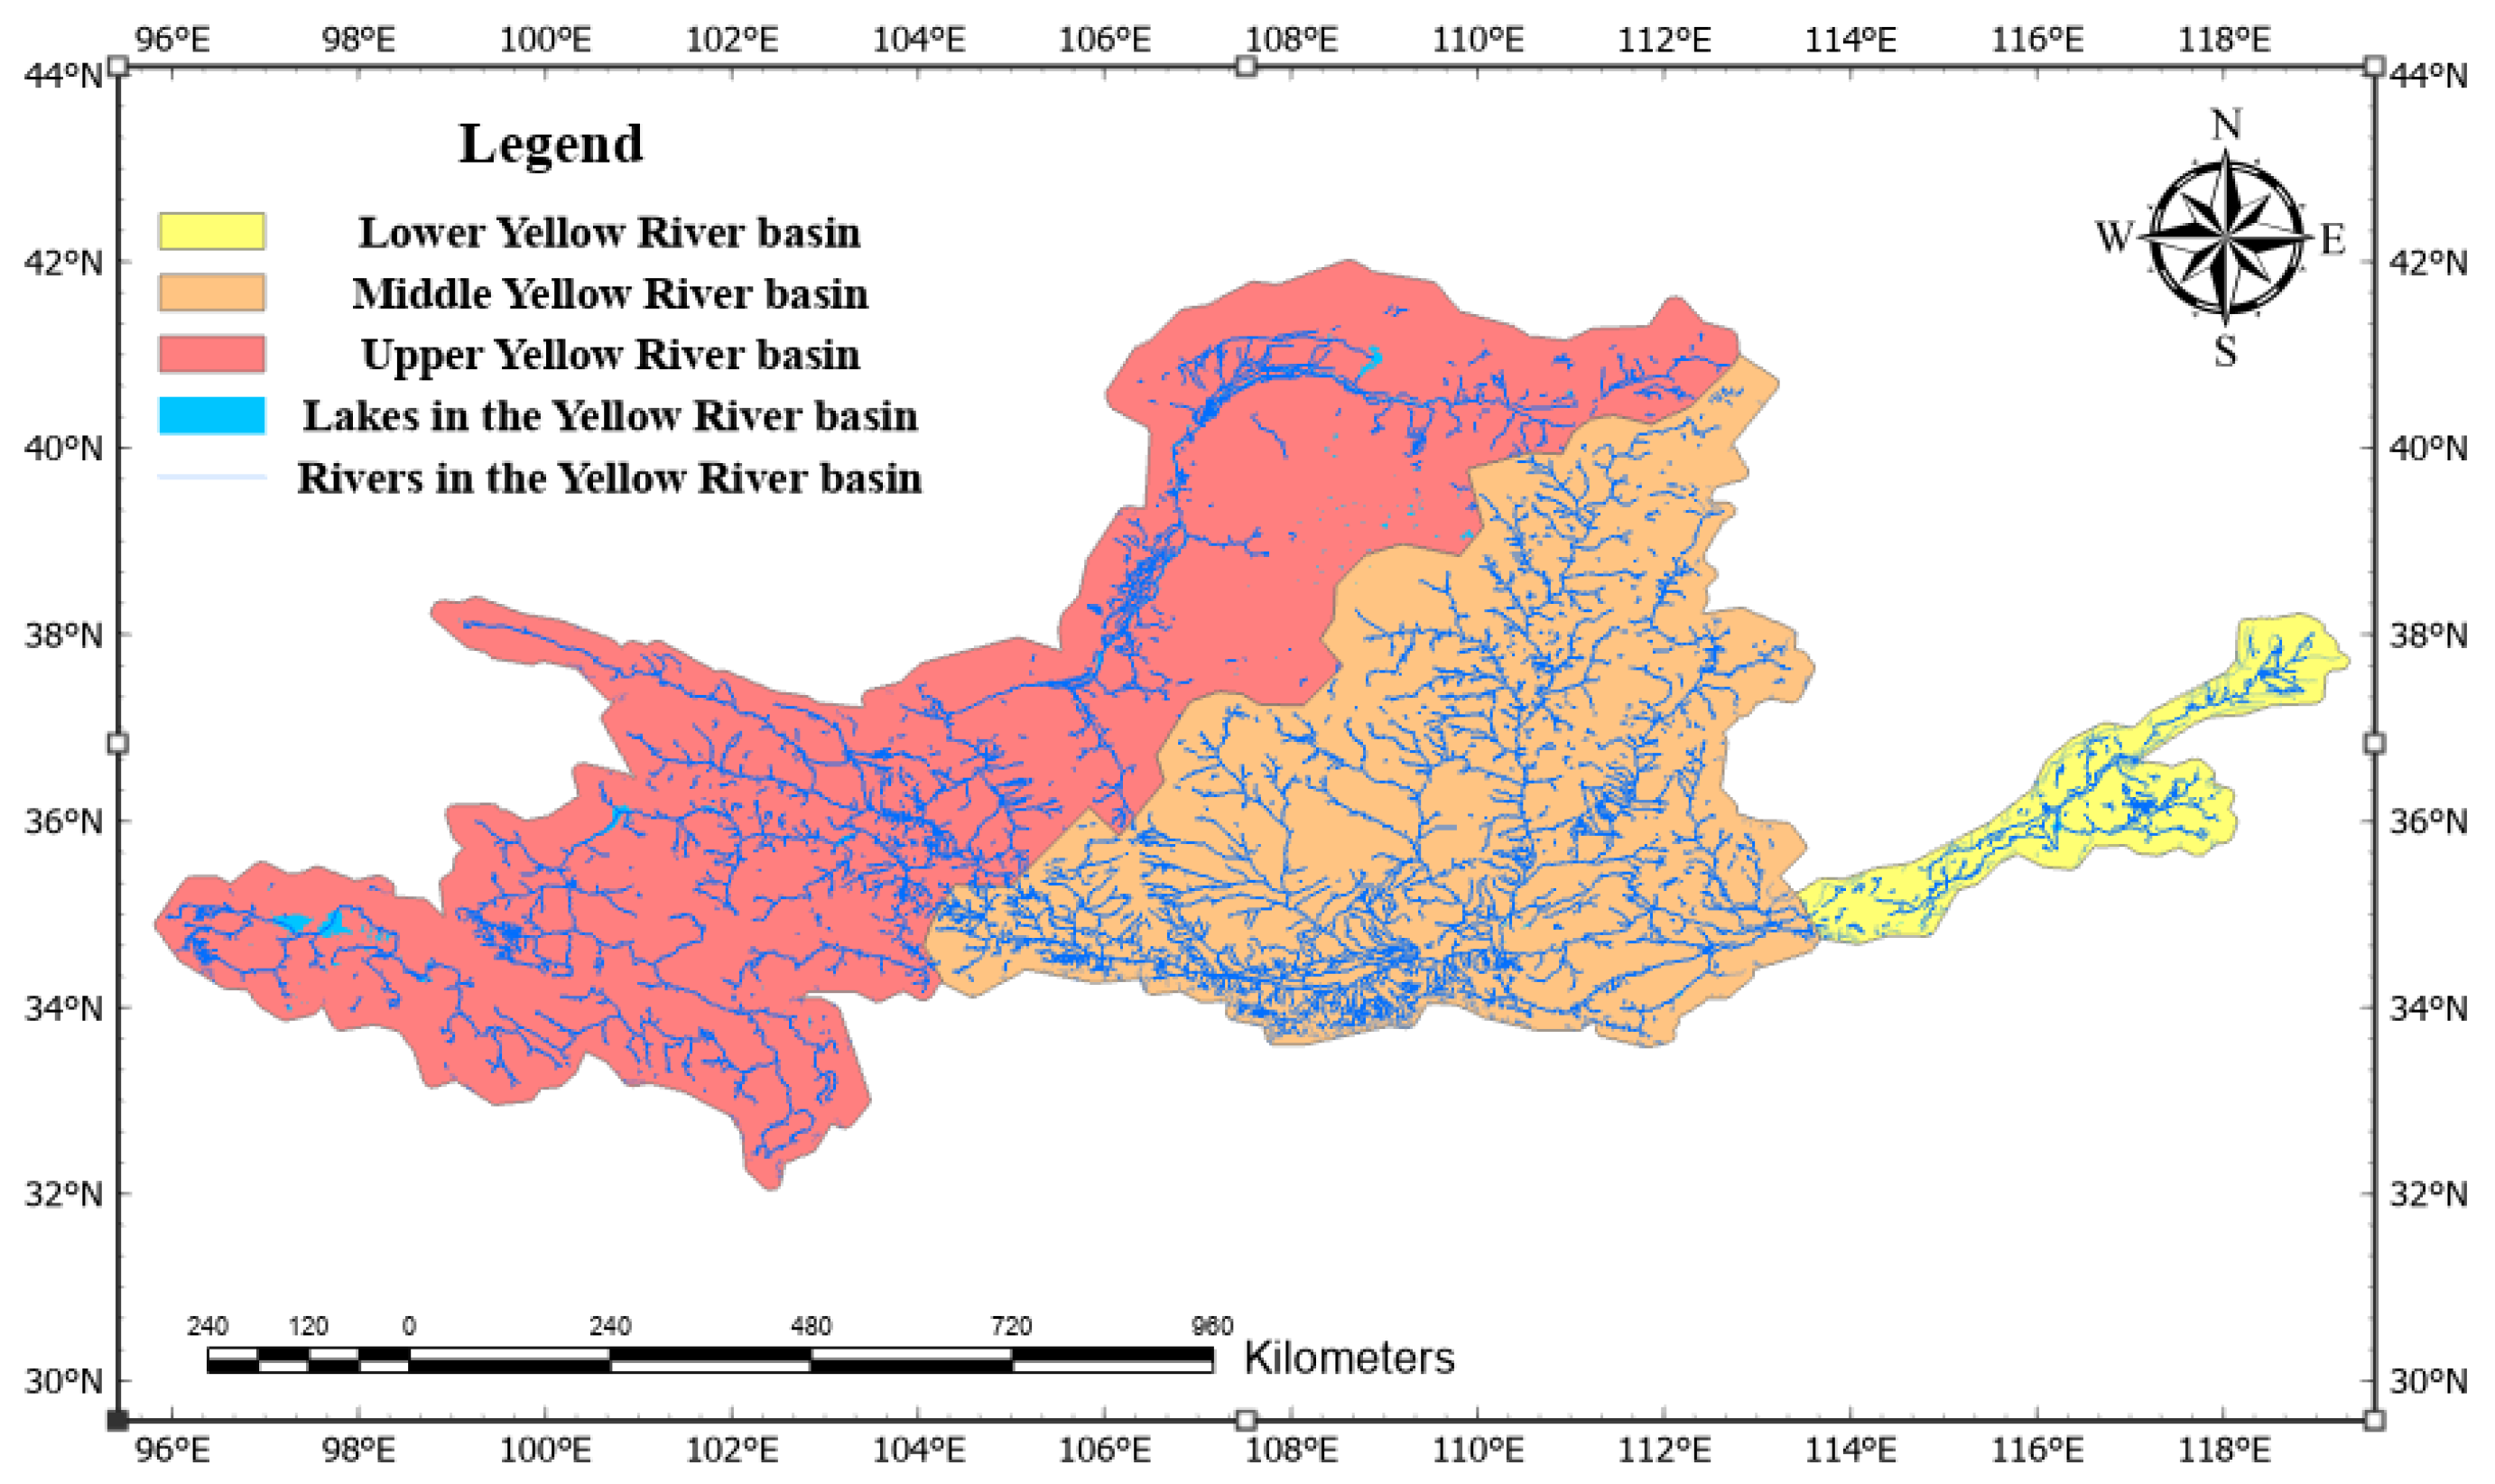
Figure 1. Regional map of the Yellow River Basin.
Water 16 01919 g001
Figure 2. Spatial distribution map of GNSS reference stations.
Water 16 01919 g002
Figure 3. GNSS reference network station distribution Near_dist.
Water 16 01919 g003
Figure 4. Preprocessing of the GNSS reference station vertical displacement data. (a) Origin2021al observed vertical displacement change data. (b) Vertical displacement change data after repairing the offset points. (c) Vertical displacement change data after eliminating the gross errors. (d) Vertical displacement change data after interpolation and supplementation.
Water 16 01919 g004aWater 16 01919 g004b
Figure 5. Schematic diagram of the point load response.
Water 16 01919 g005
Figure 6. Cumulative visualization of grid point load response coefficient.
Water 16 01919 g006
Figure 7. Generalized cross-validation (GCV) selection of smoothing factors.
Water 16 01919 g007
Figure 8. Checkerboard test resolution effect. (a) Checkerboard test with a spatial resolution of 0.25°. (b) Checkerboard test with a spatial resolution of 0.5°.(The green dots represent GNSS continuous stations).
Water 16 01919 g008
Figure 9. Scatter plot of the GNSS_EWH versus the GLDAS_TWS and the correlation between the two data sets.
Water 16 01919 g009
Figure 10. Spatial distribution of the correlation levels between the GNSS_EWH and GLDAS_TWS amplitudes.
Water 16 01919 g010
Figure 11. Mean annual GNSS_EWH amplitude.
Water 16 01919 g011
Figure 12. Mean annual GLDAS_TWS amplitude.
Water 16 01919 g012
Figure 13. Spatial distribution characteristics of the GNSS_EWH rate of change.
Water 16 01919 g013
Figure 14. Spatial distribution characteristics of the GLDAS_TWS rate of change.
Water 16 01919 g014
Figure 15. Fitting of the time series of variations in the water storage.
Water 16 01919 g015
Figure 16. Piecewise fitting of the time series of variations in the water storage.
Water 16 01919 g016
Figure 17. Results of the cross-correlation analysis between the monthly precipitation and the GNSS_EWH.
Water 16 01919 g017
Figure 18. Results of the cross-correlation analysis between the monthly evapotranspiration and the GNSS_EWH.
Water 16 01919 g018
Figure 19. Time series analysis of the changes in the average surface temperature (AvgSurfT) and the changes in the water storage.
Water 16 01919 g019
Figure 20. Results of the cross-correlation analysis between the monthly AvgSurfT and the GNSS_EWH.
Water 16 01919 g020
Table 1. Correlation level classification.
DegreeNo CorrelationWeak CorrelationModerate CorrelationStrong Correlation
PCC0–0.10.1–0.30.3–0.50.5–1
Disclaimer/Publisher’s Note: The statements, opinions and data contained in all publications are solely those of the individual author(s) and contributor(s) and not of MDPI and/or the editor(s). MDPI and/or the editor(s) disclaim responsibility for any injury to people or property resulting from any ideas, methods, instructions or products referred to in the content.