Article

Comprehensive Safety Analysis of Ultimate Bearing Capacity Considering Hydraulic Fracture for Guxian High RCC Gravity Dam

by
Mohamed Ramadan
1,2,*,
Jinsheng Jia
2,
Lei Zhao
2,3,
Xu Li
1 and
Yangfeng Wu
4
1
Key Laboratory of Urban Underground Engineering of Ministry of Education, School of Civil Engineering, Beijing Jiaotong University, Beijing 100044, China
2
State Key Laboratory of Simulation and Regulation of Water Cycle in River Basin, China Institute of Water Resources and Hydropower Research (IWHR), Beijing 100038, China
3
Huadian Electric Power Research Institute Co., Ltd., XiYuan, Road 1-10, Xihu District, Hangzhou 31000, China
4
State Key Laboratory of Hydraulic Engineering Simulation and Safety, Tianjin University, Tianjin 300072, China
*
Author to whom correspondence should be addressed.
Water 2024, 16(13), 1912; https://doi.org/10.3390/w16131912
Submission received: 23 May 2024 / Revised: 19 June 2024 / Accepted: 24 June 2024 / Published: 4 July 2024

Abstract

:
The widespread adoption of high concrete gravity dams in China and globally underscores the necessity for enhancing design processes to address potential risks, notably hydraulic fracture. This study delves into this urgency by scrutinizing common design regulations and investigating the impact of hydraulic fracture on high concrete gravity dams. A comparative analysis of design specifications from China, the USA, and Switzerland, employing the gravity method, elucidates distinctions, focusing on the Guxian dam. In addition, evaluation of standards with higher resistance to hydraulic fracture was conducted using the Finite Element Method (FEM) with XFEM (eXtended Finite Element Method), employing initial cracks with different depths at the dam heel ranging from 0.2 to 2 m. The vulnerability of the Guxian dam’s cross-section to safety risks prompts further inquiry into the dam’s resistance to hydraulic fracture. Therefore, high-pressure water splitting risks to the ultimate bearing capacity were examined through FEM simulation and theoretical calculations. FEM simulations assessed the dam’s ultimate bearing capacity with and without automatic crack propagation combining the XFEM and overloading methods, particularly considering weak layers in the RCC (Roller-Compacted Concrete) dams. Theoretical calculations utilized a fracture mechanical evaluation model. This model derived mechanism formulas to assess the dam’s resistance to hydraulic fracture. Additionally, the investigation explored the effect of the uplift pressure on the ultimate overload coefficient. Findings indicated that the Guxian dam’s current cross-sectional area was insufficiently safe against hydraulic fracture, necessitating an increase to its cross-sectional area to 18,888.1 m2. Notably, the USA’s and Switzerland’s criteria exhibited greater resistance to hydraulic fracture than the Chinese criteria, especially without considering uplift pressure. Also, the Chinese regulations tended to calculate a lower dam cross-sectional area compared with the other regulations. Numerical calculations revealed a substantial decrease in overall dam safety (up to 48%) when considering automatic crack propagation and the dam’s weak layers. The fracture mechanical evaluation model showed that the Guxian dam had the lowest resistance, with an overloading coefficient of 1.05 considering the uplift pressure. In the case of not considering the uplift pressure, the dam resistance to hydraulic fracture increased and the overloading coefficient rose to 1.27. The results highlighted the risk of hydraulic fracture in concrete dams. Hence, it is recommended that design specifications of high concrete gravity dams incorporate safety analyses of hydraulic fracture in the design process. Reducing uplift pressure plays a crucial role in enhancing the dam’s resistance to hydraulic fractures, emphasizing the need for this consideration in safety evaluations. The differences between the three design specifications were particularly pronounced for dams higher than 200 m. In contrast, dams of 50 m yielded similar results across these regulations.

1. Introduction

China has recently seen rapid development in hydropower projects. One of the ongoing construction projects in China is the Guxian high concrete RCC (Roller-Compacted Concrete) dam, with a total height of 215 m. The Guxian Water Conservancy Project is in the middle reaches of the Yellow River from Qikou to Yumenkou, the northern mainstream, approximately 10 km upstream of Hukou Waterfall and 238 km from the Qikou dam site. RCC (Roller-Compacted Concrete) dams were developed to quickly deploy concrete structures with the ability to withstand multiple loads at a reasonable cost and in less time. RCC dams are often built with thin horizontal lifts, allowing quick construction layer over layer, leading to one of the disadvantages of RCC dams being the weakness between the layers. Those weak interfaces later cause significant damage, allowing cracks to spread and increasing the potential risk of hydraulic fracture occurrence.
Upon recognizing these vulnerabilities, it becomes essential to address the broader context of hydraulic structures engineering, where the ultimate bearing capacity of these imposing structures plays a crucial role in ensuring their stability and long-term performance. This concern is heightened by the identified weaknesses in RCC (Roller-Compacted Concrete) dams, as previously mentioned, and the possible threat due to hydraulic fracture. To ensure safe and resilient water structures, the design and construction procedures of gravity dams are controlled and managed according to the specifications of each region or country. The design and construction procedures of gravity dams follow the specifications of each region or country to ensure safe and resilient water structures against all kinds of loading conditions. The regulations for the design of world gravity dams are different from country to country, such as China (Chinese SL 319) [1]. In Europe, for instance, Switzerland has the Swiss Federal Office of Energy (SFOE) [2] for the design, construction, and operation of gravity dams. The United States has the United States Bureau of Reclamation (USBR) [3], the Federal Energy Regulatory Commission Criteria (FERC) [4], and the US Army Corps of Engineers (USACE) [5]. In Australia, the Australian National Committee on Large Dams (Ancold) [6] has established guidelines to improve the ability of dam organizations to ensure that adequate safety programs and practices are in place to achieve the optimal path for the dam design process. Many researchers have investigated the differences between the varieties of these regulations to compare the methods of gravity dam designs. The purpose of investigating the differences between these regulations is to identify and understand the varying methodologies and safety standards employed in the design of gravity dams across different countries. By comparing these regulations, researchers aim to evaluate the effectiveness of each approach in ensuring the structural stability and resilience of dams. This comparative analysis helps in highlighting the strengths and weaknesses of different design standards, which can inform improvements and harmonization of global dam safety practices to enhance overall safety and performance. Some cases of such comparative research are illustrated as follows: A comparison between the limitations of USACE (US Army Corps of Engineers) and USBR (US Bureau of Reclamation) was presented by [7] to investigate the structural safety of a gravity dam and compare the stability results using those two regulations. Another study was carried out by [8], where a comparison was made between the standards of Germany/Austria (DIN), USACE, and China (the Standards Compilation of Waterpower in China) by comparing safety factors. The findings were as follows: the standards of Germany and USACE were very similar compared to the Standards Compilation of Waterpower in China because both of them use a global safety concept, while the Chinese standard uses a semi-probabilistic safety concept that is similar to the one in the Euro code of the European Union. Wang and Jia [9] investigated the differences between the three regulations of China, the United States, and Switzerland on the design of the high gravity dam cross-section using FEM to review the cross-sectional safety of gravity dams according to these criteria and the resistance to hydraulic fracture. The current study focused on illustrating the differences between the results of the dam cross-section design according to these regulations. It aims to show the influence of each regulation theory on the total dam cross-sectional area and its resistance to hydraulic fracture. The previously mentioned regulations have largely neglected the influence of hydraulic fracture in their safety analyses. Therefore, this study aims to address this gap by thoroughly investigating the risks posed by hydraulic fractures to concrete gravity dams. Through detailed comparative analysis and advanced modeling techniques, this research seeks to highlight the potential vulnerabilities that existing design standards may overlook and to demonstrate the critical importance of incorporating hydraulic fracture considerations into the safety evaluations of these massive structures.
Hydraulic fracturing is a physical phenomenon in which the crack in the concrete is induced or expanded by the water pressure of the reservoir due to the increase in the elevation of the water level at the upper surface. Cracks that form on the upstream surface of the dam due to temperature stress and the construction of cold joints, especially at the rolling construction levels, might allow the formation of hydraulic fracturing and increase its possibility of occurrence. Cracks in the heel of the dam due to hydraulic fracture can occur due to a variety of factors, such as temperature fluctuations, changes in water pressure, and the quality of construction materials. The critical water level of the upstream water is particularly important as it can accelerate the expansion and propagation of cracks. When the water level rises above a certain critical threshold, it exerts additional pressure on the dam’s heel. This increased hydrostatic pressure causes cracks to expand, spread, or even create new cracks. As cracks spread, the structural integrity of the dam can be compromised, leading to potential failure or leakage. Understanding the critical water level is crucial to the safe design, maintenance, and operation of concrete gravity dams.
The main indicator of safety for a gravity dam is calculating its ultimate bearing capacity to ensure the capability of the dam cross-section to withstand all the possible loading scenarios. The ultimate bearing capacity of concrete gravity dams is a vital issue that must be discussed and evaluated for the safety concern of the gravity dam in the event of hydraulic fracture. One of the most widely used methods for evaluating the ultimate bearing capacity is the overload method. The overload method generally uses the theory of constant material properties of the dam. For normal load combinations, external loads increase until the dam fails by increasing the upstream water level or increasing the density of the upstream reservoir water. Overloading calculations are used for the safety assessment of the RCC (Roller-Compacted Concrete) dams and the evaluation of their stability by some researchers, such as [10], who investigated the Kala RCC dam using overloading. RCC dams are known to contain weak intermediate layers due to their construction method; these layers allow the possibility of high-pressure water splitting for dams with a height greater than 200 m [9]. In concrete gravity dams greater than 200 m, cracks in the upstream surface can bear water pressure up to 2 MPa [11]. The water pressure in dam cracks increases sharply under special conditions, such as excessive floods and earthquakes, but the tensile strength of large concrete dams is less than 4 MPa [12] and may be much lower than this for RCC dams, which is not enough to resist the splitting force of high water pressure. The Chinese code and other international standards did not consider the risk assessment of hydraulic fracturing in the dam body, only the Chinese regulation recommended special investigations for dams greater than 200 m. The risk of hydraulic fracture might cause significant damage to concrete dams. Several cases of concrete dams damaged due to hydraulic fracture have been recorded. The Kölnbrein arch dam in Austria, with a height of 200 m, during its third storage period in 1978 was exposed to a sudden leak due to the expansion of the initial cracks at the dam heel. Hydraulic fracture and an increase in uplift pressure were responsible for crack expansion [13,14]. The Zilancolente arch dam, with a height of 182 m and to avoid the occurrence of hydraulic fracturing, a bottom joint was installed at the foundation of the upstream surface [15,16]. However, after impoundment, the cracks caused by hydraulic fracturing took place in the upper part of the bottom joints. To overcome this situation, the reservoir was dried completely and then the water pressure in the joints was reduced to half of the water pressure in front of the dam to achieve safe operation. In China, the Zhexi concrete buttress dam with a height of 104 m suffered cracks in the upper stream face due to high water pressure [17,18,19]. Some other accidents have been caused by the concrete cracking in flood discharge tunnels, for instance, the Dongfeng Arch Dam [20], and by improper temperature control that forms penetrating cracks after impoundment, such as the massive head dam of Tuoxi [21]. In the United States, the Dworshak gravity dam, with a total height of 219 m, suffered from leakage and cracks due to hydraulic fracture. The Dworshak dam has shown cracks, which occurred when the dam reached the designed maximum water level in its seventh year of operation, resulting in the cracks propagating and spreading [22]. This recorded damage to concrete dams due to hydraulic fracture made it vital to investigate and predict the behavior of such phenomena to mitigate its hazard. A variety of researchers have investigated the hydraulic fracture behavior and its influence on concrete structures. Brühwiler and Saouma [23] were considered the first to discuss the concrete fracture behavior through different water pressures using the mechanical wedge-splitting device for simulation of the real water environment [24]. Another investigation was conducted experimentally on a cylinder specimen to monitor the stress of ultra-high concrete gravity dams. It showed the clear effect of hydraulic fracture on concrete dams and illustrated that dams higher than 200 m were highly affected by the risk of hydraulic fracture [9]. Some other researchers have built numerical models based on experimental test data, such as [25,26,27]. While most of the numerical models presented by different researchers are based on the eXtended Finite Element Model (XFEM), XFEM has been used to analyze the effect of initial crack location on seismic response and crack propagation for concrete gravity dams [28,29,30]. Automatic crack propagation behavior has been given little attention, while most researchers have focused on initial crack simulations. A hybrid model was presented by combining the XFEM and the Finite Volume Method (FVM) to study the effect of hydraulic fracture, including quasi-static and dynamic conditions [31]. Wang and Jia [9] created a 3D model with an initial horizontal crack at the dam heel to investigate the influence of the design specification on the resistance to hydraulic fracture by studying the relation between the critical water pressure (reservoir head) and the crack depth. Gan et al. [32] investigated the relationship between the critical water level and the crack depth numerically with and without considering the water pressure inside the crack, showing that the smaller the crack depth, the higher the critical upstream water level. The higher the fracture load of the crack, the greater the effect of the initial crack depth on the maximum load bearing of the dam. Other studies have focused on studying fracture behavior mathematically. The widely used technique for such theoretical studies is the fracture mechanical evaluation model. Fracture mechanical evaluation models are essential tools in the field of structural engineering, particularly when assessing the integrity and durability of concrete structures such as dams. These models are designed to analyze and predict the behavior of cracks within a structure under various loading conditions. One of the critical aspects of these models is their ability to calculate the depth and propagation of cracks using mathematical equations based on principles of fracture mechanics. At the core of the fracture mechanical evaluation model is the concept of Stress Intensity Factors (SIFs), which describe the stress state near the tip of a crack. The SIF is a crucial parameter that helps predict the growth of cracks under different loading scenarios. When the SIF reaches a critical value, known as the fracture toughness of the material, crack propagation occurs. This critical value is unique to each material and determines its resistance to crack growth. The basic theory for investigating mechanical fracture mathematically has been presented by many researchers, such as [33,34], elaborating the crack propagation and the fatigue crack growth and establishing the main fundamentals of fracture mechanics.
The main objectives and goals of this research are as follows: To conduct a comparative analysis among three different regulations aimed at elucidating the primary disparities in their design theories and their resistance to hydraulic fracture, with a specific focus on the Guxian dam. Additionally, to demonstrate the potential risks to the ultimate bearing capacity of concrete gravity dams during crack propagation, while considering the presence of weak layers in RCC dams. Furthermore, to utilize both Finite Element Method (FEM) using ABAQUS software V.6.14 and mathematical models based on the hydraulic fracture evaluation model to investigate the capacity of concrete gravity dams.

2. Methodology

The sequence of this research is as outlined below: (1) A comparative analysis between the Guxian dam and four other dams in operation using three design criteria to highlight the differences between these three regulation design theories. (2) Numerical modeling using FEM that combines the XFEM and the overloading method to study the influence of hydraulic fracture on concrete dams by calculating the safety factor with and without hydraulic fracture considering the weak layers of the RCC dam. (3) Comparing the cross-sectional area in accordance with the three regulations of resistance to hydraulic fracture. (4) Establishing a mathematical model to investigate dam safety against hydraulic fracture using the fracture mechanical evaluation model.

2.1. Comparative Analysis Using the Three Design Criteria

The criteria of Chinese (SL319), USACE (US Army of Corps Engineers), and Swiss Federal Office of Energy (SFOE) standards were applied to the cross-section of the Guxian dam for a comparative analysis between these three regulations. Four operated dams were included in the comparison as follows: Huangdeng and Longtan RCC (Roller-Compacted Concrete) dams in China, the Dworshak conventional concrete gravity dam in the USA, and the Grande Dixence conventional concrete gravity dam in Switzerland. The purpose of this investigation was to illustrate the main differences between these regulations. In addition to evaluating the safety of the Guxian dam cross-section under requirements of the international regulations (stress and stability criteria), analysis was performed according to the mechanical method (gravity method) for the calculations of loads and stresses at the normal case of loading (normal load combination). The applied loads considered for the analysis were the primary loads (upstream and downstream water pressure, dam self-weight, silt load, and uplift pressure). The essential structural equilibrium and basic stability requirements for the Guxian dam cross-section and the other gravity dam were as follows: (1) safe against overturning; (2) safe against sliding; (3) the allowable stresses shall not be exceeded. The governed equations of dam structural stability are listed as follows.
V = H = 0  
M = 0
where V is the vertical forces, H is the horizontal forces, and M is the moment of the exerted force at a certain point.

2.2. The Ultimate Bearing Capacity Investigation

2.2.1. Numerical Modeling

The analysis of the ultimate bearing capacity of the RCC (Roller-Compacted Concrete) dam using FEM was carried out based on the calculation of the safety coefficient considering the risk of hydraulic fracture and the occurrence of crack propagation. Given that the most likely potential failure mode was unusual external environmental loads during operation, the overload method was used in studying the ultimate bearing capacity of the dam with and without crack propagation considering the weak layers of the RCC dam. The overloading coefficient was evaluated to obtain the Guxian dam safety factor and compare it with the four dams mentioned previously. Simulation of weak layers in RCC dams gave more realistic and accepted values of safety factors. Automatic crack propagation was simulated using ABAQUS software through the XFEM (eXtended Finite Element Method) to represent the effect of high-pressure water splitting. In a second simulation to complete the comparative analysis between the three regulations, the resistance of different cross-sectional areas to hydraulic fracture according to the three regulations was investigated based on initiating a horizontal crack at the dam heel with different depths. The XFEM method that was used in the analysis was the traction separation law based on the cohesive model of damage mechanics. The damage evolution was developed based on the definition of the displacement at failure. The XFEM expands the classical finite element method by enriching the finite element approximation space with additional functions that capture the singularities associated with cracks. This approach treats concrete as a continuous medium characterized by a traction–separation relationship. Based on the partition of unity method, the XFEM displacement formula can be derived by introducing an additional function that reflects the local characteristic of the crack based on the conventional FEM displacement mode. The displacement formula can be expressed as [35,36].
u = i = s N I ( x ) u I + H x α I + i = 1 4 ψ i ( x ) b I i
where ui is the nodal displacement vector, αI is the nodal enriched degree-of-freedom vector for crack propagation, H(x) is the jump function that represents the gap between the crack surfaces, b I i is the nodal enriched degree of freedom vector for crack tip elements, and ψ i (x) is the crack tip functions, which represent singularity of the crack tip. The jump function H(x) for a general crack is defined as.
H x = sign ( ψ ( x ) ) = 1 ,   ψ ( x ) > 0 1 ,   ψ x < 0
The crack tip enrichment function for an isotropic elastic material is:
ψ i x = r sin α 2 , r cos α 2 , r sin α 2 sin α , r cos α 2 sin α  
where (r, α) are the polar coordinates system located at the crack tip, r is the distance from the calculated point (any random point) to the crack tip, and α is the angle between the X-axis to the same calculated point, see Figure 1. The functions of the coordinates determine how the stresses vary with distance from the right-hand crack tip and with angular displacement from the x-axis.

2.2.2. Mathematical Modeling [Fracture Mechanics Modeling]

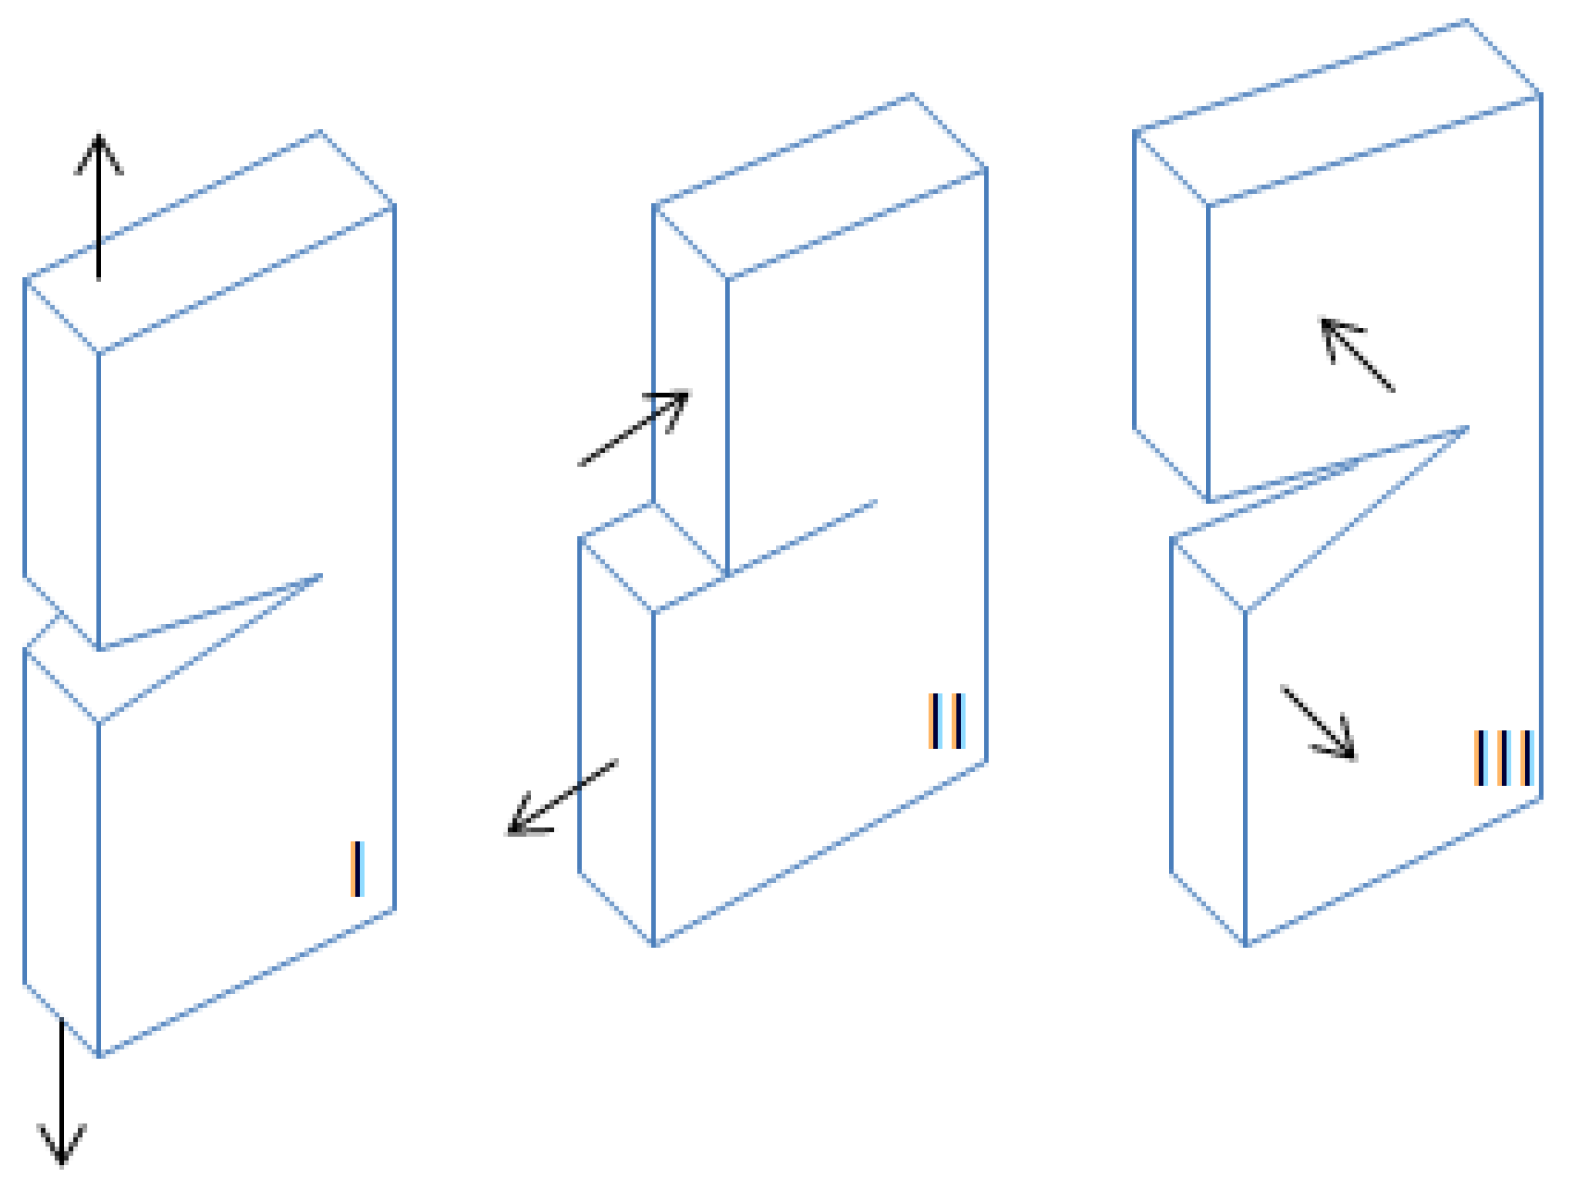
The mathematical fracture evaluation model was used to comprehensively study the resistance of the concrete gravity dam cross-section to hydraulic fracture by evaluating parameters such as crack depth and the ultimate overloading coefficient. The ultimate overload coefficient was evaluated to express the dam resistance and obtain the crack depth using the theory of fracture mechanics splitting criterion. A strength-based criterion was considered, in which it was assumed that the crack would expand if the maximum tensile stress at the crack tip exceeded the permissible tensile strength of the dam material concrete [33]. There are three basic modes of stressing that can be classified as follows: (I) opening mode; (II) in-plan shear mode; (III) out-of-plan tearing mode, as shown in Figure 2. The parameter that describes the magnitude of the stress at the tip of the crack is called the stress intensity factor (K). Stress intensity factors are determined by limit value formulas based on the stresses or displacements at the crack faces close to the crack tip, mostly by extrapolation to the crack tip. The stress intensity factor (K) is used to predict the stress state (“stress intensity”) near the tip of a crack caused by a remote load or residual stresses. The stress field near the crack edge can be presented in the following formulas (Equations (6)–(8)) that represent the principal stresses for crack mode I (open type), which was considered in the current analysis. The mathematical model was used to theoretically investigate the safety of the Guxian dam and to compare the results with those of the other two dams (Dworshak and Grande Dixence). The splitting criterion of the fracture evaluation model is presented, studying the hydraulic fracturing resistance of the dam body with and without consideration of uplift pressure.
σ x I = K I 2 π r   cos α 2 1 sin α 2 sin 3 α 2
σ y I = K I 2 π r   cos α 2 1 + sin α 2 sin 3 α 2
σ x y I = K I 2 π r   cos α 2 sin α 2 cos 3 α 2

3. Analysis Procedures

3.1. Comparative Study of Different Design Criteria

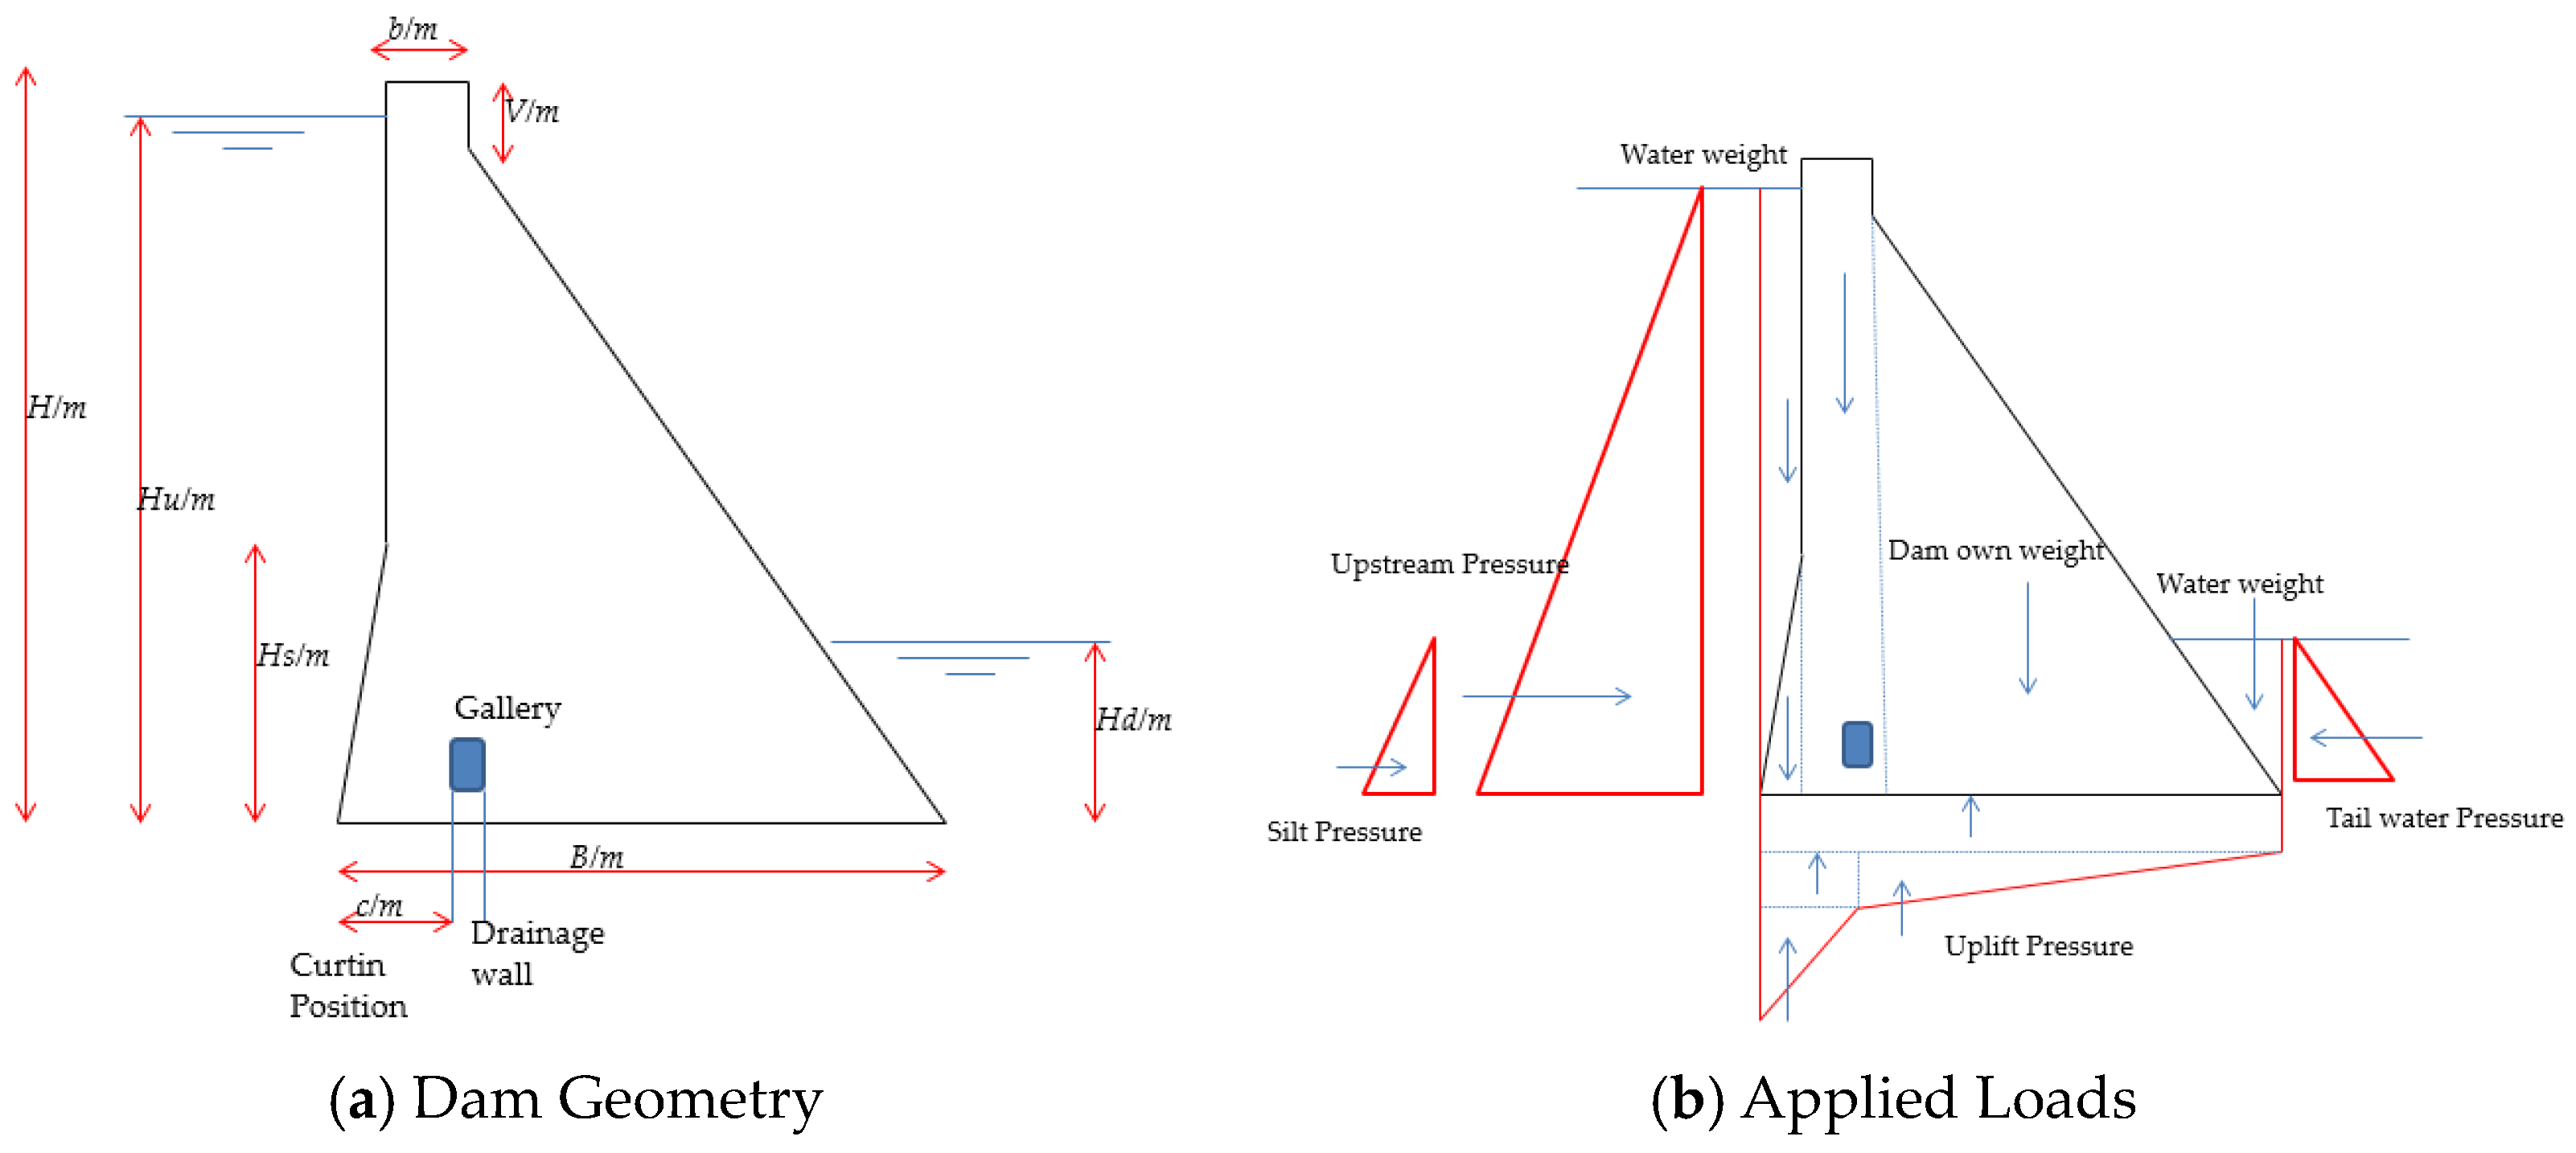
A comparative analysis between the three standards has been carried out to illustrate the main differences in the design concepts. The comparative analysis between the design regulations is according to the following criteria: The Chinese regulation specifies that the vertical stress at the upper stream σy is not allowed to be tensile, and, for the calculation of σy, the uplift pressure is included. The USA criteria state that σy must be greater than the water pressure after deficiency of the concrete strength and neglecting the uplift pressure. In Switzerland, a criterion is established for σy as compressive vertical stress that should be greater than 85% of the water pressure at all levels without considering the uplift pressure [9]. The stress and stability criteria from the US and Switzerland were used to verify the geometry of the Guxian dam cross-section at the usual case of loading. Longtan and Huangdeng dams were investigated according to USACE (US Army Corps of Engineers) and SFOE (Swiss Federal Office of Energy) criteria, Dworshak dam was reanalyzed using Chinese and SFOE criteria, and Grande Dixence dam was recalculated according to Chinese and USACE criteria. The original geometry data for the five dams are listed in Table 1. The typical gravity dam schematic cross-section and the applied load distribution used in the calculations are shown in Figure 3. The geometry of the four operated dams (Huangdeng, Longtan, Grande Dixence, and Dworshak) is given according to [37,38,39,40], respectively.
This comparison highlights the main differences between design criteria theories and their design concepts, such as the usage of compressive or tensile strength criteria or including the uplift pressure. The three main limits of each criterion to be applied to the five dams are as follows: overturning, sliding, and stress criteria. Limitations of stress and stability criteria are presented in detail in Table 2.

3.2. Assessing the Design Regulations’ Resistance to Hydraulic Fracture

For the completion of the comparative analysis between the three design regulations, the effect of hydraulic fracture influence was considered to evaluate which regulation criteria have higher resistance to hydraulic fracture. The three regulations’ resistance to hydraulic fracture were discussed using the original and updated areas of the Guxian dam cross-section. The simulation was applied through XFEM, with an initial crack at the dam heel at a height of 1 m measured from the elevation of the foundation surface. The assumed initial cracks were at different depths [0.20–0.50–1.00–1.50–2.00] m. The main concept of this investigation was to study the response of the dam cross-section designed according to Chinese criteria and its resistance to hydraulic fracture and compare it with the updated cross-section designed according to USACE and Swiss codes. For the Guxian dam geometry, see Table 1; for the updated geometry, see the results of Section 5.1. The model description and the material properties are given in Table 3.

3.3. Evaluation of the Ultimate Bearing Capacity

3.3.1. Numerical Modeling (FEM Model)

The safety review of the ultimate bearing capacity of the Guxian dam and the influence of hydraulic fracture was carried out using FEM. The material properties and the chosen models for the calculations of the numerical model were adapted and modified after [37,38,39,40] for each dam. The material properties of the investigated dams are listed in Table 3.
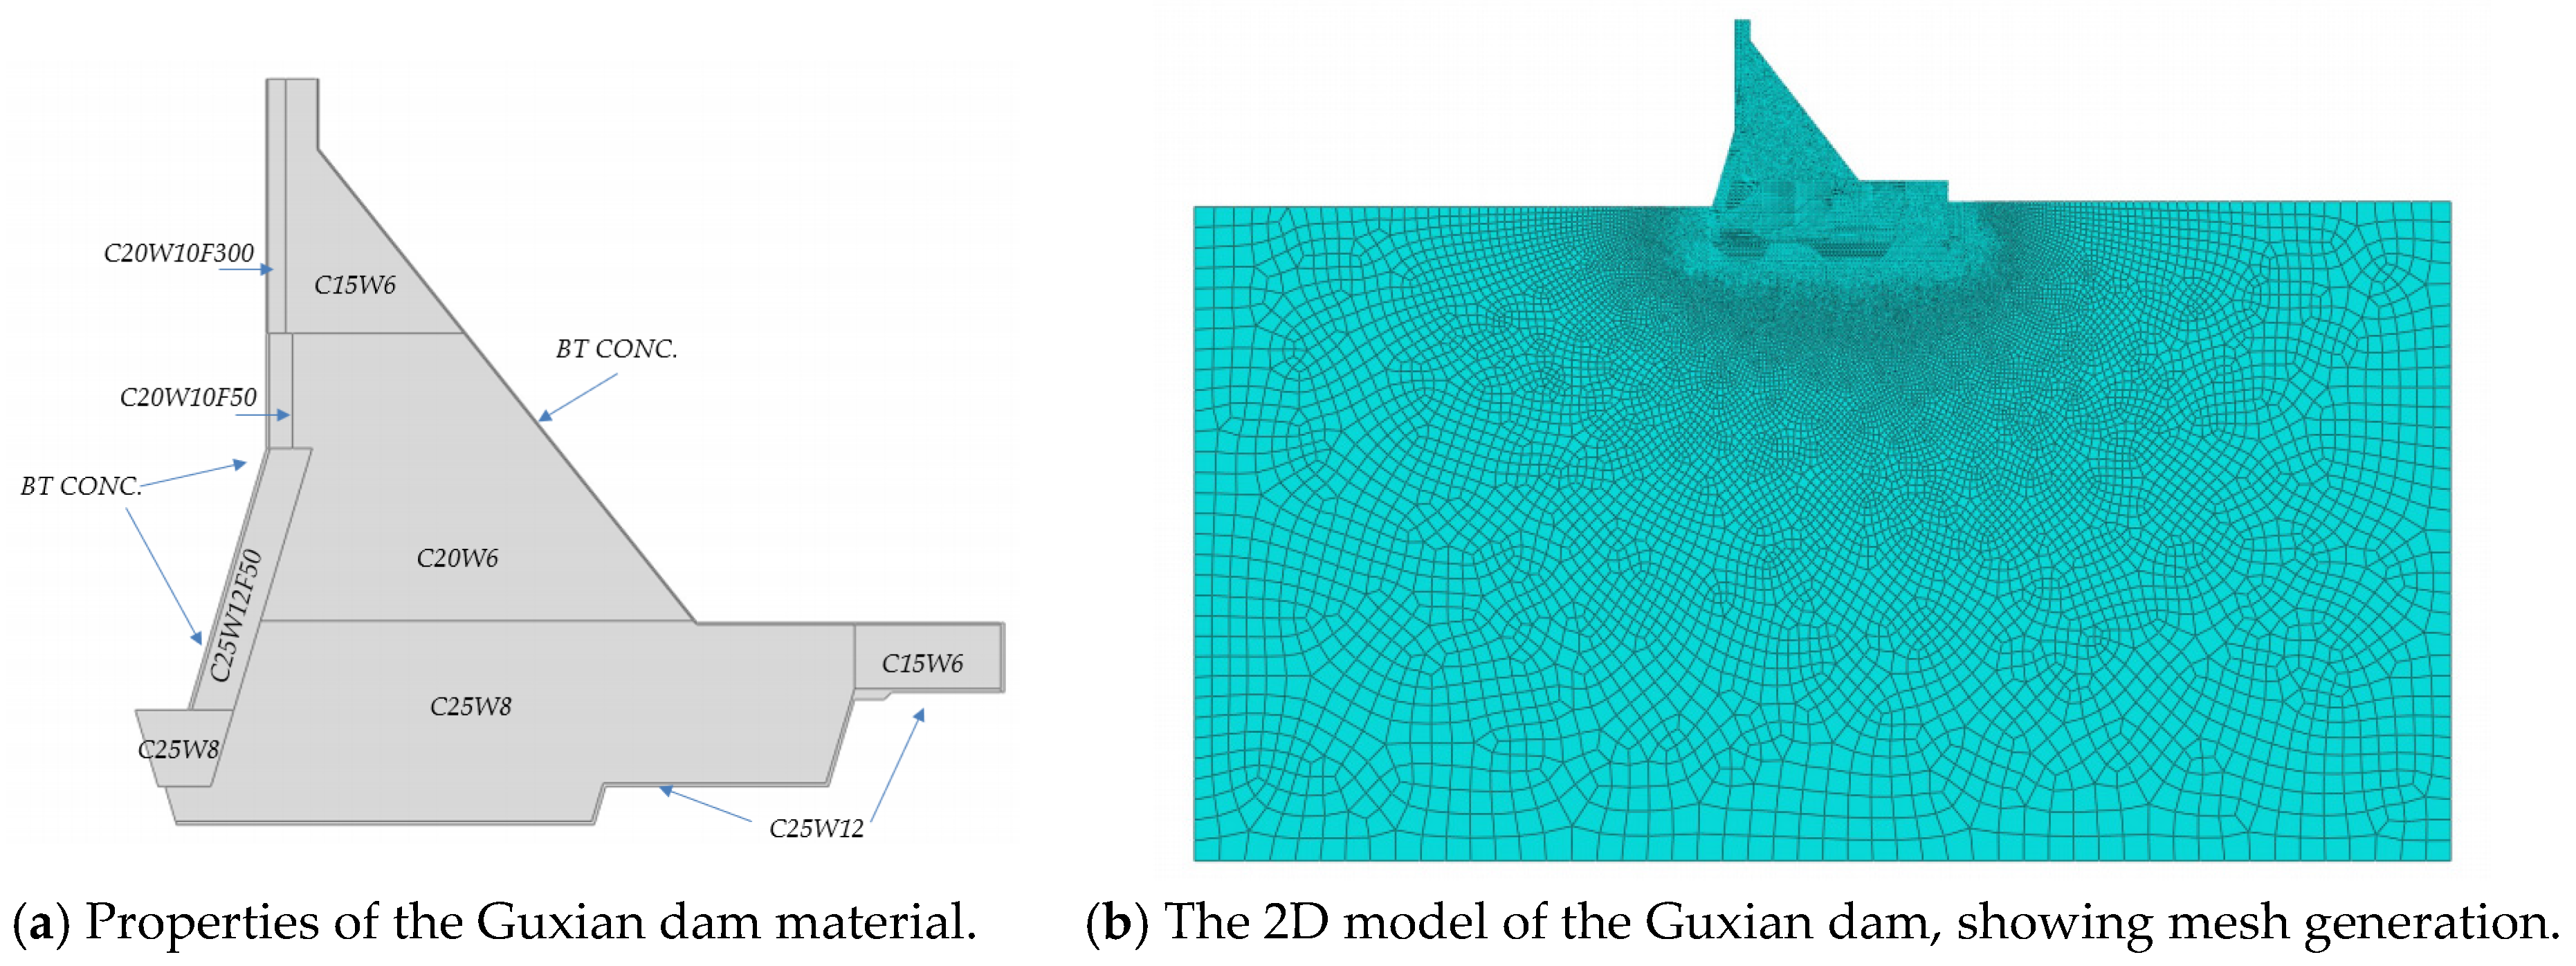
The allocation of the material properties along the dam body for the Guxian dam is shown in Figure 4a. The 2D model of the Guxian dam is shown in Figure 4b, created by ABAQUS software. Level constraints were established on the upstream and downstream boundaries of the foundation, while the fixed constraint was set on the bottom boundary of the foundation. The boundary of the dam body was set as a free boundary.
A Finite Element Method (FEM) model is developed by integrating the eXtended Finite Element Method (XFEM) and the overloading method to simulate crack propagation considering the weak layers of Roller-Compacted Concrete (RCC) dams. The XFEM is utilized to model the crack growth process in the material, while the overloading method is employed to simulate the increase in loading conditions. In general, the layers in RCC dams can range from a few centimeters to several meters in thickness. The weak interface between the layers of the RCC dam in the current model was taken every three meters [41] to simplify the analysis process and avoid the complex of the FEM model. The overload method is to gradually increase the loads to cause structural instability under the condition that the mechanical parameters of the materials are constant, and the water pressure load applied on the upstream face is gradually increased. The riverward displacement of the dam crest (in meters) is used to characterize the instability of the dam body. The displacement values obtained from these analyses are expressed in meters, with a positive sign conventionally indicating displacement in the direction from upstream to downstream. The overload coefficient is increased by 0.1 each time until the sudden change is recorded. The influence of hydraulic fracture on the value of the safety factor is presented through automatic crack propagation. Automatic crack propagation is induced by setting the interaction for the whole dam to make the software automatically predict the location of the crack propagation to define the area of stress concentration and illustrate the high-pressure water splitting behavior.

3.3.2. Hydraulic Fracture Evaluation Model (Mathematical Model)

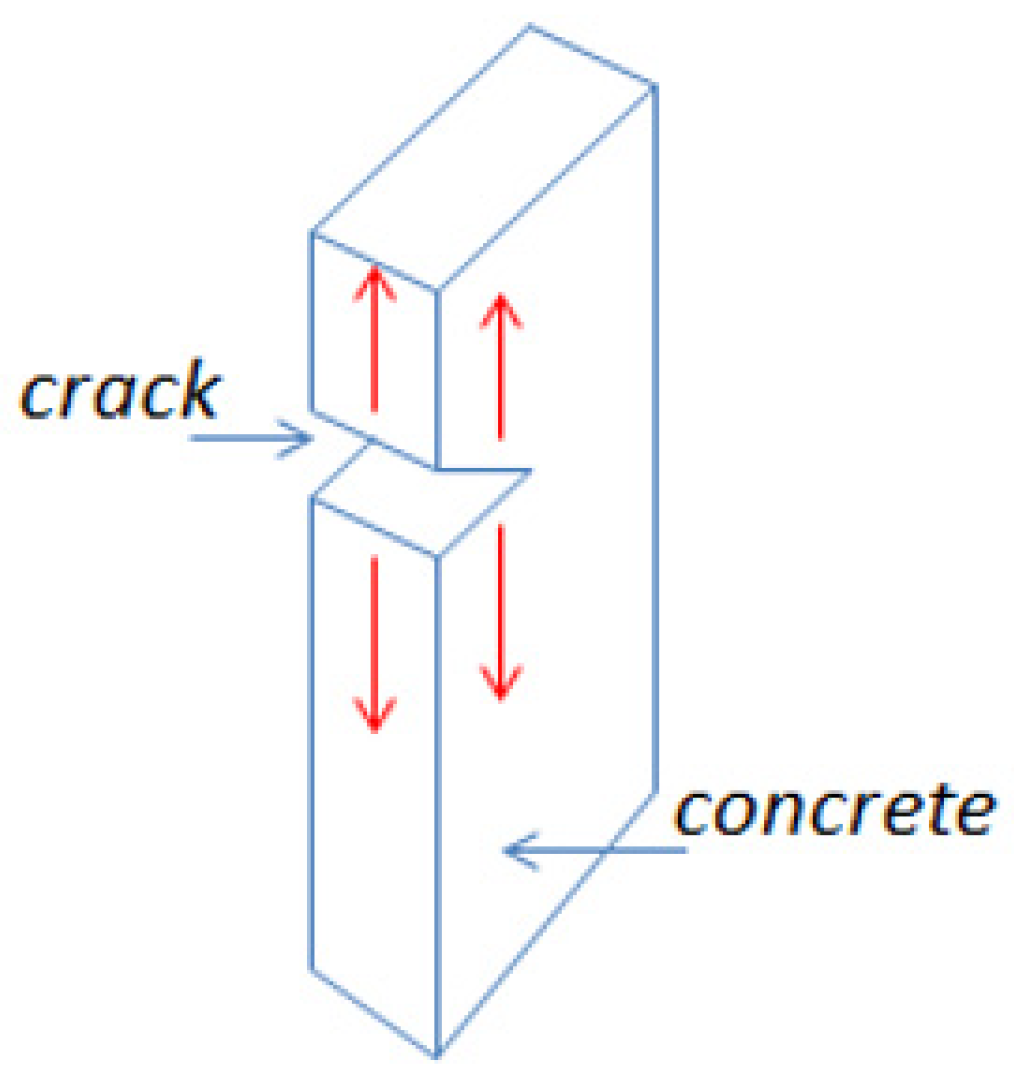
To illustrate the possible high risk of hydraulic fracture, a mathematical model was carried out. A mathematical model was created for the evaluation of crack length based on the stress intensity approach. There are three basic modes of stressing, the most common mode in practice, mode I, as shown in Figure 5, corresponds to the usual separation of the fracture faces under the action of tensile stresses and was emphasized through this part of the investigation.
In general, the stress intensity factor depends on the applied stress, crack size, and crack geometry, as given in Equation (9) [42].
K = Y   σ   π a
where Y is called the geometry factor, signifying the geometry of a crack system in relation to the applied loads; the geometry of the cracked body imposes an effect on the new stress field of the crack tip, thus modifying the value of the stress intensity factor. In general, if the edge crack is situated in a strip of finite width, w, then the geometry factor becomes a function of (a/w) and can be presented as follows.
Y = f ( a w )
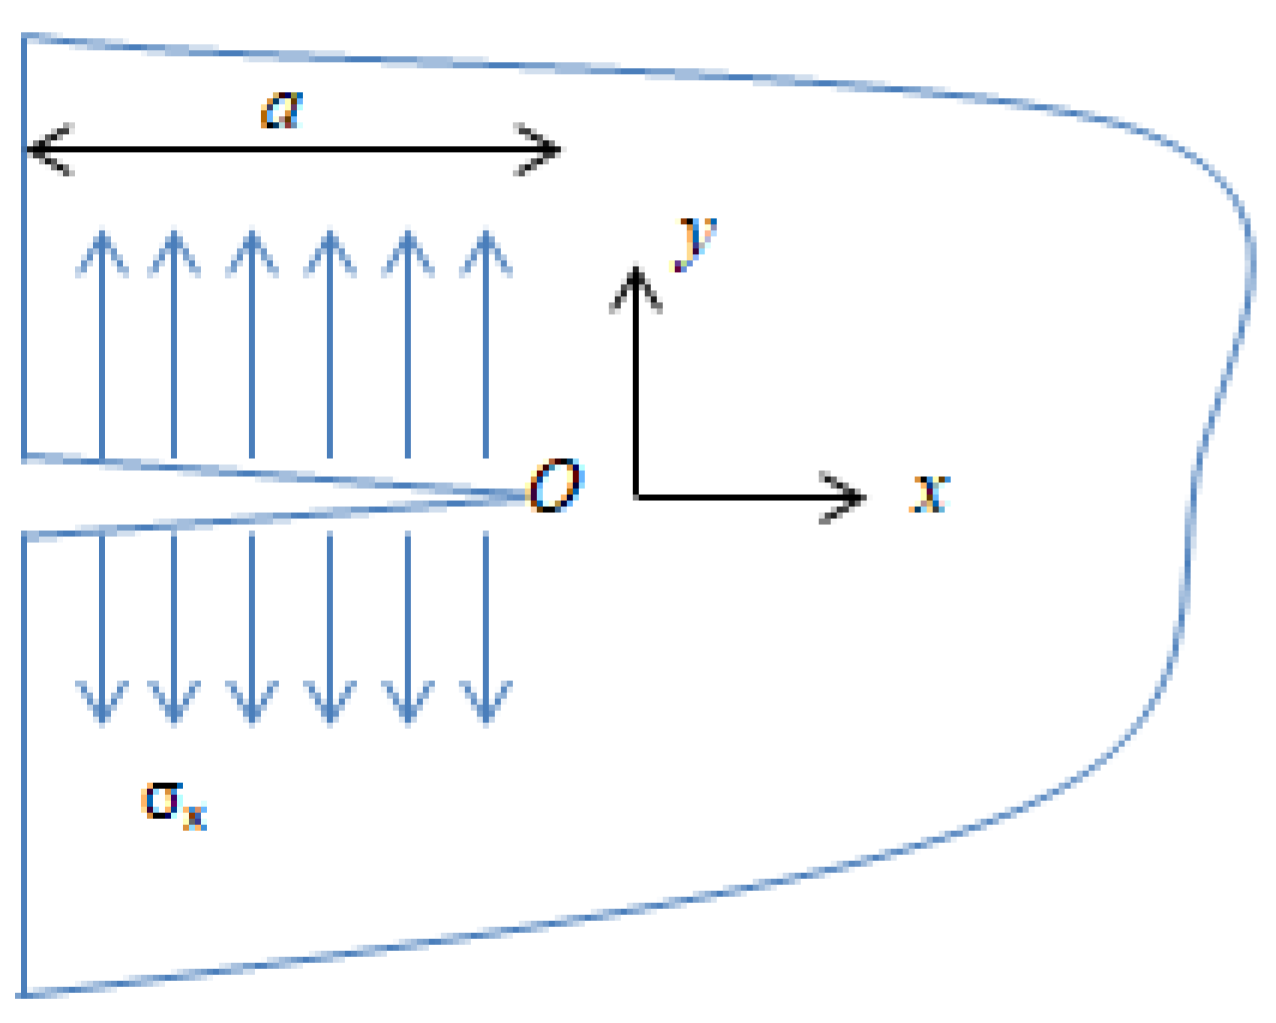
The simplest geometry factor is for an edge crack of length “a” at the edge of a semi-infinite half-space. A semi-infinite surface crack means that there is a crack on the surface of the half-plane, as shown in Figure 6. The increased ability of the crack to open causes the stress intensity factor to increase approximately 12% for the edge crack [33], and the stress intensity factor can be expressed as
K I = 1.12   σ π a
Since stresses are linearly proportional to the stress intensity factor, it follows that the superposition principle also applies to crack problems. This provides a very important tool for applying fracture mechanics to practical problems, such as dam structures. The underlying principle is that stresses induced by various loads can be added together. Applying fracture mechanics theory [43] studies the ability to resist hydraulic fracturing of the dam body from a microscopic and mesoscopic perspective. Therefore, the crack propagation of the dam body is evaluated from the stress intensity factor KI, J integral, or energy at the crack tip. The K criterion of fracture mechanics is used to assess the cracks in concrete, namely:
K I = K I C
where KI stands for the stress intensity factor of mode I crack (open type), MN/m3/2; KIC stands for the fracture toughness of the material, MN/m3/2. It should be pointed out that the superposition method applies only to cases where a structure is subjected to various loads but of the same mode. The crack tip stresses for a cracked component can be calculated for the combined loads, for example, tension and bending according to [33] see (Equation (13)).
σ i j = K I t o t a l 2 π r f i j α
It is assumed that the linearly distributed stress σx is applied symmetrically on the left and right surfaces of the semi-infinite surface crack, and σ(x=−a) = P1, σ(x=0) = P2, P1 > P2. At this time, the crack belongs to mode I [44], see (Equation (14)) for details.
K I = 1.2 P 2 + 0.439 ( P 1 P 2 )   × π   a  
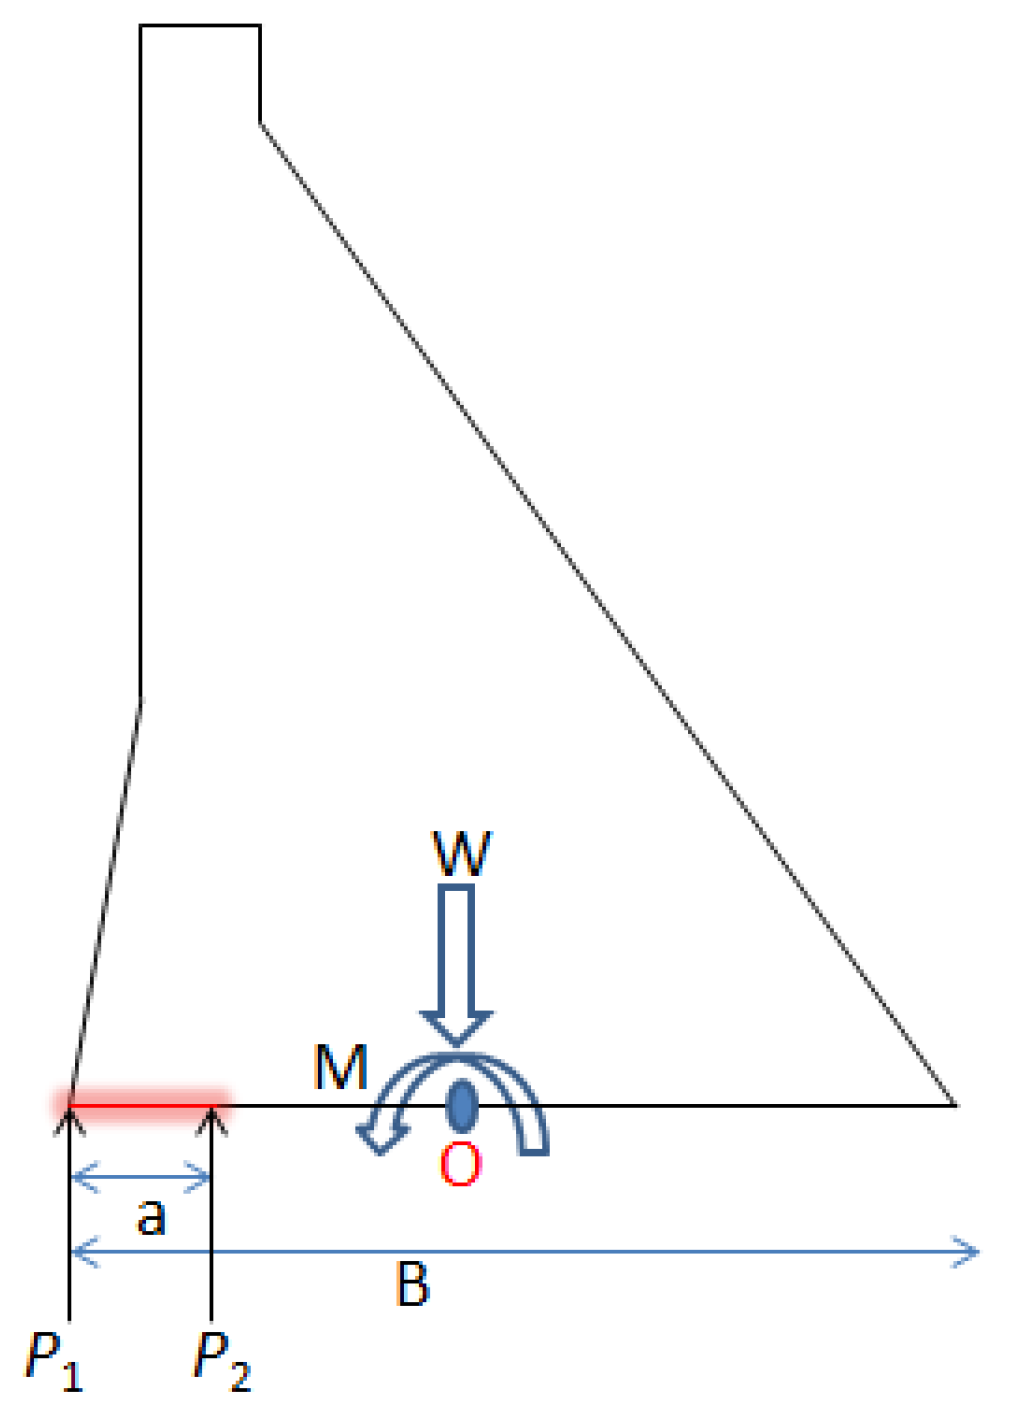
Due to the large volume of high concrete gravity dams, cracks on the upstream surface can be considered as semi-infinite surface cracks. Horizontal cracks are assumed to appear at the dam heel of the high concrete gravity dam, and crack propagation is determined by the high water pressure in the crack and the vertical stress at the dam heel when the dam is seamless. Therefore, the crack can be regarded as the crack of mode I, and the stress intensity factor at the crack tip can be obtained by super positioning these two forces. Furthermore, the stress intensity factor of the horizontal crack at the dam heel of the high concrete gravity dam can be calculated by (Equation (14)). When (Equation (14)) is applied to the horizontal cracks at the dam heel of a high concrete gravity dam, the specific meanings of the parameters in the equation are the following: P1 is the water pressure at the dam heel plus the vertical tensile stress or minus the vertical compressive stress at the same position where it is seamless; P2 is equal to the water pressure at the dam heel plus the vertical tensile stress or minus the vertical compressive stress at the same position where it is seamless at the crack tip; a is the equivalent crack depth considering the concrete crack propagation zone, as shown in Figure 7. Because P2 is located at the crack tip, the effect of water pressure reduction appears, so the calculated equation of the water pressure in the crack is α1 γ ×H1 (α1 stands for the attenuation coefficient of the permeability of the concrete indicating the degree of attenuation of the water head in the crack from the crack mouth to the crack tip) and then the stress at the position of P2 is as follows (according to the direction of the gravity of the resultant force and the counterclockwise direction of the resultant moment being positive): see (Equation (15)).
P 2 = α 1 γ H 1 W B + M B 2 a B 3 12
where W stands for the component of the resultant force in the vertical direction when there is no crack in the dam body, N, M stands for the resultant moment when there is no crack in the dam body, N.m, B is the dam cross section width (m), H is the water head at the dam heel (m), and a is the equivalent crack depth (m). Since P1 is located at the crack opening, there is no attenuation of the water pressure in the crack, and the equation is γ H1, then the stress at the position of P1 is as follows (positive in the gravity direction of resultant force and the counterclockwise direction of resultant moment):
P 1 = γ H 1 W B + 6 M B 2
P 1 P 2 = 1 α 1 γ H 1 12   a   M B 3
The KIC of concrete in the high concrete gravity dam is still determined by an empirical equation. The empirical equation of concrete fracture toughness in Refs. [45,46] is as follows:
K I C = 1.9 β f t
where β = [0.2–0.3] and can be taken 0.22, and f t is the axial tensile strength of the concrete material, Pa. By taking Equations (14)–(18) into the K = KIC criterion, the critical crack propagation equation at the dam heel of the high concrete gravity dam can be obtained as follows:
0.66   α 1 γ H 1 + 0.439 γ H 1 1.1 W B + 6 M B 2 + 7.932   a M B 3 π a = 0.418 f t
The calculations for the crack depth evaluation and the ultimate overloading coefficient were applied for two cases with and without considering uplift pressure. In the case of considering uplift, the analysis was divided into two methods with the existence of uplift without reduction and with reduction (namely the first and second methods, respectively). The parameters of the Guxian, Dworshak, and Grande Dixence to be included in the analysis are listed in Table 4. The influence of the hydraulic fracture for the three dams was investigated to illustrate their ability to resist crack propagation.

4. Numerical Model Verification

For the purpose of numerical model validation, the stress intensity factor (K) that represents the crack tip propagation was calculated numerically using XFEM and theoretically using the equations given in Section 3.3.2. In XFEM, a stress intensity factor (K) was employed to characterize the stress distribution around a crack tip, depicting both its singularity and propagation. The theoretical value of K for an initial crack in concrete under uniform tensile stress (σ) is given in (Equation (9)). A case study presented by [42] was adapted for the validation method and the results were compared. A concrete surface containing a crack, under the influence of unidirectional tensile force with dimensions L = 5.7 m, B = 2 m, and w = 0.5 m, was selected for computational examination. This analysis aimed to validate whether the stress intensity factor (K) values at the crack tip, obtained through XFEM under different tensile stresses (σ), aligned with the theoretical equation governing the correlation between σ and K. Initially, a crack measuring 0.1 m in length was presumed to be located at the midpoint of the surface. Employing concrete properties such as an elastic modulus of E = 28,000 MPa and a Poisson’s ratio of μ = 0.2, a computational model for concrete cracking, as depicted in Figure 8, was developed. In scenarios where the ratio of crack length to thickness (a/w) was less than 0.6, the coefficient Y in the theoretical equation governing the stress intensity factor [43] altered.
Y = 1.12 0.231 a w + 10.55 a w 2 21.72 a w 3 + 30.39 a w 4
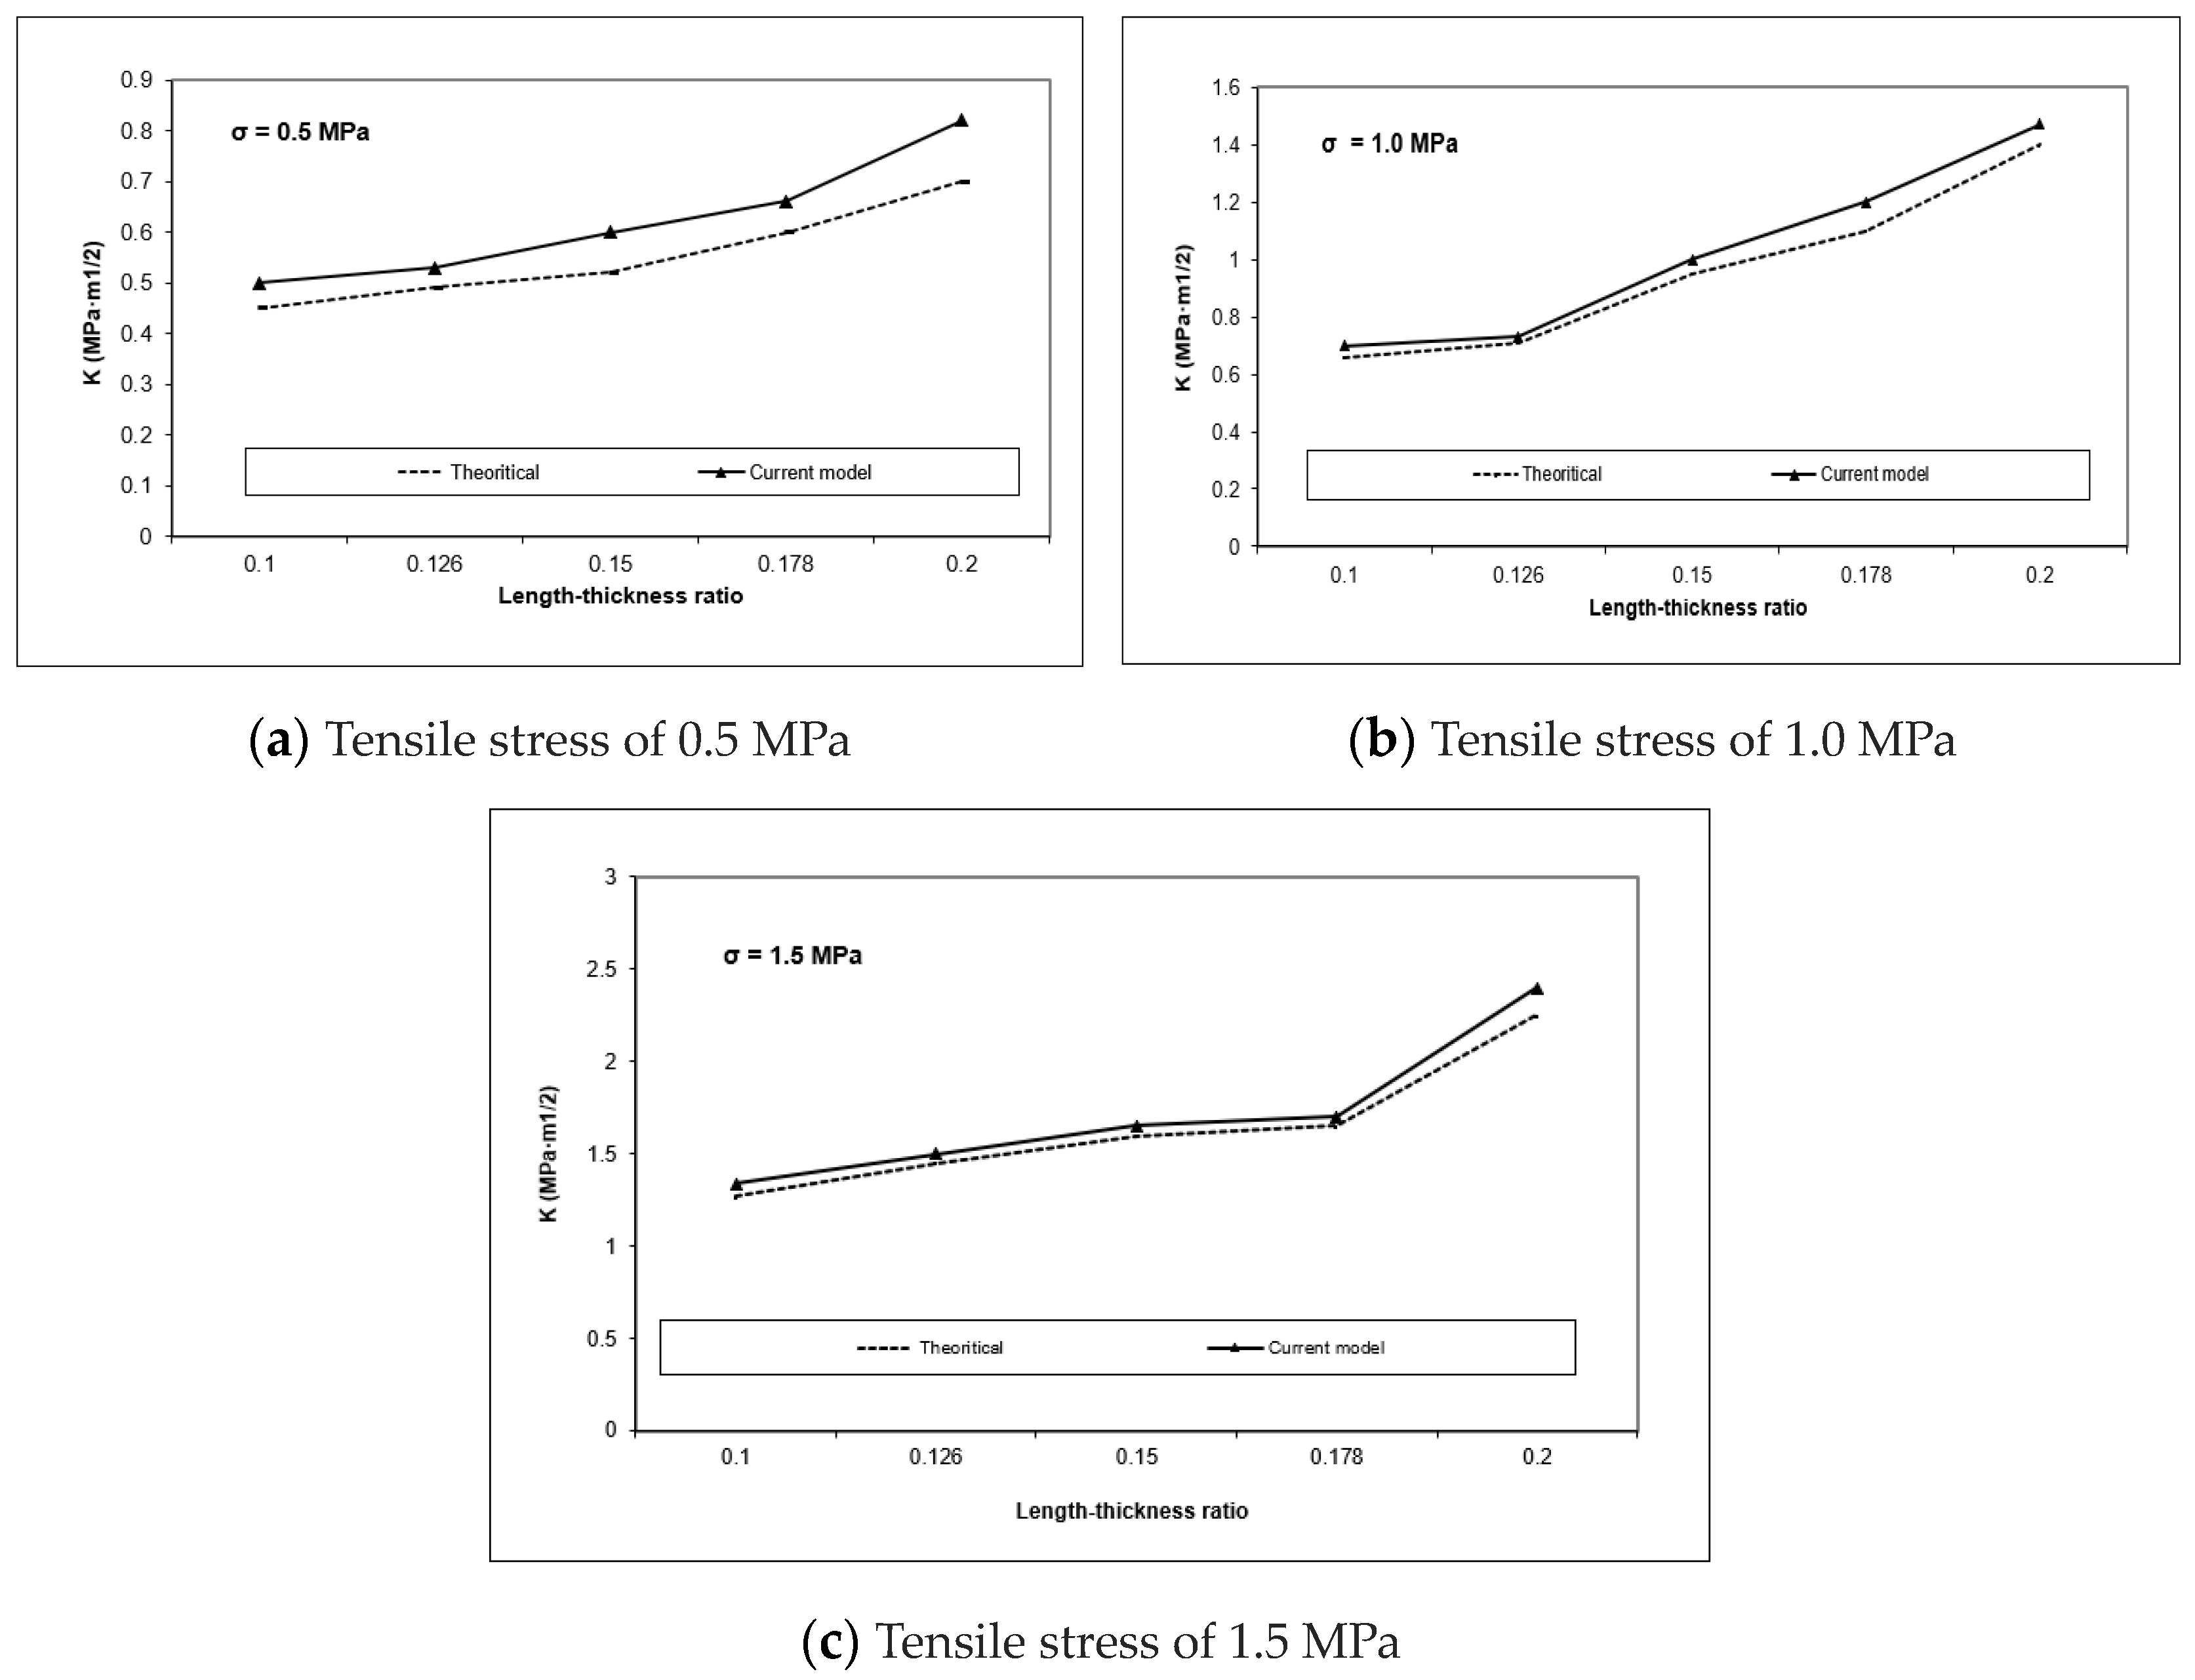
Figure 9 shows the relationship between stress, length/thickness, and K values for various tensile stresses. Particularly, K escalates as crack length increases under consistent tensile stress conditions, with both numerical and theoretical trends appearing similar. The results from the current model have shown an agreement with the output of the theoretical given equations and the differences are less than 9%; hence, these findings have shown the validity of using the XFEM for crack propagation simulation. Combining both methods for investigating the risk of hydraulic fracture possible risk is an effective methodology, where the FEM and theoretical equations complete the full understanding about the crack propagation behavior.

5. Results and Discussion

5.1. Comparative Study of Different Design Criteria

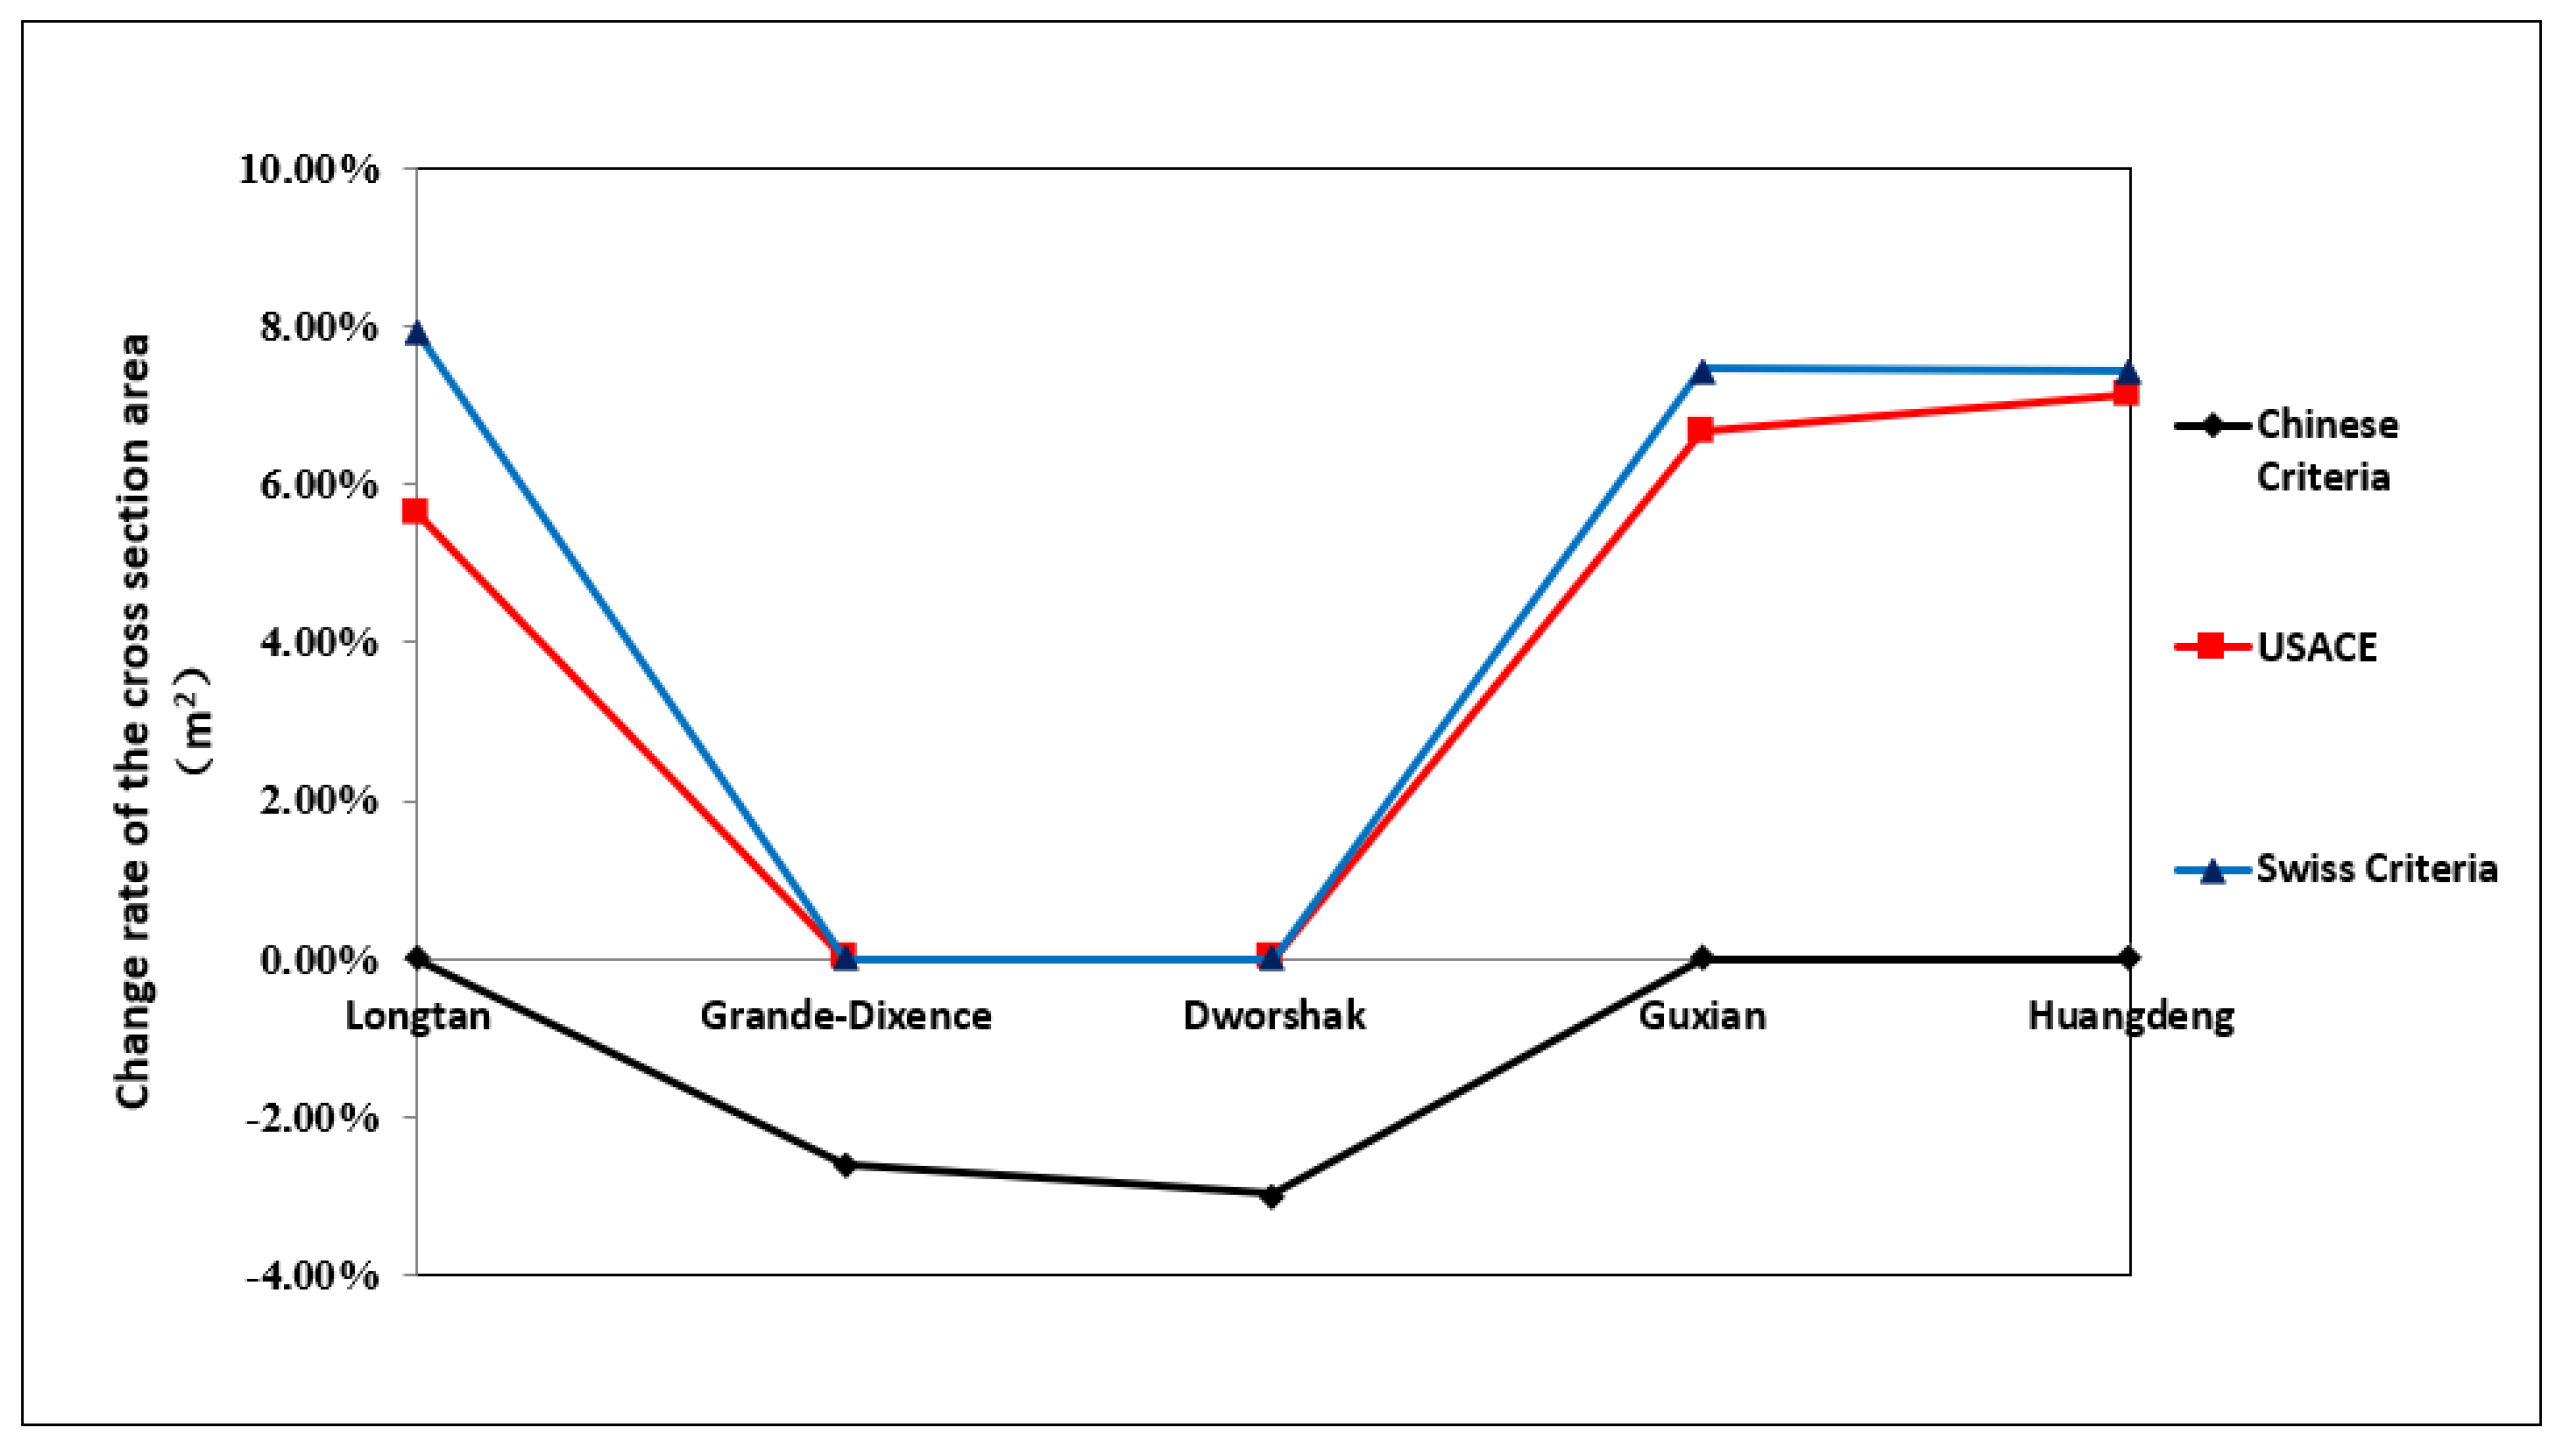
It was found that the Guxian dam failed to meet the stress requirements of the USACE (US Army Corps of Engineers) criteria. Therefore, to ensure the safety of the Guxian dam according to USACE criteria, an adjustment was required to overcome stress failure. It was suggested that the base width of the Guxian dam be increased from 172.35 m to 177.6 m. The new area of the cross-section of the Guxian was 18,729 m2. In the case of applying the SFOE (Swiss Federal Office of Energy) regulation to the original geometry of the Guxian dam, similar results were given. The dam did not meet the stress criteria of the SFOE, and an enlargement of its dimensions was required. Consequently, the bottom width increased from 172.35 m to 186.4 m. The total cross-sectional area has been increased to 18,888.1 m2. The other two Chinese dams, Huangdeng and Longtan, failed to satisfy the stress requirements for both regulations and were required to enlarge their cross-sectional area. In contrast to the other two dams, Dworshak and Grande Dixence, both dams were safe according to SFOE and USACE criteria, but, according to Chinese criteria, the cross-sections of the Grande Dixence and Dworshak dams were safe but with a higher value than required to satisfy the sliding and stability requirements given by the Chinese criteria, and a smaller area of the cross-section was available. It was suggested to decrease the section area of both dams. The updated geometry for the five dams is listed in Table 5 and Table 6.
Due to the differences in the basic theory of each design criterion and the difference between the limitations and coefficients for stress and stability criteria, changes were found in the five gravity dams’ cross-section geometry. The main differences between the three regulations can be concluded as follows: the stress and stability criteria in USA and Switzerland standards include limits on factors such as maximum allowable tensile and compressive stresses in the concrete, and minimum factor of safety against sliding and overturning. USACE (US Army Corps of Engineers) and SFOE (Swiss Federal Office of Energy) regulations have not considered the elastic or plastic behavior of the foundation effect on the base stress distribution or safety factors. USACE standards assume the distribution to be linear due to the complexity of determining the actual distribution due to factors such as tangential reactions and internal stress relations. In contrast, the Chinese criteria stipulate that, for high or medium dams constructed on complex foundations, finite element method analyses should be conducted for stress calculations, with recommendations for physical model tests to verify the results. The Chinese standards consider factors such as differential settlement, uplift pressure, reservoir sedimentation, and temperature effects in the stress and stability analysis. Based on the findings from Table 5 and Table 6, it can be said that dams designed using USACE and SFOE regulations likely have a larger dam cross-sectional area for dams higher than 200 m, while the Chinese criteria tend to calculate a smaller area of dam cross-section, which may be attributed to adapting no tensile stress criteria. The change rate of every dam according to the applied criteria is illustrated in Figure 10, which shows the variation in the total area of the cross-section of the five dams according to each criterion. For a dam with a height less than 50 m, those differences between the three regulations have no major effect, and the dams designed according to the Chinese criteria are safe against the other two criteria, as shown in Figure 11. Overall, while the three standards aim to ensure the safety and stability of gravity dams, their specific stress and stability criteria, and the governed limits, may differ based on the design philosophies, engineering practices, and regulatory requirements of each standard. This comparative analysis can contribute valuable insights to the field of dam engineering and help formulate best practices for ensuring the long-term performance and safety of gravity dams worldwide.

5.2. Assessing the Design Regulations’ Resistance to Hydraulic Fracture

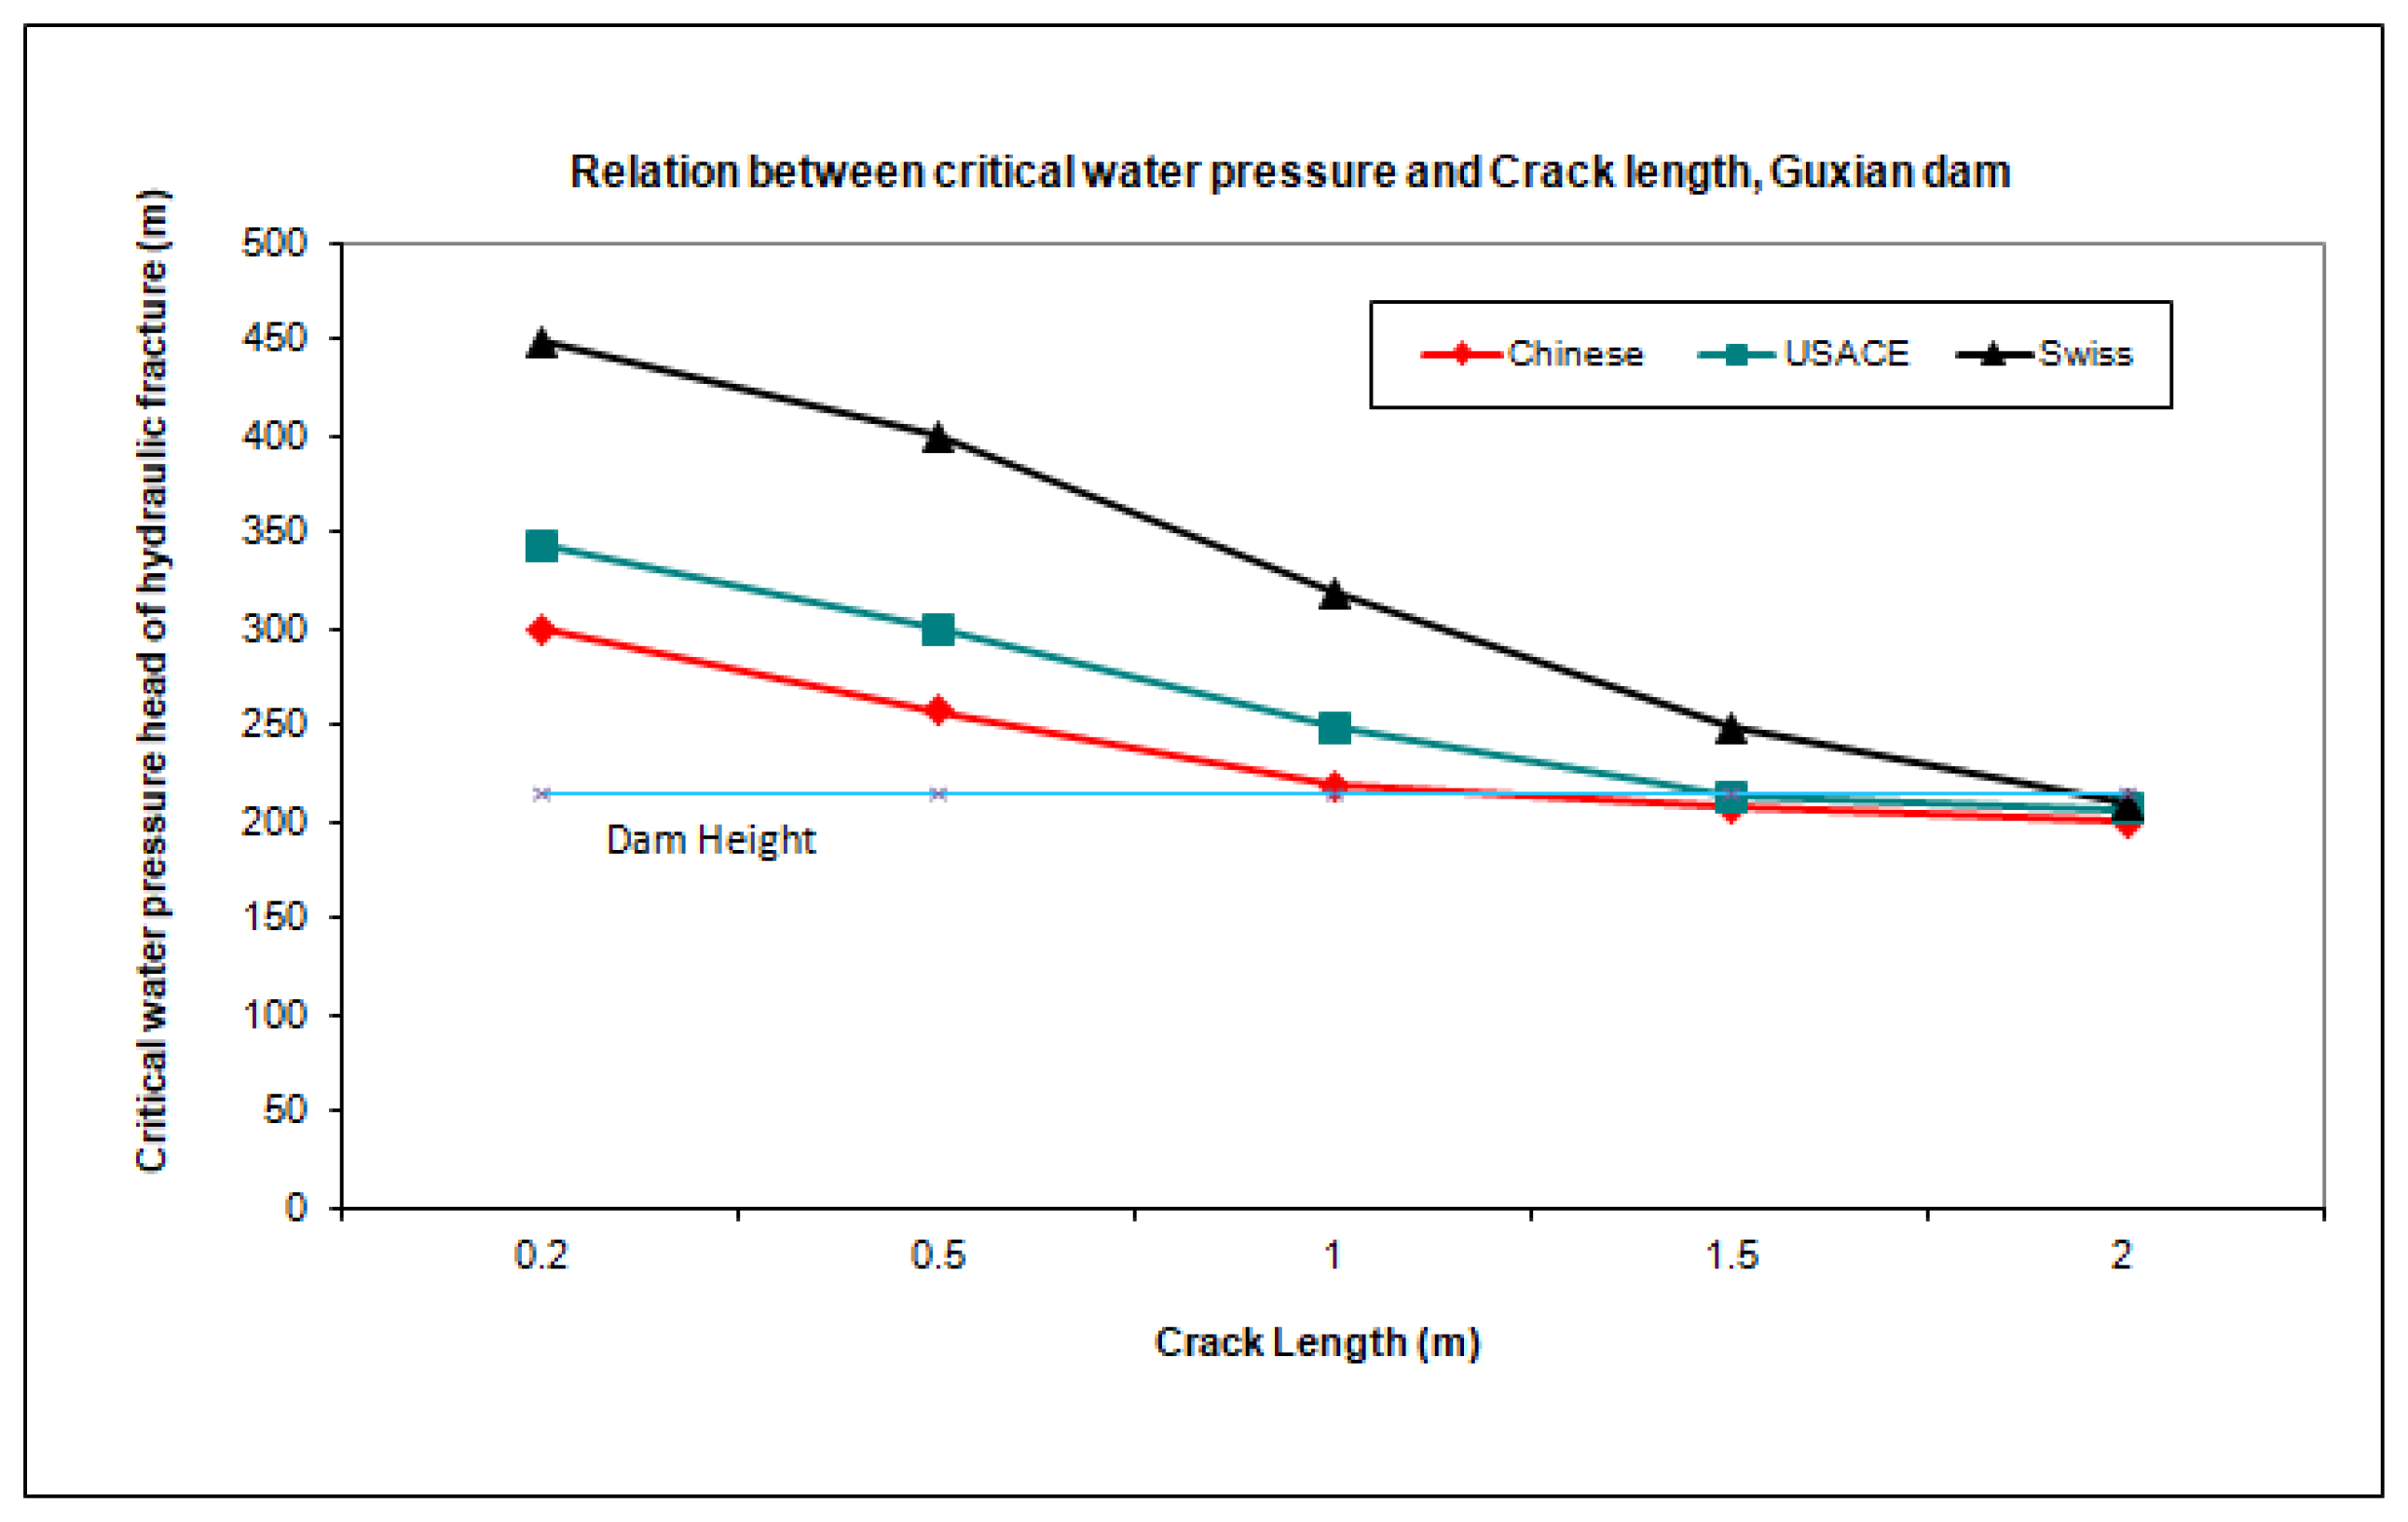
This section provides additional insights into the comparative analysis of the three design regulations, aiming to identify the criteria that result in a dam cross-section with enhanced resistance to hydraulic fracture. It examines the relationship between crack length (depth) and the critical water head, crucial for assessing safety against hydraulic fracture. The critical water head represents the water pressure required to initiate crack propagation through the dam body and foundation. Figure 12 shows the relation between the crack depth (length) and the critical water head. This relationship is investigated for the Guxian dam across three cross-sectional areas (original and updated). It was found that the smaller the crack depth, the higher the water head required to expand the initial crack. The critical water head for the Guxian dam at the initial crack with a depth equal to 0.2 is 1.4 H (H is the dam height), which is an indicator of its safety in this condition. While at crack depths equal to 1.5 and 2 m, the critical water head for the Guxian dam is 208 and 180 m, respectively (0.967 H and 0.84 H), less than 215 m, indicating that the original area of cross-section of the Guxian dam is unsafe against hydraulic fracture under this condition. Increasing the crack depth increases the possibility of hydraulic fracture occurrence at lower critical water heads. The updated Guxian dam cross-sectional area according to the Swiss Federal Office of Energy (SFOE) code has a greater resistance to hydraulic fracture at the same crack depths and no possible risk occurs. On the other hand, the Guxian dam cross-section area, according to the USA code (USACE), has failed to resist the hydraulic fracture at a crack depth of 2 m, and the critical water head for this case is 207 m (0.962 H), while at a crack depth of 1.5 m, no possible risk occurs. It can be said that the Chinese code has a lower resistance against hydraulic fracture than the Swiss and USA specifications. The dams designed according to the USA and Swiss codes are safer than the ones designed according to Chinese criteria; however, in the case of including the uplift pressure in the calculation of the USA and Swiss criteria, the designed dams will not be safer either. Considering vertical stress σy as a compressive strength will increase the ability of hydraulic fracture resistance and that concept can be used for further studies to increase the ability of concrete gravity dams to resist hydraulic fracture.

5.3. Evaluation of the Ultimate Bearing Capacity

5.3.1. Safety Assessment Using Overloading Method with and without Considering Crack

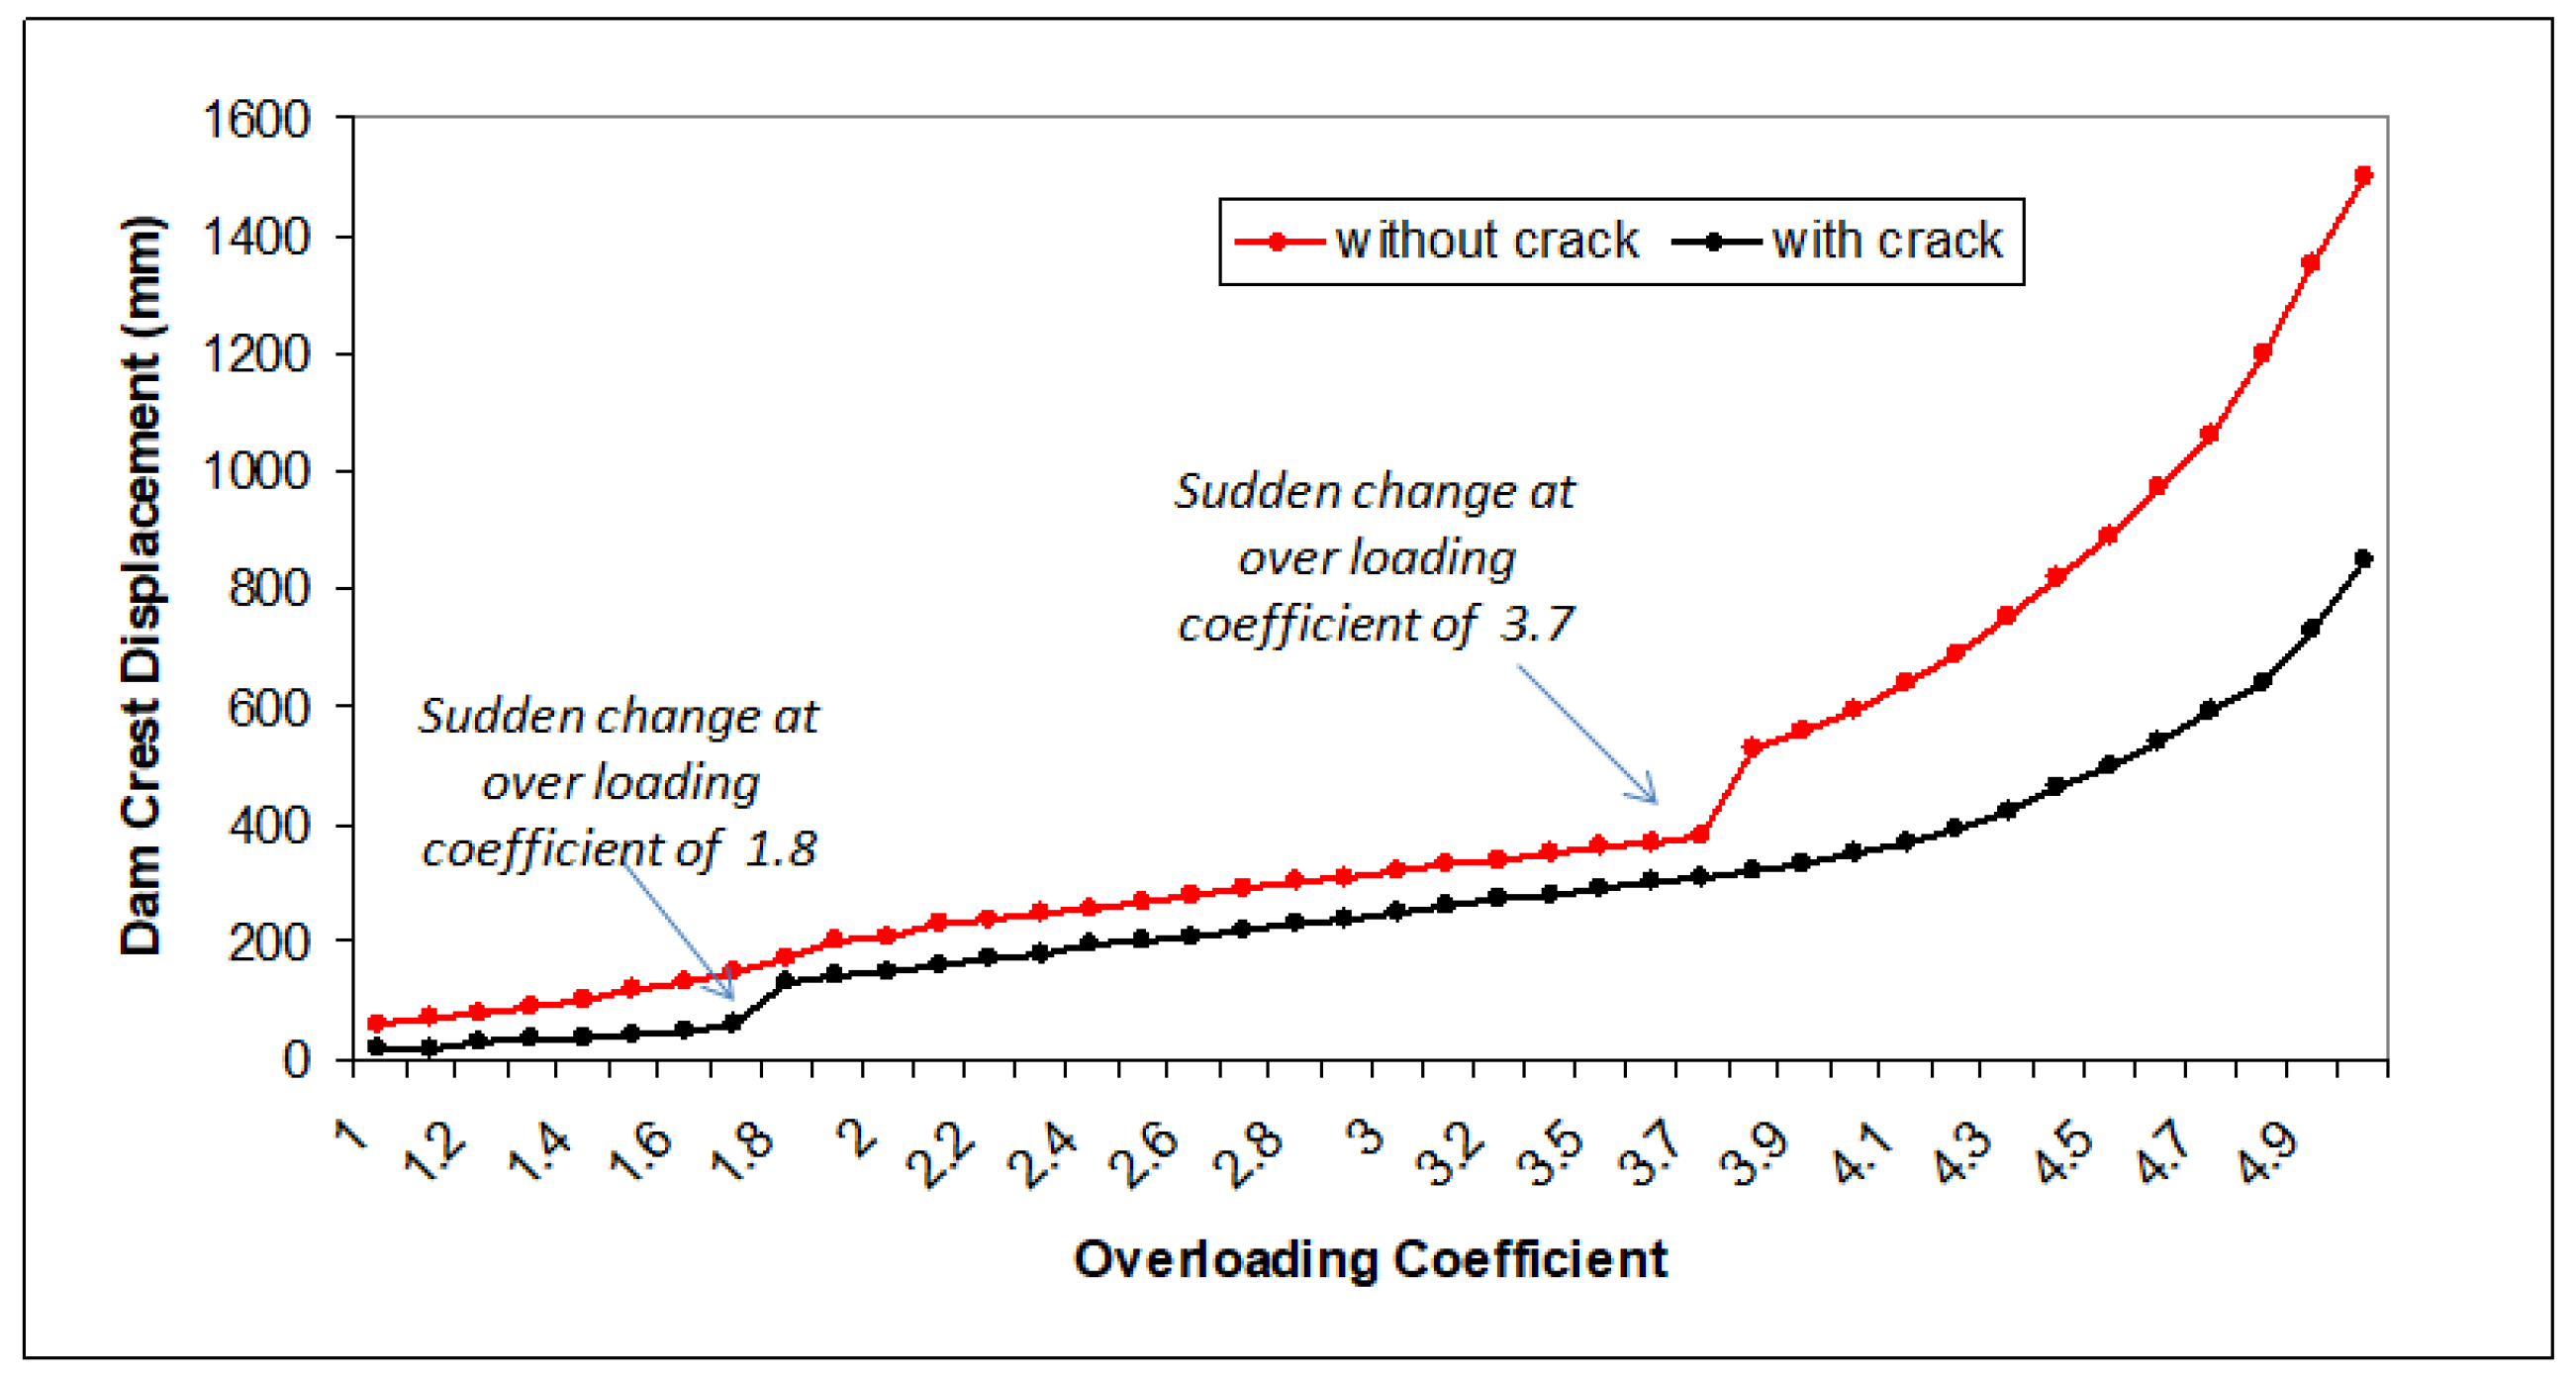
The identification of safety concerns regarding the cross-section of the Guxian dam, as revealed in the preceding comparative analysis, emphasizes the need for further safety investigations. This part delved into evaluating the ultimate bearing capacity of the Guxian dam under varying conditions, both with and without the influence of hydraulic fracture. Utilizing the overload method to meticulously examine the progressive failure process was carried out, employing dam crest displacement as a pivotal indicator of instability. Notably, displacement values were measured in meters, with positive signs indicating the direction from upstream to downstream. The analysis revealed a pivotal finding: in scenarios without crack propagation, the Guxian dam’s overloading coefficient reached 3.7. However, beyond this threshold, the dam exhibited signs of distress. Conversely, simulations accounting for crack propagation and the presence of weak layers within the dam showcased a notable reduction in overloading coefficient values. Specifically, the overloading coefficient plummeted from 3.7 to 1.8, highlighting the significant impact of crack propagation and weak interfaces on dam stability. Figure 13 provides a visual depiction of the maximum displacement observed at overloading coefficients of 3.7 and 1.8, without and with crack propagation, respectively. This reduction in overload coefficient highlights the decreased ultimate bearing capacity of the dam due to crack propagation. Increasing the water pressure increases the possibility of automatic crack propagation reflecting on the decrease in dam capacity and a smaller overloading factor obtained. To illustrate the difference between the instability mode of failure of the Guxian dam with and without crack, the displacement of the dam crest and the overloading coefficient curve is given in Figure 14, showing the catastrophe of dam displacement by the overload method. Observations reveal a rapid escalation in dam stream displacements once the coefficient surpasses 3.7 and 1.8 for both cases.
The presence of weak layers increases the possibility of forming plastic zones, which accelerates the progressive failure of the dam. These yield zones function as plastic hinges. The structural integrity of the dam is compromised, leading to a decrease in the safety factor. As for the dam deformation of typical stages, such as the connectivity of plastic yield zones in weak interlayers from upstream to downstream. The total water pressure on the upstream dam surface is increased, which results in the compression/shear yield zones being largely distributed in weak layers. Yield zones in the dam body first appear at the dam toe and the turning points of the upstream and downstream dam surface. As the overloading parameter continues to increase, yield zones propagate within the internal structure of the dam.
Table 7 concludes the safety factors obtained from the five concrete dams under investigation. The weak layers are applied to the RCC dams only to simulate the real situation.
In the case of not considering the crack propagation, it is noticed that the bigger the area of the cross section, the higher the value of the safety factor, which confirms that the overloading analysis depends on the dam cross-sectional area to resist the loading increase. It is noticed that, although the Chinese dams have a smaller area of cross-section, they still have a high and reasonable factor of safety, which highlights the benefits of the RCC (Roller-Compacted Concrete) dams. The presence and propagation of cracks through the weak layers significantly affect the safety of concrete gravity dams. Under normal loading conditions using the overloading method, safety factors range from 3.5 to 4.5, indicating satisfactory safety levels. However, when considering automatic crack propagation and the weak layers, the safety factors decrease significantly for the investigated dams. This raises concerns about structural integrity. Cracks weaken the overall structural integrity of the dam and create stress concentrations, reducing the load-carrying capacity and the safety factor. Crack propagation alters load distribution, potentially leading to increased stresses in non-designated areas. Cracks act as stress concentrators that exceed the strength of the material, which leads to further deterioration of the material properties. Therefore, analyzing and addressing crack formation and propagation is crucial for long-term stability and safety.

5.3.2. Investigation of Guxian Dam Resistance to Hydraulic Fracture Mathematically

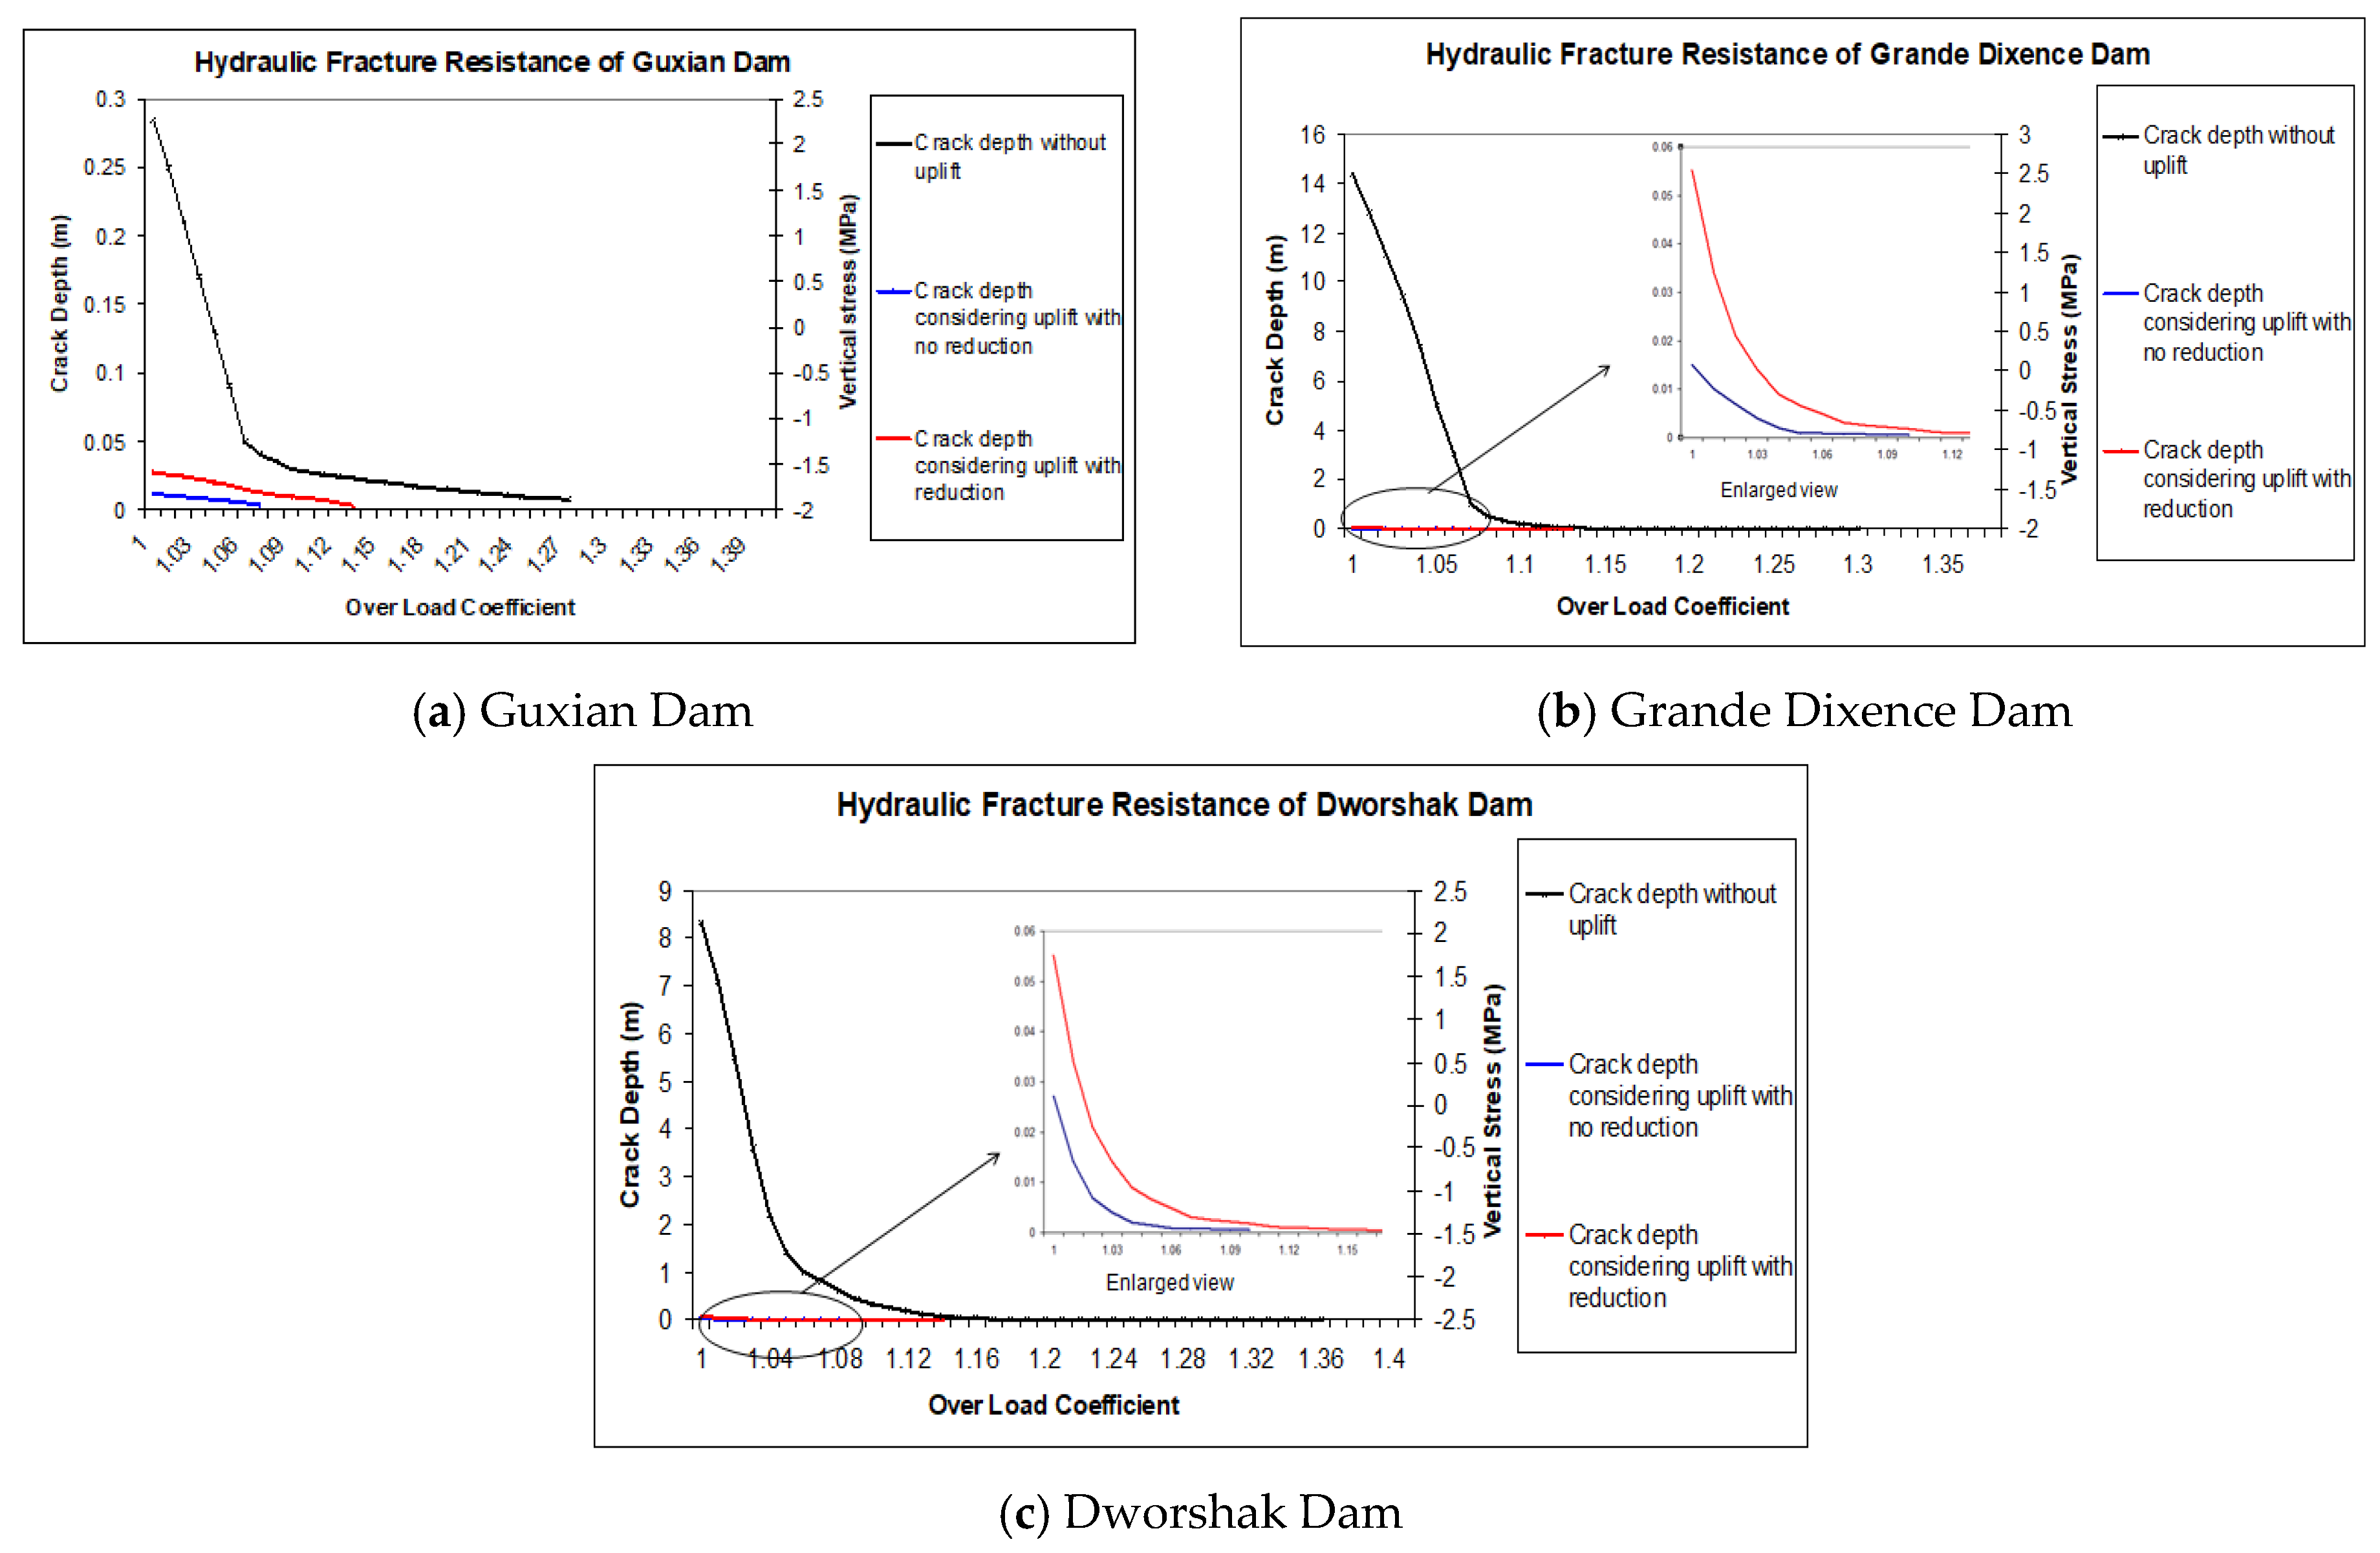
The previous FEM results have shown that the concrete gravity dams might have possible risk due to hydraulic fracture, as hydraulic fracture has shown a negative influence on the dam’s overall stability. Mathematical analysis was carried out by substituting the calculation parameters of the three dams (Guxian/Dworshak/Grande Dixence) into the proposed fracture mechanics evaluation model. Specifically, the crack depth “a” in Equation (19) was solved by continuously changing the upstream water level height “h1”, allowing for a comprehensive assessment of the dams’ vulnerability to hydraulic fracture under varying hydraulic conditions. The ratio of the upstream water level of the dam to the dam height was defined as the overload coefficient, which was used as the measurement to evaluate the resistance to hydraulic fracturing. The crack depth “a” can be obtained by solving (Equation (19)); however, there may be an irrational theoretical solution. To further identify the sensible solution, the constraint condition must be added, that is, the stress of the dam heel is less than the tensile strength of the material. The complex roots in the solution must be removed due to the actual dam crack depth solution. If the roots are negative, the dam will not be exposed to hydraulic fracture behavior at the current upstream water level. As the core of the fracture mechanics evaluation model is the stress criterion, the stress of the dam heel continues to deteriorate with increasing overload coefficient, which makes it easier to meet the requirements of the splitting criterion, and the crack depth on the upstream surface of the dam body will gradually decrease nonlinearly. If the uplift pressure is not considered, the overload coefficient of the upstream surface of the dam is ranked as the Dworshak dam followed by the Grande Dixence dam, lastly the Guxian dam, indicating that the ability of the Guxian dam to resist hydraulic fracturing is the weakest. Because the crack depth calculated by the evaluation model is smaller, the width of the dam section changes less, which makes the stress at the dam heel present linearization. Table 8 shows the results of the calculations when the uplift is not considered. The negative sign of stress stands for tensile stress.
When considering the uplift pressure in the foundation and using the first calculation method, due to the change of the force state of the dam caused by increasing the overload coefficient, the clockwise bending moment of the dam magnifies, resulting in a decrease in the compressive stress on the upstream surface of the dam, and thus the dam body is more prone to cracks and expansion. Table 9 illustrates the results of the calculations for the first calculation method considering the uplift. The order of overload coefficient of the dam body is the Dworshak dam with the higher value, followed by the Grande Dixence dam, then the Guxian dam. When the crack initiation overload coefficient is 1.0, cracks of different depths appear on the upstream faces of the three dams, indicating that the dam body is at risk of hydraulic fracturing. The Guxian dam has the weakest ability to resist hydraulic fracture. When considering the uplift pressure in the foundation using the second calculation method, the analysis method is consistent with the first calculation method. Table 10 presents the calculation results of the second method of considering uplift pressure; the results show that the highest resistance is Dworshak, then Grande Dixence, and the lowest resistance is the Guxian dam. As the second calculation method considers the reduction effect of the anti-seepage curtain on uplift pressure, the sum of clockwise bending moments of the dam body becomes smaller; furthermore, the hydraulic fracturing resistance of the dam body becomes stronger. Therefore, the ultimate overload coefficient of the second calculation method of uplift pressure in the foundation is larger than that of the first calculation method. Without considering the uplift pressure, the clockwise bending moment is further reduced, and the ability of the dam body to resist hydraulic fracturing is strengthened again. Therefore, both the initiation overload coefficient and the ultimate overload coefficient are larger than those considering the uplift pressure. For the fracture mechanics evaluation model, the proportion of uplift pressure should be greatly reduced in the dam section design to minimize its impact on the ability to resist hydraulic fracturing. The fracture mechanics evaluation model considers the defects of concrete materials from microscopic and mesoscopic perspectives and judges whether the crack begins to expand by the stress intensity factor at the crack tip, which is called the K-criterion. The fracture mechanics evaluation model is sensitive to the uplift pressure, and the ability to resist hydraulic fracturing is the largest without considering the uplift pressure, the weakest when there is no reduction effect of the first uplift pressure calculation method, and the second uplift pressure calculation method with reduction effect is in the middle. The main reason is that the fracture mechanics evaluation model involves the stress state of the dam, and the uplift pressure significantly affects the stress state of the dam and aggravates the change of the dam’s resistance to hydraulic fracturing.
The fracture evaluation model and different uplift pressure calculation methods show that the ability of the Guxian dam to resist hydraulic fracturing is the weakest among the investigated dams and it is suggested that the dam section be adjusted. The three dams that are mathematically investigated are not strong enough to resist hydraulic fracturing; the dams still have the risk of hydraulic fracturing, as shown in Figure 15. It is suggested to consider adding hydraulic fracturing criteria based on the original stress criteria and stability criteria during the section design of high concrete gravity dams.

6. Conclusions

The main points of this paper lie in conducting a comparative analysis between national and international standards to delineate their disparities. This analysis sheds light on the differences while reviewing the resilience of high concrete gravity dams against hydraulic fracturing. Furthermore, numerical and mathematical modeling techniques are employed to explore the potential risks of hydraulic fracturing on these structures. As a result of these investigations, the following conclusions have been drawn.
(1) A comparative analysis of the geometrical characteristics of high concrete gravity dams was conducted according to the dam design codes applicable in China, the United States, and Switzerland. The findings indicated that Chinese design standards tend to prescribe smaller cross-sectional areas for gravity dams exceeding 200 m in height under normal loading conditions, while dams designed under USACE and SFOE regulations typically necessitate larger cross-sectional areas to meet their specified safety margins. This disparity can be attributed to the Chinese criteria adapting no tensile stress. Conversely, for gravity dams with heights less than 50 m, no discrepancies were observed among the three regulatory outputs. Moreover, dam cross-sections designed in accordance with USACE and SFOE guidelines exhibited greater resistance to hydraulic fracturing compared with those designed under Chinese regulations in the case of not considering the uplift. The analysis also identified that the cross-sectional area of Guxian Dam needs to be enlarged to 18,888.1 m2 to ensure complete resistance against hydraulic fracturing, at an initial crack depth of 2 m. Initial cracks with depth higher than 1 m can represent high threats to the current Guxian dam cross-section.
(2) The occurrence of hydraulic fracture phenomena exerts a substantial adverse impact on the ultimate bearing capacity of the dam, with crack propagation and considering the weak layers notably diminishing the safety margin. The weak layers increase the plastic zones formation in the dam body, which reduces the overall stability of the dam. In the case of the Guxian dam, the overloading coefficient value decreases from 3.7 to 1.8, representing an approximate reduction of over 48% in the event of crack propagation, particularly when considering the vulnerabilities inherent in RCC dams. The presence of weak layers exacerbates the formation of plastic zones, functioning as plastic hinges, which compromises the dam’s structural integrity. Yield zones initially appear at critical points like the dam toe and junctions of upstream and downstream surfaces, propagating internally with increased loading.
(3) The mathematical modeling illustrated that the three dams (Guxian/-Dworshak/Grande Dixence) may have a possible risk against hydraulic fracture and the Guxian dam has the lowest resistance. The uplift pressure increases the possible risk of hydraulic fracture occurrence and decreases the resistance of the dam that might threaten the stability of the gravity dam. Conversely, reducing uplift pressure enhances the dam’s resistance against hydraulic fracture; without considering uplift pressure, the ultimate overload coefficient for the Guxian dam is 1.27, with a crack depth of 0.284 m and maximum dam heel stress of −1.33 MPa. Comparatively, the Grande Dixence and Dworshak dams show higher resistance with overload coefficients of 1.33 and 1.37, and stresses of −1.5 MPa and −1.69 MPa, respectively. When uplift pressure is considered, the Guxian dam’s ultimate overload coefficient drops to 1.051, with a crack depth of 0.012 m and a maximum heel stress of −1.31 MPa.
(4) The findings indicated that the Guxian dam’s current cross-section requires more strengthening. The current versions of design codes may be susceptible to potential risks associated with hydraulic fracturing. It is strongly recommended that the calculation of hydraulic fracture be incorporated into the design codes, particularly for dams exceeding 200 m in height, to mitigate these risks effectively. The integration of the Finite Element Method (FEM) and mathematical models emerges as a valuable and effective approach for evaluating the potential risks associated with hydraulic fracturing.

Author Contributions

Conceptualization, J.J. and M.R.; methodology, M.R. and L.Z.; software, M.R. and L.Z.; validation, Y.W.; formal analysis, L.Z.; investigation, M.R.; Resources, Y.W.; data curation, L.Z.; writing—original draft preparation, M.R.; writing—review and editing, X.L., L.Z. and Y.W.; visualization, M.R.; supervision, J.J. and X.L.; project administration, J.J. and X.L.; Funding acquisition, X.L. All authors have read and agreed to the published version of the manuscript.

Funding

This research received no external funding.

Data Availability Statement

The raw data supporting the conclusions of this article will be made available by the authors on request.

Conflicts of Interest

The author Lei Zhao is employed by the Huadian Electric Power Research Institute Co., Ltd. The remaining authors declare that the research was conducted in the absence of any commercial or financial relationships that could be construed as a potential conflict of interest.

References

  1. Chinese SL 319-2018; Design Specification for Concrete Gravity Dams. China Water and Power Press: Beijing, China, 2018.
  2. Swiss Federal Office of Energy (SFOE). Directive on the Safety of Water Retaining Facilities; Part C1, Supervision of Dams section, Federal Department of the Environment, Transport, Energy and Communications (DETEC); Version 2.0; Swiss Federal Office of Energy, Supervision of Dams Section: Bern, Switzerland, 2017. [Google Scholar]
  3. USBR (United States Bureau of Reclamation). Design of Gravity Dams-Design Manual for Concrete Gravity Dam; A Water Resources Technical Publication; USBR: Denver, CO, USA, 1976. [Google Scholar]
  4. Federal Energy Regulatory Commission. Engineering Guidelines for the Evaluation of Hydropower Projects; Federal Energy Regulatory Commission: Washington, DC, USA, 1999. [Google Scholar]
  5. USACE (USA Army of Corps Engineering). Stability Analysis of Concrete Structures, Engineering Manual EM 1110-2-2000; US Army Corps of Engineers: Washington, DC, USA, 2005.
  6. ANCOLD. Guidelines on Design Criteria for Concrete Gravity Dams; Australian National Committee on Large Dams: Hobart, Australia, 2013. [Google Scholar]
  7. Al-Shadeedi, M.; Hamdi, E. Comparison of the Structural Stability of Concrete Gravity Dams using USACE and USBR Standards. ARPN J. Eng. Appl. Sci. 2017, 12, 1580–1592. [Google Scholar]
  8. Goldgruber, M.; Zenz, G. Analysis of Structural Safety of Gravity Dams; Institute of Hydraulic Engineering and Water Resources Management: Graz, Austria, 2012. [Google Scholar]
  9. Wang, Y.; Jia, J. Experimental study on the influence of hydraulic fracturing on high concrete gravity dams. Eng. Struct. 2017, 132, 508–517. [Google Scholar] [CrossRef]
  10. Li, W.; Wu, W.; Zhang, J. Numerical Stability Analysis of the Dam Foundation Under Complex Geological Conditions at Great Depth: A Case Study of Kala Hydropower Station, China. Orig. Res. Front. Phys. 2022, 9, 808840. [Google Scholar] [CrossRef]
  11. Zhou, J.; Zhao, X.; Nie, Y.; Tian, Y. Influence of High Water Pressure on Static and Dynamic Compressive Strength of Concrete. Adv. Civ. Eng. 2020, 2020, 8814626. [Google Scholar] [CrossRef]
  12. Tian, Y.; Zhao, X.; Zhou, J.; Nie, Y. Investigation on the influence of high-pressure water environment on fracture performance of concrete. Constr. Build. Mater. 2022, 341, 127907. [Google Scholar] [CrossRef]
  13. Feng, L.M.; Peakau, O.A.; Zhang, C.H. Cracking analysis of arch dams by 3D boundary element method. J. Struct. Eng. 1996, 122, 691–699. [Google Scholar] [CrossRef]
  14. Vallejo, S.A.N. Hydraulic Engineering Failure of Large Dams. Master’s Thesis, Graz University of Technology, Graz, Austria, 2016. [Google Scholar]
  15. Schöberl, P. Crack sanitation at Zillergrundl arch dam. In Proceedings of the Symposium on Repair and Upgrading of Dams; COLD: Stockholm, Sweden, 1996. [Google Scholar]
  16. Lin, P.; Guan, J.; Peng, H.; Shi, J. Horizontal cracking and crack repair analysis of a super high arch dam based on fracture toughness. Eng. Fail. Anal. 2019, 97, 72–90. [Google Scholar] [CrossRef]
  17. Liang, W.H.; Qiao, C.X.; Tu, C.L. A summarized study on cracks in Zhexi concrete buttress dam. Shuili Xuebao/J. Hydraul Eng. 1982, 6, 1–10. (In Chinese) [Google Scholar]
  18. Zhang, H.; Shen, Z.; Xu, L.; Gan, L.; Ma, Z.; Wu, Q.; Liu, D. Experimental investigation on hydraulic fracturing in cement mortar with tensile stress. Eng. Fract. Mech. 2022, 259, 108058. [Google Scholar] [CrossRef]
  19. Liu, Z.G.; Zhou, Z.B.; Yuan, L.W. Calculation of vertical crack propagation on the upstream face of the Zhexi single buttress dam. J. Hydraul. Eng. 1990, 5, 29–36. [Google Scholar]
  20. Wang, L.C.; Wu, S.Y. Self-healing mechanism of concrete cracks induced by splitting tensile loading. J. Hydraul. Eng. 2019, 50, 787–797. [Google Scholar]
  21. Song, Z.P.; Li, N.; Chen, F.X. Three dimensional nonlinear seismic stability analysis of abutment jointed rock mass of high arch dam. Chin. J. Geotech. Eng. 2004, 26, 361–366. [Google Scholar]
  22. McDonald, J.E.; Curtis, N.F. Repaired and Rehabilitation of Dams; Technical Report, REMR-CS-63; US Army Corps of Engineers, Engineer Research and Development Center: Washington, DC, USA, 1999.
  23. Brühwiler, E.; Saouma, V.E. Water fracture interaction in concrete-part I: Fracture properties. ACI Mater. J. 1995, 92, 296–303. [Google Scholar]
  24. Zhao, W.; Fang, T.; Chen, X.; Sun, L. Experimental study on hydraulic fracture behavior of concrete with wedge-splitting testing. Sci. Eng. Compos. Mater. 2023, 30, 20220182. [Google Scholar] [CrossRef]
  25. Barani, O.R.; Majidaie, S.; Mosallanejad, M. Numerical modeling of water pressure in propagating concrete cracks. J. Eng. Mech. 2016, 142, 04016011. [Google Scholar] [CrossRef]
  26. Zhang, X.; Wu, B.; Connell, L.D.; Han, Y.; Jeffrey, R.G. A model for hydraulic fracture growth across multiple elastic layers. J. Pet. Sci. Eng. 2018, 167, 918–928. [Google Scholar] [CrossRef]
  27. Li, Y.; Zhong, H.; Pang, L.; Hu, Z. Influence of the water pressure distribution along crack faces on seismic fracture modeling of a dam-reservoir-foundation system. Eng. Anal. Bound. Elem. 2019, 101, 252–269. [Google Scholar] [CrossRef]
  28. Zhang, S.; Wang, G.; Yu, X. Seismic cracking analysis of concrete gravity dams with initial cracks using the extended finite element method. Eng. Struct. 2013, 56, 528–543. [Google Scholar] [CrossRef]
  29. Parvathi, I.S.; Mahesh, M.; Kamal, D.V.V.R. Critical crack lengths of concrete gravity dam by using fracture mechanics. Mater. Today Proc. 2021, 38, 3149–3159. [Google Scholar] [CrossRef]
  30. Parvathi, I.S.; Mahesh, M.; Kamal, D.V.V.R. XFEM Method for Crack Propagation in Concrete Gravity Dams. J. Inst. Eng. India Ser. A 2022, 103, 677–687. [Google Scholar] [CrossRef]
  31. Wang, K.; Zhang, Q.; Xia, X.; Wang, L.; Liu, X. Analysis of hydraulic fracturing in concrete dam considering fluid–structure interaction using XFEM-FVM model. Eng. Fail. Anal. 2015, 57, 399–412. [Google Scholar] [CrossRef]
  32. Gan, L.; Zhang, K.; Zhang, H.; Tian, Z. Coupling analysis of hydraulic fracturing computation base on element-free method. Clust. Comput. 2017, 20, 3213–3224. [Google Scholar] [CrossRef]
  33. Wang, C.H. Introduction to Fracture Mechanics; DSTO-GD-0103; DSTO Aeronautical and Maritime Research Laboratory: Canberra, Australia, 1996. [Google Scholar]
  34. Anderson, T.L. Fracture Mechanics, Fundamentals and Applications; CRC Press: Boca Raton, FL, USA, 1995. [Google Scholar]
  35. Ji, E.; Fu, Z.; Chen, S.; Zhu, J.; Geng, Z. Numerical Simulation of Hydraulic Fracturing in Earth and Rockfill Dam Using Extended Finite Element Method. Adv. Civ. Eng. 2018, 2018, 1782686. [Google Scholar] [CrossRef]
  36. Deng, H.; Yan, B.; Zhang, X.; Zhu, Y. A new enrichment scheme for the interfacial crack modeling using the XFEM. Theor. Appl. Fract. Mech. 2022, 122, 103595. [Google Scholar] [CrossRef]
  37. Xu, Q.; Liu, B.; Chen, J.; Li, J.; Wang, M. Shaking Table Test and Numerical Simulation Study of the Reinforcement Strengthening of a Dam. Buildings 2022, 12, 1955. [Google Scholar] [CrossRef]
  38. Mlakar, P.F. Nonlinear Response of Concrete Gravity Dams to Strong Earthquake-Induced Ground Motion; Technical Report SL-88-7; US Army of Corps: Washington, DC, USA, 1987.
  39. Clerc, B.; Manso, P.; De Cesare, G. Heightening of Very High Gravity Dams: The Case Study of the Grande Dixence, Numerical Analysis of Dams. Lect. Notes Civ. Eng. 2021, 91, 775–792. [Google Scholar] [CrossRef]
  40. Pirtz, D. Creep Characteristics of Mass Concrete for DWORSHAK Dam; Structural Engineering Laboratory, Structures and Materials Research Department of Civil Engineering, University of California: Berkeley, CA, USA, 1968. [Google Scholar]
  41. ACI. Report on Roller-Compacted Mass Concrete, ACI 2017.5R-11; American Concrete Institute: Farmington Hills, MI, USA, 2011. [Google Scholar]
  42. Zhou, B.; Chai, J.; Wang, J.; Zhou, H.; Wen, L. An XFEM-Based Analysis of Concrete Face Cracking in Rockfill Dams. Math. Probl. Eng. 2021, 2021, 6640668. [Google Scholar] [CrossRef]
  43. Fang, T.R. Elementary Fracture Mechanics; Science Press: Beijing, China, 2006. [Google Scholar]
  44. Chinese Aeronautical Establishment. Stress Intensity Factors Handbook; Science Press: Beijing, China, 1981. [Google Scholar]
  45. Yu, X.Z. Fracture Mechanics of Concrete. Water Power 1988, 2, 49–53. [Google Scholar]
  46. Wu, Z.M.; Zhao, G.F.; Xi, S.L. Fracture toughness of large concrete specimen. J. Hydraul. Eng. 1997, 6, 67–76. [Google Scholar]
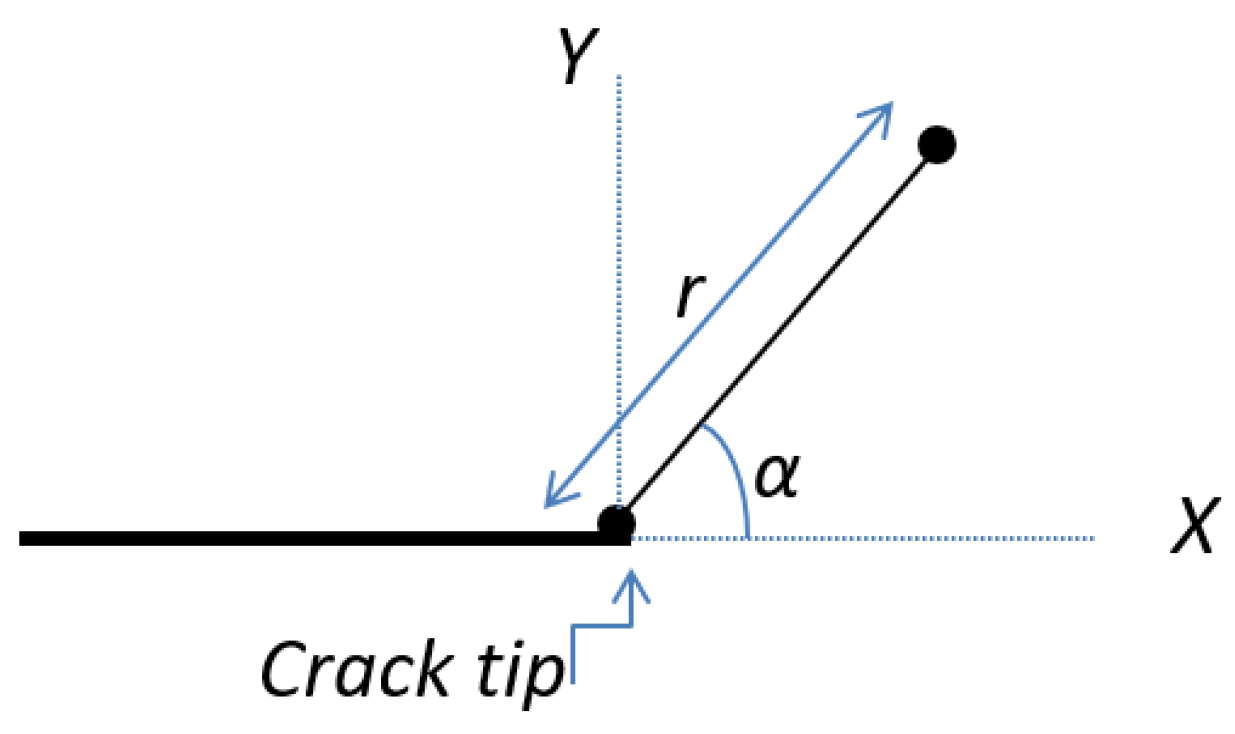
Figure 1. Polar coordinates (r, α), respectively, from the crack tip to the calculation point.
Water 16 01912 g001
Figure 2. The three basic modes of crack surface displacement; I—open type; II—in-plan shear type; III—out-of-plan tearing type.
Water 16 01912 g002
Figure 3. Schematic diagram of gravity dam typical cross-sections.
Water 16 01912 g003
Figure 4. FEM model.
Water 16 01912 g004
Figure 5. Crack deformation for mode I (open type).
Water 16 01912 g005
Figure 6. Semi-infinite surface crack.
Water 16 01912 g006
Figure 7. Force diagram of horizontal cracks in the dam body.
Water 16 01912 g007
Figure 8. Numerical modeling.
Water 16 01912 g008
Figure 9. KI values for different tensile stresses and length/thickness ratios.
Water 16 01912 g009
Figure 10. Rate of change in the dam cross-sectional area after being modified with the different design criteria.
Water 16 01912 g010
Figure 11. Comparison between different dam heights according to the three design criteria.
Water 16 01912 g011
Figure 12. Relationship between the critical water head and crack depth of the Guxian dam.
Water 16 01912 g012
Figure 13. The maximum horizontal displacement of the Guxian dam crest.
Water 16 01912 g013
Figure 14. The relationship between the overloading coefficient and displacement for the Guxian dam.
Water 16 01912 g014
Figure 15. Hydraulic Fracture Resistance of the investigated dams.
Water 16 01912 g015
Table 1. Original data of the cross-sectional geometry of the five dams.
Parameter/DamGuxianLongtanHuangdeng DworshakGrande Dixence
Dam crest width (b/m)151816 8.315
Dam height (H/m)215216.5203 219284
Height of the slope (Hs/m)506360 00
Slope ratio0.30.250.3 00
Vertical distance of the dam crest (V/m)202617 815
Downstream slope ratio0.80.730.73 0.80.81
Dam bottom width (B/m)172.35160.77165 177.1232.89
Upstream water level (Hu/m)215216.5203 219284
Downstream water level (Hd/m)252525 2525
Concrete bulk density (N/m3)24,00024,00024,000 24,00024,000
Water density (N/m3)10,00010,00010,000 10,00010,000
Uplift pressure reduction factor0.210.210.21 0.210.21
Curtain position (c/m)132020 2020
Area of cross-section (m2)17,497.1315,146.8715,971 19,626.133,566.21
Table 2. Regulation limitations at normal load combination.
Chinese Criteria
Safety Factor Using Friction EquationShear Resistance StabilityStress Calculations
K = f W P
K > 1.10 for usual loading combination
K = f W + C A P .
K′ > 3 for usual loading combination
σ y u = W T + 6 M T 2
σ y d = W T 6 M T 2
USACE (US Army Corps of Engineers) CRITERIA
Overturning StabilitySliding StabilityStress Calculations
R e s u l t a n t L o c a t i o n = M V
The resultant remains within the middle third to maintain compressive stresses.
F S = τ F T = ( N tan φ + C L ) T
Minimum FS =2 for usual loading combination
σ n D = V B   ( 1 + 6 e b )
σ n D = V B   ( 1 6 e b )
SFOE (Swiss Federal Office of Energy) CRITERIA
Uplift StabilitySliding StabilityStress Calculations
V h V b γ s f T t g φ / γ m φ + C A γ m c σ n D = V B   ( 1 + 6 e b )
σ n D = V B   ( 1 6 e b )
Table 3. Mechanical properties of the main materials used for the five dams.
Dam MaterialElastic PropertiesDamage for CrackPlastic Properties
Elastic Modulus GPaPoisson RatioMax Principal StressMPaFriction Angle°Yield StressMPa
LongtanDam body250.1672.4531.51
Foundation280.22.5521.68
HuangdengDam body260.1672.4511.56
Foundation290.22.5521.67
Grande DixenceDam body350.23.5562.77
Foundation320.23.5572.82
DworshakDam body380.23.2552.64
Foundation310.23.2572.78
GuxianC15W622 0.1679.1 50.71.78
BT CONCRETE39 0.1672.2 59.64.49
C20W625.5 0.1671.1 51.32.48
C25W828 0.1672.35 51.72.52
Foundation32 0.22.350.71.80
Table 4. List of parameters of the calculated section of the three dams.
ParameterGuxianGrande DixenceDworshakDam Geometric Dimensions
D1 (m)15158.3Water 16 01912 i001
D2 (m)20158
D3 (m)165284219
D4 (m)5000
λ1 (slope ratio)0.80.810.8
λ2 (slope ratio)0.300
h1 (m)215284219
h2 (m)252525
B (m)172.35232.89177.1
γwat (N/m3)10,00010,00010,000
γcon (N/m3)24,00024,00024,000
ft (Pa)1,380,0001,570,0001,710,000
α0.50.50.5
Table 5. Original geometry of the Guxian dam cross-section vs. modified geometry.
ParameterChinese Criteria
(Original)
USACE Criteria
(Modified)
SWISS Criteria
(Modified)
Crest width (m)151515
Dam height (m)215215215
Slope height (m)505050
Slope ratio0.30.30.3
Crest vertical distance (m)201019.5
Downstream slope ratio0.80.720.8
Dam bottom width (m)172.35177.6186.4
Area of cross-section (m2)17,497.1318,72918,888.1
Table 6. Updated geometry of the four dams.
Parameter/
Criteria
LongtanHuangdengGrande DixenceDworshak
USACESWISSUSACESWISSChineseChinese
Crest width (m)18181616158.3
Dam height (m)216.5216.5203203284219
Slope height (m)6363606000
Slope ratio0.250.250.30.300
Crest vertical distance (m)191617171511.5
Downstream slope ratio0.730.730.730.730.810.8
Dam bottom width (m)165.88168.07172.96180.8225.6174.3
Area of cross-section (m2)16,053.8916,453.5717,197.6417,256.932,69119,040.2
Table 7. Safety factor values of the five concrete gravity dams.
Dam/Method of CalculationOverloading without CrackOverloading with Crack
Longtan3.51.5
Huangdeng3.61.6
Guxian3.71.8
Dworshak4.22.3
Grande Dixence4.52.7
Table 8. Calculation results without considering the uplift pressure.
DamCrack Initiation Overload CoefficientCrack Depth (m)Ultimate Overload CoefficientMaximum Dam Heel Stress (MPa)
Grande Dixence1.0214.361.33−1.5
Dworshak1.018.3161.37−1.69
Guxian1.00.2841.27−1.33
Table 9. Calculation results of the first method considering the uplift pressure (no reduction).
DamCrack Initiation Overload CoefficientCrack Depth (m)Ultimate Overload CoefficientMaximum Dam Heel Stress (MPa)
Grande Dixence1.000.0151.092−1.48
Dworshak1.000.0271.119−1.62
Guxian1.000.0121.051−1.31
Table 10. Calculations results of the second method considering uplift pressure (with reduction).
DamCrack Initiation Overload CoefficientCrack Depth (m)Ultimate Overload CoefficientMaximum Dam Heel Stress (MPa)
Grande Dixence1.000.0551.197−1.54
Dworshak1.000.0851.21−1.54
Guxian1.000.0281.14−1.29
Disclaimer/Publisher’s Note: The statements, opinions and data contained in all publications are solely those of the individual author(s) and contributor(s) and not of MDPI and/or the editor(s). MDPI and/or the editor(s) disclaim responsibility for any injury to people or property resulting from any ideas, methods, instructions or products referred to in the content.