Article

Enhanced Adsorption of Aqueous Pb(II) by Acidic Group-Modified Biochar Derived from Peanut Shells

1
School of Chemical Engineering and Technology, Hebei University of Technology, Tianjin 300401, China
2
School of Civil Engineering, Hebei University of Technology, Tianjin 300401, China
*
Author to whom correspondence should be addressed.
Water 2024, 16(13), 1871; https://doi.org/10.3390/w16131871
Submission received: 3 April 2024 / Revised: 20 May 2024 / Accepted: 24 May 2024 / Published: 29 June 2024

Abstract

:
Using peanut shells, a sustainable agricultural waste product, as its raw material, the acid group-modified biochar (AMBC) was prepared through phosphoric acid activation, partial carbonization, and concentrated sulfuric acid sulfonation for efficient removal of lead ion from aqueous solutions. Characterization techniques such as N2 isothermal adsorption–desorption, SEM, XRD, FT-IR, TG-DTA, and acid–base titration were utilized to fully understand the properties of the AMBC. It was found that there were high densities of acidic oxygen-containing functional groups (-SO3H, -COOH, Ph-OH) on the surface of the AMBC. The optimal adsorption performance of the AMBC for Pb(II) in water occurred when the initial concentration of Pb(II) was 100 mg/L, the pH was 5, the dosage of the adsorbent was 0.5 g/L, and the contact time was 120 min. Under the optimal conditions, the removal ratio of Pb(II) was 76.0%, with an adsorption capacity of 148.6 mg/g. This performance far surpassed that of its activated carbon precursor, which achieved a removal ratio of 39.7% and an adsorption capacity of 83.1 mg/g. The superior adsorption performance of AMBC can be caused by the high content of acidic oxygen-containing functional groups on its surface. These functional groups facilitate the strong binding between AMBC and Pb(II), enabling effective removal from water solutions.

1. Introduction

With improvements in social industrialization, heavy metal pollution incidents have occurred frequently in recent years. Given their high toxicity, carcinogenicity, and non-biodegradability, countries have implemented strict limits on the discharge of heavy metals in water [1]. Lead, a common heavy metal ion contaminant, is typically found in water as a divalent ion. Pb(II) is non-degradable and can persist in the environment for extended periods, causing significant damage to the human cardiovascular system, liver, and the natural environment [2]. The primary sources of lead-containing wastewater discharge are the electroplating industry, textile industry, and metal processing industries [3].
The treatment of lead-containing wastewater has always been a challenge in the field of sewage treatment. Many techniques have been employed for the treatment of Pb(II) from aqueous environments, including chemical precipitation [4], adsorption [5], membrane filtration [6], ion exchange [7], bioremediation [8], and the electrochemical method [9]. However, these methods exhibit drawbacks in the form of high costs and low efficiencies [10]. Adsorption has emerged as a promising approach in these methods due to its simplicity, high efficiency, and minimal secondary pollution [11]. Adsorbents should be highly selective and efficient, easy to process and apply, should not induce the generation of secondary chemicals, and should have a low cost [12]. Biochar, a low-cost adsorbent derived from biological waste, has garnered significant attention as a sustainable and environmentally friendly adsorbent [5]. It offers an adjustable surface area and controllable porous structure [13], making it highly effective for Pb(II) removal. Carbon nanotubes [14] and clay [15] are also used as adsorbents, but biochar’s renewability and cost-effectiveness make it particularly attractive for wastewater treatment applications [16].
There are many kinds of oxygen-containing functional groups on the surface of biochar, primarily in the form of -CHO, -OH, -COOH, and -C=O, which are usually the active centers of adsorption on activated carbon [17]. To further improve its adsorption performance, biochar can be modified to increase the number and diversity of surface functional groups. Momcilovic et al. [18] modified biochar with phosphoric acid, resulting in a surface containing not only -COOH and -OH, but also P-O-P, P=O, and P=OOH groups. This modification promoted the adsorption capacity for Pb(II). Similarly, Ahmed et al. [5] prepared H2O2-modified watermelon seed biochar with more oxygen-containing functional groups. After activation, the adsorption capacity for Pb(II) increased significantly from 44.32 mg/g to 60.87 mg/g.
Carbon-based solid acid is a kind of amorphous carbon material [19] with acidic groups modified on its surface. It can be prepared from polycyclic aromatic hydrocarbons [20], carbohydrates [21], biomass [22], and mesoporous carbon materials [23]. Carbon-based solid acid has acidic groups such as sulfonic acid and phosphoric acid on the surface and has the advantages of a high acid density, simple post-treatment, easy reusability, low cost, and ecological friendliness. It is commonly used in the field of catalytic research [19,24,25] and serves as a strong acid material that can replace liquid protonic acids. Among these carbon-based solid acids, those derived from biomass sources such as potato peels [22], coconut shells [26], and wakame [25] are essentially an acidic group modified biochar. These acidic groups, such as -SO3H, are achieved through a carbonization and sulfonation process. Yu et al. [27] prepared carbon-based solid acid containing -OH, -COOH, and -SO3H groups via a one-step solvothermal method using axonopus compressus as the raw material. This material demonstrated an exceptional Pb(II) adsorption capacity, achieving 191.07 mg/g within just 5 min. Although the application of carbon-based solid acids for adsorbing heavy metal ions in water is still in its early stages, it holds significant promise for Pb(II) sewage treatment. This is due to its high density of acidic oxygen-containing functional groups on its surface [22], which is expected to improve its adsorption capabilities compared to biochar alone.
Peanut shells, a common form of agricultural waste, can be used to prepare biochar [28]. In this study, an acidic group-modified biochar (AMBC) was prepared from peanut shells through phosphoric acid activation, partial carbonation, and sulfonation with concentrated sulfuric acid. This material was then used for Pb(II) adsorption in water. The effects of the contact time, pH, dosage of adsorbent, and initial Pb(II) concentration on the adsorption performance were studied. Additionally, the thermodynamics and kinetics of the AMBC adsorption for Pb(II) were investigated. Lastly, the adsorption performance of the AMBC was compared with that of its activated carbon precursor, and the adsorption mechanism was discussed.

2. Materials and Methods

2.1. Materials

Analytical grade (AR) chemicals, including H2SO4 (98%, Macklin Biochemical Technology Co., Ltd., Shanghai, China), NaCl (Macklin Biochemical Technology Co., Ltd., Shanghai, China), NaHCO3 (Fuchen Chemical Reagent Co., Ltd., Tianjin, China), HCl (KMO Reagent Co., Ltd., Tianjin, China), Pb(NO3)2 (Sinopharm Chemical Reagent Co., Ltd., Shanghai, China), HNO3 (65%, Macklin Biochemical Technology Co., Ltd., Shanghai, China), NaOH (Wind Ship Chemical Reagent Co., Ltd., Shanghai, China), and H3PO4 (Sinopharm Chemical Reagent Co., Ltd., Shanghai, China), were used in this work without further purification. The peanut shells were obtained from peanuts purchased from a market in Tianjin, China.

2.2. AMBC Preparation

The peanut shells were thoroughly washed and dried at 80 °C, then crushed with a crusher and sieved to obtain 80–100 mesh powder. The peanut shells were then macerated in a 1.22 g/mL H3PO4 solution for 16 h, following a mass ratio of 3:1, and then dried at 110 °C. The resulting solid was carbonized at 300 °C for 2 h under a N2 flow. After this, the sample was washed with 0.1 mol/L HCl solution at 100 °C for 1 h, cooled and filtered, and then cleaned repeatedly with deionized water (≥80 °C) until free of Cl. Finally, the pre-AMBC was obtained after drying at 80 °C.
To sulfonate the pre-AMBC, 1 g of pre-AMBC was mixed with 25 mL of H2SO4 in a flask. The mixture was then heated at 160 °C for 10 h under a N2 flow. After the sulfonation process, the carbon material was cooled to room temperature, then filtered and washed with deionized water (≥80 °C) until no SO42− was present. Finally, the AMBC was obtained after drying at 80 °C.

2.3. Acid–Base Titration

Acid–base neutralization titration was used to determine the density of -SO3H groups on the surface of AMBC [29]. In this process, 0.25 g of AMBC and 30 mL of NaCl solution (0.05 mol/L) were ultrasonically shaken at room temperature for 1 h to ensure that the H+ ions in the -SO3H on the adsorbent surface were fully exchanged by Na+. The solution was then filtered to obtain the filtrate. Finally, phenolphthalein was added as an indicator, and the filtrate was titrated with a 0.05 mol/L NaOH standard solution until the filtrate changed from colorless to a slightly reddish hue. According to the dosage of NaOH, the density of the -SO3H groups in the adsorbent was calculated using Equation (1):
F = c V m ,
where F is the density of -SO3H, mmol/g; c is the concentration of NaOH standard solution, mol/L; V is the volume of NaOH solution consumed during titration, mL; and m is the mass of absorbent weighed for the acid–base titration, g.
The density of -COOH and -PhOH groups on the adsorbent surface was determined using Boehm’s method [30]. Firstly, 0.5 g of adsorbent was transferred into two 150 mL conical flasks. Then, NaHCO3 and NaOH solutions (25 mL, 0.05 mol/L) were added into each flask, respectively. The samples were ultrasonically shaken for 60 min and left to stand for 24 h at room temperature before being filtered. Subsequently, HCl solution (50 mL, 0.05 mol/L) was added to the filtrate containing NaHCO3. In order to remove the CO2 produced by the reaction of HCl and NaHCO3, the conical flasks were heated for 30 min in a water bath at 80 °C. Phenolphthalein was then added dropwise to the flask, and the mixture was titrated with a 0.05 mol/L NaOH standard solution until the solution turned slightly red, indicating the endpoint of the titration. The adsorbent-based NaOH or NaHCO3 consumption was calculated using Equation (2):
a = c N a O H V + 25 c 0 50 C H C l m ,
where a is the NaOH or NaHCO3 consumption, mmol/g; m is the quality of adsorbent, g; cNaOH is the concentration of NaOH standard solution, mol/L; V is the volume of NaOH standard solution used in the titration process, mL; 25 is the volume of NaOH standard solution used, mL; c0 is the concentration of NaOH standard solution used, mol/L; 50 is the volume of excess HCl added, mL; and cHCl is the concentration of HCl solution used, mol/L.
The density of the sulfonic acid groups (F-SO3H) and the consumption of NaHCO3 can be calculated using Equations (1) and (2), respectively. The value of (aNaHCO3-FSO3H) represents the density of carboxylic acid groups (-COOH) on the adsorbent surface, expressed in units of mmol/g.
The consumption of NaOH and NaHCO3 can be determined using Equation (2). The value of (aNaOH-aNaHCO3) represents the density of phenolic hydroxyl groups (-PhOH) on the surface of the adsorbent, expressed in units of mmol/g.

2.4. Characterization

The surface area and porosity of the adsorbents were measured using a N2 adsorption analyzer (Micromeritics ASAP 2020 PLUS, Norcross, GA, USA). The morphology of the adsorbents was characterized using a field emission scanning electron microscope (SEM, FEINova Nano 450, Waltham, MA, USA). X-ray diffractometer spectroscopy (XRD, Rigaku D/Max-2500, Tokyo, Japan) was employed to identify the crystal phase of the AMBC. Various chemical properties of the organic functional groups of the adsorbents were analyzed using an FT-IR instrument (Thermo-Nicolet Nexus 470, Waltham, MA, USA). The thermostability of the AMBC was investigated using a thermogravimetric analyzer (TGA, Rigaku PTC-10A Instrument, Tokyo, Japan). The chemical state analysis of the adsorbents before and after adsorption was measured using X-ray photoelectron spectroscopy (XPS, Thermo Scientific 250Xi, Waltham, MA, USA). In addition, an inductively coupled plasma optical emission spectrometer (ICP-OES, Perkin Elmer Optima 7300v, Waltham, MA, USA) was used to determine the concentrations of Pb(II).

2.5. Adsorption Test

The simulated lead wastewater (100 mg/L) was obtained by dissolving Pb(NO3)2 in deionized water and diluting it to a specified concentration. Before the adsorption experiments, the pH of the solvent was adjusted using NaOH (0.1 mol/L) and HNO3 (0.1 mol/L).
Adsorption experiments for Pb(II) using the AMBC and pre-AMBC were carried out using a shaker. A total of 0.05 g of adsorbent and 100 mL of lead-containing simulated wastewater were sequentially added to a conical flask and shaken at a constant temperature with a stirring rate of 200 rpm. The effects of the contact time (0–200 min), solution pH (3–6), dosage of adsorbent (0–2 g/L), and initial Pb(II) concentration (50–200 mg/L) on the adsorption performance were investigated. After the adsorption experiment, the solution was filtered, and the concentration of Pb(II) in the filtrate was determined using an ICP.
The efficiency of adsorbents is typically assessed based on the removal ratio and adsorption capacity. These parameters can be calculated using Equations (3) and (4), respectively:
R = ( c 0 c 1 ) c 0 × 100 % ,
Q = ( c 0 c 1 ) × V m ,
where R is the removal ratio, %; Q is the adsorption capacity at the time t, mg/g; c0 and c1 are the concentrations of Pb(II) in the solution before and after adsorption, respectively, mg/L; m is the adsorbent dosage, g; and V is the volume of solution, L.

3. Results and Discussion

3.1. Characterization of Adsorbents

The density of acidic functional groups on the AMBC and pre-AMBC was determined through acid–base neutralization titration. The total acid quantity on the AMBC was 2.28 mmol/g, which was higher than that of the pre-AMBC (1.26 mmol/g). It is worth noting that the density of acidic oxygen-containing groups increased to varying degrees after sulfonation. AMBC contained 0.52 mmol/g -SO3H groups, indicating that that concentrated H2SO4 serves as an effective sulfonating agent, successfully introducing -SO3H groups onto the surface of the adsorbent.
The surface areas of AMBC and pre-AMBC were analyzed, and the results are shown in Table 1. The surface area of AMBC, prepared via phosphoric acid activation, was found to be 329.3 m2/g. H3PO4 serves as an effective activator, facilitating the transformation of the inorganic matter in peanut shells into phosphate. This transformation results in an expansion and increase in the distance between carbon microcrystals. During the washing process, the removal of phosphate leads to more developed pores in the activated carbon materials, ultimately increasing the specific surface area. H3PO4 pretreatment has been reported to produce biochar with a large surface area and abundant porous structures [31]. Compared to the carbon precursors pre-AMBC, the specific surface area and pore volume of AMBC decreased significantly after sulfonation. This may be due to the structural shrinkage caused by strong acid treatment [32].
The surface morphology of the pre-AMBC and AMBC was characterized using a scanning electron microscope, as shown in Figure 1, revealing that they exhibited lamellar structures composed of polyaromatic carbon layers. Compared with pre-AMBC, the lamella of AMBC was smaller and the surface was rougher, which may have led to the increase in the specific surface area and porosity of the AMBC.
Figure 2 shows the XRD spectrum of pre-AMBC and AMBC, which exhibits a broad diffraction peak between 20° and 30°. The peak correspond to the diffraction of C(002) [33] indicates that the carbon-based solid acids consisted of aromatic carbon sheets. Therefore, it can be inferred that the prepared carbon material was an amorphous carbon adsorbent [34]. In addition, the XRD spectrum of pre-AMBC showed a weak diffraction peak between 40° and 50°, which can be attributed to C(004). Xue et al. [24] showed that the latter peak was due to the α axis of the graphite structure. The peak could hardly be observed in the XRD spectrum of the AMBC, indicating that the graphitization degree of the AMBC was lower and the carbon layer size was smaller, which is consistent with the results of the SEM.
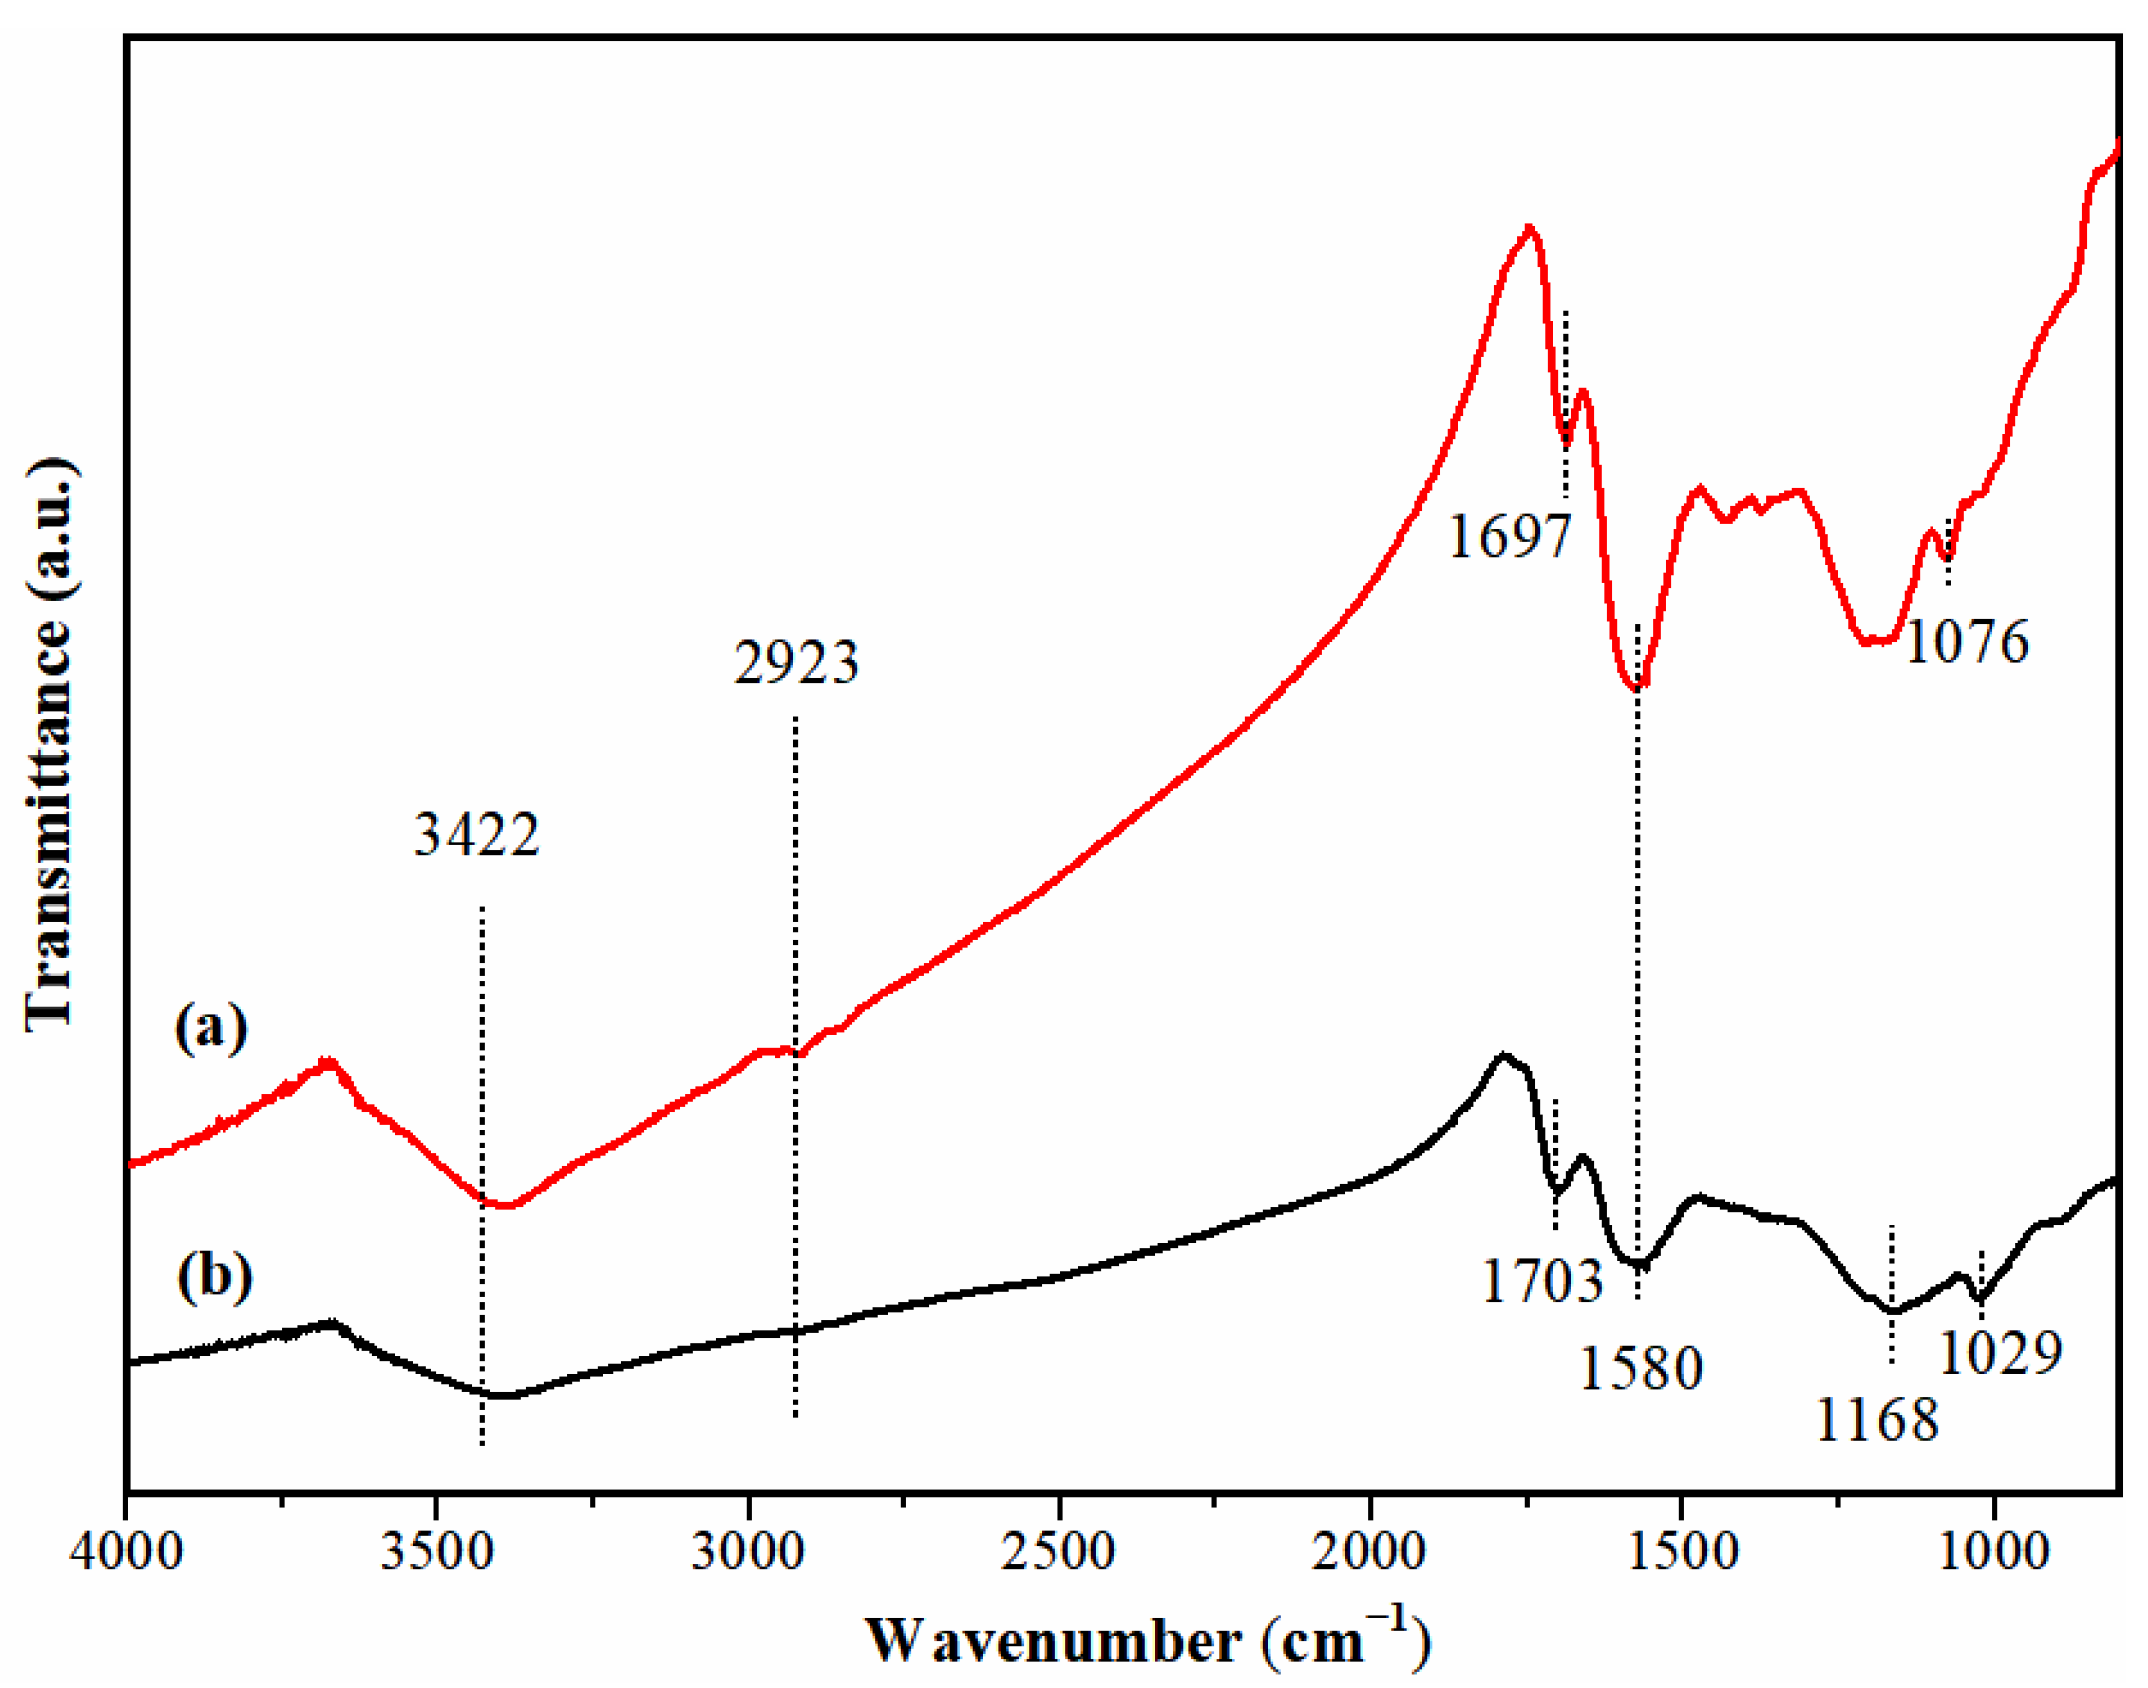
The functional groups on the AMBC and pre-AMBC were characterized based on the FT-IR spectra, and the results are shown in Figure 3. Both spectra showed a peak around 1580 cm−1, which was attributed to the stretching of the C=C bonds formed during the carbonization of the carbon-based solid acid. This suggests the formation of polycyclic aromatic carbon due to incomplete carbonization of the peanut shells [35,36]. The peaks near 1703 cm−1 and 2923 cm–1 can be devoted to the C=O and O-H stretching modes of the -COOH groups, respectively [24]. It illustrated that -COOH groups were present on the surfaces of both the pre-AMBC and AMBC. The peak at 3422 cm−1 may be ascribed to the result of the combination of the stretching modes of the Ph-OH group [37] and the symmetric and asymmetric stretching vibration of the adsorbing -OH group in the water molecule. Compared to the pre-AMBC, the AMBC exhibited two additional peaks at 1168 cm−1 and 1029 cm–1, which were attributed to the O=S=O symmetric and asymmetric stretching modes, respectively [13]. This result suggests that sulfonic acid groups are loaded onto the surface of AMBC through the sulfonation process. Moreover, the peak at 1076 cm−1 in the pre-AMBC spectrum could be attributed to the ionized linkage of P+-O in the acid phosphate esters or P-O-P symmetry vibrations in the polyphosphate chains [28]. However, this peak did not appear in the AMBC spectrum, indicating that acid phosphate esters and phosphoric acid are removed during the sulfonation process.
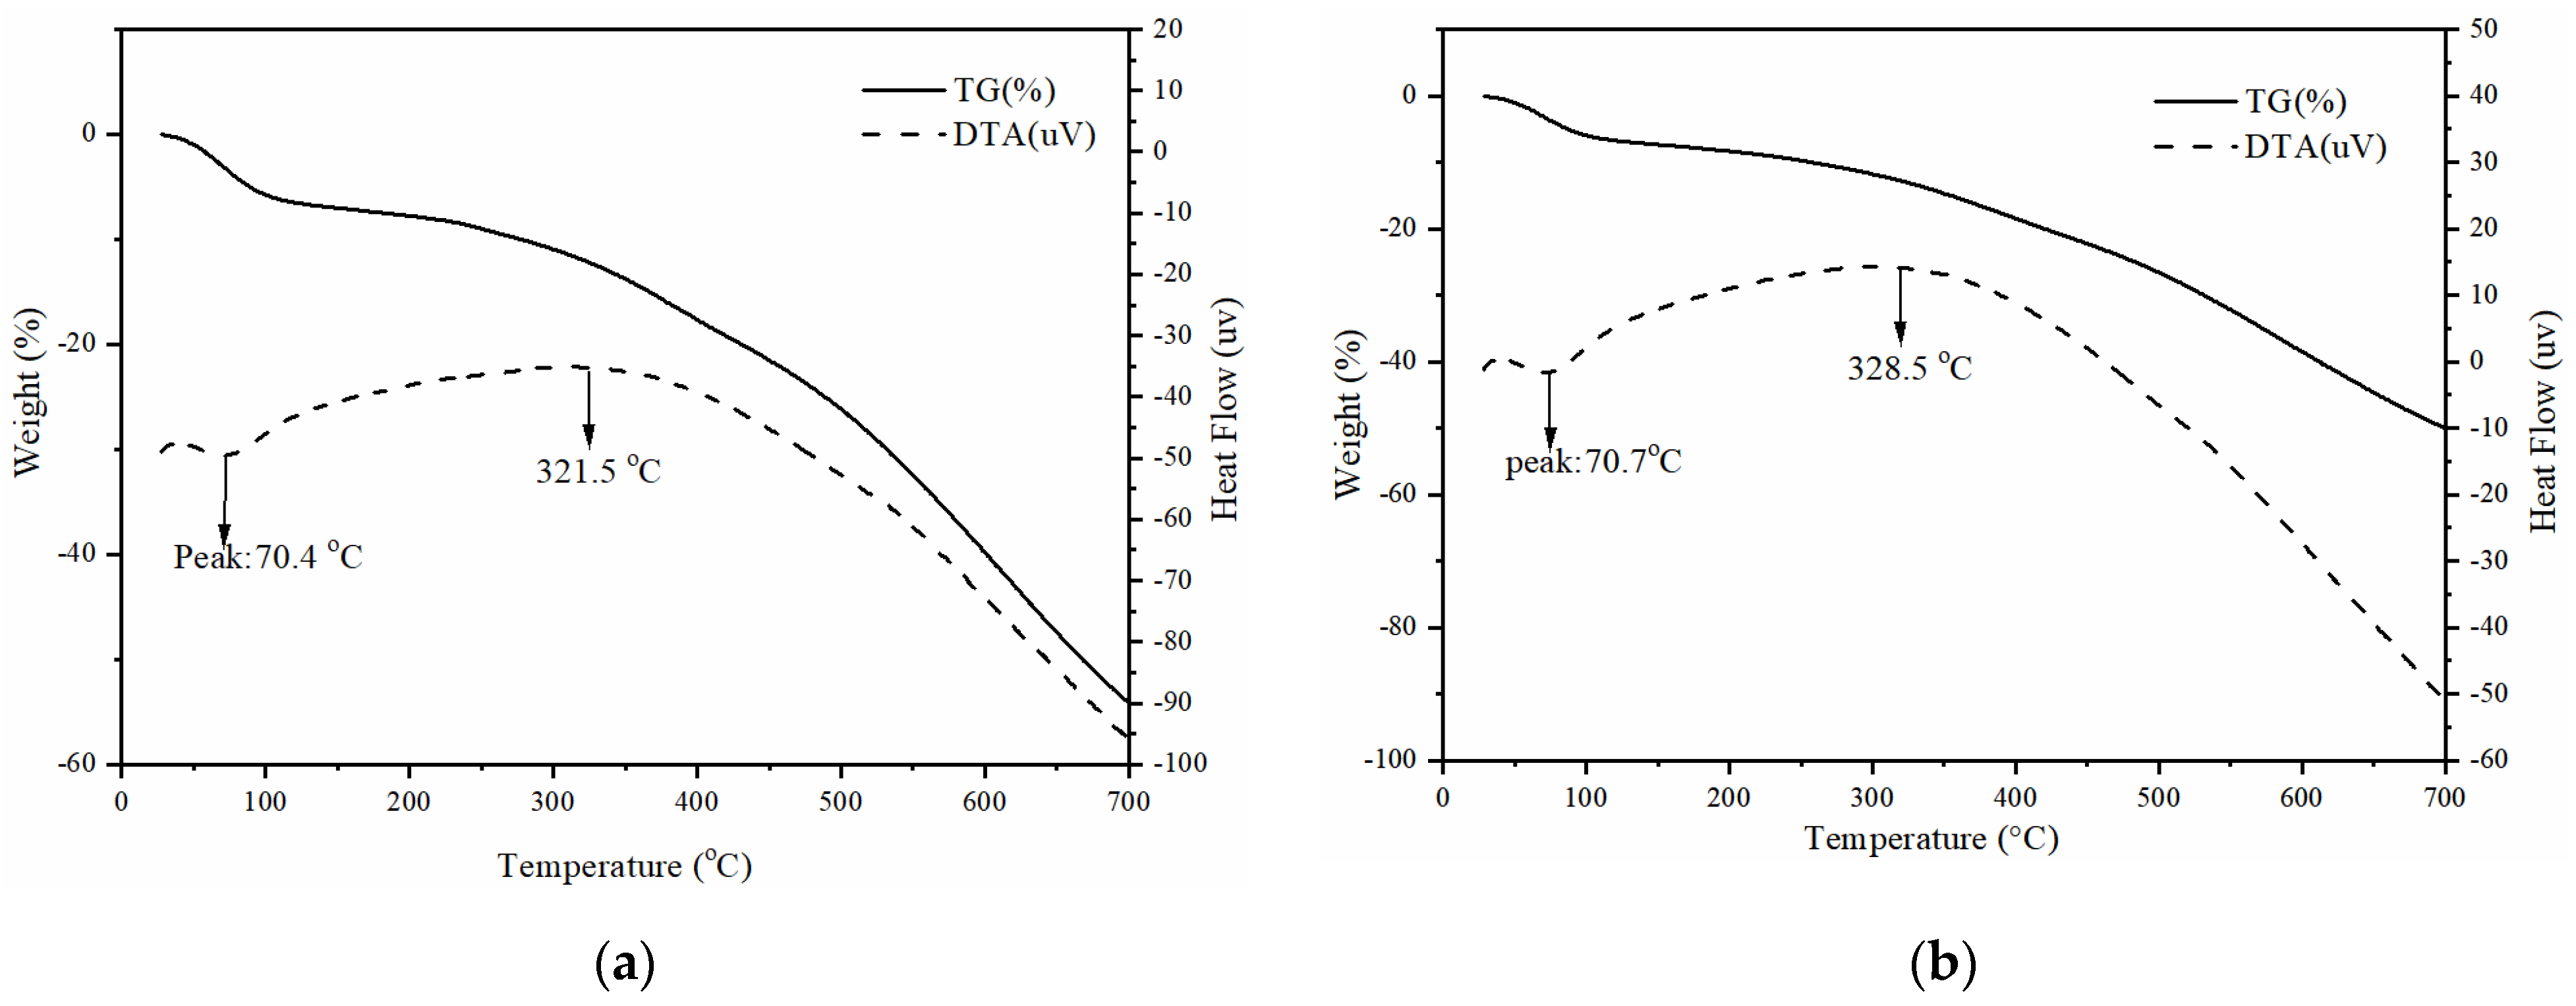
The thermal stability of the pre-AMBC and AMBC was investigated using TG-DTA, and the results are shown in Figure 4. During the heating process from 28 °C to 700 °C, the total weight loss of AMBC was 49.8%. Specifically, AMBC lost 6.0% of its weight from 28 °C to 100 °C, and the corresponding DTA temperature was 70.7 °C. This weight loss was primarily due to the removal of physically adsorbed water in the solid acid. Water molecules may be physically adsorbed or bound to the surface of AMBC adsorbents through hydrogen bonds. A slow weight loss occurred between 100 °C and 227 °C, and the mass change was not obvious. As the temperature rose above 227 °C, the thermogravimetric curve began to decrease. The 4.4% weight loss from 227 °C to 330 °C was attributed to the thermal decomposition of -SO3H groups as well as the condensation and structural reforming of carbon-based materials [38]. The DTA curve showed a decreasing trend after 328.5 °C, indicating that the sample was undergoing endothermic processes as well. Subsequently, beyond 330 °C, there was a notable weight loss of 36.6%, which was due to the continuous carbonization of the AMBC at high temperatures.
Based on the TG-DTA curve of the pre-AMBC in Figure 4a, it can be seen that the trend of the TG curve of the pre-AMBC is consistent with that of the AMBC. Throughout the entire temperature range (28–700 °C), the weight loss rate of the adsorbent reached 54.0%. The corresponding DTA temperature was 70.4 °C, which was consistent with the endothermic peak of AMBC, indicating that it also contributed to the removal of physically adsorbed water from the biochar.

3.2. Pb(II) Adsorption by AMBC

3.2.1. Effects of Contact Time

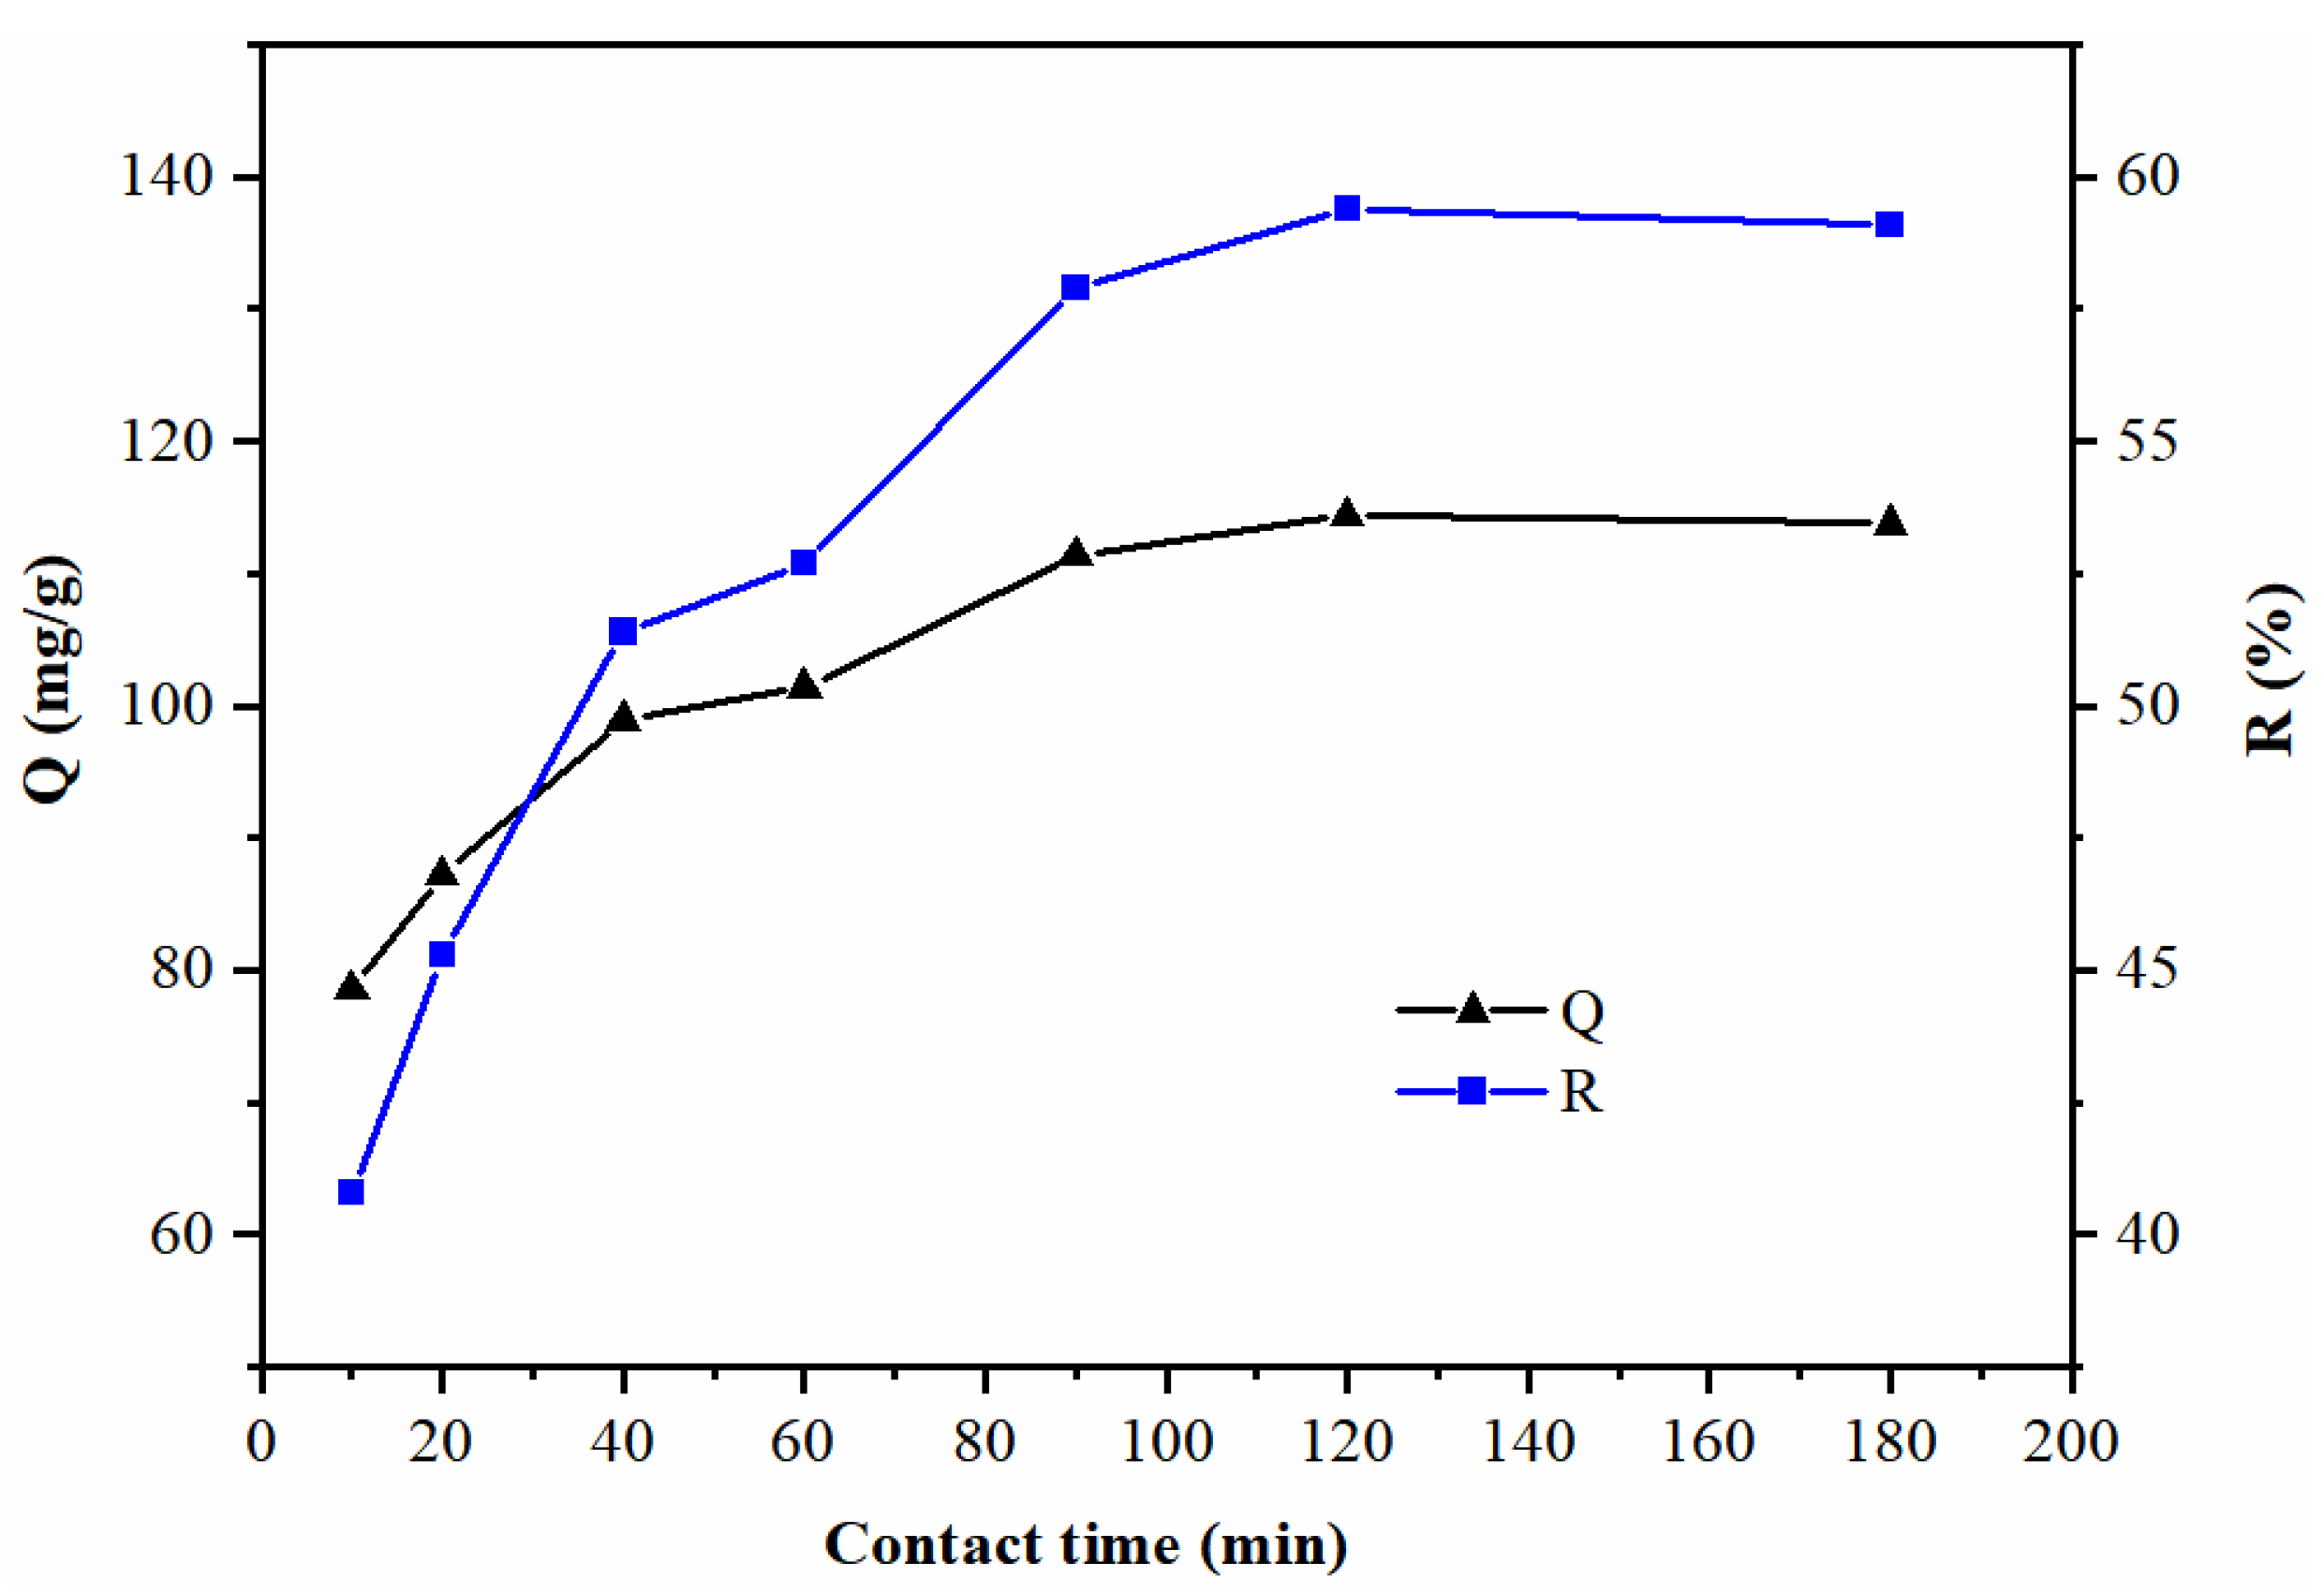
The effects of contact time between the adsorbent and Pb(II) on the adsorption performance were investigated, and the results are shown in Figure 5.
As the time increased, both the removal ratio and adsorption capacity gradually increased. A significant growth in the adsorption capacity was observed when the contact time was extended from 10 min to 90 min, with the removal ratio rapidly increasing from 40.8% to 57.9%. This increase can be due to the high concentration of Pb(II)-containing solution and the presence of a large number of active sites on the surface of the solid acid at the initial stage of adsorption [39]. Subsequently, as the amount of adsorbed Pb(II) accumulates, most of the adsorption sites become occupied, leaving fewer unoccupied sites [40].
Moreover, the adsorbed Pb(II) repels the free Pb(II) in the solution via electrostatic repulsion, leading to a gradual decrease in the adsorption rate until an equilibrium is reached. At a contact time of 120 min, the removal ratio was 59.4%. Prolonging the adsorption time beyond this point did not significantly alter the removal ratio. At this point, the rate of adsorption and desorption were the same, indicating that the adsorption had reached a dynamic equilibrium [41]. In summary, during the adsorption process, both the removal ratio and adsorption capacity increased rapidly with contact time and then gradually reached an equilibrium. The adsorption capacity reached a maximum after 120 min (114.4 mg/g) and remained essentially constant thereafter.

3.2.2. Effects of pH Value

The adsorption of Pb(II) in solution by the adsorbents is strongly influenced by the pH value, as it determines the chemistry properties of the adsorbent surface and the types of metal ions. In general, the adsorption of cations is favored at pH > pHPZC [42]. If the pH value is lower than pHPZC, the zeta potential of the biochar expresses a net positive charge, which is responsible for the electrostatic repulsion of Pb(II) [43]. As the pH increases, this repulsive force becomes less and less intense. When the solution pH exceeds 6, Pb(II) gradually forms a Pb(OH)2 precipitate [44], which is unfavorable for adsorption. Therefore, considering the influence of PHPZC and avoiding precipitation, the pH was adjusted within the range of 3–6 for this experiment, and the experimental results are shown in Figure 6.
When the pH value was 3, the removal ratio of AMBC to Pb(II) was fairly low, at 59.4%. As the pH value increased, the removal ratio gradually increased. When the pH value reached 5, the adsorption capacity and removal rate reached the maximum values of 148.6 mg/g and 76.0%, respectively. However, as the pH continued to increase to 6, the adsorption performance decreased slightly.
In the lower pH range, the removal ratio and adsorption capacity are limited. This is due to two factors: competitive adsorption of active sites by H+ and Pb(II) [43] and the presence of a high concentration of H+ inhibiting the dissociation of weakly acidic groups such as -COOH, thus reducing the availability of active sites on the AMBC surface [27]. With the increase in pH value, the competition between Pb(II) and H+ decreases, while the number of active sites on the AMBC surface increases, leading to a gradual increase in the removal ratio until it reaches an adsorption equilibrium.

3.2.3. Effects of the Dosage of AMBC

In the adsorption process, the adsorbent dosage is a significant factor that affects the adsorption performance. Additionally, it is also a crucial indicator of the economic cost associated with the adsorbent. The effects of AMBC dosage on its adsorption of Pb(II) are shown in Figure 7.
The removal ratio of Pb(II) increased with higher AMBC dosages. With the dosage of AMBC increased from 0.1 g/L to 0.5 g/L, the removal ratio of Pb(II) rapidly increased from 25.5% to 76.0%. As the dosage of AMBC reached 0.9 g/L, the removal ratio plateaued at 94.9%, followed by a slight increase as the AMBCA dosage further increased. At lower AMBC dosages, there were fewer active adsorption sites on its surface, leading to lower removal ratios. With increasing dosages, the number of adsorption active sites increased, and the removal ratio gradually increased until it reached saturation.
The adsorption capacity of AMBC decreased as its dosage increased. When the dosage was small, the relative amount of Pb(II) per unit mass of AMBC was higher, leading to a large mass transfer driving force. However, when the amount of AMBC was excessive, a significant number of adsorption sites remained vacant, resulting in unnecessary waste. In addition, higher dosages could cause agglomeration of the AMBC, reducing the total adsorption surface area and leading to a lower adsorption capacity [45,46].

3.2.4. Effects of Initial Pb(II) Concentration

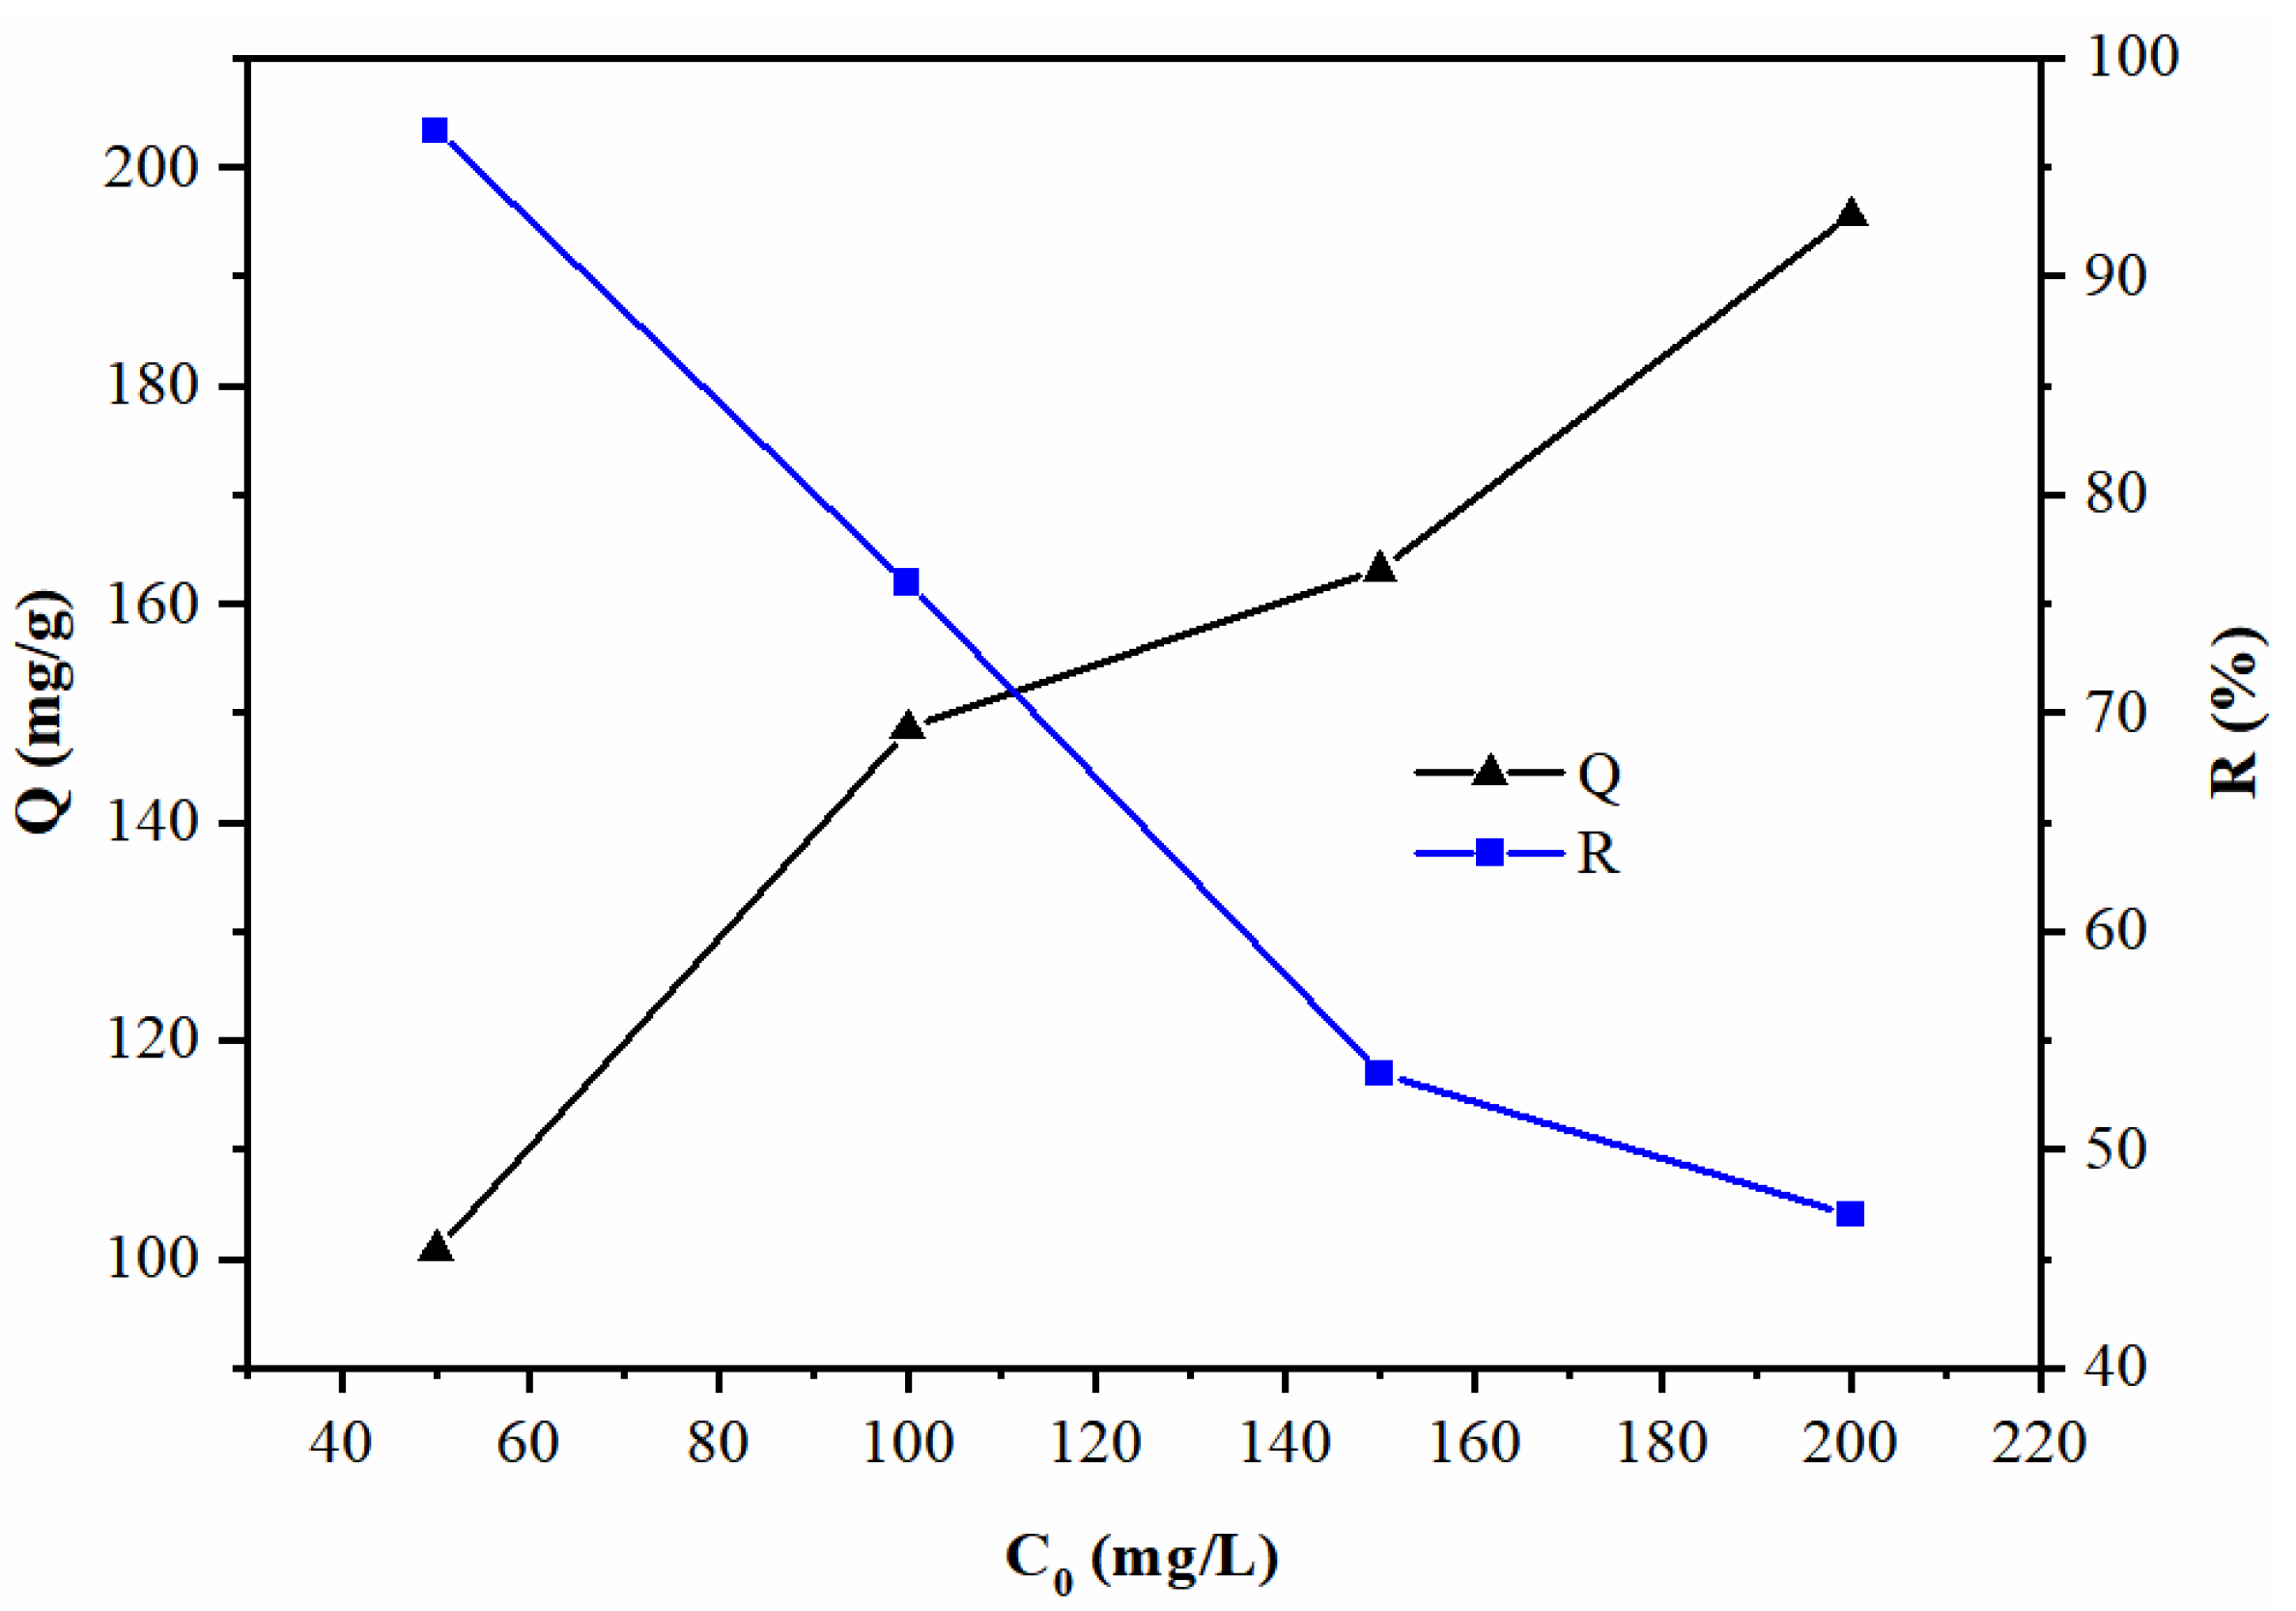
Figure 8 displays the effects of the initial concentration of Pb(II) on the adsorption performance of the AMBC.
In the entire concentration range studied, as the initial concentration increased, the adsorption capacity of AMBC exhibited almost linear growth. The adsorption capacity of AMBC increased rapidly from 100.8 mg/g to 195.6 mg/g as the initial concentration of Pb(II) was increased from 50 mg/L to 200 mg/L. However, the removal ratio of Pb(II) decreased as the initial Pb(II) concentration increased. This can be attributed to the enhanced migration of ions to the AMBC surface due to the increased concentration, allowing Pb(II) to more fully diffuse into the vicinity of active sites and thereby increasing the adsorption capacity. However, as the active sites on the surface of AMBC became gradually occupied, the excess Pb(II) in the solution could not be adsorbed and remained free. Due to the limited adsorption sites on the surface of the adsorbent and electrostatic repulsion, the removal ratio of the AMBC decreased significantly with increasing concentrations [43].

3.3. Comparison of Pre-AMBC and AMBC with Other Adsorbents

The adsorption experiments were carried out using AMBC and pre-AMBC as the adsorbents, and the experimental data are shown in Table 2. Under the optimal adsorption conditions, the Pb(II) removal ratio and adsorption capacity of the pre-AMBC reached 39.7% and 83.1 mg/g, respectively, which were much lower than the values for AMBC. After being modified by concentrated H2SO4, the adsorption capacity of AMBC was greatly increased.
The results of the acid–base titration showed that there were -SO3H groups (0.52 mmol/g) on the surface of the AMBC, and the density of -COOH and -OH was higher than that of the pre-AMBC. The presence of acidic oxygen-containing functional groups enhanced the affinity of the adsorbent for metals and the ion-exchange capacity [27]. These groups resulted in very low zero-point charge values, greatly increasing the surface charge, which improved the accessibility of Pb(II) to enter the internal pores [28].
Table 3 shows a comparison of the adsorption performance of AMBC with various modified biochars for Pb(II). The results indicate that AMBC exhibits a superior adsorption efficiency at lower adsorbent dosages, making it a hopeful candidate to remove Pb(II).

3.4. Pb(II) Adsorption Isotherms

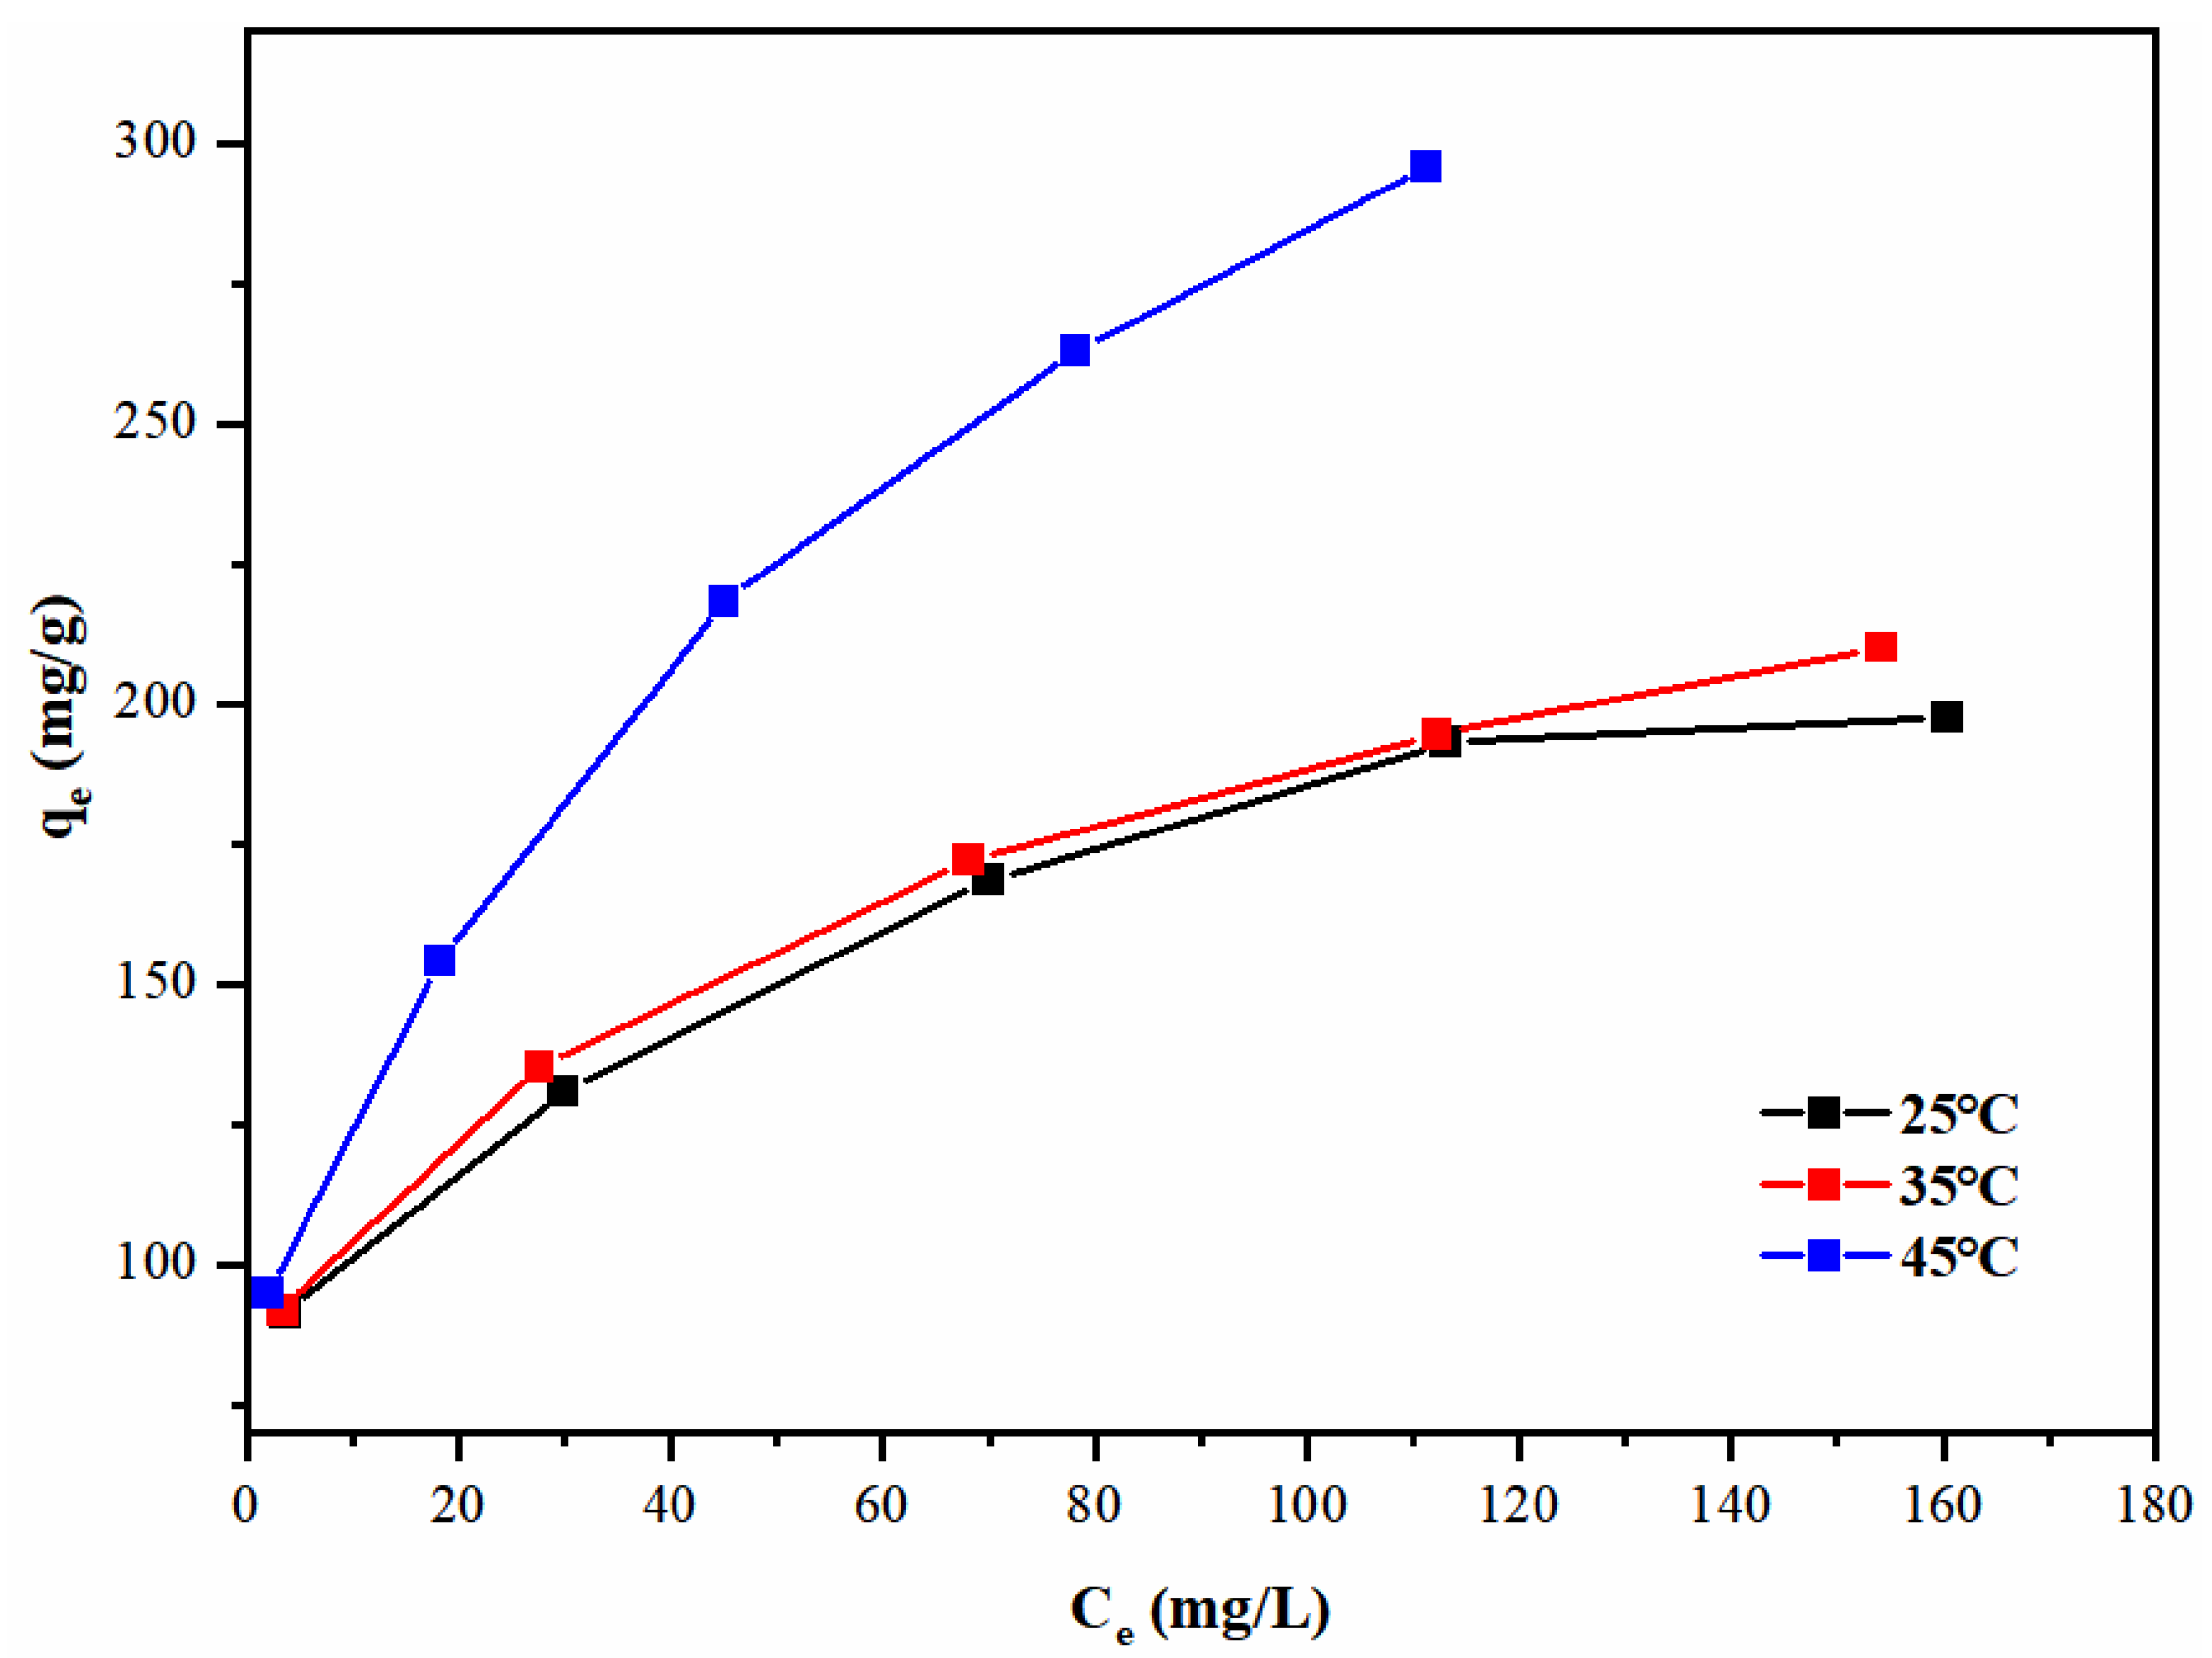
Adsorption experiments were carried out by mixing AMBC with varying concentrations of Pb(II) solution (50–250 mg/L) at different temperatures (25–45 °C) and shaking the mixture on a shaker at 130 rpm for 180 min. Figure 9 shows the isothermal adsorption line of Pb(II) adsorption by the AMBC.
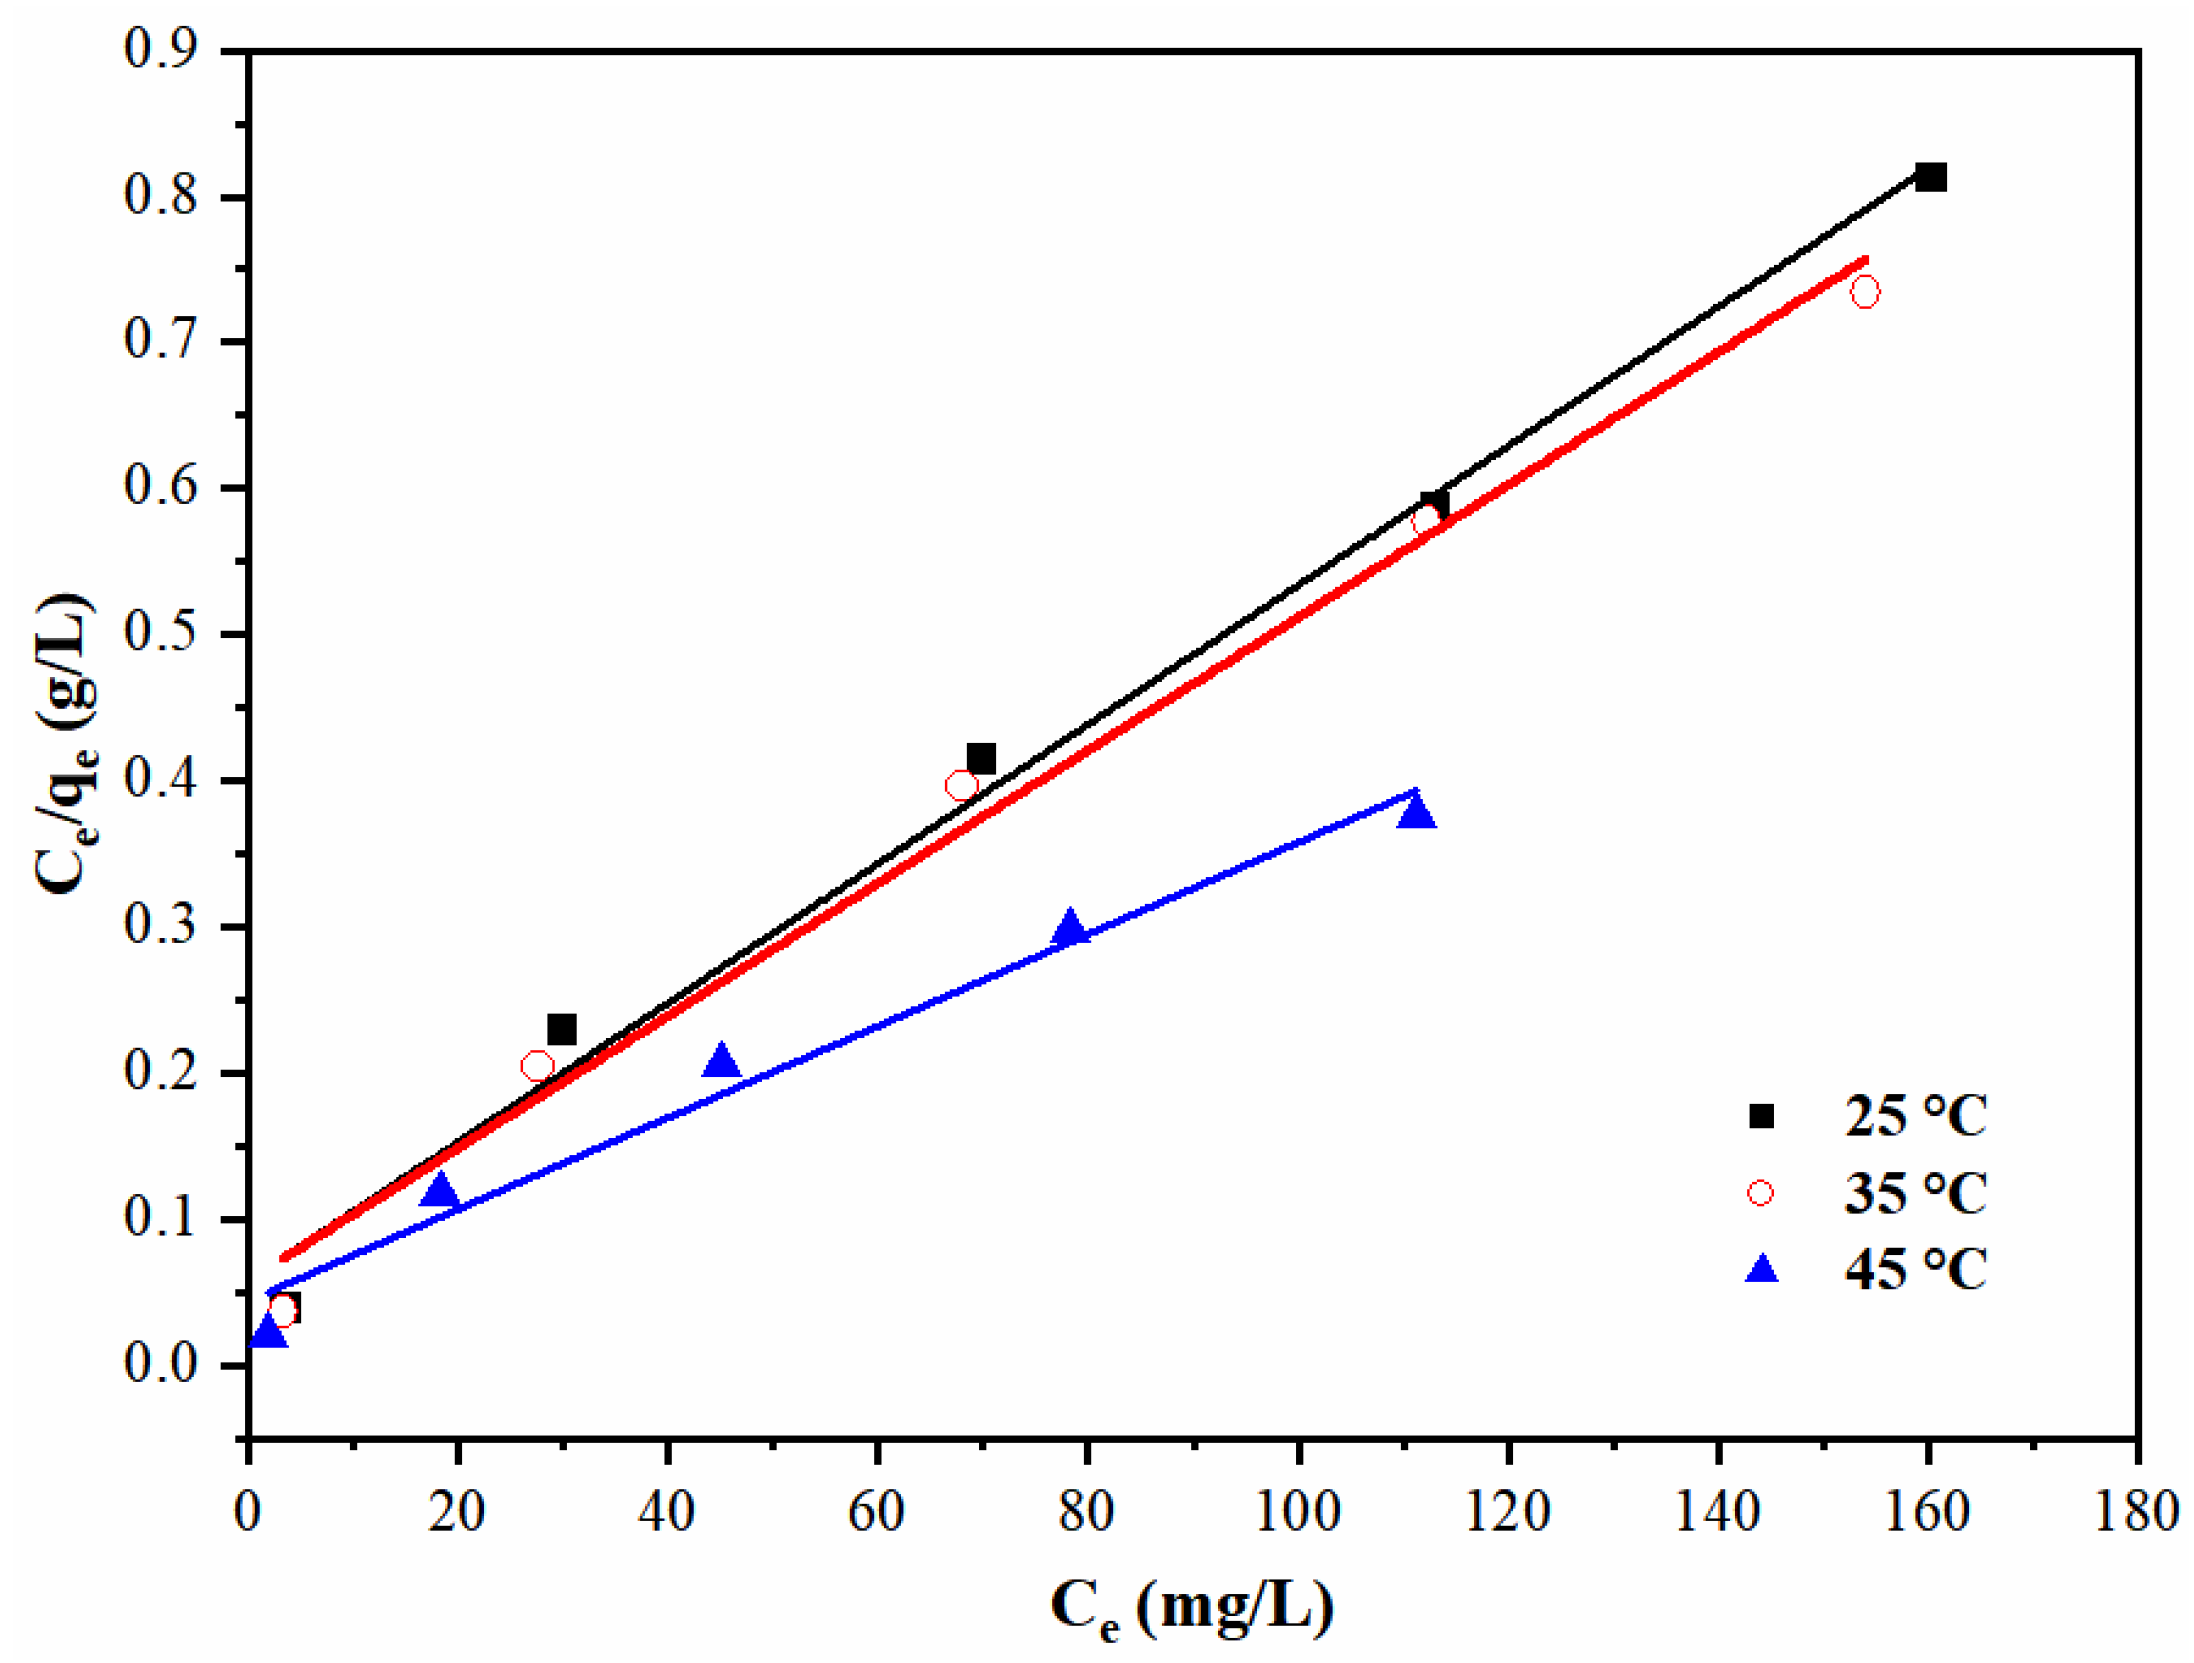
As the temperature rose, the adsorption of Pb(II) on the adsorbent also increased, indicating that the adsorption process was an endothermic reaction [49]. Then, Langmuir and Freundlich isothermal models were used to fit the experimental data, and the results are shown in Figure 10 and Figure 11. The adsorption modelling parameters are listed in Table 3.
The linearization equations of the two adsorption models are as shown in Equations (5) and (6):
Langmuir model:
C e q e = C e q m + 1 K L q m ,
Freundlich model:
l n q e = 1 n l n C e + l n K F ,
where Ce is the Pb(II) equilibrium concentration, mg/L; qe is the adsorption capacity at the adsorption equilibrium of AMBC, mg/g; qm is the maximum adsorption capacity of AMBC, mg/g; KL and KF are the constants of the Langmuir and Freundlich isotherms respectively, L/mg; and n is an empirical constant that indicates the adsorption intensity. It varies depending on the heterogeneity of the materials used as adsorbents.
Based on the data in Table 4, it can be seen that the maximum adsorption capacity qm and Langmuir adsorption constant KL of AMBC for Pb(II) rise with increasing temperature, indicating that this process is endothermic. The factorless separation factor (RL) listed in Table 4, which is calculated using Equation (7), reflects the basic features of the Langmuir isotherm equation.
R L = 1 1 + K L c 0 ,
For the Langmuir model, when RL = 0, the adsorption is considered irreversible; when 0 < RL < 1, adsorption occurs relatively easily; when RL > 1, the adsorption process is challenging to achieve; while RL = 1 indicates linear adsorption. The RL values obtained indicate that AMBC can easily adsorb Pb(II).
For the Freundlich model, a favorable adsorption process occurs when 0 < 1/n < 1. In Table 4, all the values of 1/n are less than 1, indicating that this process is favorable and consistent with the analysis of the Langmuir model.

3.5. Thermodynamic Study of the Adsorption

The thermodynamic activation parameters of Pb(II) on AMBC were determined using the equilibrium adsorption data obtained at different temperatures. These parameters include entropy change (ΔS), enthalpy change (ΔH), and free energy change (ΔG) for the adsorption of Pb(II).
These parameters were calculated using the following Equations (8) and (9):
Δ G = R T l n K d ,
l n K d = Δ S R Δ H R T ,
In these equations, Kd denotes the adsorption equilibrium constant. Kd can be obtained by performing a linear fit of qe against ln(qe/Ce), and the resulting linear intercept will yield Kd.
Table 5 shows that the ΔG is negative for each temperature under investigation, indicating that the adsorption of Pb(II) by AMBC is a spontaneous process. The positive value of ΔH demonstrates the endothermic properties of the Pb(II) adsorption, which may be due to an increase in the internal diffusion rate of Pb(II) in the AMBC particles with increases in temperature. Moreover, the ΔS value of the AMBC is positive, indicating a higher molecular disorder for the whole adsorption process due to mass transfer on the solid–solution interface.

3.6. Kinetics Study of the Adsorption

To evaluate the activation energy and rate of the adsorption of Pb(II) by AMBC, sorption kinetic experiments were carried out. The effects of temperature on the adsorption of Pb(II) was investigated through time-based analyses. The adsorption experiments were performed under the following conditions: a dosage of AMBC of 0.5 g/L, solution pH of 5, initial Pb(II) concentration of 100 mg/L, and oscillation rate of 130 rpm.
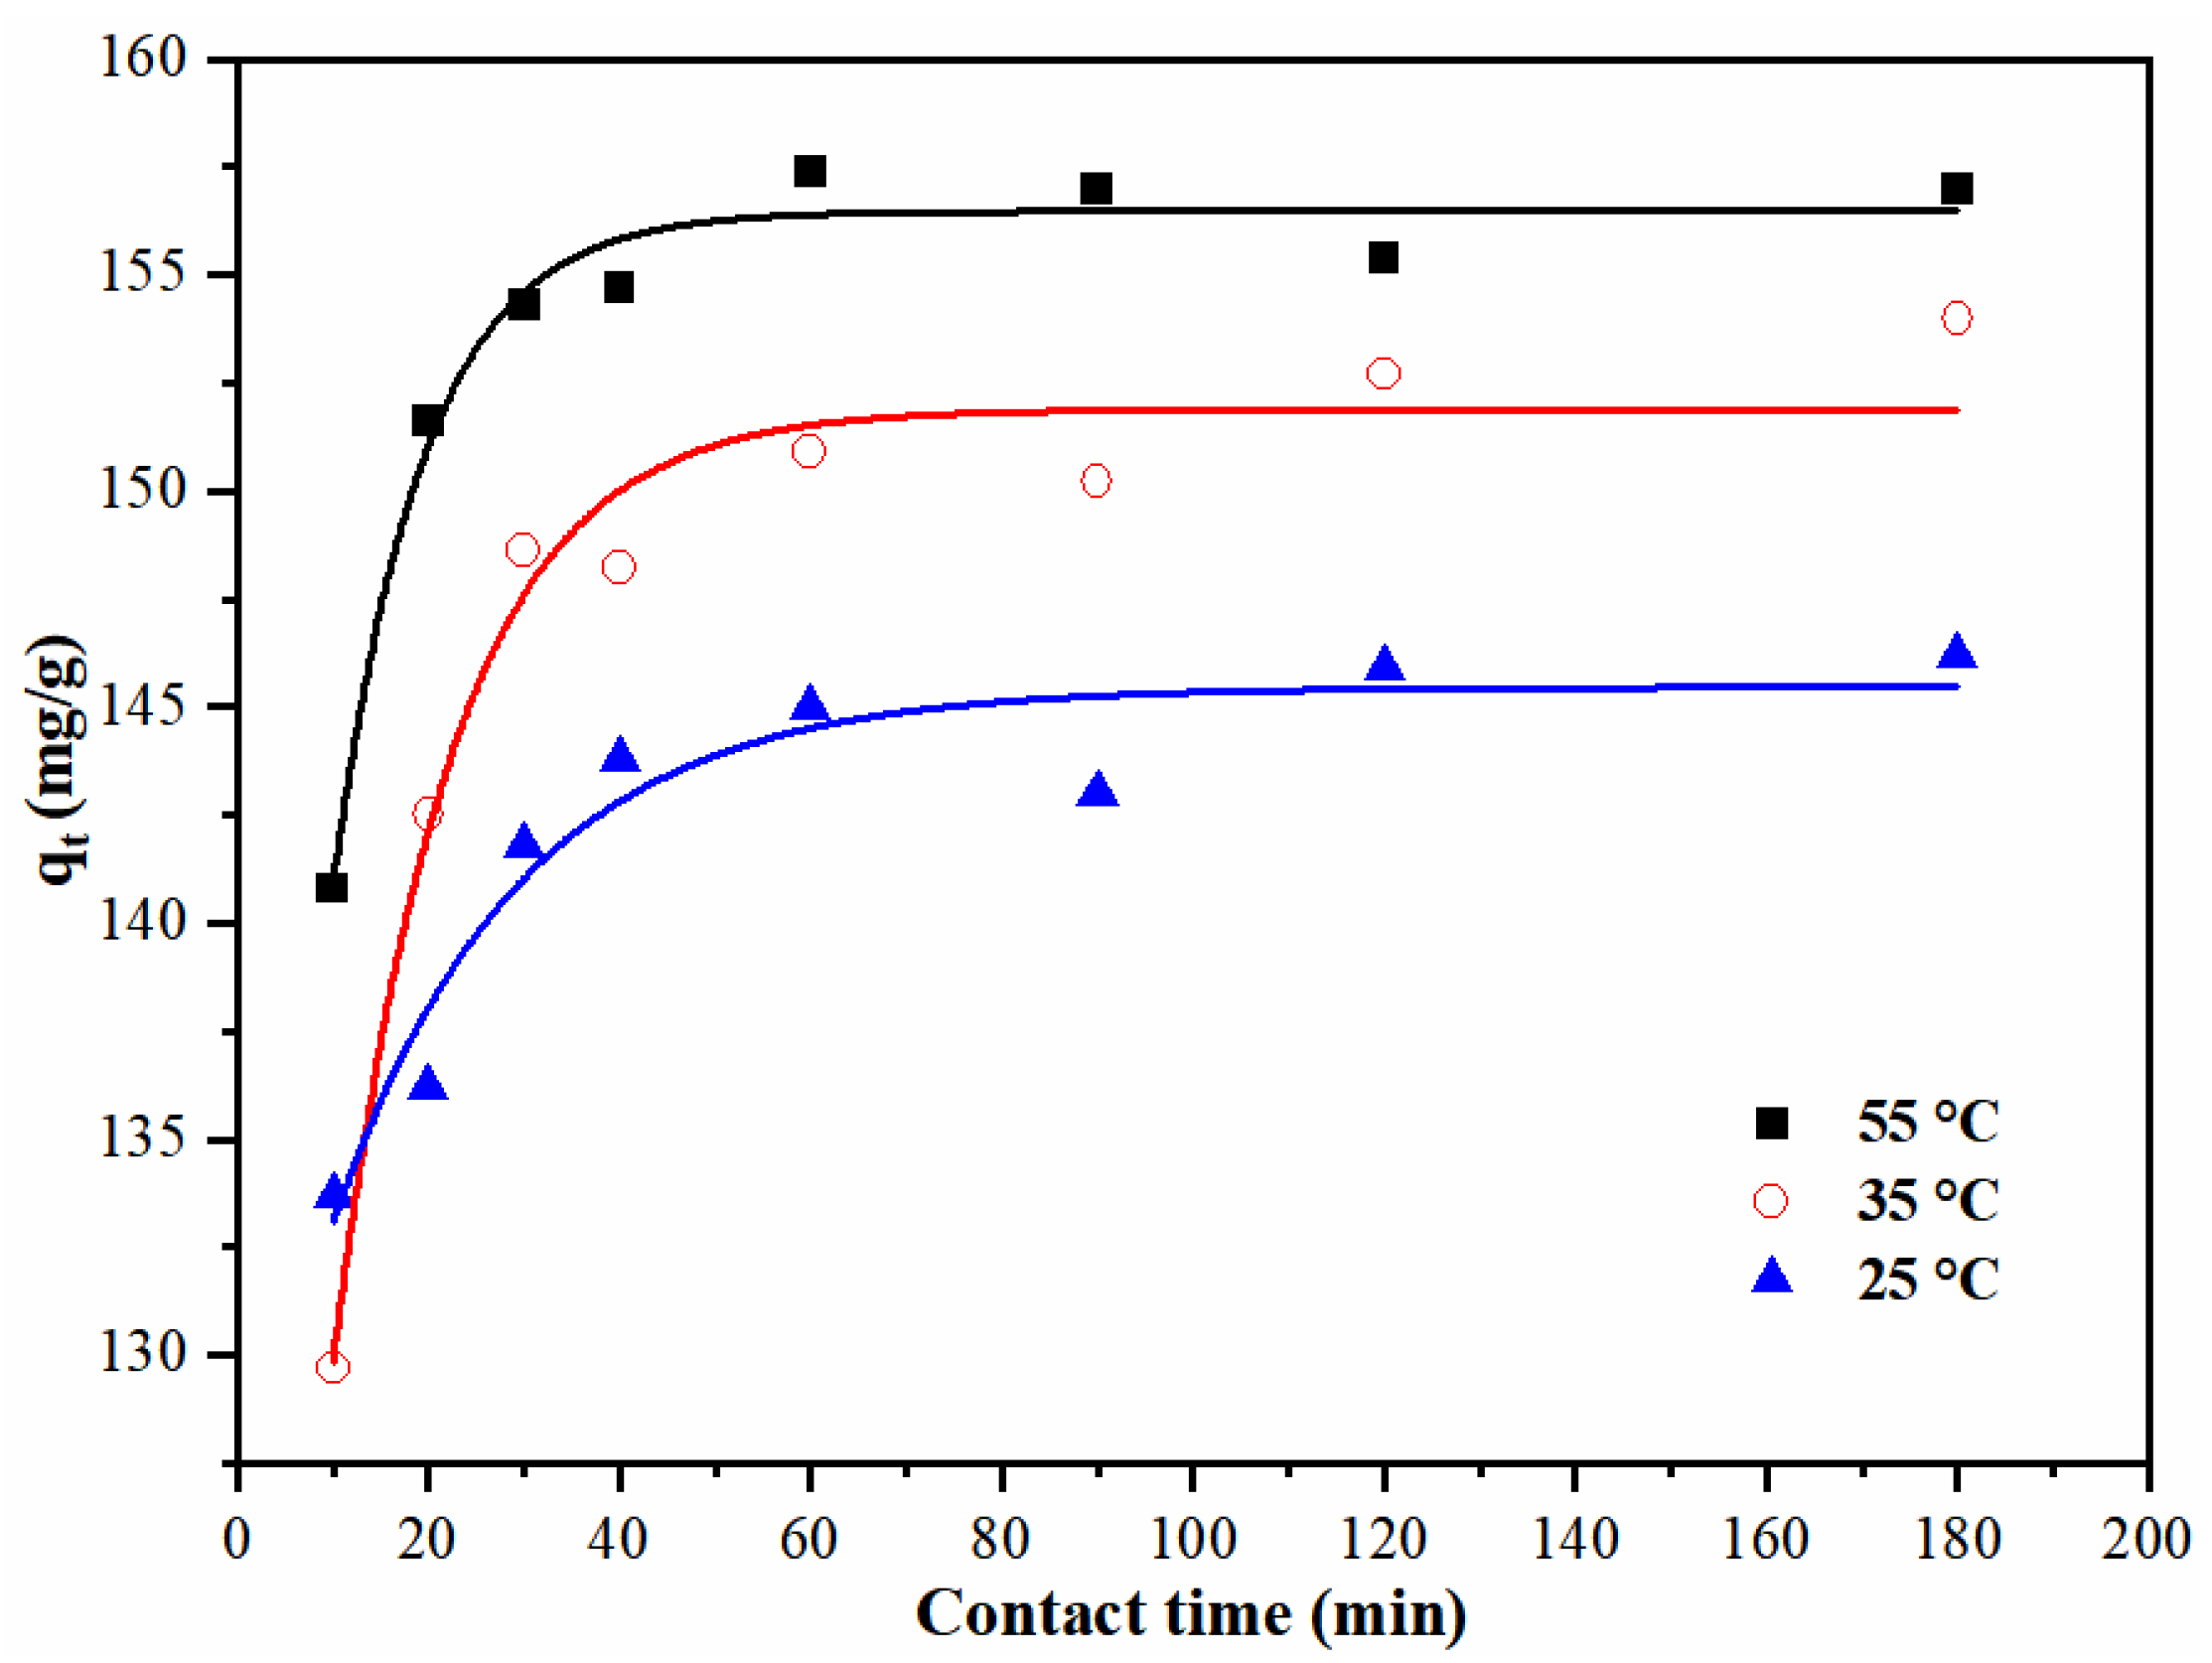
The effects of temperature and contact time on the adsorption by AMBC are shown in Figure 12. It is evident from the adsorption curves that there was a steep increase within the first 40 min for AMBC, indicating that an increase in temperature is beneficial for adsorption. As time progressed, the adsorption curves tended to rise slowly, ultimately reaching equilibrium after 60 min.
In order to gain insight into the rate-limiting steps of Pb(II) adsorption by AMBC, linearized pseudo-second-order kinetic models were employed. The equations for the pseudo-second-order kinetic model are shown in Equation (10).
d q t d t = K a d s ( q e q t ) 2 ,
Its linearized equation is given in Equation (12):
t d t = 1 K a d s q e 2 + 1 q e t ,
where qt is the adsorption capacity at time t, mg/g; qe is the adsorption capacity at adsorption equilibrium, mg/g; and Kads is the constant of the pseudo-second-order kinetic model, g/mg.min.
The experimental data on the adsorption of Pb(II) by AMBC at different temperatures were fitted by using the pseudo-second-order model (Equation (10)), and the results are shown in Figure 13 and Table 6. The pseudo-second-order model provides the best fit to the experimental data for the AMBC (R2 = 0.99). The constant of the pseudo-second-order kinetic model, kads increased with increasing adsorption temperatures, and the equilibrium adsorption quantity, qe exhibited a similar pattern of change. This suggests that higher temperatures favor the adsorption of Pb(II) from aqueous solutions by AMBC, which is in agreement with the results of the thermodynamic analysis. In addition, the pseudo-second-order model also indicates that the adsorption rate of Pb(II) by AMBC is affected by both adsorbents and adsorbates [50].
The Arrhenius equation (Equation (12)) can express the relationship between kads and the temperature T:
l n K a d s = l n A E a R ( 1 T )
where A is the collision frequency factor, g/mg·min; R is the ideal gas constant, 8.314 J/mol·K; and Ea is the activation energy of adsorption, J/mol.
Using the data in Table 6, lnKads and 1/T were plotted and fitted linearly, and the results are shown in Figure 14.
The linear fitting equation in Figure 14 is y = −0.3317 − 1442.91x. By utilizing this equation, the activation energy for the adsorption by AMBC is calculated to be 11.99 kJ/mol. Typically, the activation energy for physical adsorption is less than 4 kJ/mol [51], indicating that the rate-controlling step of AMBC adsorption for Pb(II) is chemical adsorption.

3.7. Possible Adsorption Mechanisms

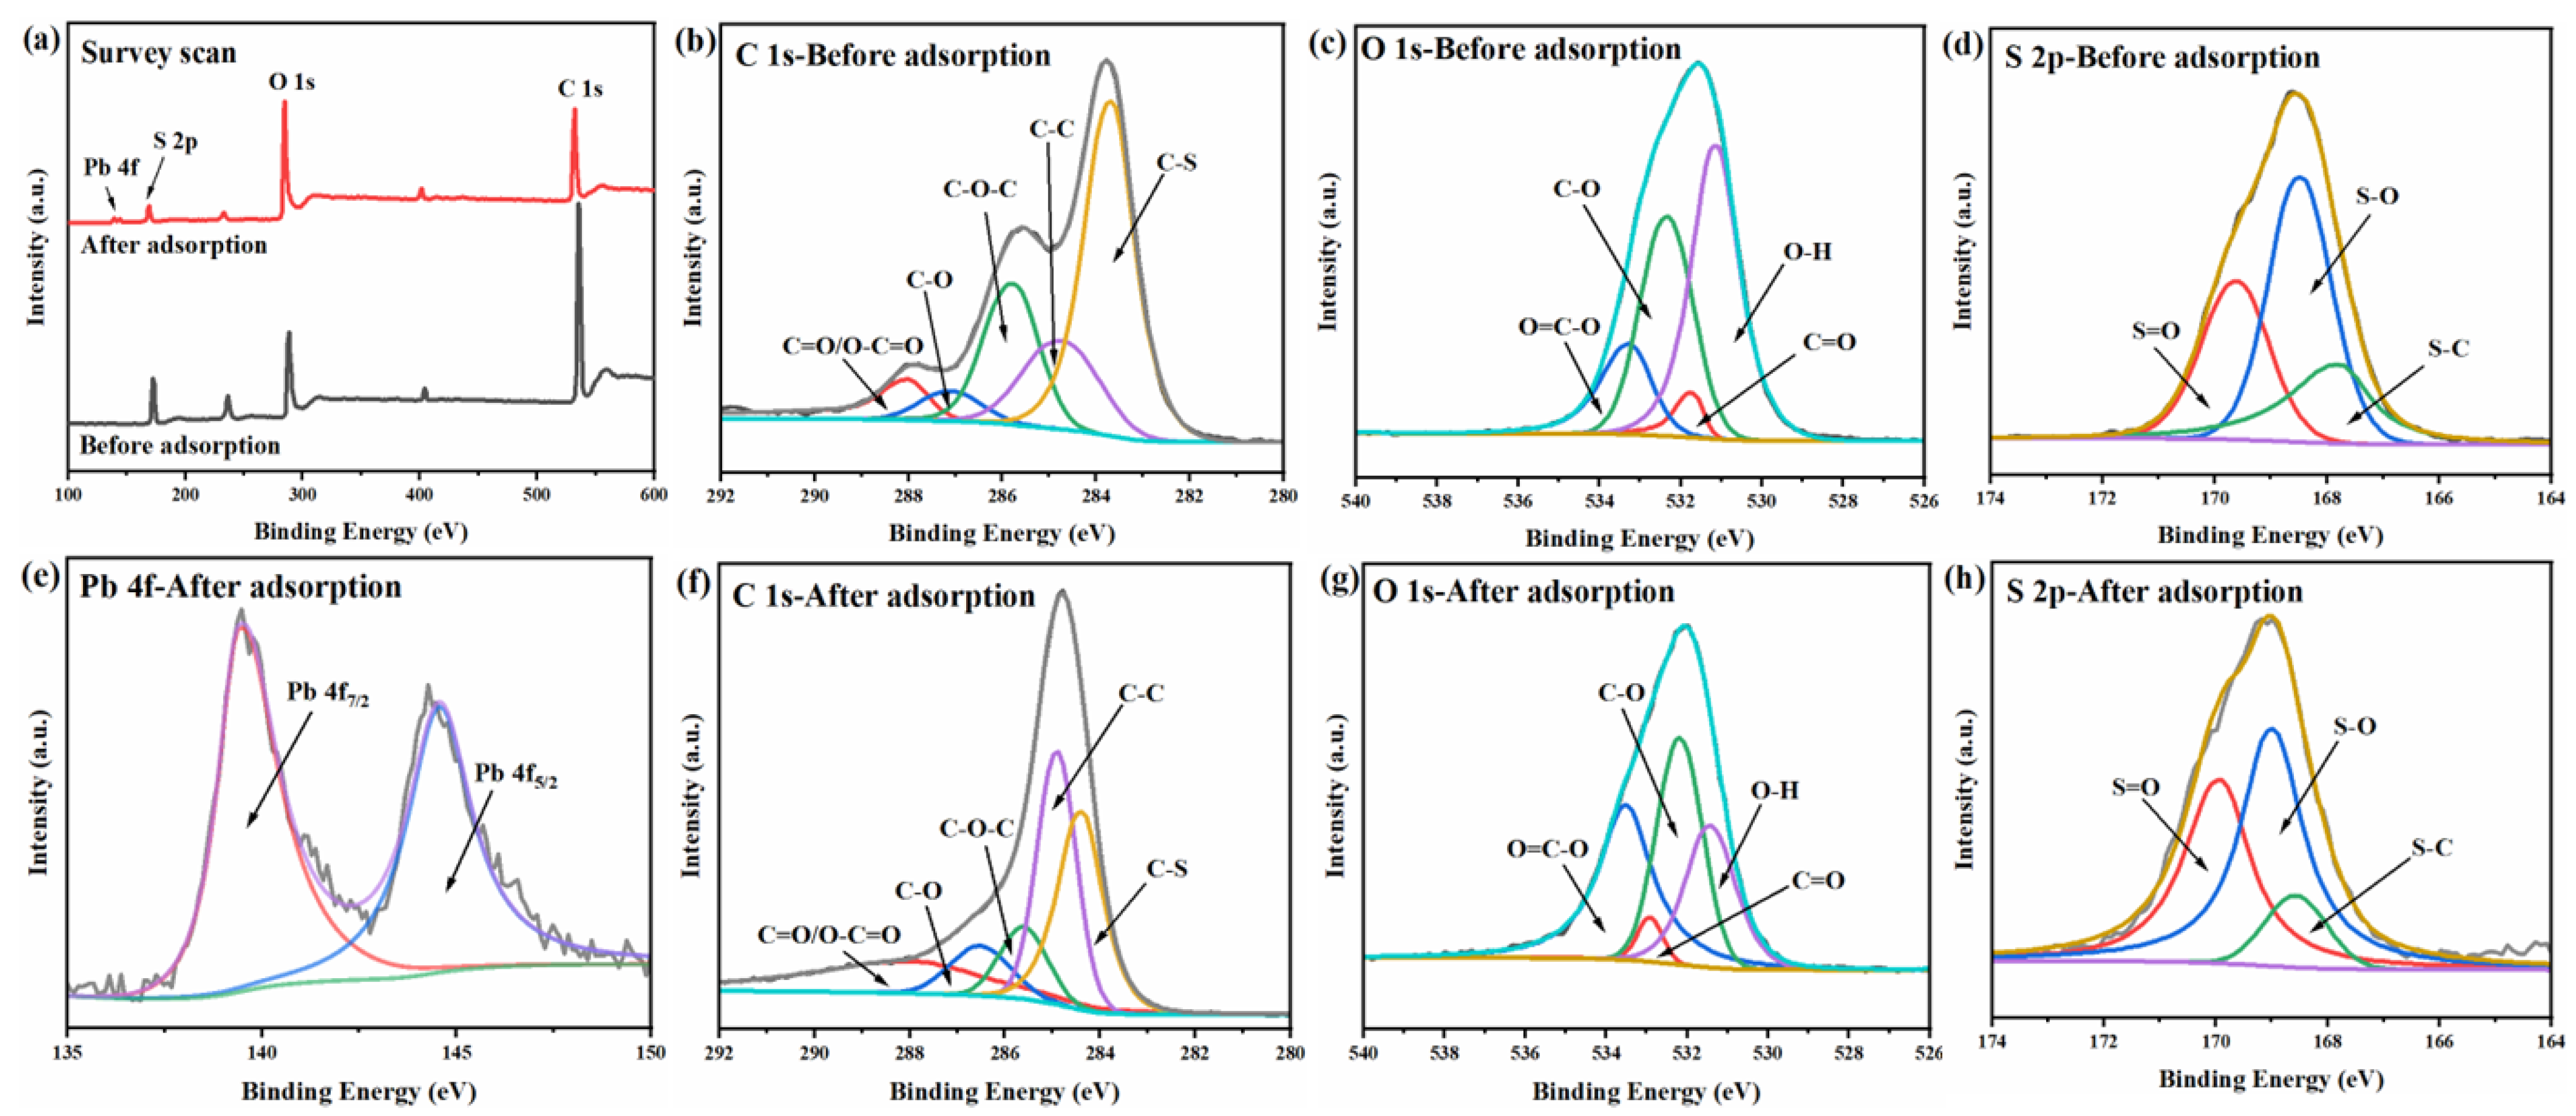
XPS can be used to determine the surface functional groups of the adsorbent as well as the state of the adsorbed metals, making it an important technique for adsorbent surface analysis. In order to better understand the possible adsorption mechanism, the XPS before and after Pb(II) adsorption by AMBC was analyzed, and the results are shown in Figure 15. The respective peaks of C 1s were deconvoluted into several possible spectra, having varied contents of oxygen-containing functional groups such as C=O/O-C=O (283.35 eV), C-O (286.36 eV), C-O-C (285.08 eV), C-C (284.69 eV), and C-S (284.23 eV) [52]. The O 1s peak spectrum can be deconvolved into four peaks located at 531.16 eV, 531.94 eV, 532.85 eV, and 533.68 eV, which are attributable to O-H, C=O, C-O, and O=C–O [27]. As shown in Figure 15d, there were three peaks at 169.07 eV, 168.44 eV, and 167.76 eV in the S 2p spectrum, corresponding to S=O, S-O, and S-C [53]. The XPS spectra of AMBC further confirmed that the sulfonated biochar formed -SO3H groups on the carbon framework after sulfonation. In summary, acidic oxygen-containing functional groups such as -OH, -COOH, and -SO3H were successfully connected on the surface of AMBC, which was consistent with the results of the FT-IR.
It can be seen from Figure 15a that a new peak corresponding to Pb 4f appeared on the AMBC spectrum after Pb(II) adsorption, which indicates that Pb(II) ions were successfully adsorbed to the surface of the biochar [8]. The characteristic peak of Pb demonstrated a nonstoichiometric adsorption behavior, which could be generally resolved into Pb 4f7/2 and Pb 4f5/2, with clear bands around 138.72 eV and 143.57 eV [5]. After the adsorption process, the intensity of the O 1s and S 2p peaks decreased obviously, which may be the result of the interaction between -SO3H functional groups and Pb(II). In addition, after the adsorption of Pb(II), the intensity of the C-S and O-H functional groups decreased obviously, which indicated that the acidic oxygen-containing functional groups played a leading role in the adsorption of Pb(II).
Comparing the XPS spectra before and after the adsorption of Pb(II), it can be inferred that the acidic oxygen-containing functional groups could promote the binding of AMBC and Pb(II), thus effectively removing the Pb(II) from the water.

4. Conclusions

A biochar precursor (pre-AMBC) was prepared from agricultural waste peanut shells, then treated with concentrated H2SO4 to give an acidic group-modified biochar (AMBC). These materials were subsequently used as an adsorbent for the removal of Pb(II) from aqueous solutions. The following conclusions were reached:
(1)
The optimal adsorption performance of AMBC for heavy metal ions in water occurred when the initial concentration of Pb(II) was 100 mg/L, the pH was 5, the dosage of the adsorbent was 0.5 g/L, and the contact time was 120 min. Under these optimal conditions, the Pb(II) removal ratio was 76.0% and the adsorption capacity was 148.6 mg/g, which was much better than the pre-AMBC.
(2)
It is believed that the higher acid content of the AMBC, along with the introduction of the -SO3H groups, imparts greater electronegativity, stronger complexation, and more active adsorption sites to the AMBC, thereby enhancing its ability to adsorb Pb(II) in aqueous solution.
(3)
The adsorption system followed a pseudo-second-order kinetic model and reached an equilibrium after 90 min. Chemisorption was the rate-limiting step. The adsorption isothermal data showed that the equilibrium adsorption of Pb(II) by AMBC increased with increasing adsorption temperatures, indicating a heat-absorbing process.

Author Contributions

Y.W.: data curation, methodology, formal analysis, investigation, writing—original draft, visualization. C.L.: data curation, methodology. Z.W.: investigation, methodology. F.L.: conceptualization, writing—review and editing. J.L.: methodology, supervision. W.X.: writing—review and editing, funding acquisition. X.Z.: formal analysis, conceptualization, funding acquisition, supervision. All authors have read and agreed to the published version of the manuscript.

Funding

This research received no external funding.

Data Availability Statement

The original contributions presented in this study are included in the article materials; further inquiries can be directed to the corresponding author.

Acknowledgments

We sincerely thank all those who worked so hard on this study and provided characterization.

Conflicts of Interest

The authors declare no conflicts of interest.

References

  1. Ifthikar, J.; Shahib, I.I.; Sellaoui, L.; Jawad, A.; Zhao, M.; Chen, Z.; Chen, Z. pH tunable anionic and cationic heavy metal reduction coupled adsorption by thiol cross-linked composite: Physicochemical interpretations and fixed-bed column mathematical model study. Chem. Eng. J. 2020, 401, 126041. [Google Scholar] [CrossRef]
  2. Adekunle, A.S.; Oyekunle, J.A.O.; Baruwa, S.O.; Ogunfowokan, A.O.; Ebenso, E.E. Speciation study of the heavy metals in commercially available recharge cards coatings in Nigeria and the health implication. Toxicol. Rep. 2014, 1, 243–251. [Google Scholar] [CrossRef] [PubMed]
  3. Asuquo, E.; Martin, A.; Nzerem, P.; Siperstein, F.; Fan, X. Adsorption of Cd(II) and Pb(II) ions from aqueous solutions using mesoporous activated carbon adsorbent: Equilibrium, kinetics and characterisation studies. J. Environ. Chem. Eng. 2017, 5, 679–698. [Google Scholar] [CrossRef]
  4. Shoukry, A.F.; Shuaib, N.M.; Ajadi, A.A. Homogeneous precipitation at solid/solution interface as a novel chemical route for synthesis of nanoparticles: Application to Cd(II) and Pb(II) sulfides. J. Exp. Nanosci. 2017, 13, 39–49. [Google Scholar] [CrossRef]
  5. Ahmed, W.; Mehmood, S.; Núñez-Delgado, A.; Ali, S.; Qaswar, M.; Shakoor, A.; Mahmood, M.; Chen, D.-Y. Enhanced adsorption of aqueous Pb(II) by modified biochar produced through pyrolysis of watermelon seeds. Sci. Total Environ. 2021, 784, 147136. [Google Scholar] [CrossRef] [PubMed]
  6. Salazar, H.; Martins, P.M.; Fernandes, M.M.; Costa, P.; Ferdov, S.; Botelho, G.; Lanceros-Mendez, S. Reusable nanocomposite-filters for arsenite and arsenate dual real effluents remediation in an up-scaled membrane reactor. J. Hazard. Mater. 2022, 440, 129756. [Google Scholar] [CrossRef]
  7. Botello-González, J.; Cerino-Córdova, F.J.; Dávila-Guzmán, N.E.; Salazar-Rábago, J.J.; Soto-Regalado, E.; Gómez-González, R.; Loredo-Cancino, M. Ion exchange modeling of the competitive adsorption of Cu(II) and Pb(II) using chemically modified solid waste coffee. Water Air Soil Pollut. 2019, 230, 73. [Google Scholar] [CrossRef]
  8. Long, J.; Yuvaraja, G.; Zhou, S.; Mo, J.; Li, H.; Luo, D.; Chen, D.Y.; Kong, L.; Subbaiah, M.V.; Reddy, G.M. Inactive Fusarium Fungal strains (ZSY and MJY) isolation and application for the removal of Pb(II) ions from aqueous environment. J. Ind. Eng. Chem. 2019, 72, 442–452. [Google Scholar] [CrossRef]
  9. Liu, C.; Wu, T.; Hsu, P.-C.; Xie, J.; Zhao, J.; Liu, K.; Sun, J.; Xu, J.; Tang, J.; Ye, Z.; et al. Direct/Alternating current electrochemical method for removing and recovering heavy metal from water using graphene oxide electrode. ACS Nano 2019, 13, 6431–6437. [Google Scholar] [CrossRef]
  10. Zarandona, A.; Salazar, H.; Insausti, M.; Lanceros-Méndez, S.; Zhang, Q. Sonophotocatalytic removal of organic dyes in real water environments using reusable BiSI@PVDF-HFP nanocomposite membranes. Chemosphere 2024, 357, 142069. [Google Scholar] [CrossRef]
  11. Fan, J.; Cai, C.; Chi, H.; Reid, B.J.; Coulon, F.; Zhang, Y.; Hou, Y. Remediation of cadmium and lead polluted soil using thiol-modified biochar. J. Hazard. Mater. 2020, 388, 122037. [Google Scholar] [CrossRef] [PubMed]
  12. Queirós, J.M.; Salazar, H.; Valverde, A.; Botelho, G.; Fernández de Luis, R.; Teixeira, J.; Martins, P.M.; Lanceros-Mendez, S. Reusable composite membranes for highly efficient chromium removal from real water matrixes. Chemosphere 2022, 307, 135922. [Google Scholar] [CrossRef] [PubMed]
  13. Hu, B.; Ai, Y.; Jin, J.; Hayat, T.; Alsaedi, A.; Zhuang, L.; Wang, X. Efficient elimination of organic and inorganic pollutants by biochar and biochar-based materials. Biochar 2020, 2, 47–64. [Google Scholar] [CrossRef]
  14. Yang, Y.; Sun, F.; Li, J.; Chen, J.; Tang, M. The effects of different factors on the removal mechanism of Pb(II) by biochar-supported carbon nanotube composites. RSC Adv. 2020, 10, 5988–5995. [Google Scholar] [CrossRef] [PubMed]
  15. Moja, T.N.; Bunekar, N.; Mojaki, S.; Mishra, S.B.; Tsai, T.Y.; Hwang, S.S.; Mishra, A.K. Polypropylene-polypropylene-grafted-maleic anhydride-montmorillonite clay nanocomposites for Pb(II) removal. J. Inorg. Organomet. Polym Mater. 2018, 28, 2799–2811. [Google Scholar] [CrossRef]
  16. Mohanty, S.K.; Valenca, R.; Berger, A.W.; Yu, I.K.M.; Xiong, X.; Saunders, T.M.; Tsang, D.C.W. Plenty of room for carbon on the ground: Potential applications of biochar for stormwater treatment. Sci. Total Environ. 2018, 625, 1644–1658. [Google Scholar] [CrossRef] [PubMed]
  17. Kongsuwan, A.; Patnukao, P.; Pavasant, P. Binary component sorption of Cu(II) and Pb(II) with activated carbon from Eucalyptus camaldulensis Dehn bark. J. Ind. Eng. Chem. 2009, 15, 465–470. [Google Scholar] [CrossRef]
  18. Momčilović, M.; Purenović, M.; Bojić, A.; Zarubica, A.; Ranđelović, M. Removal of lead(II) ions from aqueous solutions by adsorption onto pine cone activated carbon. Desalination 2011, 276, 53–59. [Google Scholar] [CrossRef]
  19. Hu, S.; Huang, J.; Huang, D.; Li, P.; Tang, J.; Meng, F. Increased flexibility to improve the catalytic performance of carbon-based solid acid catalysts. Green Process. Synth. 2021, 10, 687–699. [Google Scholar] [CrossRef]
  20. Hara, M.; Yoshida, T.; Takagaki, A.; Takata, T.; Kondo, J.N.; Hayashi, S.; Domen, K. A carbon material as a strong protonic acid. Angew. Chem. Int. Ed. 2004, 43, 2955–2958. [Google Scholar] [CrossRef]
  21. Wang, W.; Yang, D.; Mou, L.; Wu, M.; Wang, Y.; Cai, W.; Tan, F. Preparation of the porous carbon-based solid acid from starch for efficient degradation of chitosan to D-glucosamine. Int. J. Biol. Macromol. 2022, 209, 1629–1637. [Google Scholar] [CrossRef] [PubMed]
  22. Hussein, M.F.; Abo El Naga, A.O.; El Saied, M.; AbuBaker, M.M.; Shaban, S.A.; El Kady, F.Y. Potato peel waste-derived carbon-based solid acid for the esterification of oleic acid to biodiesel. Environ. Technol. Innov. 2021, 21, 101355. [Google Scholar] [CrossRef]
  23. Valle-Vigón, P.; Sevilla, M.; Fuertes, A.B. Sulfonated mesoporous silica-carbon composites and their use as solid acid catalysts. Appl. Surf. Sci. 2012, 261, 574–583. [Google Scholar] [CrossRef]
  24. Xue, W.; Zhao, H.; Yao, J.; Li, F.; Wang, Y. Esterification of cyclohexene with formic acid over a peanut shell-derived carbon solid acid catalyst. Chin. J. Catal. 2016, 37, 769–777. [Google Scholar] [CrossRef]
  25. Balasubramaniam, S.; Ninomiya, S.; Sasaki, M.; Quitain, A.; Kida, T.; Saldaña, M.D.A. Carbon-based solid acid catalyst derived from undaria pinnatifida and its application in esterification. Algal Res. 2021, 55, 102272. [Google Scholar] [CrossRef]
  26. Higai, D.; Lee, C.; Lang, J.; Qian, E.W. Saccharification of cellulose using biomass-derived activated carbon-based solid acid catalysts. Fuel Process. Technol. 2021, 215, 106738. [Google Scholar] [CrossRef]
  27. Yu, W.; Hu, J.; Yu, Y.; Ma, D.; Gong, W.; Qiu, H.; Hu, Z.; Gao, H.-w. Facile preparation of sulfonated biochar for highly efficient removal of toxic Pb(II) and Cd(II) from wastewater. Sci. Total Environ. 2021, 750, 141545. [Google Scholar] [CrossRef] [PubMed]
  28. Xu, T.; Liu, X. Peanut shell activated carbon: Characterization, surface modification and adsorption of Pb2+ from aqueous solution. Chin. J. Chem. Eng. 2008, 16, 401–406. [Google Scholar] [CrossRef]
  29. Li, M.; Chen, D.; Zhu, X. Preparation of solid acid catalyst from rice husk char and its catalytic performance in esterification. Chin. J. Catal. 2013, 34, 1674–1682. [Google Scholar] [CrossRef]
  30. Dehkhoda, A.M.; Ellis, N. Biochar-based catalyst for simultaneous reactions of esterification and transesterification. Catal. Today 2013, 207, 86–92. [Google Scholar] [CrossRef]
  31. Chu, G.; Zhao, J.; Huang, Y.; Zhou, D.; Liu, Y.; Wu, M.; Peng, H.; Zhao, Q.; Pan, B.; Steinberg, C.E.W. Phosphoric acid pretreatment enhances the specific surface areas of biochars by generation of micropores. Environ. Pollut. 2018, 240, 1–9. [Google Scholar] [CrossRef]
  32. Zhu, J.; Gan, L.; Li, B.; Yang, X. Synthesis and characteristics of lignin-derived solid acid catalysts for microcrystalline cellulose hydrolysis. Korean J. Chem. Eng. 2016, 34, 110–117. [Google Scholar] [CrossRef]
  33. Farabi, M.S.A.; Ibrahim, M.L.; Rashid, U.; Taufiq-Yap, Y.H. Esterification of palm fatty acid distillate using sulfonated carbon-based catalyst derived from palm kernel shell and bamboo. Energy Convers. Manag. 2019, 181, 562–570. [Google Scholar] [CrossRef]
  34. Zeng, D.; Liu, S.; Gong, W.; Wang, G.; Qiu, J.; Chen, H. Synthesis, characterization and acid catalysis of solid acid from peanut shell. Appl. Catal. A 2014, 469, 284–289. [Google Scholar] [CrossRef]
  35. Estevez, R.; Aguado-Deblas, L.; Montes, V.; Caballero, A.; Bautista, F.M. Sulfonated carbons from olive stones as catalysts in the microwave-assisted etherification of glycerol with tert-butyl alcohol. Mol. Catal. 2020, 488, 110921. [Google Scholar] [CrossRef]
  36. Lim, S.; Yap, C.Y.; Pang, Y.L.; Wong, K.H. Biodiesel synthesis from oil palm empty fruit bunch biochar derived heterogeneous solid catalyst using 4-benzenediazonium sulfonate. J. Hazard. Mater. 2020, 390, 121532. [Google Scholar] [CrossRef]
  37. Abo El Naga, A.O.; El Saied, M.; Shaban, S.A.; El Kady, F.Y. Fast removal of diclofenac sodium from aqueous solution using sugar cane bagasse-derived activated carbon. J. Mol. Liq. 2019, 285, 9–19. [Google Scholar] [CrossRef]
  38. Liu, X.-Y.; Huang, M.; Ma, H.-L.; Zhang, Z.-Q.; Gao, J.-M.; Zhu, Y.-L.; Han, X.-J.; Guo, X.-Y. Preparation of a carbon-based solid acid catalyst by sulfonating activated carbon in a chemical reduction process. Molecules 2010, 15, 7188–7196. [Google Scholar] [CrossRef] [PubMed]
  39. Desalegn, Y.M.; Andoshe, D.M.; Desissa, T.D. Composite of bentonite/CoFe2O4/hydroxyapatite for adsorption of Pb(II). Mater. Res. Express 2020, 7, 115501. [Google Scholar] [CrossRef]
  40. Lv, M.; Du, Y.; Zhang, T.; Du, X.; Yin, X. Cassava starch-based thermo-responsive Pb(II)-imprinted material: Preparation and adsorption performance on Pb(II). Polymers 2022, 14, 828. [Google Scholar] [CrossRef]
  41. Zhang, C.; Yu, Z.; Zeng, G.; Huang, B.; Dong, H.; Huang, J.; Yang, Z.; Wei, J.; Hu, L.; Zhang, Q. Phase transformation of crystalline iron oxides and their adsorption abilities for Pb and Cd. Chem. Eng. J. 2016, 284, 247–259. [Google Scholar] [CrossRef]
  42. Naiya, T.K.; Bhattacharya, A.K.; Mandal, S.; Das, S.K. The sorption of lead(II) ions on rice husk ash. J. Hazard. Mater. 2009, 163, 1254–1264. [Google Scholar] [CrossRef] [PubMed]
  43. Yao, S.; Zhang, J.; Shen, D.; Xiao, R.; Gu, S.; Zhao, M.; Liang, J. Removal of Pb(II) from water by the activated carbon modified by nitric acid under microwave heating. J. Colloid Interface Sci. 2016, 463, 118–127. [Google Scholar] [CrossRef] [PubMed]
  44. Gomez-Serrano, V.; Macias-Garcia, A.; Espinosa-Mansilla, A.; Valenzuela-Calahorro, C. Adsoprtion of mercury, cadmium and lead from aqueous solution on heat-treated and sulphurized activated carbon. Water Res. 1998, 32, 1–4. [Google Scholar] [CrossRef]
  45. Cheraghi, E.; Ameri, E.; Moheb, A. Continuous biosorption of Cd(II) ions from aqueous solutions by sesame waste: Thermodynamics and fixed-bed column studies. Desalin. Water Treat. 2015, 57, 6936–6949. [Google Scholar] [CrossRef]
  46. Semerjian, L. Equilibrium and kinetics of cadmium adsorption from aqueous solutions using untreated Pinus halepensis sawdust. J. Hazard. Mater. 2010, 173, 236–242. [Google Scholar] [CrossRef] [PubMed]
  47. Zhang, J.; Shao, J.; Jin, Q.; Li, Z.; Zhang, X.; Chen, Y.; Zhang, S.; Chen, H. Sludge-based biochar activation to enhance Pb(II) adsorption. Fuel 2019, 252, 101–108. [Google Scholar] [CrossRef]
  48. Wang, L.; Zhang, J.; Zhao, R.; Li, Y.; Li, C.; Zhang, C. Adsorption of Pb(II) on activated carbon prepared from polygonum orientale Linn.: Kinetics, isotherms, pH, and ionic strength studies. Bioresour. Technol. 2010, 101, 5808–5814. [Google Scholar] [CrossRef] [PubMed]
  49. Du, Q.; Zhang, S.; Song, J.; Zhao, Y.; Yang, F. Activation of porous magnetized biochar by artificial humic acid for effective removal of lead ions. J. Hazard. Mater. 2020, 389, 122115. [Google Scholar] [CrossRef]
  50. Ho, Y. Review of second-order models for adsorption systems. J. Hazard. Mater. 2006, 136, 681–689. [Google Scholar] [CrossRef]
  51. Soliman, A.M.; Elwy, H.M.; Thiemann, T.; Majedi, Y.; Labata, F.T.; Al-Rawashdeh, N.A.F. Removal of Pb(II) ions from aqueous solutions by sulphuric acid-treated palm tree leaves. J. Taiwan Inst. Chem. Eng. 2016, 58, 264–273. [Google Scholar] [CrossRef]
  52. Zhong, Y.; Zhang, P.; Zhu, X.; Li, H.; Deng, Q.; Wang, J.; Zeng, Z.; Zou, J.-J.; Deng, S. Highly efficient alkylation using hydrophobic sulfonic acid-functionalized biochar as a catalyst for synthesis of high-density biofuels. ACS Sustain. Chem. Eng. 2019, 7, 14973–14981. [Google Scholar] [CrossRef]
  53. Dong, K.; Zhang, J.; Luo, W.; Su, L.; Huang, Z. Catalytic conversion of carbohydrates into 5-hydroxymethyl furfural over sulfonated hyper-cross-linked polymer in DMSO. Chem. Eng. J. 2018, 334, 1055–1064. [Google Scholar] [CrossRef]
Figure 1. SEM images of pre-AMBC (a) and AMBC (b).
Water 16 01871 g001
Figure 2. XRD pattern of pre-AMBC and AMBC.
Water 16 01871 g002
Figure 3. FT-IR spectra of pre-AMBC (a) and AMBC (b).
Water 16 01871 g003
Figure 4. TG-DTA curves of pre-AMBC (a) and AMBC (b).
Water 16 01871 g004
Figure 5. Effects of contact time on the adsorption of Pb(II) by AMBC. The conditions were as follows: Initial concentration of Pb(II) = 100 mg/L, pH = 3, dosage of AMBC = 0.5 g/L, shaking rate = 200 rpm.
Water 16 01871 g005
Figure 6. Effects of pH value on the adsorption of Pb(II) by AMBC. The conditions were as follows: initial concentration of Pb(II) = 100 mg/L, contact time = 120 min, dosage of AMBC = 0.5 g/L, shaking rate = 200 rpm.
Water 16 01871 g006
Figure 7. Effects of the dosage of AMBC on the adsorption of Pb(II). The conditions were as follows: initial concentration of Pb(II) = 100 mg/L, contact time = 120 min, pH = 5, shaking rate = 200 rpm.
Water 16 01871 g007
Figure 8. Effects of initial concentration of Pb(II) on the adsorption performance of AMBC. The conditions were as follows: dosage of AMBC = 0.5 g/L, contact time = 120 min, pH = 5, shaking rate = 200 rpm.
Water 16 01871 g008
Figure 9. Isotherms of Pb(II) adsorption by AMBC.
Water 16 01871 g009
Figure 10. Linearized Langmuir adsorption isotherms for Pb(II) adsorption on AMBC.
Water 16 01871 g010
Figure 11. Linearized Freundlich adsorption isotherms for Pb(II) adsorption on AMBC.
Water 16 01871 g011
Figure 12. Adsorption capacity of AMBC for Pb(II) at different times and temperatures.
Water 16 01871 g012
Figure 13. Plot of pseudo-second-order kinetics model for the adsorption of Pb(II) on AMBC at different temperatures: (a) 25 °C; (b) 35 °C; (c) 55 °C.
Water 16 01871 g013
Figure 14. Plot of lnkads–1/T for the adsorption of Pb(II) on AMBC.
Water 16 01871 g014
Figure 15. XPS spectra of AMBC before and after Pb(II) adsorption.
Water 16 01871 g015
Table 1. Pore structure and surface acidic functional group density of adsorbents.
AdsorbentSBET a
(m2/g)
VP b
(cm3/g)
DP c
(nm)
Acid Density (mmol/g)
TotalPh-OH-SO3H-COOH
Pre-AMBC832.63.99 × 10−12.21.260.05-1.21
AMBC329.32.67 × 10−22.12.280.330.521.43
Notes: a SBET was measured using the multi-point BET method. b Average pore size was calculated based on the desorption branch of the isotherm using the BJH method. c Total pore volume was measured at P/P0 = 0.99.
Table 2. Comparison of the adsorption of Pb(II) by AMBC and its precursor.
AdsorbentsQ
(mg/g)
R
(%)
Pre-AMBC83.139.7
AMBC148.676.0
Note: Conditions: initial concentration of Pb(II) = 100 mg/L, pH = 5, dosage of AMBC = 0.5 g/L, contact time = 120 min, shaking rate = 200 rpm.
Table 3. Comparisons of the removal efficiencies of Pb(II) by different adsorbents.
AdsorbentsQmax
(mg/g)
ActivatorExperiment Conditions
pHT
(°C)
Dosage
(g/L)
Equilibration Time
(min)
Initial
Concentration
(mg/g)
Ref.
AMBC148.6H2SO45250.5120100This study
C-KOH57.5KOH525235100[47]
SBC191.1H2SO44.5-25200[27]
HP-BC60.9H2O2525-500100[5]
M-RH-AC134.9HNO35.5-190180[43]
PLAC98.4H3PO45.0250.63080[48]
Notes: C-KOH, KOH-modified biochar; SBC, sulfonated axonopus compressus biochar; HP-BC, H2O2-modified watermelon seed biochar; M-RH-AC, nitric acid-modified rice husk biochar; PLAC, H3PO4-modified polygonum orientale linn biochar.
Table 4. Parameters of adsorption isotherm models for the adsorption of Pb(II) on AMBC.
Temperature
(°C)
Langmuir ModelFreundlich Model
KL
(L/mg)
qm
(mg/g)
RLR2KF
(mg/g)
1/nR2
250.0716210.10.046~0.1950.9894768.1170.2110.97800
350.0786220.30.048~0.2030.9860669.6110.2150.98978
450.0826318.50.053~0.2180.9670675.7080.2800.97686
Table 5. Thermodynamic parameters for the adsorption of Pb(II) on AMBC.
Temperature
(°C)
KdΔG
(kJ/mol)
ΔH
(kJ/mol)
ΔS
(kJ/mol.K)
255.304−4.143.2480.025
355.334−4.29
454.764−4.13
Table 6. Kinetic parameters from the pseudo-second-order model.
Temperature
°C
qe
mg/g
kads
g/(min.mg)
R2
25147.05.53 × 10−30.99989
35155.36.92 × 10−30.99991
55157.58.71 × 10−30.99992
Disclaimer/Publisher’s Note: The statements, opinions and data contained in all publications are solely those of the individual author(s) and contributor(s) and not of MDPI and/or the editor(s). MDPI and/or the editor(s) disclaim responsibility for any injury to people or property resulting from any ideas, methods, instructions or products referred to in the content.