Article

Characteristics and Mechanism of Downflow in Front of a Cylindrical Pier with Clear-Water Local Scour

by
Weizheng Wang
1,
Song Wei
1,2,*,
Dayong Zhu
3,
Jun Wang
1 and
Haipeng Duan
4
1
College of Civil Engineering, Hefei University of Technology, Hefei 230009, China
2
Anhui Key Laboratory of Civil Engineering Structures and Materials, Hefei 230009, China
3
School of Civil Engineering, Ningbo Institute of Technology, Zhejiang University, Ningbo 315000, China
4
Anhui Transportation Holding Group Co., Ltd., Hefei 230088, China
*
Author to whom correspondence should be addressed.
Water 2024, 16(13), 1863; https://doi.org/10.3390/w16131863
Submission received: 8 May 2024 / Revised: 21 June 2024 / Accepted: 24 June 2024 / Published: 28 June 2024

Abstract

:
Local scour often causes pier instability; however, the characteristics and mechanism of downflow, representing one of the crucial flow structures, are still unclear. In this paper, the interaction between the downflow and the horseshoe vortex system and the role of the downflow under clear-water local scour conditions are discussed, based on the stress distribution obtained via experiments and simulations. In the present experiment, more accurate data are measured by installing suitable sensors on 3D-printed models that reproduce the scour hole conditions at various times. The obtained results reveal that the downflow exhibits a strong interaction with the horseshoe vortex system. From the perspective of flow structures, the flow structures collide and rub against each other, which weakens the effect of the downflow. From the perspective of energy transfer, the horseshoe vortex system absorbs the energy carried by the downflow to develop and reduce the energy introduced into the sediment. In addition, shear stress is a crucial factor in maintaining a high tangent slope. When the shear stress is down to a minimum and is stable, the tangent slope rises with the growth of the pressure stress, which means that the downflow is able to promote scour depth development.

1. Introduction

Scouring is a critical factor that leads to pier failure. It occurs when sediment around the piers is removed, resulting in a scour hole. According to Hunt [1], out of 1502 bridge accidents that happened between 1966 and 2005, 58% were caused by scouring, making it the primary cause of bridge accidents. Generally, three types of scouring contribute to increasing the scouring depth; these are general scour, contraction scour, and local scour [2]. Compared with general scour and contraction scour, local scour around the piers commonly leads to greater scouring depth and exhibits a greater impact on the safety of bridge piers.
In general, the investigations conducted on local scour can be classified into two categories: those conducted in a scientific context and those performed from an engineering point of view [3]. The first one mainly focuses on the scour mechanism by examining the various factors associated with local scour, such as pier width to the median diameter of the sediment ratio ( D / d 50 ), flow intensity ( V / V c ), and normalized water depth ( H / D ), among others. Former investigations have revealed that these factors cause flow structures to exhibit various locations and scales, and this information is useful for explaining the local scour mechanism [4,5]. Melville et al. [6] summarized the main flow structures under clear-water scour conditions, including a strong downflow in front of the cylinder, a horseshoe vortex at the base of the cylinder, and a strong upward flow with somewhat weaker backflow in the wake behind the cylinder. Based on this pattern, many investigations have been conducted under various conditions [7,8]. Although the scale effect has a great influence on the investigations [9], the depth and width of the river are too large to measure accurate data. Therefore, laboratory model experiments are the most common research method.
Experimental conditions of local scour include clear-water and live beds. The main difference between these two types of scouring depends on whether the flow velocity is sufficient to transport the sediment upstream. Melville et al. [10] conducted experiments to investigate the relationship between the flow velocity and the scour depth, and the achieved results were indicative that the scour depth reaches its maximum when the flow velocity reaches the critical velocity. Under clear-water scouring conditions, when the flow velocity was lower than the critical velocity, the depth demonstrated an increasing trend with an increase in the flow velocity. Conversely, in the presence of live-bed scouring conditions, the depth decreases with an increase in the flow velocity [11]. Fakhimjoo et al. [12] carried out tests on various types of piers and abutments and found that with an increase in flow speed, the scour depth markedly rises. In addition, it was emphasized that other factors could affect scour depth, including the flow depth and the pier’s diameter. Rahman and Haque [13] took into account the D/H parameter as a crucial factor affecting scour depth and then proceeded with modifying Lacey’s original formula to reasonably predict scour depth and obtain more accurate results.
In addition, all the flow conditions that are capable of changing the flow structures, such as velocity and depth, play a significant role and that is why scour holes take on varying geometries. Baker [14] observed a horseshoe vortex system consisting of at least two vortices under different experimental conditions and showed that the number of vortices varies with the flow condition. The Reynolds number of the pier ( R D ) has been considered a crucial parameter to describe flow patterns in previous studies [7,15,16]. Apsilidis et al. [17] pointed out that when the cylinder Reynolds number increases, the number and scale of horseshoe vortex systems increase and the horseshoe vortex system moves closer to the upstream area. The horseshoe vortex system has also been identified as one of the pivotal factors in the development of scour holes in front of piers. The formation of horseshoe vortex systems is essentially attributable to the separation of the incoming boundary layer caused by the adverse pressure gradient produced by the cylinder and extending downstream in a number of necklace-like structures. Guan et al. [18] measured the flow pattern in a developing clear-water scour hole at a circular pier and found that the strength and size of the main vortex increased with increasing scour depth.
However, the horseshoe vortex system is not the only factor causing sediment loss, especially in front of piers. Kwan [19] suggested that the downflow could directly lead to the formation of a scour hole, which means that it has an effect similar to a horseshoe vortex system. Although the horseshoe vortex system has high turbulent kinetic energy in the upstream axis, sediment particles at the upstream base of the piers are also affected by a strong downward force that is possibly caused by the downflow effect. Shafii et al. [20] identified normal pressure as another important parameter for local scour and modified the sediment erosion rate formula. The obtained results showed that normal pressure has a positive impact on sediment transportation. Sun et al. [21] introduced the downflow value into the formula and arrived at a more accurate prediction of the maximum scour depth.
Although downflow is considered to be another important factor causing scour holes in front of piers, downflow is more difficult to investigate than horseshoe vortex systems. Unger and Hager [22] measured the velocity of a downflow and showed that the downflow’s strength remains almost constant during the scouring process. Ahmed and Rajaratnam [23] conducted experiments under different conditions and found that the downflow velocity depends only on the upstream velocity. However, due to the interaction of downflow with the horseshoe vortex system, the effect of downflow itself on the sediments is yet to be examined. Zarrati et al. [24] showed that downflow could remove sediments and increase the scour depth through experiments in which the scour depth was reduced by using collars. Furthermore, Cheng et al. [25] designed ring-wing baffles to reduce the downflow strength against the riverbed and effectually lessened the scour depth. Jiang S et al. [26] proposed that the downflow strength is proportional to the scour depth in experiments. Roulund et al. [27] proposed that the factors affecting sediment transport include not only shear stress but also downflow, vortices, and turbulence. Additionally, downflow also represents a crucial factor for completing the equation of sediment transport. These results confirm that there exists a potential relationship between the downflow and the scour depth.
The rigorous interaction between the downflow and the horseshoe vortex system is another complex problem in downflow studies, especially during experiments. Therefore, many serious investigations in the downflow field have been carried out through numerical simulation [28,29,30]. Kirkle et al. [31] discussed the interactions of the horseshoe vortex system with the downflow in a comprehensive simulation presented via a detached eddy simulation-based model (DES). Keshavarzi et al. [32] conducted a comprehensive investigation into the vortex interaction resulting from a vertical bridge abutment placed on a flat bed, utilizing URANS and k-ω turbulence closure. Pasiok and Stilger-Szydło [33] investigated the relationship between sediment movement and the flow structures around piers and suggested that different flow structures, which are interdependent and mutually influencing, should be taken into account as a whole. These investigations have produced many results, but the interaction between the downflow and the horseshoe vortex system and its major consequences on local scour have not yet been discussed in detail, so it is almost impossible to examine the role of the downflow in local scour.
In the present research work, the stress distribution in front of the pier is methodically obtained by two distinct approaches: experiment and simulation. The influence of flow structures, especially the downflow, on the stress state is carefully discussed in detail, and the interaction mechanism between the downflow and the horseshoe vortex system is also revealed and discussed. In addition, through the relationship between the stress state and scour hole morphology, the effect of the downflow on local scour is systematically examined. This paper aims to supplement the role of downflow in local scour from a novel perspective, the fruitful results of which can be effectively utilized to improve local scour prediction methods. This study, which has perfected the characteristics of the downflow, can also be effectually regarded as a foundation for future theoretical research.

2. Materials and Methods

In this study, experiments were conducted in a flume with a square section. The flume was 20 m long, 0.6 m wide, and 0.6 m deep. The flow depth was H = 0.2 m. A uniform sediment layer with a median diameter d 50 = 0.4 mm was placed at the bottom of the flume, and the thickness of the sand layer was set at t s = 0.1 m. The non-dimensional flow parameter (i.e., the Reynolds number of the pier) was R D = 7.95 × 10⁴. The critical velocity of the sediment was obtained as 0.234 m/s, which was calculated with the following formula [34]:
V c = 0.0246 h p d ¯ 332 d ¯ + 10 + h p d ¯ 0.72
where V c denotes the critical flow velocity of sediment, h p is the maximum water depth after general scouring, and d ¯ represents the mean particle size of the sediment. Since the experimental velocity is lower than the critical velocity, the scour type is clean-water scour.
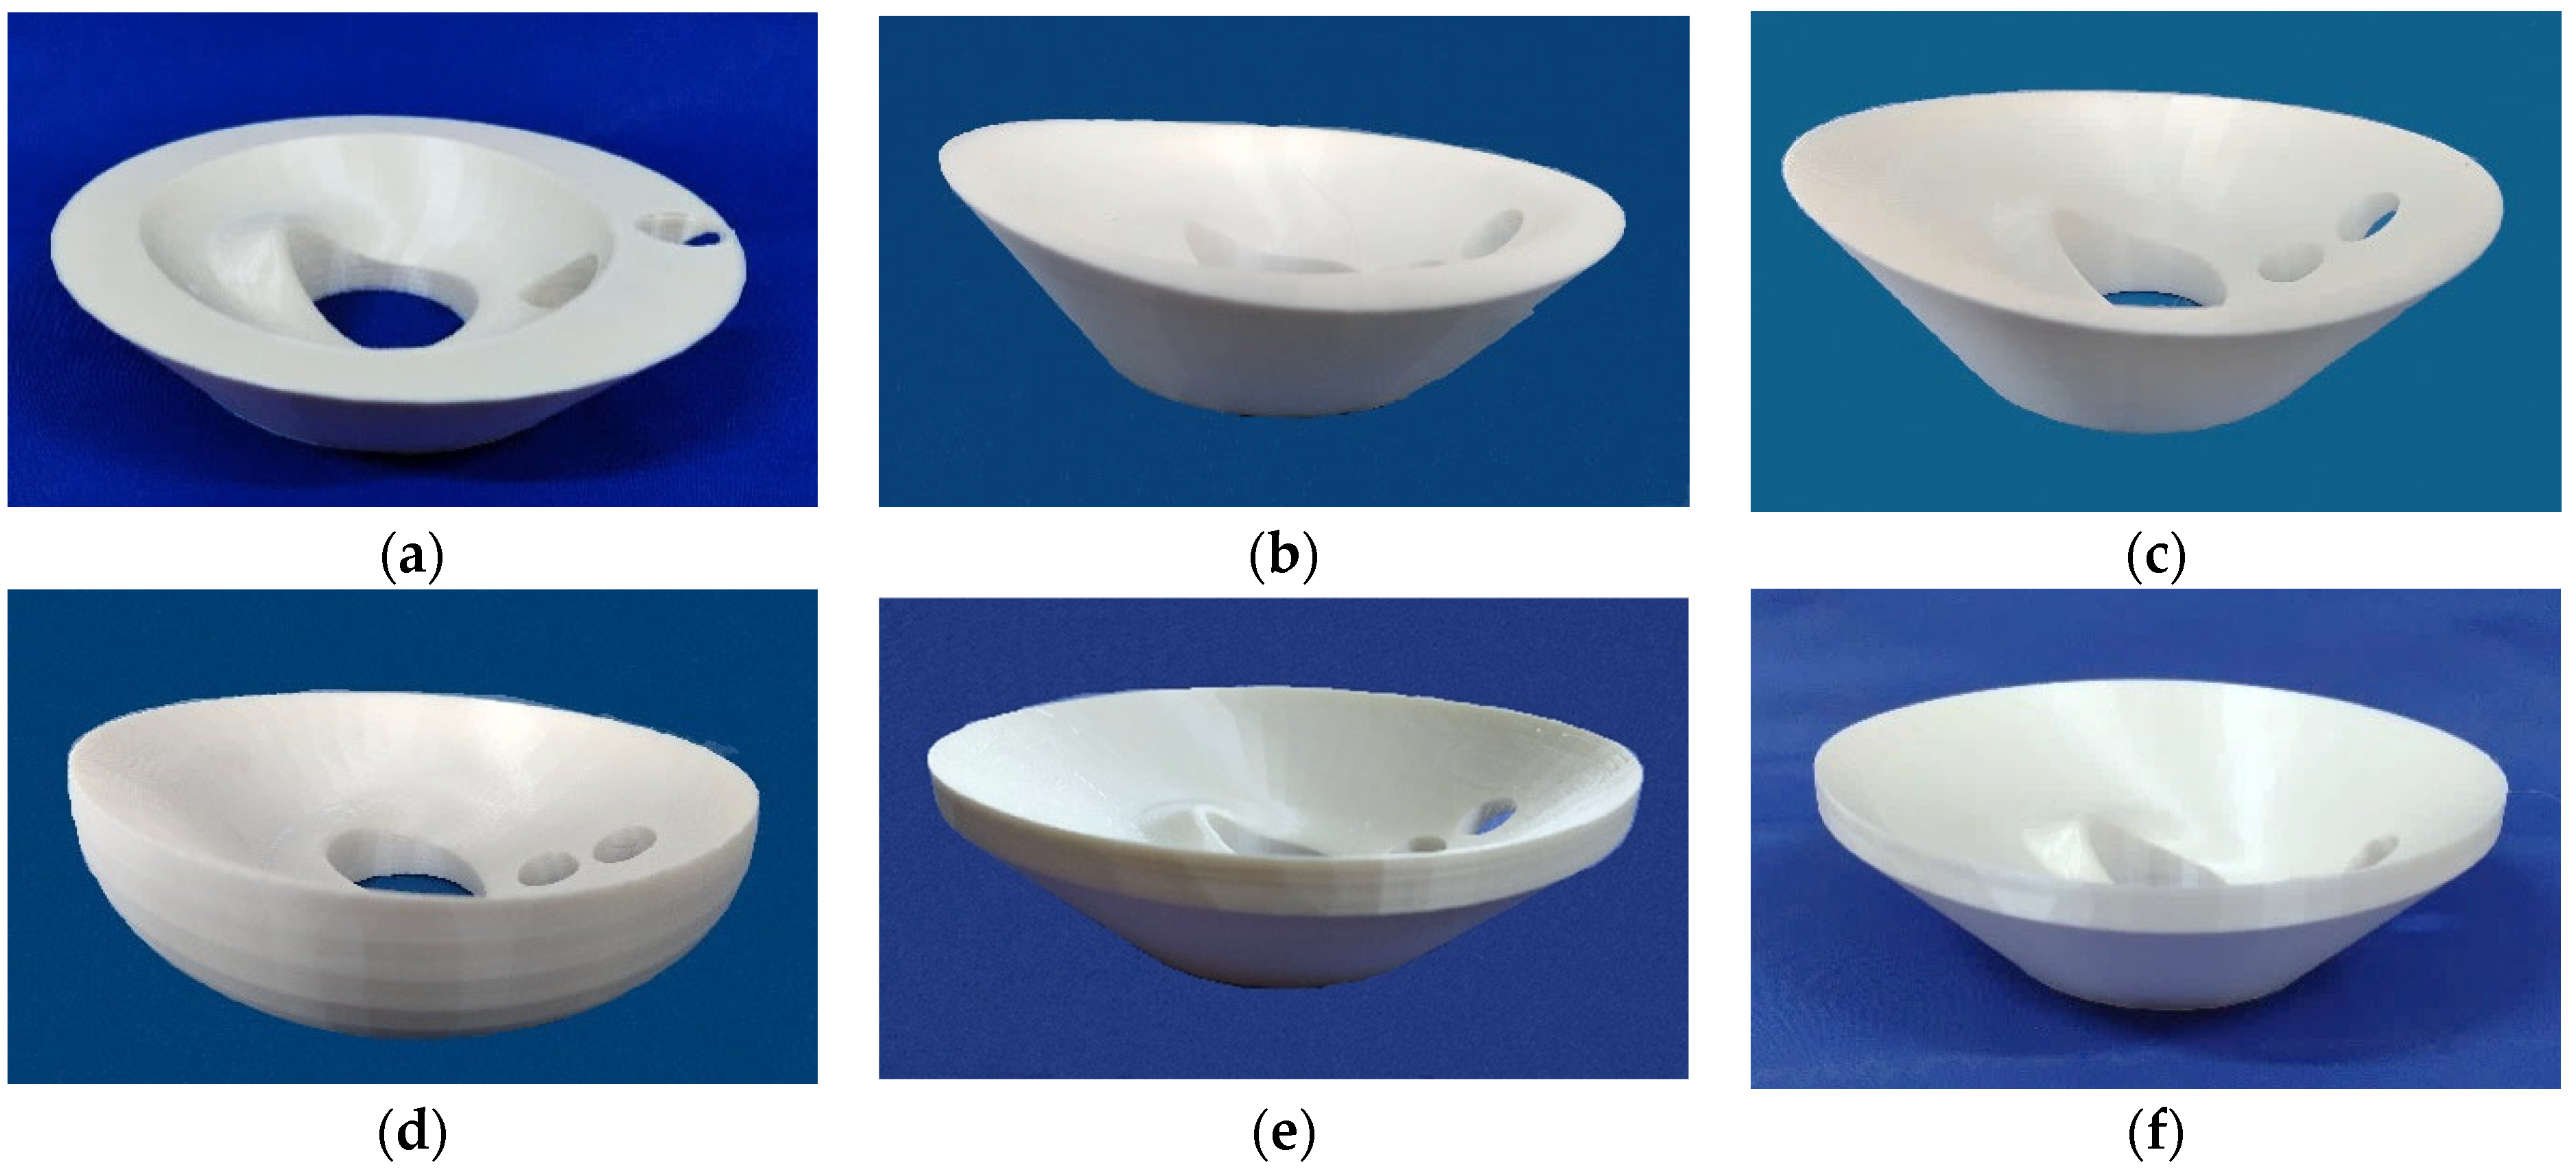
In the experiments, the shape of the scour hole was reconstructed with 3D-printed technology, using measurements that were set beforehand. In addition, the pressure stress values in the scour hole were measured by placing the sensors on the 3D-printed model, seen in Figure 1, to assess the influence of the downflow squeezing the lower flow on the shape of the scour hole. This test approach has two advantages: one is that the geometry of the scour hole can be recovered, to a large extent. Another thing is that the sensors are installed in very precise positions, which could effectively reduce the disturbance of sediments on the sensors.
The specific times of the experiments were set at six time points, namely, from t_1 to t_6; in order, these were 5, 15, 30, 60, 120, and 360 min after the start of scouring (t_0), so there were six 3D-printed models, as seen in Figure 2. Since more factors around the pier interfere with the downflow, the upstream axial position, where the downflow intensity reaches the strongest level, was chosen. Based on the pre-measured results, which showed the scour ranging from 0.65D to 1.7D, the two sensors were located upstream of the bridge pier at the axial plane of the flume, 0.5D and 1D away from the pier. Before the experiments, the surface of the 3D models was coated with sediment to make the coefficient of roughness more reasonable.
By employing numerical simulations to complement the experimental analyses, the findings could be thoroughly assessed. Moreover, the numerical model was methodically cross-checked against the experimentally observed data to ensure accuracy and reliability.
The Reynolds number of the pier was determined to be R D = 7.95 × 10⁴, which conformed to the application conditions of the large eddy simulation model (LES) in Flow-3D software v.11.2. The correction of the LES model when calculating shear stress has also been proven [35], and the corresponding governing equations read:
ρ t + x i ρ u i ¯ = 0
u i ¯ t + ρ x j u i ¯ u j ¯ = p ¯ x i + μ 2 u i ¯ x j x j ρ τ i j x j
in which:
τ i j = u i ¯ u j ¯ u i u j ¯
where ρ represents the fluid density, u i denotes the velocity component of the fluid, p is the pressure of the flow field, and μ denotes the fluid viscosity coefficient.
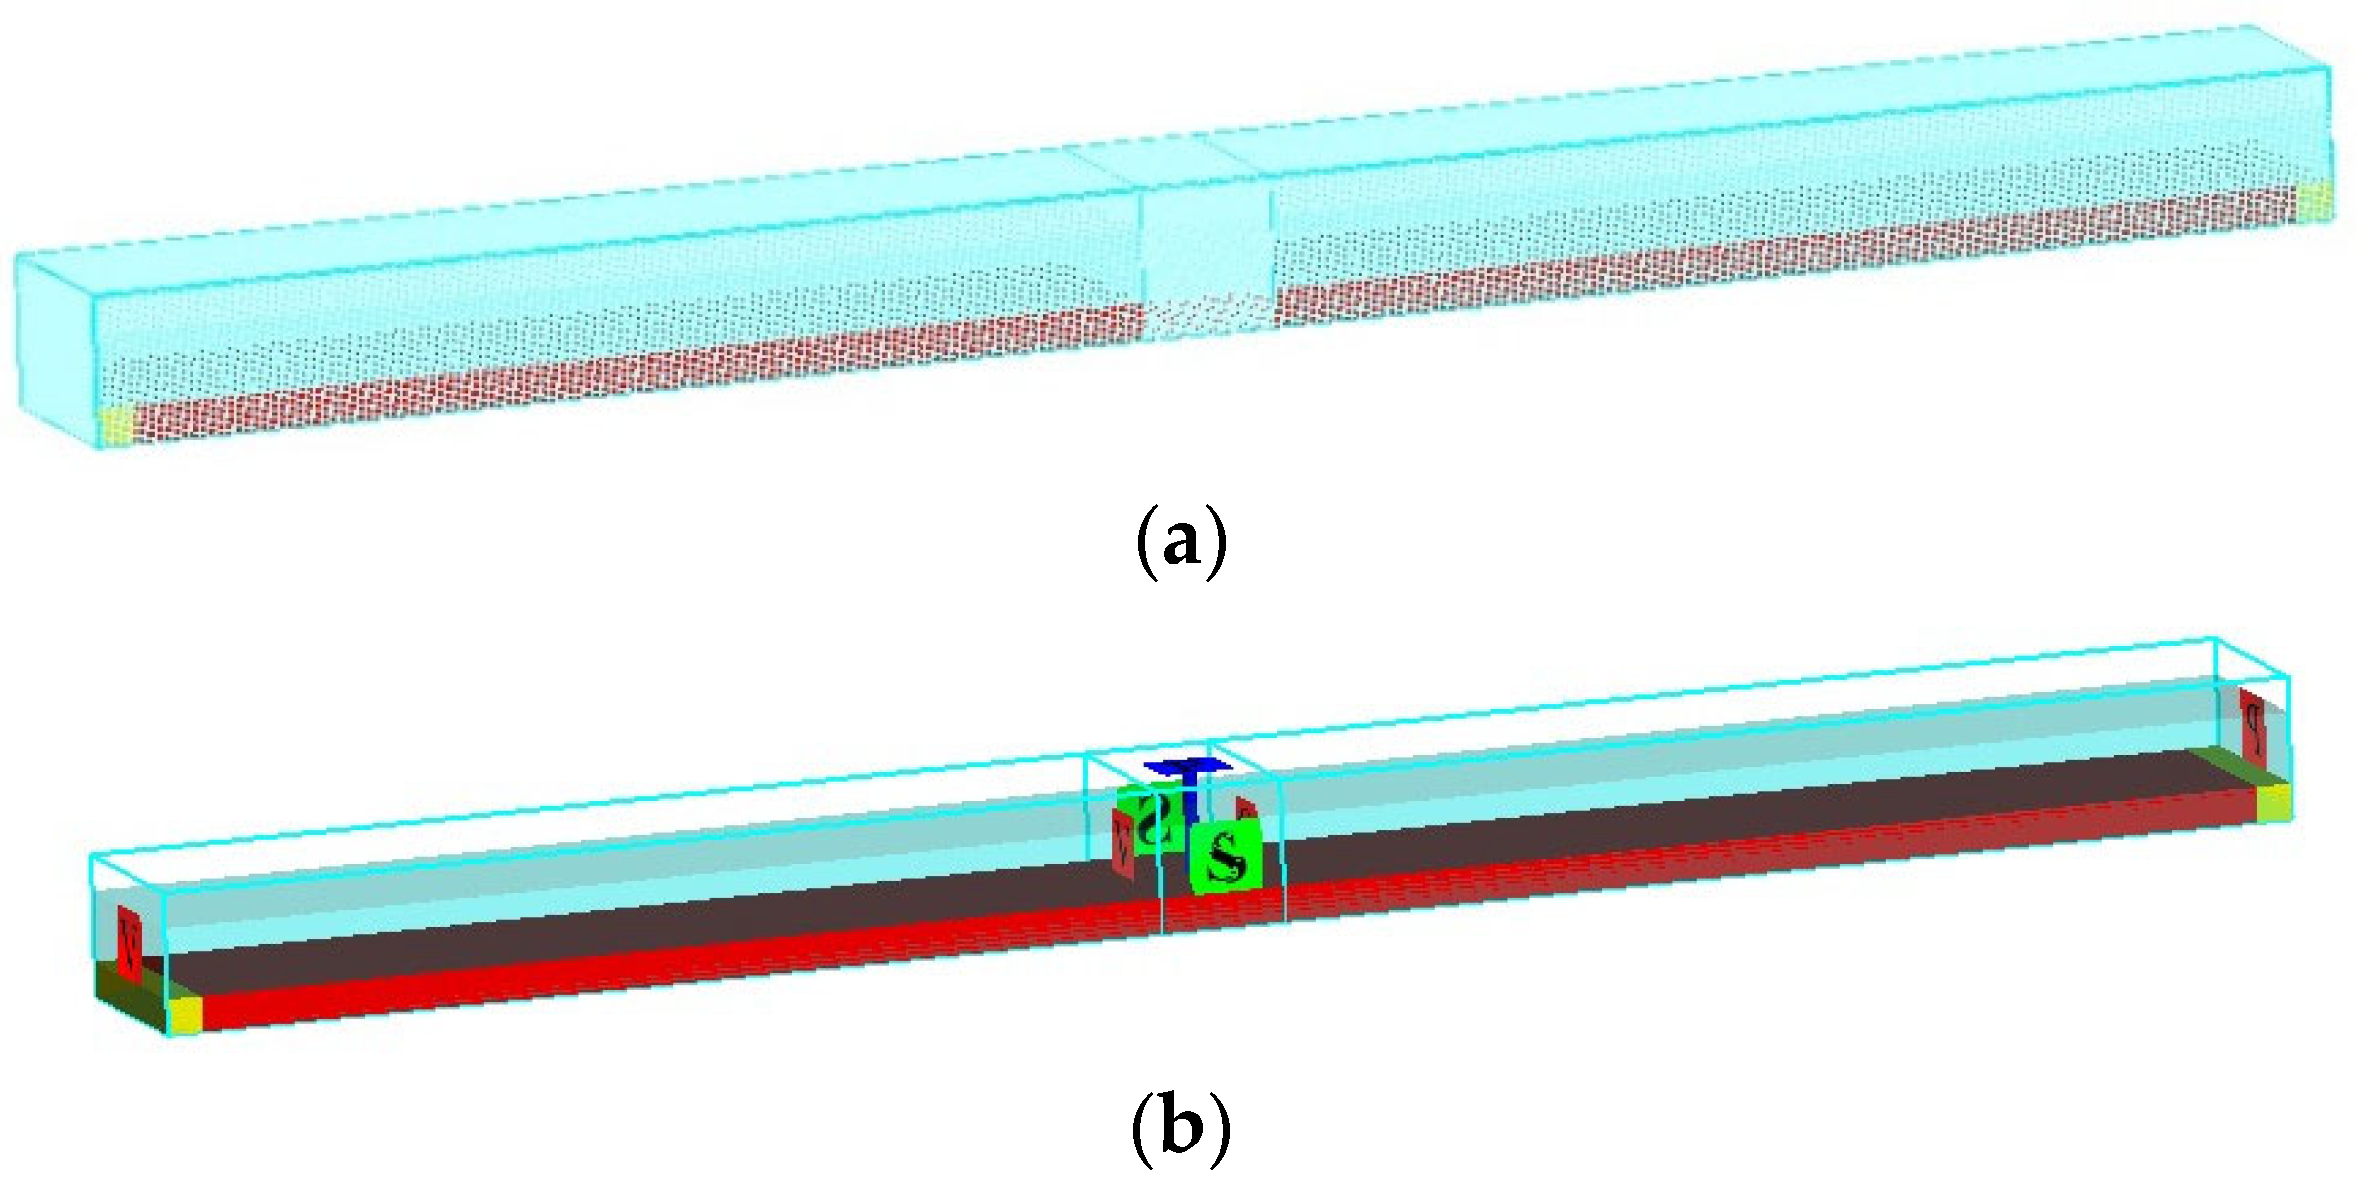
For meshing, different cell sizes were selected, as seen in Figure 3. The general cell size of the whole model was adjusted to be 10 mm, and the cell size near the pier was set at 5 mm to arrive at more accurate results. The boundary condition of the model entrance was specified velocity, in which the flow velocity was set at 0.2 m/s and the flow depth, including the sediment layer, was set as equal to 0.3 m. The outlet boundary condition of the model was set as outflow, representing free flow. The boundary conditions on both sides of the model were symmetrical; the boundary condition of the bottom was associated with the wall, and the boundary condition of the upper surface was specified pressure, where the fluid fraction value was set at equal to zero.

3. Results and Discussion

3.1. Result Analysis

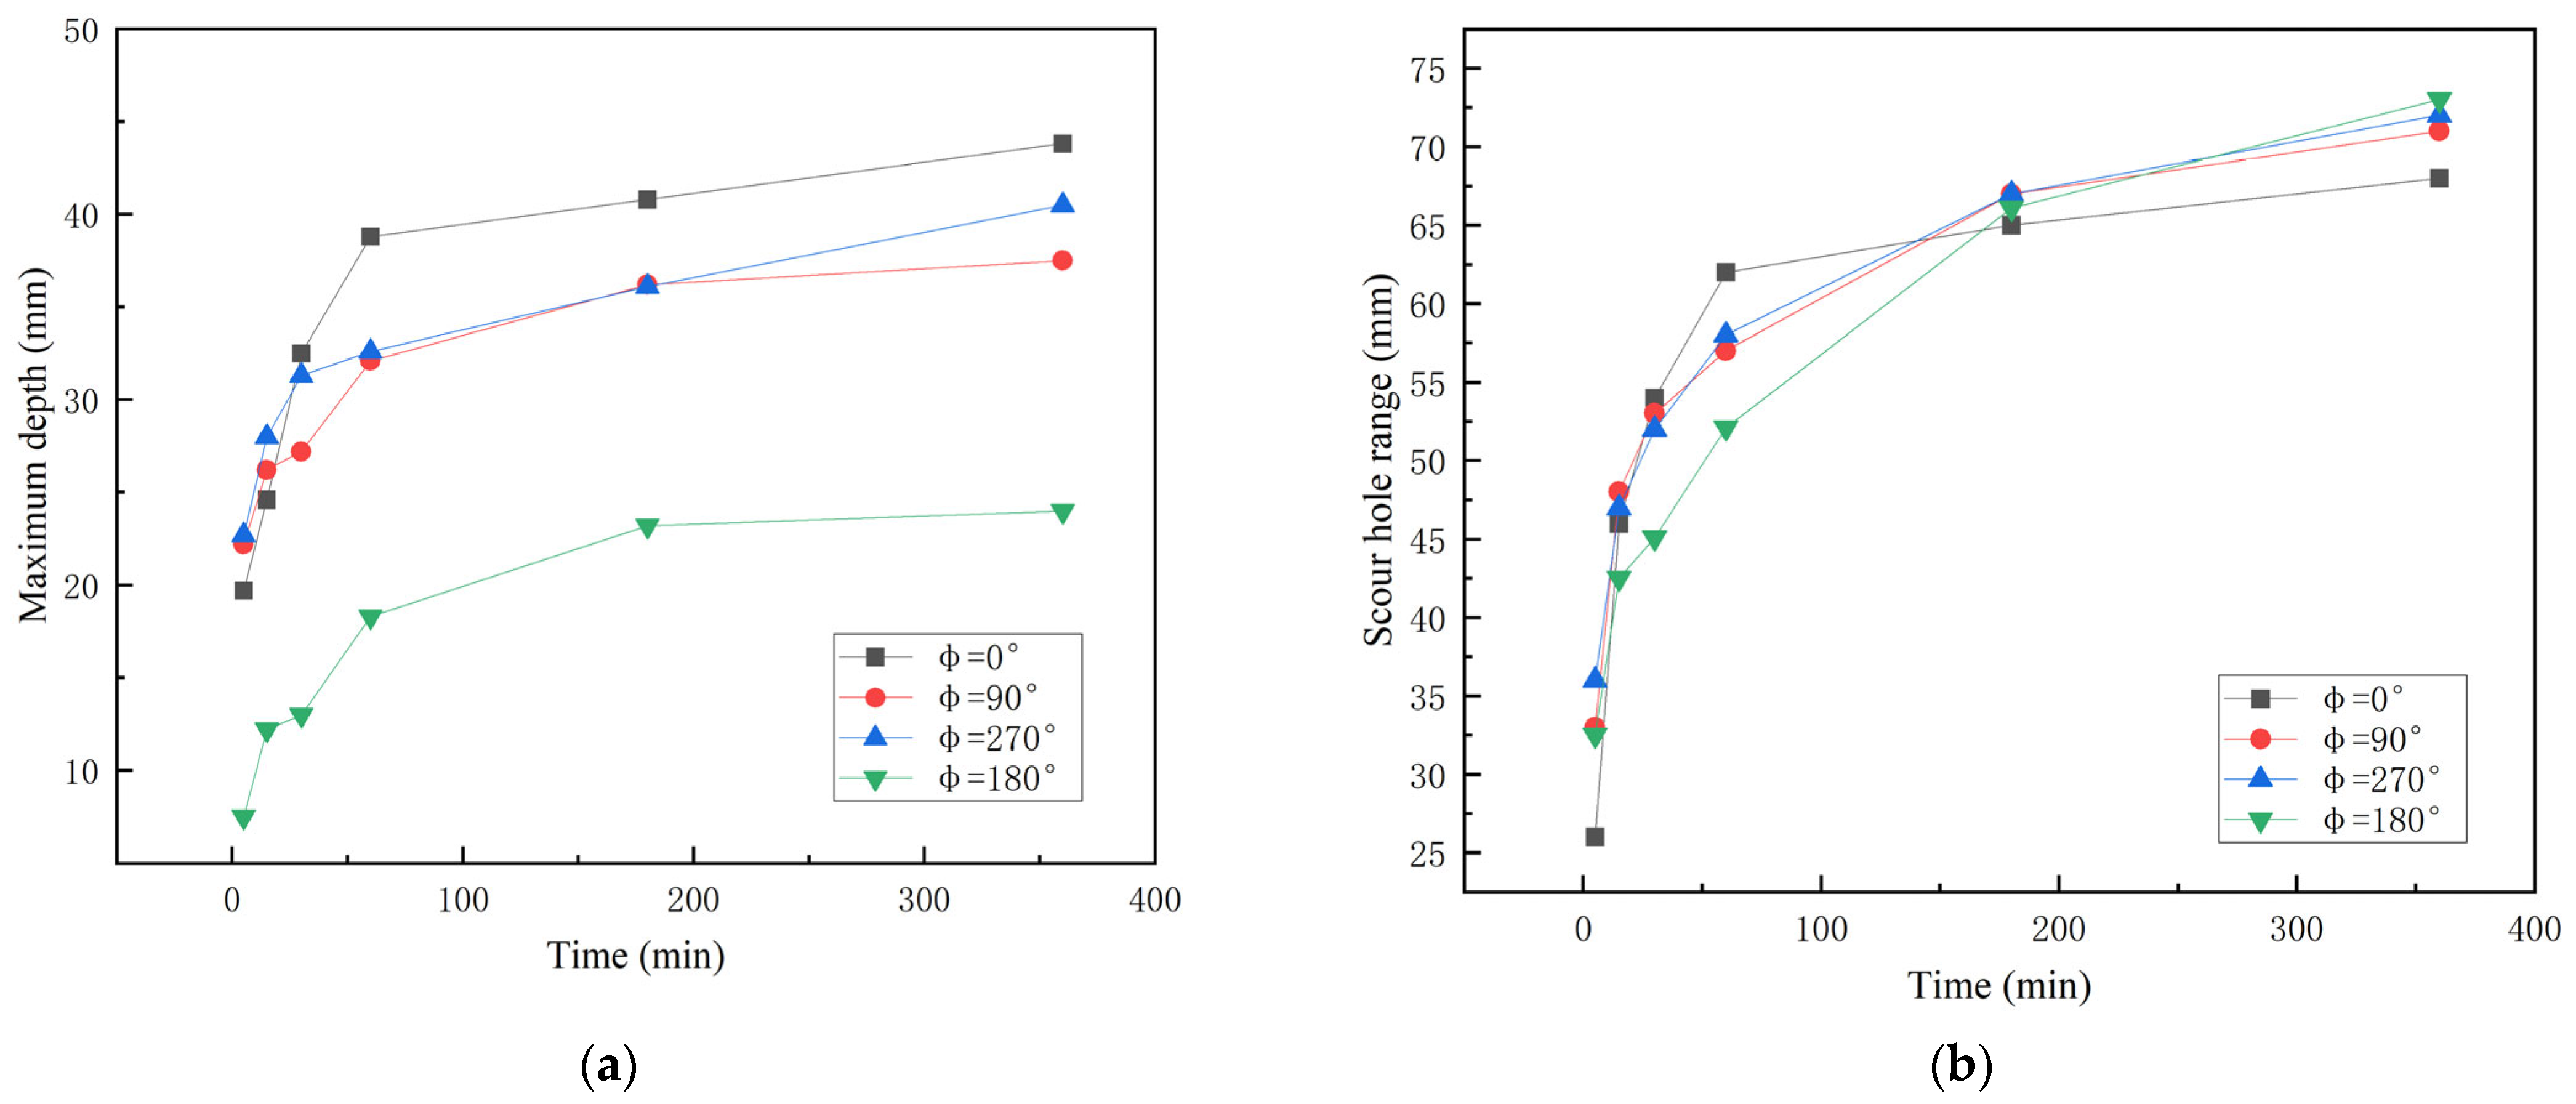
The scour hole morphology data were measured in the pre-experiments to prepare for 3D printing, as presented in Figure 4.
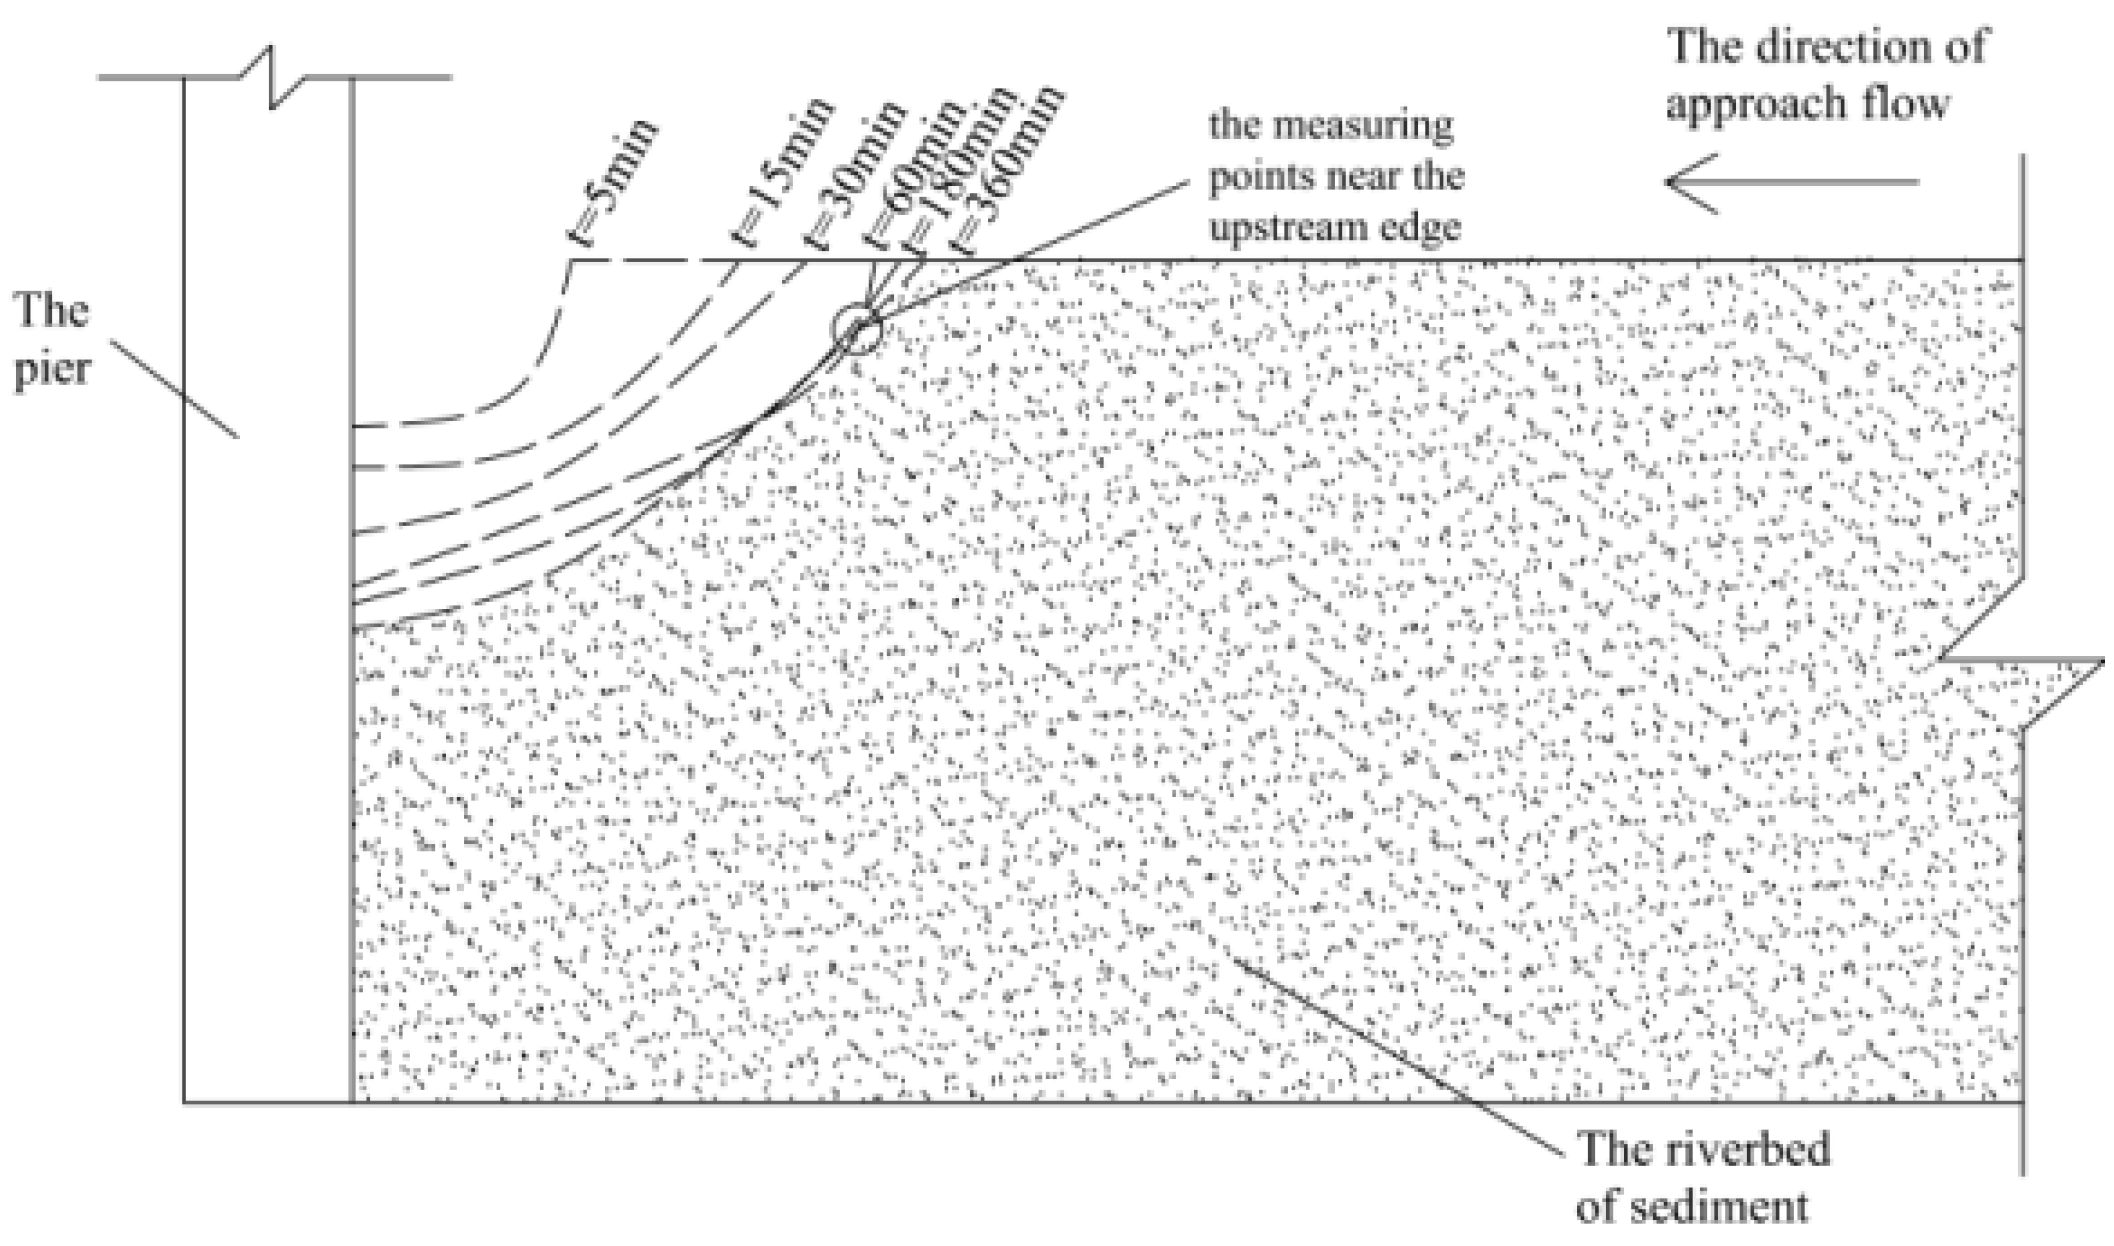
The front part of the pier was the most important study area, and the specific changes of the scour hole in front of the pier can be seen in Figure 5. Throughout the whole process, as is visible when the scouring time exceeds 180 min, the depths of some points near the upstream edge slightly change, which can be considered as one of the manifestations of the scour equilibrium stage.
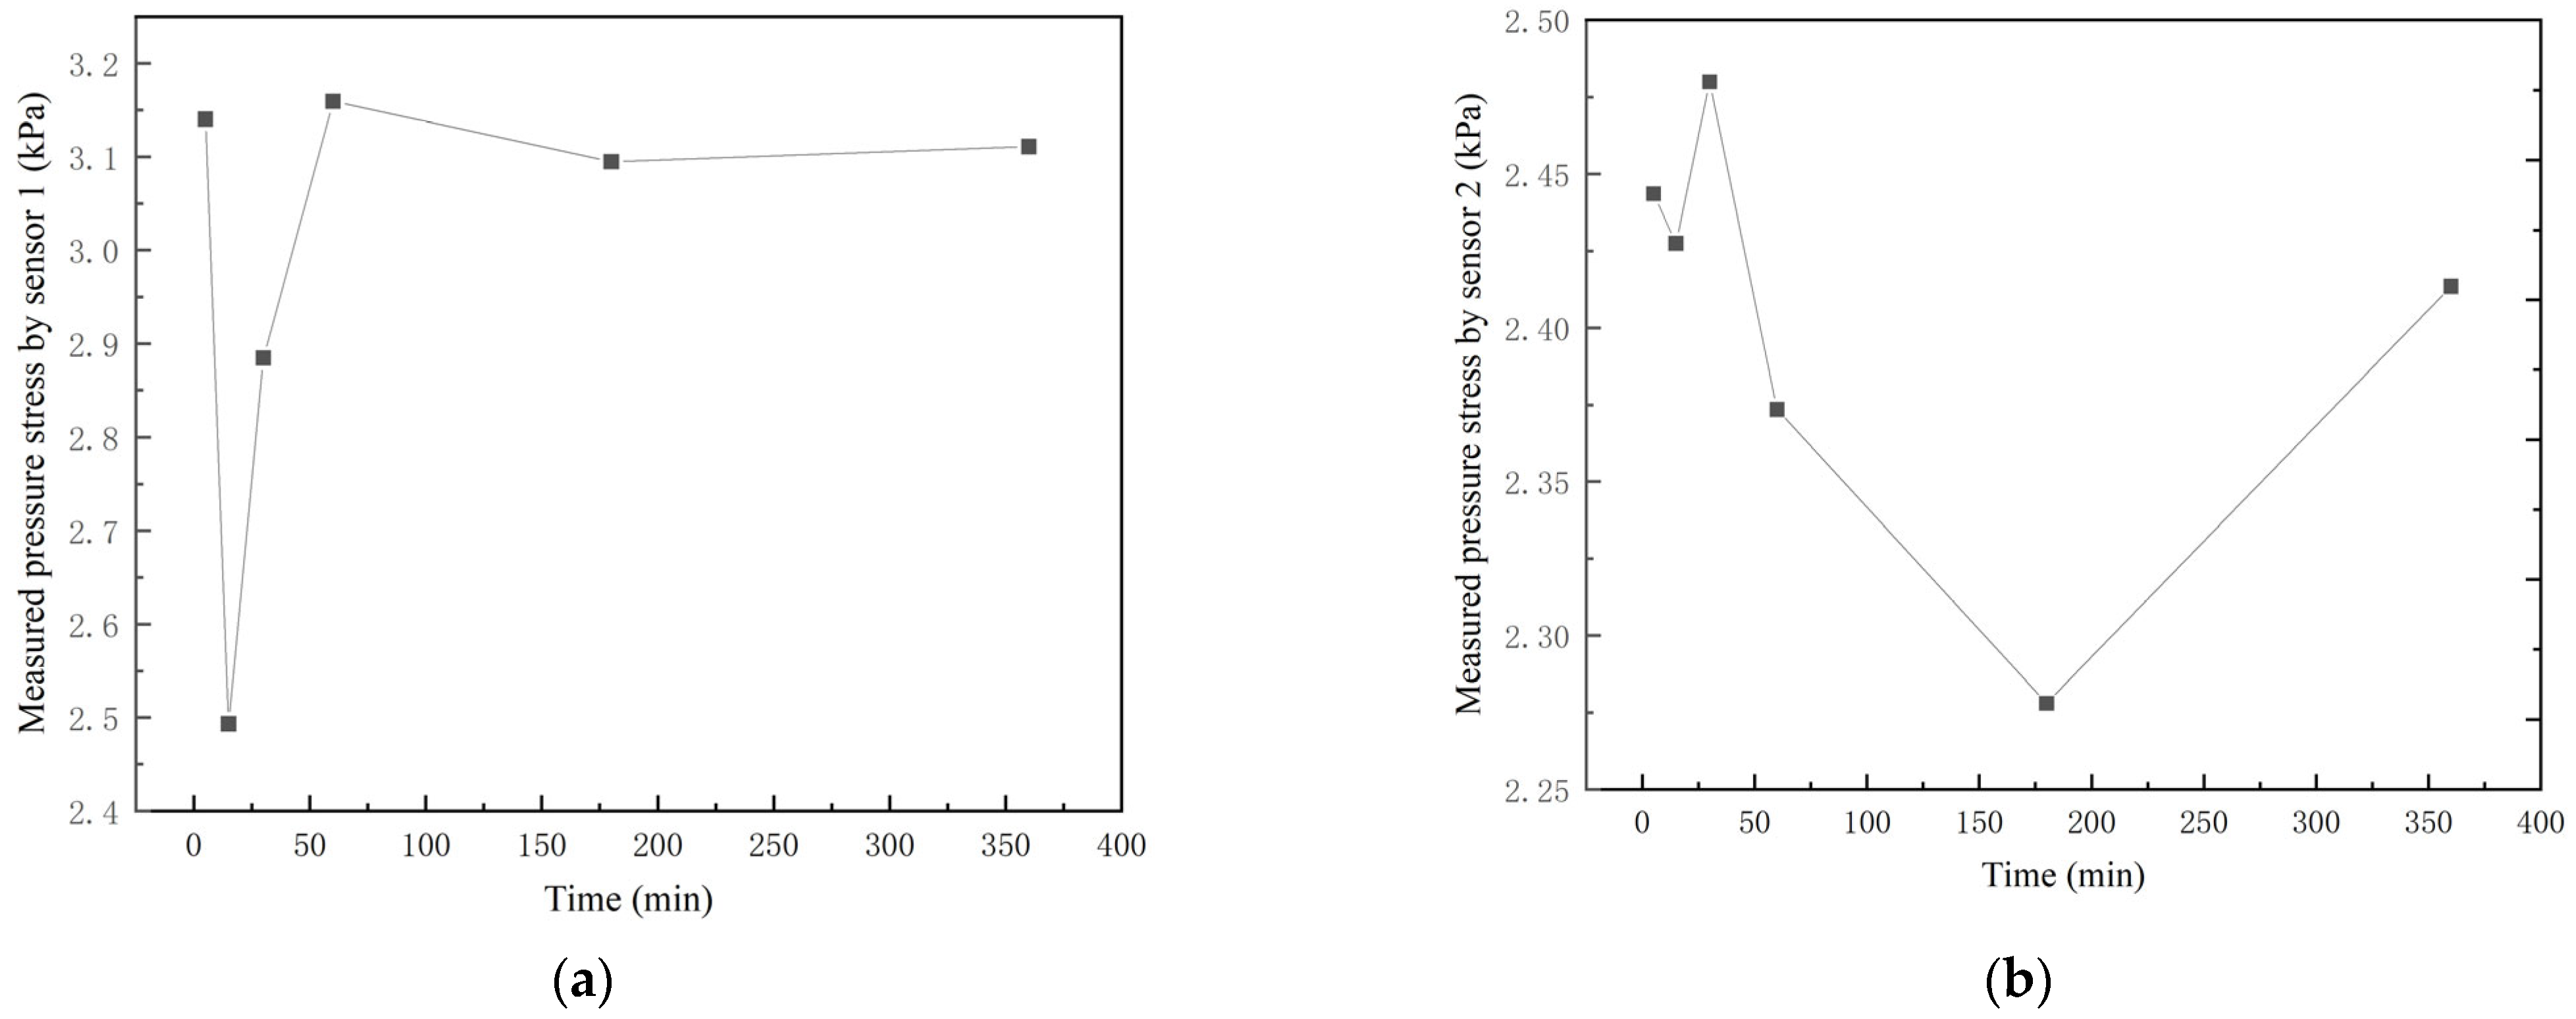
Based on the scour hole morphology data, six models were constructed, as shown in Figure 2. Under identical experimental conditions, the pressure stress data of the measuring points were appropriately extracted (see Table 1). It is clear that the pressure stress values measured by the sensors were always larger than the corresponding hydrostatic pressure values. This indicates that there is certainly a straight downflow, pushing the lower flow and creating some pressure on the surface of the scour hole. Moreover, the p 1 level is always greater than the p 2 level. This means that the closer the hole is to the pier, the stronger the downflow, and the greater the impact.
The change process of pressure stress has been presented in Figure 6. However, by comparing the plotted results in Figure 4 with those in Figure 6, no obvious relationship between the pressure stress at the measuring points and the scour hole morphology in front of the pier can be observed.
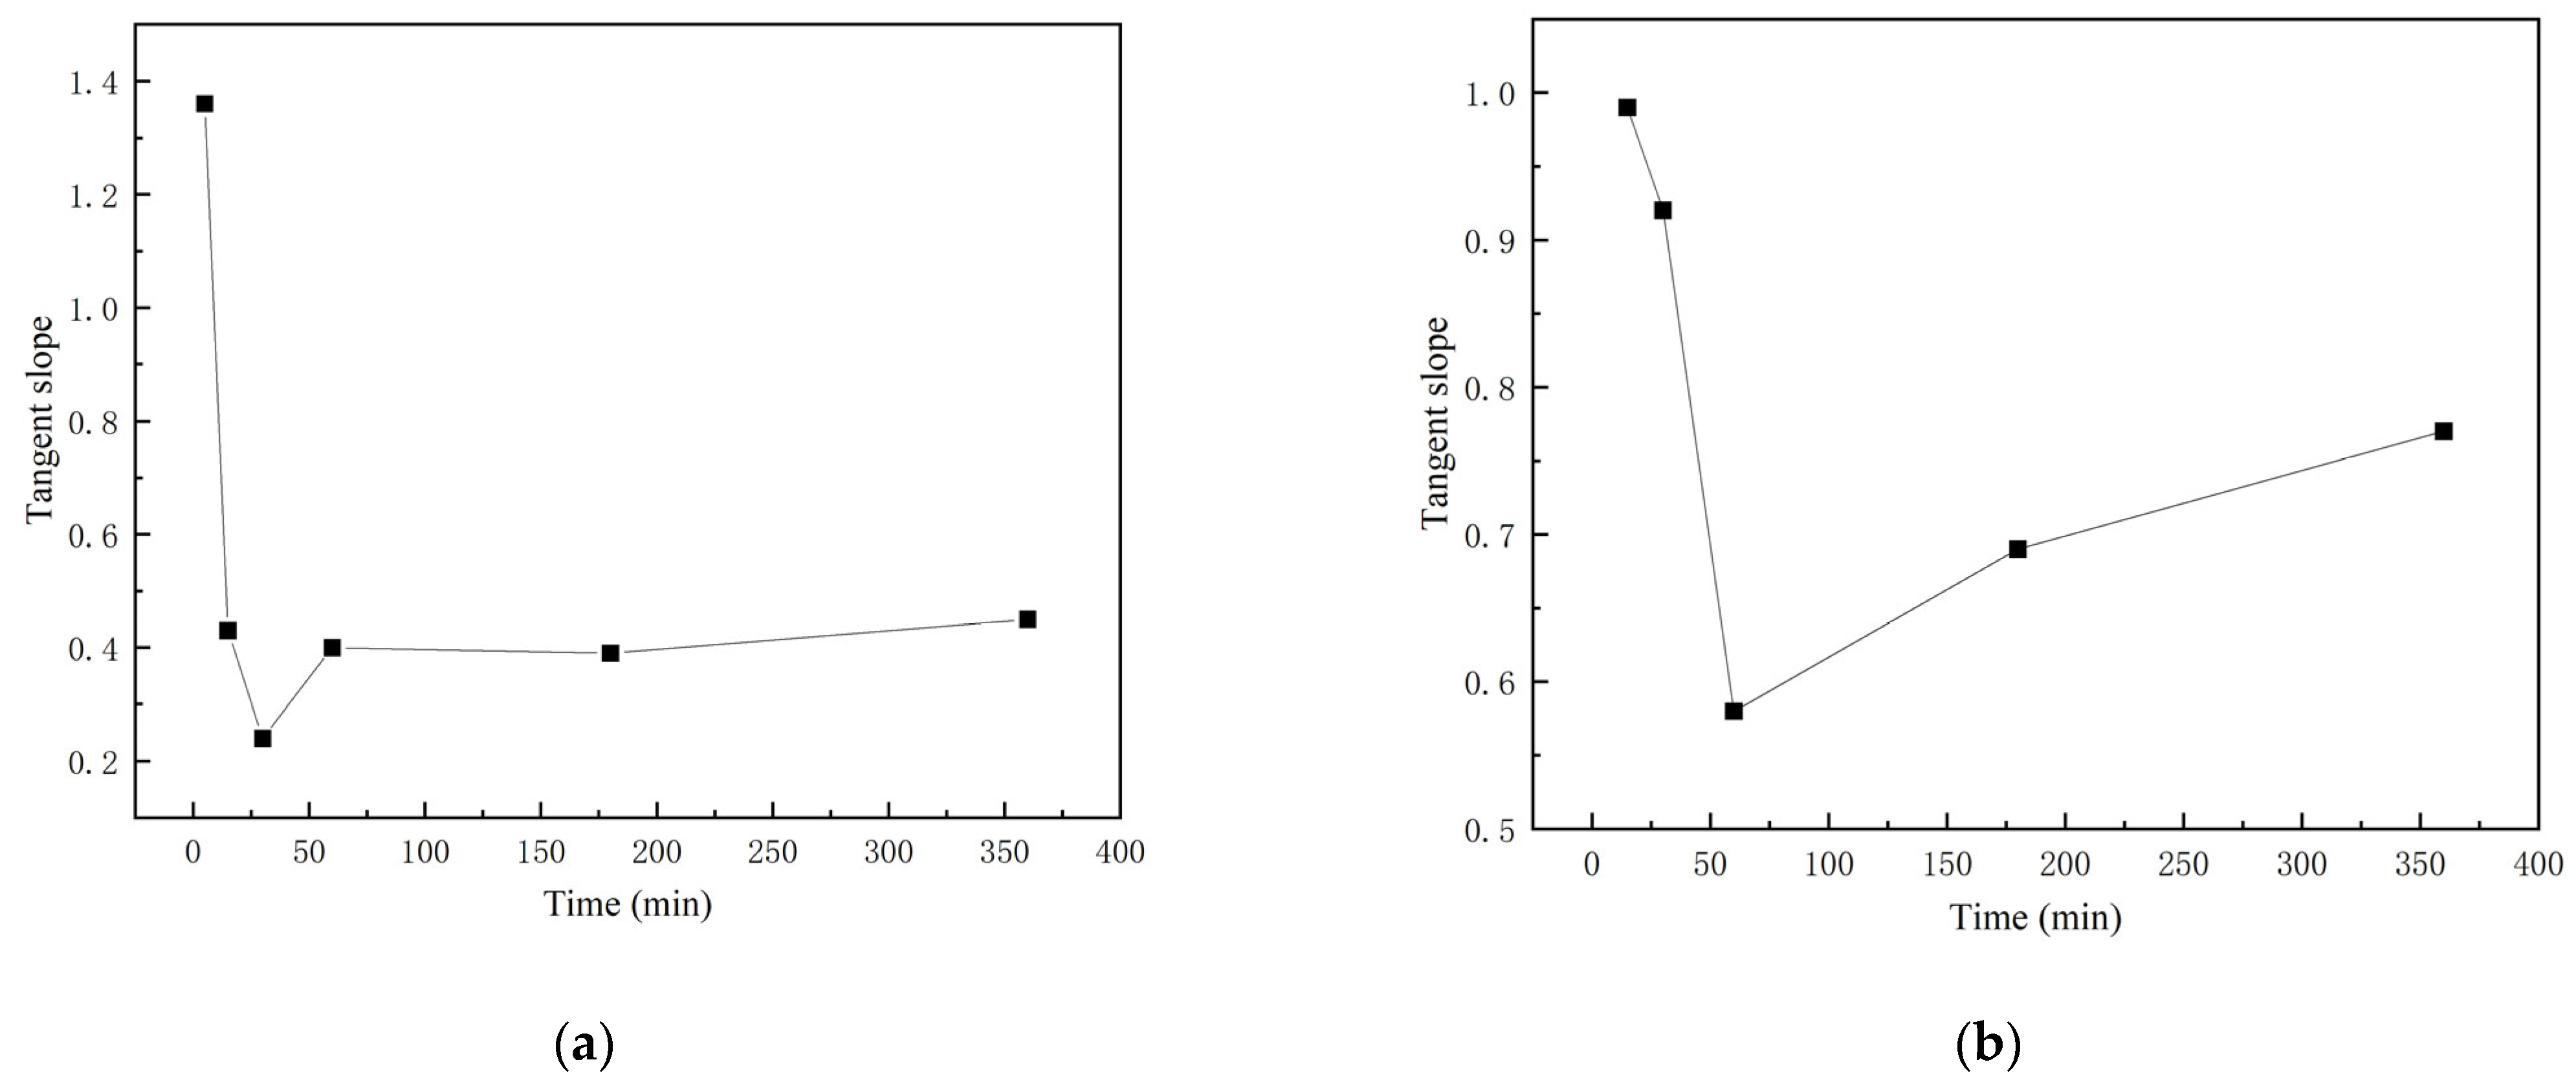
In general, there is an inevitable relationship between the stress endured by the object and the rate of change of the object. Therefore, the rates of change of the scour hole morphology at the measuring points, which were positioned in the tangent slope, were calculated as presented in Figure 7. The tangent slope is equal to the ratio of the maximum scour range to the maximum scour depth at a certain time, and the tangent slope of a measuring point is equal to the external tangent slope of the scour hole morphology fitting function at that time. It is clear that the pressure stress and the tangent slope have the same change process at the same time points. In a broader sense, the physical meaning of the tangent slope ( k ) is the ratio of scour depth to scour hole range. If the value of k increases, this means that the scour hole develops in the direction of increasing depth; otherwise, the scour hole develops in the direction of increasing range.
In other words, the state of stress in the scour hole affects the changing trend of the scour hole morphology. The stress state is determined by the flow structures. This means that when the downflow squeezes the lower flow, greater pressure stress is generated, which affects the change trend of the scour hole’s morphology.
In addition to pressure stress, the stress state in the scour hole also includes the shear stress. Herein, through numerical simulation, the shear stress distribution of the scour hole was appropriately calculated and the findings could be verified with the experimental data against each other, thereby completing the calculation of stress state distribution in the scour hole. A comparison between the predicted maximum scour depth and pressure stress in the simulation and the data of the experiment is provided in Table 2. The relative error between the two data was around 5%, revealing the validity of both the simulation data and the test methods.
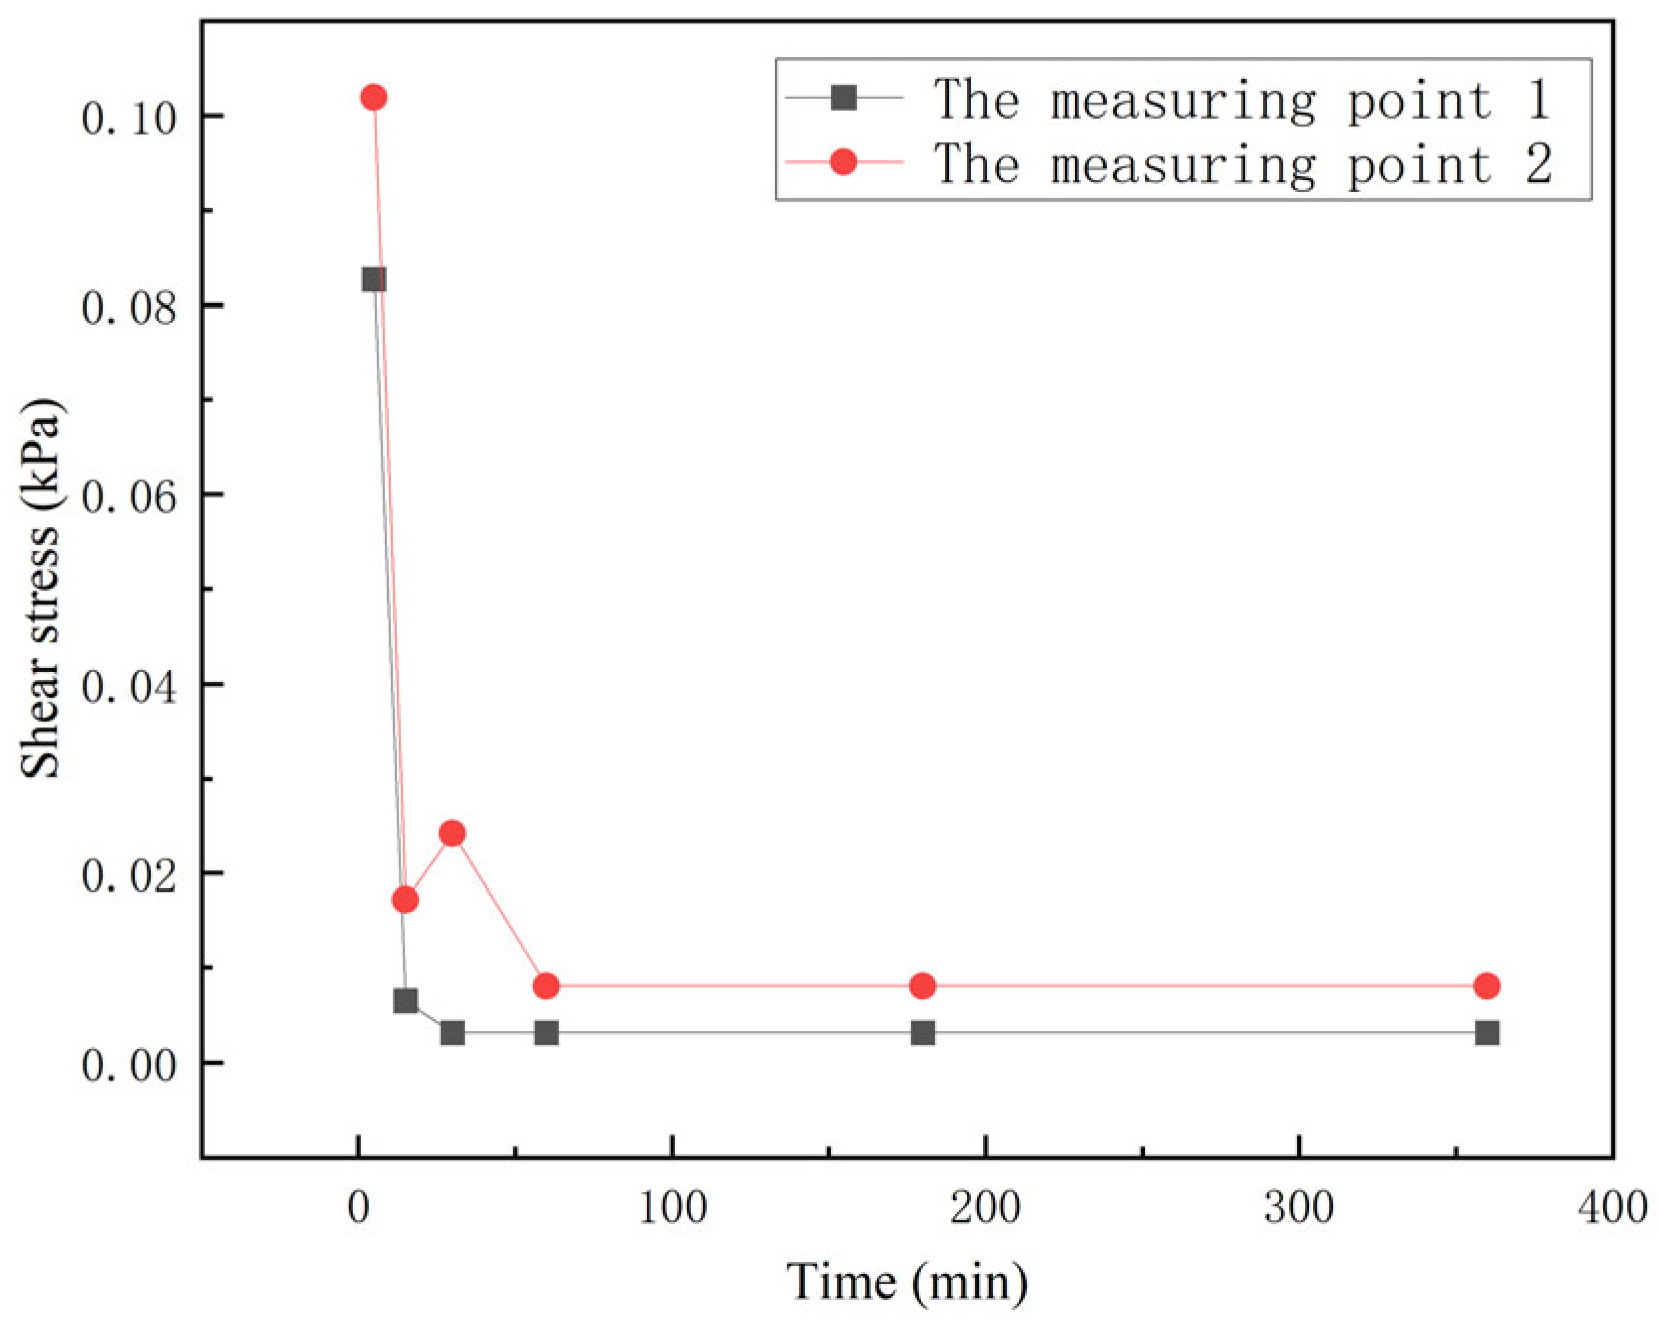
The change process of the shear stress is presented in Figure 8. The plotted results indicate that the magnitudes of both τ s 1 and τ s 2 are very large in the initial stage of scouring. Then, an extremely rapid drop in τ s 1 and τ s 2 in 0–60 min is detectable after scouring begins. Later, the shear stress is at a lower value and remains stable after 60 min.
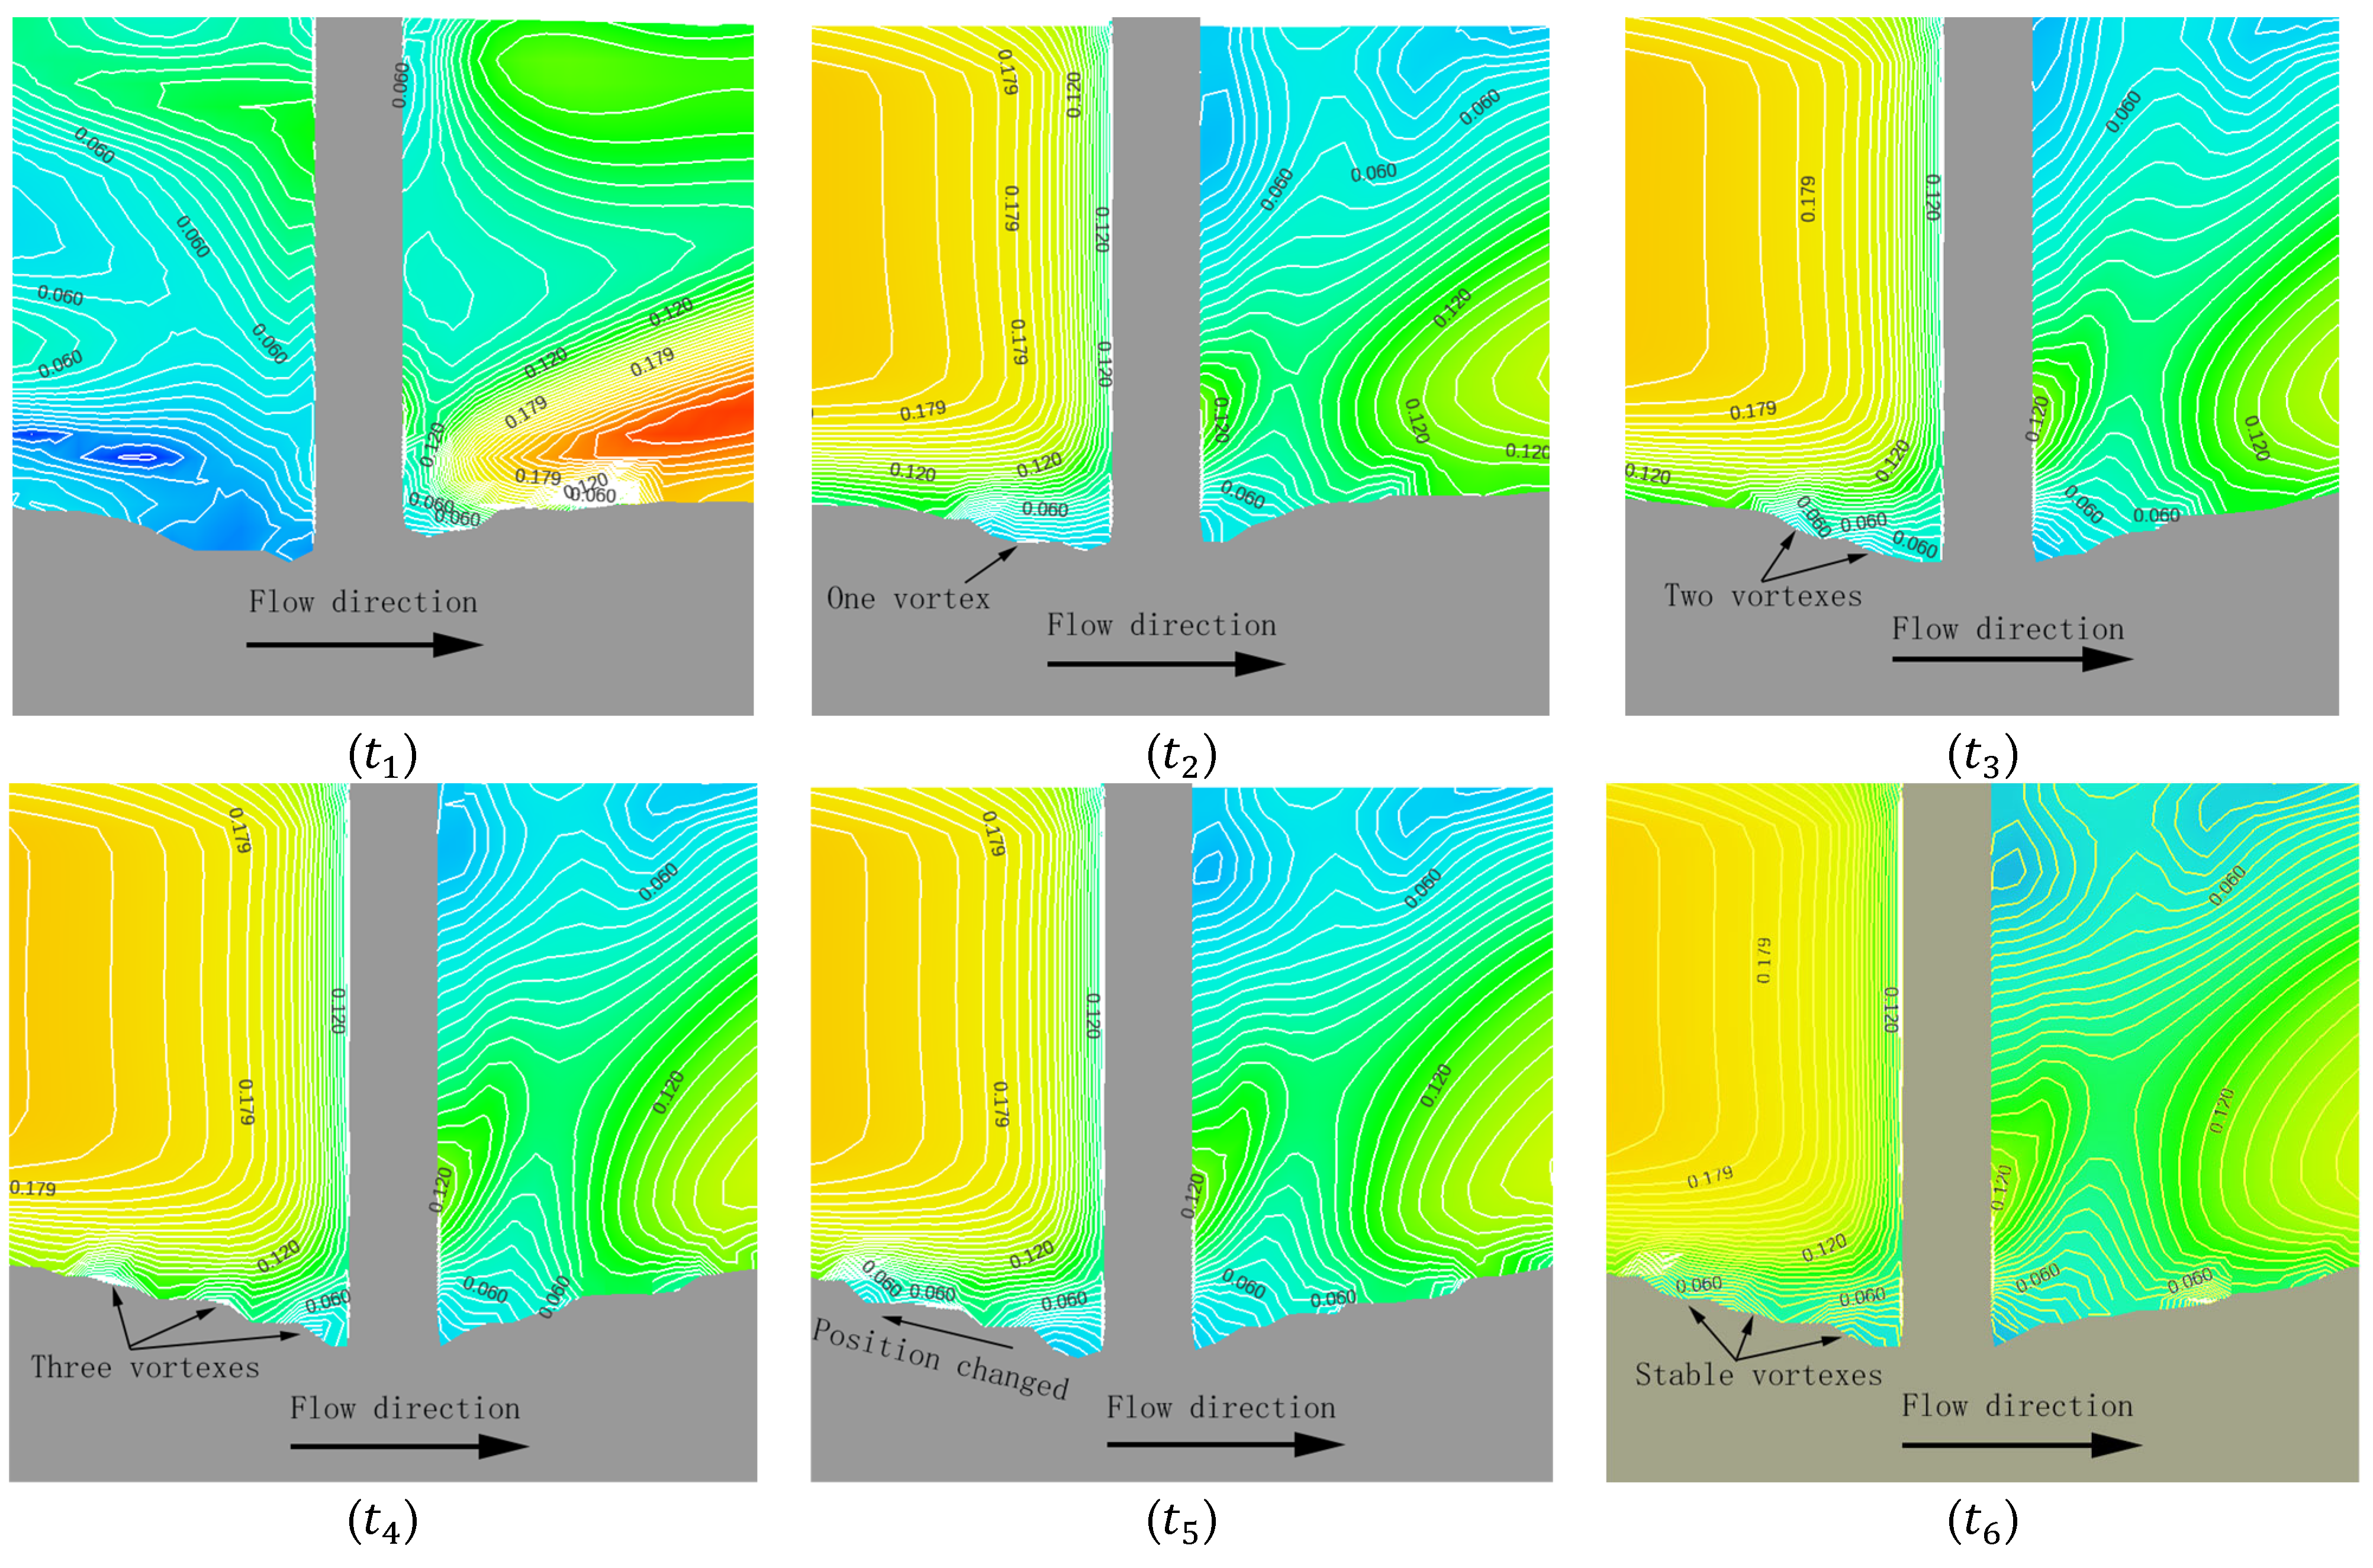
In addition to the pressure stress and shear stress data, the numerical simulations also provide flow field data (see Figure 9). The demonstrated results reveal that there is an obvious change in the flow field from a chaotic state to a stable state. At t 1 , the horseshoe vortex system begins to gradually configure, and the number of vortices change during the process. A large vortex at t 2 is observable, which splits into two smaller vortices at t 3 , and three small vortices are visible at t 4 . At the time t 5 , the positions of the vortices move upward slightly. Furthermore, at t 6 , the number and volume of these vortices become almost stable.
This article is focused on the role of downflow, and two issues will be discussed in some detail. On the one hand, the changing trend of pressure stress is methodically discussed and analyzed as to whether the downflow is affected during the formation of the horseshoe vortex, which leads to the change of pressure stress. On the other hand, the relationship between the stress state (mainly p and τ s ) and the tangent slope ( k ) is discussed, and the effect of two flow structures, including the downflow and the horseshoe vortex system, on the scour cavity morphology is analyzed.

3.2. The Rigorous Interaction between the Downflow and the Horseshoe Vortex System

From the perspective of the flow structures, the formation of the horseshoe vortex system requires time; therefore, the horseshoe vortex system at the beginning of scouring does not have an obvious effect on the scour hole at the pier junction. Therefore, the downflow is able to affect the riverbed without disturbance and can create a large amount of pressure stress, after which the sediment is affected and suspended. It is worth mentioning that the downflow is also able to induce lateral shear stress on the sediment surface, which means that part of the initial shear stress is due to the downflow. Subsequently, the horseshoe vortex system develops and its size gradually increases. During this process, the flow structures at the junction in front of the pier are in a state of constant change and are constantly colliding and rubbing, producing an energy dissipation effect that reduces the impact of the downflow on the riverbed. Additionally, p decreases significantly by 24%. When the horseshoe vortex system is fully formed and stabilized, the energy dissipation is reduced and the downflow can again affect the riverbed surface, causing a 22% increase in p . Unlike the beginning of the scouring process, a complete horseshoe vortex system is formed at the junction of the bridge pier, and the downflow is still slightly consumed; therefore, p does not return to its initial value.
From the perspective of energy, the horseshoe vortex system can be viewed as an energy body that is required to absorb energy to form, and the downflow is responsible for transferring this energy from top to bottom. At the beginning of the scouring process, the downflow is able to directly affect the riverbed surface and there is almost no energy loss, which causes a large stress state at the sediment’s surface. Additionally, as the downflow squeezes the underlying water, energy accumulates at the pier junction, where the energy can be utilized to form a horseshoe vortex system. The horseshoe vortex system continues to absorb energy, which reduces the energy transferred to the sediment by the downflow and causes it to decrease. Thus, the value of p on the riverbed surface decreases. When the horseshoe vortex system is fully formed, it no longer needs to absorb much energy, and the downflow can transfer energy back to the sediments, thereby increasing the value of p . As the horseshoe vortex system extends downstream with the flow, it still needs to absorb some energy from the downflow to maintain its stability, which is the reason why p does not return to its initial value.
In addition, there is a slight difference between the change curves of the two measuring points. In Figure 7, it is clear that the changing trend at measuring point 2 is slower and the corresponding degree is also smaller, which can be explained in terms of the flow structure. The horseshoe vortex system consists of several vortices of various sizes and intensities. The vortices located at measuring point 1 are able to absorb more energy from the downflow earlier in the process, and this affects the energy absorption of the vortices at measuring point 2. The downflow’s energy distribution causes a time lag and a smaller range of variation in developing a horseshoe vortex system at point 2.
In summary, in terms of the interaction between the downflow and the horseshoe vortex system, its intensity reaches the maximum level during the formation of the horseshoe vortex system, while the intensity is relatively low before and after that point. The amount of pressure stress is exactly opposite to the intensity of the interaction, which makes the pressure stress greater in the initial and equilibrium stages and smaller in the development stage. At the same time, the amount of pressure stress also reflects the impact capacity of the downflow on the sediment of the riverbed. It can be seen that the amount of pressure stress on the riverbed’s surface has the same change trend as the tangent slope. This suggests that there could be a close relationship between the flow structures and the scour hole geometry.

3.3. The Stress State and the Tangent Slope

The movement of sediment particles is closely related to the state of stress. The sediment particles on the slope of the inner surface of the scour hole will not move if the stress distribution balances them. Otherwise, the sediment particles will move accordingly, including floating and rolling up or down along the scour hole’s surface.
Therefore, the sediment stress state is essentially related to the scour hole morphology; herein, k is employed as a main factor to represent the scour hole morphology. In a broad sense, the tangent slope ( k ) is physically denoted as the ratio of scour depth to scour hole range. Within a certain period of time, if k decreases, this means that the stress state is conducive to the development of a scour range. If k increases, the stress state leads to the development of scour depth.
In the current research, at the initial stage of local scour, from 0 to t 2 , the pier obstructed the flow and began to form a downflow, and this downflow directly rushed into the riverbed, resulting in a large initial p value. Then, the downflow was blocked by the riverbed and bridge pier, and an upstream jet appeared, contributing to the initial τ s , which was also large. The p and τ s values enabled the sediment particles to be more stable on more sloping slopes, supporting a large initial value for k . Immediately, a sharp drop in p and τ s was observed, which caused the sediment particles to become unstable, and the slope could not be maintained to a large extent; therefore, k also followed a decreasing trend. For measuring point 2, which is farther from the pier, there was a difference that changed from the outside to the inside of the scour hole. In other words, it exhibited a process from being “unaffected” to being “affected” by the flow structures of local scour. Therefore, p 2 exhibited an upward trend. Although p 2 had increased, k 2 still decreased as τ s 2 decreased, indicating that τ s had a more significant influence.
In the development stage, from t 2 to t 4 , the two measuring points exhibited different states. For measuring point 1, τ s 1 was stably maintained at the minimum value, which means that the horseshoe vortex system had basically formed in this region. When τ s 1 was stable, k 1 was directly proportional to p 1 . Therefore, with increasing p 1 , k 1 would increase, and the stress state was favorable for the development of scour depth. As a result, downflow could increase the scour’s depth development. For measuring point 2, there was a slight lag phenomenon, the horseshoe vortex system was still forming, and τ s 2 was still changing slightly. The k 2 and p 2 values basically showed a direct relationship. What is strange is that from t 3 to t 4 , k 2 increased, while p 2 decreased. Along with the change of measuring point 1, which was the difference in the degree of change between k 1 and p 1 , a kind of sediment movement was detected in the scour hole. When the values of τ s and p were small enough, the sediment particles slid deeper, due to a loss of support. Therefore, at t 3 , p 2 continued to decrease, but the sliding sediment caused k 2 to increase somewhat, and sediment was added to measuring point 1, after which the degree of increase of k 1 was significantly less than that of p 1 .
In the equilibrium stage, which was from t 4 to t 6 , local scour was essentially stable. For measuring point 1, τ s 1 was kept to a minimum, and k 1 changed slightly, such that it was proportional to p 1 . For measuring point 2, according to its time lag, after τ s 2 reached its lowest value from t 4 to t s 5 , the sediment was still sliding slowly, the vortex position changed, and p 2 decreased, but k 2 was almost stable. From t 4 to t 5 , in the case of constant τ s 2 , k 2 also changed and was directly proportional to p 2 .
In summary, under different stress conditions, the scour hole presents different morphologies. As an along-slope force, decreasing τ s below the threshold causes the sediment to slide down, just like in a collapse, which may explain why large sediment particles end up uniformly at the bottom of the scour hole after the scouring process ends. This type of sediment movement causes the development of the scour range, fills the sediment to the bottom, and slows down the development of scour depth. Therefore, the development rate of scour depth decreases as τ s decreases regardless of the change in p . After the stabilization of τ s , if p increases, k will also increase, indicating that p contributes to the deepening of the scour hole. The relationships among the flow structures can then be discussed. As an effective factor in scour hole morphology, the horseshoe vortex system, which is thus shown to be related to τ s , can enhance the development of the scour range. Before and after the presence of the horseshoe vortex system, the downflow is able to supply energy to the sediment, suspend the sediment, and accelerate the development of scour hole depth.

4. Conclusions

In this paper, the characteristics and mechanism of downflow when subjected to clean-water local scour were systematically examined by experiments and numerical simulations. In the experiments, the scour hole was wholly reconstructed using 3D-printing technology, and the pressure stress distribution was accurately measured. The accuracy of the reported data was verified by comparing the results of the experiments and simulations. This test method exhibited two advantages. One is that to a great extent, the morphology of the scour hole is restored within a certain time. The other is that this minimizes the interference of sediment in the locations used for sensor installation. This experimental design can serve as a reference for future investigations.
By analyzing the measured pressure stress data, the relationship between the downflow and the horseshoe vortex system was methodically discussed. From the perspective of flow structures, the flow structures collide and rub against each other and establish an effect similar to energy dissipation, which weakens the impact of the downflow and reduces the pressure stress on the riverbed surface. This phenomenon is very evident in the formation of the horseshoe vortex system, which causes the pressure stress to be at its lowest value. Before and after its formation, the strength is weak, and the pressure stress is relatively high. From the perspective of energy transfer, the horseshoe vortex system needs to absorb the energy carried by the downflow to develop. During formation, it absorbs more energy, reducing the energy input to the downflow sediment and reducing the pressure stress. Once formed, the horseshoe vortex system only needs to absorb less energy to maintain its stability and increase the pressure stress.
The relationship between the flow structures and the scour hole morphology was also discussed by analyzing the stress state and the tangent slope. The tangent slope is a parameter that is able to reflect the development direction of the scour hole. When it increases, the stress state is favorable for the development of scour depth; conversely, the stress state is favorable for the development of scour range. According to the experimentally observed data, the results reveal that the stress–strain curves and the tangent slope are almost similar. First of all, shear stress can be regarded as a force to maintain sediment stability on slopes, which means that a drop in the shear stress directly causes a drop in tangent slope, regardless of any change in the pressure stress. Secondly, in the process of reducing the shear stress, the phenomenon of sediment sliding to a greater depth can be observed, which promotes the development of the scour range. Finally, after stabilization of the shear stress, the tangent slope becomes proportional to the pressure stress, which means that the increase in pressure stress causes the scour depth to develop. According to these results, under the condition that the horseshoe vortex system is stable, the downflow is able to accelerate the development of scour hole in terms of depth.
In this study, a new technique was implemented to measure the scour hole data. This approach can serve as a valuable reference for other experimental studies. The major discovery of this research was the examination of downflow features, which have not been thoroughly explored before and can be used as a basis for further investigations. In future research, it will be crucial to enhance the local scour theory by taking into account additional factors that may impact the pier and by incorporating downflow into the scour depth calculation formula.

Author Contributions

Writing—original draft preparation, W.W.; conceptualization, S.W.; methodology, D.Z.; writing—review and editing, J.W.; funding acquisition, H.D. All authors have read and agreed to the published version of the manuscript.

Funding

This work was supported by the Anhui Transportation Holding Group Co., Ltd., science and technology project “Evaluation and protection measures of bridge foundation erosion in Anhui Province” (NO. 2017010650).

Institutional Review Board Statement

Not applicable.

Informed Consent Statement

Not applicable.

Data Availability Statement

Data used to produce this paper are available on contact of the corresponding author.

Conflicts of Interest

Author Haipeng Duan was employed by Anhui Transportation Holding Group Co., Ltd., while contributing to this manuscript. The authors declare that the research received funding from Anhui Transportation Holding Group Co., Ltd. The funder was not involved in the study design, analysis, interpretation of data, writing of this article or the decision to submit it for publication.

List of Symbols

ZScour depth
ZmaxMaximum scour depth
Z1Scour depth at measuring point 1
Z2Scour depth at measuring point 2
kTangent slope
k1Tangent slope at measuring point 1
k2Tangent slope at measuring point 2
pPressure stress
pDDynamic water pressure stress
pHHydrostatic pressure stress
p1Pressure stress at measuring point 1
p2Pressure stress at measuring point 2
τ s Shear stress
τ s 1 Shear stress at measuring point 1
τ s 2 Shear stress at measuring point 2.
DPier diameter
d50Median diameter of the sediment
VFlow velocity
VCCritical flow velocity of the sediment
HFlow depth
tsThickness of the sand layer
RDReynolds number of the pier ( = V D / ν )
ν Molecular kinematic viscosity
tTime factor
t1t6A set of six measured time points

References

  1. Hunt, D. Monitoring Scour Critical Bridges; The National Academies Press: Washington, DC, USA; Transportation Research Board: Washington, DC, USA, 2009. [Google Scholar] [CrossRef]
  2. Al-Mussawi, W.; Kais, H. Three-dimensional numerical simulation of local scour around circular bridge pier using Flow-3D software. IOP Conf. Ser. Mater. Sci. Eng. 2020, 745, 012150. [Google Scholar] [CrossRef]
  3. Wang, C.; Yu, X.; Liang, F. A review of bridge scour: Mechanism, estimation, monitoring and countermeasures. Nat. Hazards 2017, 87, 1881–1906. [Google Scholar] [CrossRef]
  4. Fang, S.-L. Experiment study on the influence of local scour pit on flow field around piers. Port Waterw. Eng. 2009, 11, 143–152. [Google Scholar] [CrossRef]
  5. Ranjbar Zahedani, M. Introducing, Examining and Optimising Flow Diversion Structure as an Innovative Countermeasure against Local Scour around Bridge Piers. Ph.D. Thesis, University of Technology Sydney, Ultimo, Australia, 2021. [Google Scholar]
  6. Melville, B.W.; Raudkivi, A. Flow characteristics in local scour at bridge piers. J. Hydraul. Res. 1977, 15, 373–380. [Google Scholar] [CrossRef]
  7. Dargahi, B. The turbulent flow field around a circular cylinder. Exp. Fluids 1989, 8, 1–12. [Google Scholar] [CrossRef]
  8. Raudkivi, A.; Ettema, R. ClearWater Scour at Cylindrical Piers. J. Hydraul. Eng.-Asce 1983, 109, 338–350. [Google Scholar] [CrossRef]
  9. Mercuri, M.; Pathirage, M.; Gregori, A.; Cusatis, G. Influence of self-weight on size effect of quasi-brittle materials: Generalized analytical formulation and application to the failure of irregular masonry arches. Int. J. Fract. 2023, 246, 117–144. [Google Scholar] [CrossRef]
  10. Melville, B.W. Live-bed scour at bridge piers. J. Hydraul. Eng. 1984, 110, 1234–1247. [Google Scholar] [CrossRef]
  11. Benedict, S.T.; Caldwell, A.W. A Pier-Scour Database: 2427 Field and Laboratory Measurements of Pier Scour; 2327-638X; US Geological Survey: Reston, VA, USA, 2014.
  12. Fakhimjoo, M.; Ardeshir, A.; Behzadian, K.; Karami, H. Experimental investigation and flow analysis of clear-water scour around pier and abutment in proximity. Water Sci. Eng. 2023, 16, 94–105. [Google Scholar] [CrossRef]
  13. Rahman, M.; Haque, A. Local scour estimation at bridge site: Modification and application of lacey formula. Int. J. Sediment Res. 2003, 18, 333–339. [Google Scholar]
  14. Baker, C.J. The position of points of maximum and minimum shear stress upstream of cylinders mounted normal to flat plates. J. Wind Eng. Ind. Aerodyn. 1985, 18, 263–274. [Google Scholar] [CrossRef]
  15. Briaud, J.L.; Ting, F.; Chen, H.; Gudavalli, R.; Perugu, S.; Wei, G. SRICOS: Prediction of scour rate in cohesive soils at bridge piers. J. Geotech. Geoenviron. Eng. 1999, 125, 237–246. [Google Scholar] [CrossRef]
  16. Devenport, W.; Simpson, R. Time-dependent and time-averaged turbulence structure near the nose of a wing-body junction. J. Fluid Mech. 1990, 210, 23–55. [Google Scholar] [CrossRef]
  17. Apsilidis, N.; Diplas, P.; Dancey, C.; Vlachos, P.; Raben, S. Local Scour at Bridge Piers: The Role of Reynolds Number on Horseshoe Vortex Dynamics. In Proceedings of the International Conference on Scour and Erosion, San Francisco, CA, USA, 7–10 November 2010; pp. 86–94. [Google Scholar] [CrossRef]
  18. Guan, D.; Chiew, Y.-M.; Wei, M.; Hsieh, S.-C. Characterization of horseshoe vortex in a developing scour hole at a cylindrical bridge pier. Int. J. Sediment Res. 2019, 34, 118–124. [Google Scholar] [CrossRef]
  19. Kwan, T.F. A Study of Abutment Scour; University of Auckland New Zealand: Auckland, New Zealand, 1984. [Google Scholar]
  20. Shafii, I.; Zhang, Z.; Briaud, J.L. Measurement of Hydrodynamic Forces on Gravel Particles in the Erosion Function Apparatus. Ph.D. Thesis, Texas A&M University, College Station, TX, USA, 2018; pp. 519–524. [Google Scholar]
  21. Sun, Z.; Dong, H.; Sun, Y.; Li, Z. New formula for scour depth at piles based on energy equilibrium. Ocean Eng. 2023, 287, 115725. [Google Scholar] [CrossRef]
  22. Unger, J.; Hager, W. Down-flow and horseshoe vortex characteristics of sediment embedded bridge piers. Exp. Fluids 2007, 42, 1–19. [Google Scholar] [CrossRef]
  23. Ahmed, F.; Rajaratnam, N. Flow around bridge piers. J. Hydraul. Eng. 1998, 124, 288–300. [Google Scholar] [CrossRef]
  24. Zarrati, A.R.; Nazariha, M.; Mashahir, M. Reduction of Local Scour in the Vicinity of Bridge Pier Groups Using Collars and Riprap. J. Hydraul. Eng.-Asce 2006, 132, 154–162. [Google Scholar] [CrossRef]
  25. Cheng, L.-Y.; Mou, X.-Y.; Wen, H.; Hao, L.-Z. Experimental research on protection of ring-wing pier against local scour. Adv. Sci. Technol. Water Resour. 2012, 32, 14–18. [Google Scholar] [CrossRef]
  26. Jiang, S.; Zhang, Z.; Cheng, Y.Z.; Ge, Y.B. Numerical simulation on reducing the local scour around a vertical pile by using a protective pile. Chin. J. Hydrodyn. 2019, 34, 122–130. [Google Scholar] [CrossRef]
  27. Roulund, A.; Sumer, B.; Fredsoe, J.; Michelsen, J. Numerical and experimental investigation of flow and scour around a circular pile. J. Fluid Mech. 2005, 534, 351–401. [Google Scholar] [CrossRef]
  28. Khosronejad, A.; Flora, K.; Kang, S. Effect of Inlet Turbulent Boundary Conditions on Scour Predictions of Coupled LES and Morphodynamics in a Field-Scale River: Bankfull Flow Conditions. J. Hydraul. Eng. 2020, 146, 04020020. [Google Scholar] [CrossRef]
  29. Wang, F.; Zhang, B.; Qi, J. 3D numerical investigation of bridge pier-scour development using a dynamic-mesh updating technique. South-North Water Transf. 2017, 15, 132–137. [Google Scholar] [CrossRef]
  30. Yu, P.; Zhu, L. Numerical simulation of local scour around bridge piers using novel inlet turbulent boundary conditions. Ocean Eng. 2020, 218, 108166. [Google Scholar] [CrossRef]
  31. Kirkil, G.; Constantinescu, G.; Ettema, R. Detached Eddy Simulation Investigation of Turbulence at a Circular Pier with Scour Hole. J. Hydraul. Eng.-Asce 2009, 135, 888–901. [Google Scholar] [CrossRef]
  32. Keshavarzi, A.; Melville, B.; Ball, J. Three-dimensional analysis of coherent turbulent flow structure around a single circular bridge pier. Environ. Fluid Mech. 2014, 14, 821–847. [Google Scholar] [CrossRef]
  33. Pasiok, R.; Stilger-Szydło, E. Sediment particles and turbulent flow simulation around bridge piers. Arch. Civ. Mech. Eng. 2010, 10, 67–79. [Google Scholar] [CrossRef]
  34. Guo, J.; Gu, S.P.; Zhang, H.X.; Liao, Q.X. Comparison of calculation methods for cylindrical piers under scouring conditions. Zhejiang Univ. Technol. 2019, 47, 637–641. [Google Scholar]
  35. Aghaee, Y.; Hakimzadeh, H. Three Dimensional Numerical Modeling of Flow around Bridge Piers Using LES and RANS. In Proceedings of the River Flow, Braunschweig, Germany, 8–10 September 2010; pp. 211–218. [Google Scholar]
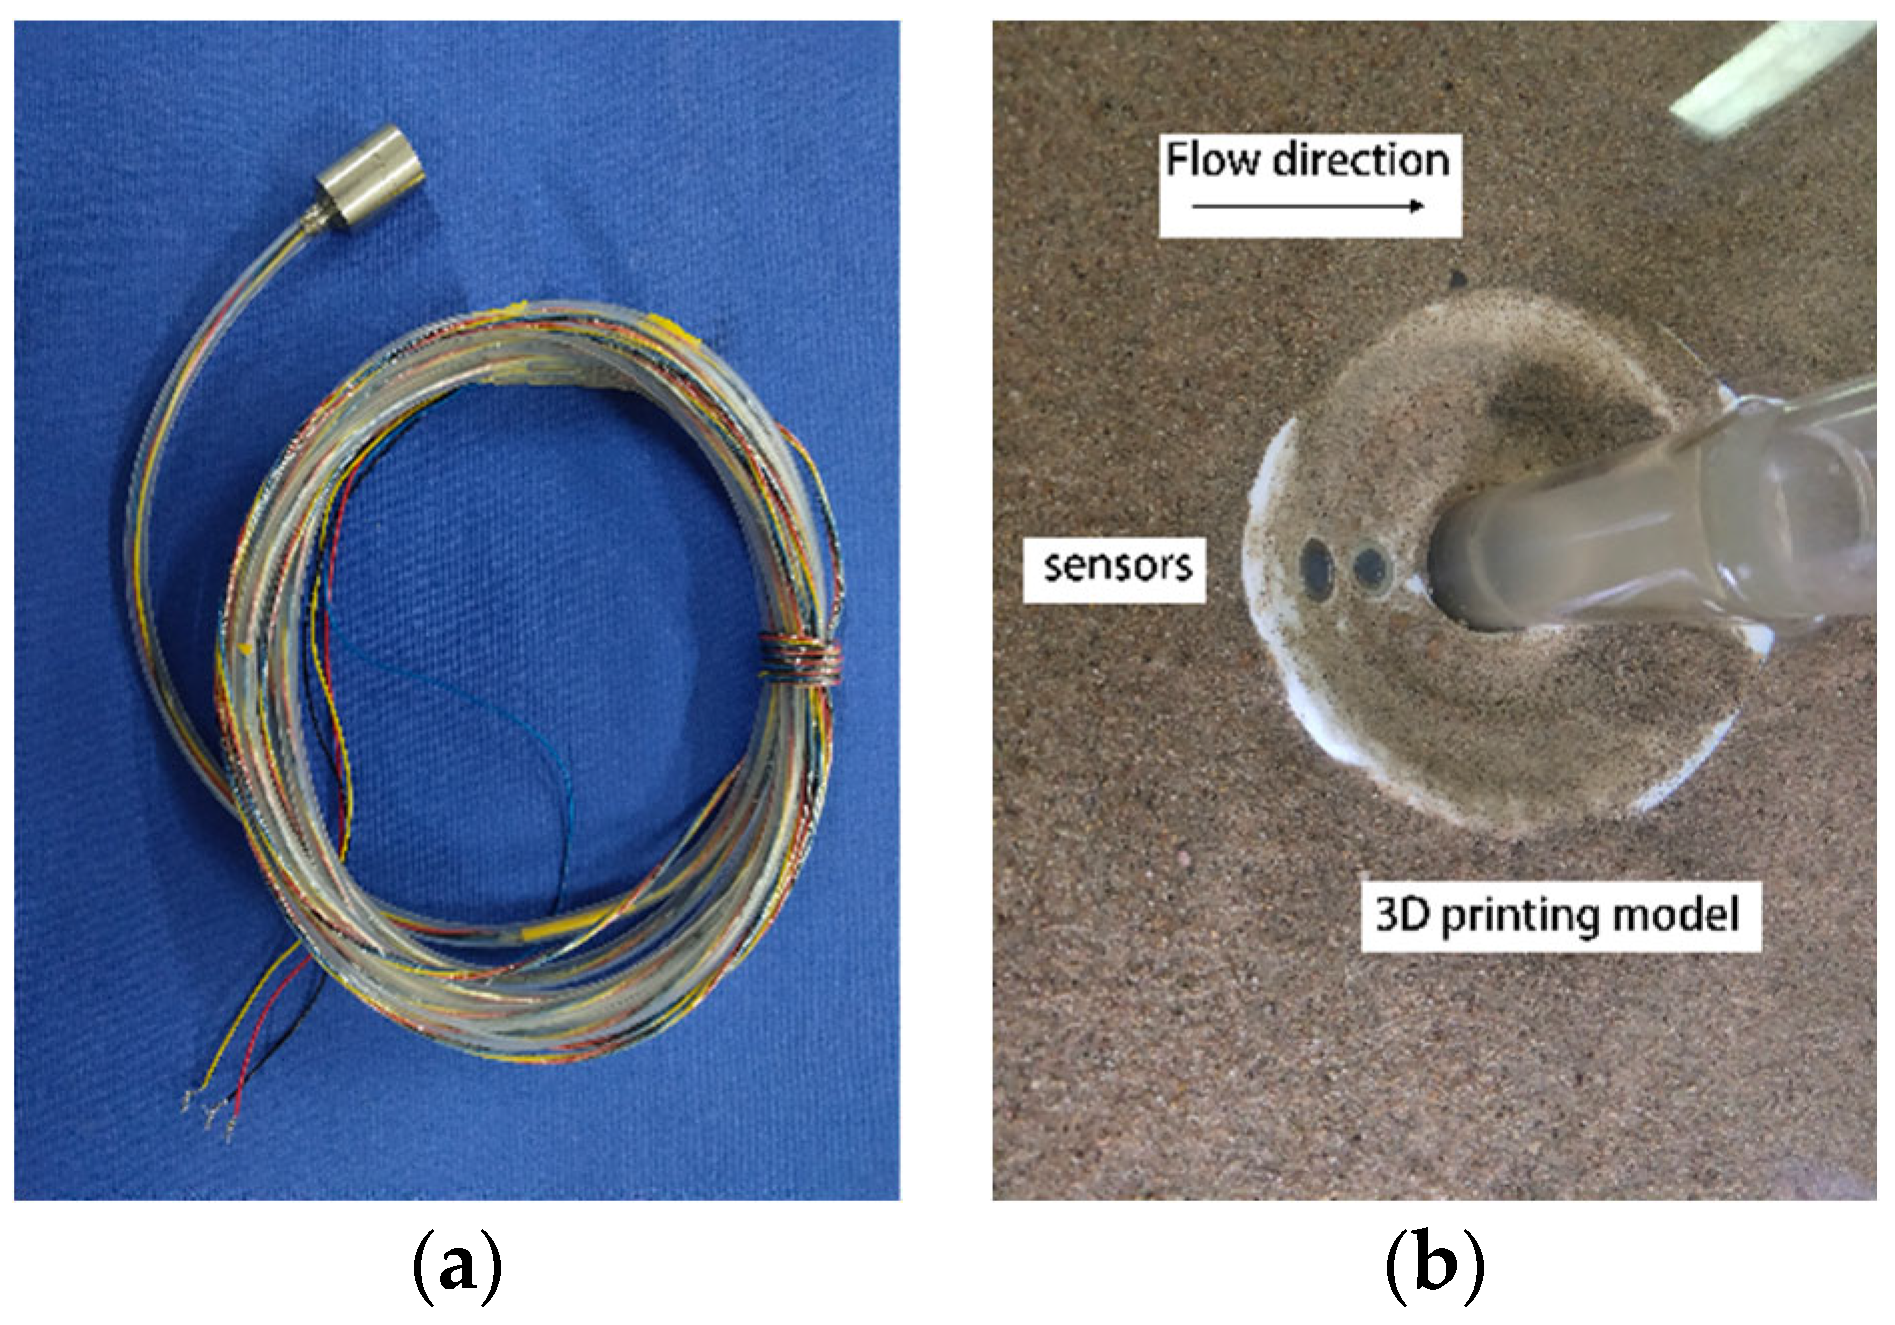
Figure 1. (a) Sensor apparatus used in the present experiment, (b) experimental setup of a system of pier-3D-printed solid-material sensors.
Water 16 01863 g001
Figure 2. Deformation states of the plastic model made via 3D-printing technology, shown at various times after the start of scouring: (a) 5 min, (b) 15 min, (c) 30 min, (d) 60 min, (e) 180 min, (f) 360 min.
Water 16 01863 g002
Figure 3. Physical model diagrams: (a) meshing and (b) boundaries.
Water 16 01863 g003
Figure 4. Variation curves of two main factors with time in various azimuthal planes: (a) maximum depth, (b) scour hole range.
Water 16 01863 g004
Figure 5. Shape profiles of the scour hole in front of the pier during the scouring process.
Water 16 01863 g005
Figure 6. Plots of the pressure stress at various points: (a) measuring point 1, (b) measuring point 2.
Water 16 01863 g006
Figure 7. Plots of the tangent slope at various points: (a) measuring point 1, (b) measuring point 2.
Water 16 01863 g007
Figure 8. Evolution plots of the shear stress measured at two points.
Water 16 01863 g008
Figure 9. Axial plane flow field diagrams at various measured time points (Unit: m/s).
Water 16 01863 g009
Table 1. Pressure stress values of the sensors and hydrostatic values at two measuring points at different times.
Time
(min)
Pressure Stress of
Sensors (kPa)
Hydrostatic Pressure
Values (kPa)
Measuring Point 1Measuring Point 2Measuring
Point 1
Measuring
Point 2
53.142.442.152.00
152.492.432.232.07
302.882.472.272.13
603.162.372.312.23
1803.102.282.352.25
3603.112.412.392.26
Table 2. Comparison of the simulated data with the experimentally observed data.
Experimentally Observed DataSimulated Data
Maximum Scour Depth (mm)Pressure Stress (kPa)Maximum Scour Depth (mm)Pressure Stress (kPa)
Measuring Point 1Measuring Point 2Measuring Point 1Measuring Point 2
19.73.142.4419.53.092.33
24.62.492.4324.62.522.48
32.52.882.4732.02.632.35
38.83.162.3738.63.182.22
40.83.102.2840.33.012.41
43.83.112.4143.03.212.50
Disclaimer/Publisher’s Note: The statements, opinions and data contained in all publications are solely those of the individual author(s) and contributor(s) and not of MDPI and/or the editor(s). MDPI and/or the editor(s) disclaim responsibility for any injury to people or property resulting from any ideas, methods, instructions or products referred to in the content.