1. Introduction
Brazil stands out worldwide in terms of agricultural production. The sector is the driving force of the economy and employed 19 million people in 2018 [
1]. Furthermore, in 2020, according to the Center for Advanced Studies in Applied Economics (CEPEA), the sector was responsible for 26% of the gross domestic product (GDP) and 52% of everything that was exported. However, this feat is linked to the intense use of agricultural pesticides. Data from the Ministry of Health [
2] show that between 2007 and 2014, the sale of agricultural pesticides grew by 149%, and the planted area increased by 22.31%. There is no doubt that the use of agricultural pesticides was one of the factors that led to an increase in field productivity, but their intensive use also leads to harmful effects, such as exposure of workers and consumers and negative impacts on water quality, soil and human health, which can cause chronic and acute poisoning [
3].
Due to its non-selective and efficient action in eliminating weeds, glyphosate is the most used agricultural pesticide in Brazil, representing 62% of the total agricultural pesticides used [
4].
The World Health Organization (WHO) cited in 2015 that there is evidence that glyphosate is potentially carcinogenic to humans [
5,
6]. Samsel and Sneff [
7] and Bruce et al. [
8], among others, are important studies that correlate the use of glyphosate-based pesticides with an increase in cancer cases. Glyphosate (N-(phosphonomethyl) glycine) is a broad-spectrum, non-selective, systemic and post-emergent agricultural pesticide used in various food and non-food crops. It belongs to the group of phosphorus amino acids or substituted glycines. It has remained for years the most consumed pesticide worldwide [
9]. It appears as a white, crystalline salt which is highly soluble in water (12 g L
−1 at 25 °C) and slightly soluble in organic solvents. Its functional groups (phosphate and carboxylic) are acidic in nature [
10]. Microorganisms present in the soil are mainly responsible for the degradation of glyphosate. Approximately 50% of the original molecule can be metabolized in 28 days, reaching 90% in 90 days. For this reason, metabolites or degradation products of pesticides have been identified and extensively studied. The first and main metabolite of glyphosate degradation in soil is aminomethylphosphonic acid (AMPA), which is formed by microbial action. AMPA has slightly greater toxicity than glyphosate [
11].
In glyphosate-based pesticide formulations, the toxic effects are increased by the presence of other ingredients. Mesnage et al. [
12] showed that some formulations can be up to a thousand times more toxic than the isolated principle, especially those that use the surfactant polyoxyethylene amine.
The residual limits of glyphosate are variable. For drinking water, Brazilian legislation states that the maximum permitted value (MPV) is 500 µg L
−1, and in Europe, this value is 0.1 µg L
−1. However, compared to some other countries that have these limits in their potability criteria, it can be concluded that Brazilian values are not that far from the others. For this criterion, the continents and countries that differ are Europe and Japan, with the first being extremely restrictive and the second having a rather high permitted value compared with the others [
13].
Carneiro et al. [
3] presented results on the absorption of glyphosate by chitosan membranes. Espinoza-Montero reviewed the literature on treatments for glyphosate-contaminated water. Lita et al. [
4] evaluated glyphosate removal by biochar-based, coffee husk-loaded Fe
3O
4. None of the studies cited used nanocellulose for this purpose. Nanocellulose is a promising new class of adsorbents, and Morales Quintana et al. [
5] synthesized and characterized a new inexpensive resin from melamine and glyoxal for glyphosate removal. It is classified as a sustainable material, as it is of a biological and natural origin, capable of regeneration and has a renewable source, and the raw material is most often destined for disposal. Many of the new lines of research for this material are aimed at surface modifications, aiming to increase its adsorption efficiency [
14]. Nanocellulose is a lightweight material with strong mechanical resistance, low production costs and safe handling compared with synthetic nanoparticles. Many classes of substances can be adsorbed by nanocellulose, including organic products such as pesticides, dyes and various effluents [
15].
Nanocellulose is a material that is still under development but promising from the environmental and added value points of view. Kim et al. [
16] evaluated the cytotoxicity of nanocellulose, and the results indicated that these materials are promising for an environmentally friendly and relatively safe material. Therefore, this work proposes developing a material with potential for environmental removal, assisting in the treatment of aquatic systems contaminated by glyphosate. The specific purpose of this work was to use cellulose from eucalyptus pulp, which presents characteristics for obtaining nanocellulose and its evaluation of glyphosate removal in aquatic environments.
2. Materials and Methods
All reagents used were of analytical grade and the glyphosate standard, as well as sodium molybdate and ninhydrin, which were from the Sigma-Aldrich (St. Louis, MO, USA) brand. All solutions used were prepared using ultrapure water (18.18 MΩ cm−1).
2.1. Obtaining and Characterizing Nanocellulose and Organ Modification
Nanocellulose was obtained from a cellulose sample obtained by the kraft pulping method from eucalyptus wood, sieved, cooked and bleached. The pulp passed through a defibrillator mill (Masuko Sangyo—Super Masscolloider, Kawaguchi City, Japan) for 15–20 complete cycles. This procedure reduced the dimensions of the cellulose to the nanometric scale.
Organomodified nanocellulose was obtained by adding tetraethylorthosilicate solution (TEOS 98%
w/
v) to the nanocellulose suspension (4 h of stirring). After that, the solution was acidified with nitric acid (HNO3 0.1 mol L
−1) (30 min of stirring). Finally, the 3-aminopropyltriethoxysilane (3-ATPS) solution was pipetted into the nanocellulose suspension (4 h of stirring). At each step, with the addition of reagents, the solution remained under moderate agitation at room temperature (25 °C) for 8 h and with 30 min of reaction. The one-pot methodology was adopted to make this modification, adding amino groups to the original nanocellulose structure through sequenced reactions carried out by adding different reagents using just one “pot” (glassware where the nanocellulose was from the beginning). This methodology was based on Goveia et al. [
17] and modified to the nanometric scale.
To characterize the materials, the films were analyzed by scanning and double-beam electron microscopy (JEOL high-resolution field emission electron microscope (SEM), model JSM-7500F), scanning microscopy with an energy dispersive detector (scanning microscope JEOL, Japan, model JSM-6010) and Fourier transform infrared (FTIR) spectroscopy (Japan Spectroscopic Company (JASCO), Japan, FTIR Spectrophotometer-41).
2.2. Kinetic Studies on Glyphosate Removal by Nanocellulose
Nanocellulose and modified nanocellulose were then evaluated for their adsorption capabilities by applying them to glyphosate solution. Different presentation forms of nanocellulose were tested in 0.1 L (100 mL) of 5 mg·L−1 aqueous glyphosate solution with a pH level of 7.0 under light agitation (around 50 rpm) on a shaking table at room temperature (25 °C) for a period of 24 h. To standardize the amount of nanocellulose in each form of presentation tested at 50 mg, the density of the 3% solution was previously calculated, obtaining a value of 1.52 g mL−1. Therefore, for every 1.1 mL of the solution of 3% nanocellulose, we had 0.05 g (50 mg) of nanocellulose.
The presentation forms used with unmodified nanocellulose were as follows: (1) directly dissolved in the solution, where 1.1 mL of 3% nanocellulose solution was pipetted directly into the glyphosate solution and then the final aliquot was centrifuged; (2) on a membrane for SERVAPOR MWCO dialysis with a pore size of 0.25 nm, where 1.1 mL of 3% nanocellulose solution was pipetted into the membrane, which was closed with clips; (3) as a previously dried film obtained by evaporation of water after placing approximately 50 mg of nanocellulose and spreading it in 25 mm in diameter Petri dishes before placing them in an oven at 35 °C for approximately 5 h until completely dry; and (4) in a glass column 0.6 cm in diameter, with the nanocellulose packed to a height of 3.9 cm and where a 5 mg·L−1 glyphosate solution was passed through the column, with perfusion controlled at 0.05 mL per minute using a peristaltic pump. All these preliminary tests, with different ways of using nanocellulose to remove glyphosate in a solution, were carried out in duplicate to check whether the results were reproducible. The concentrations of glyphosate were read in the solutions initially and after 24 h of reaction with nanocellulose, thus obtaining the values of the glyphosate remaining in the solution, for the unadsorbed glyphosate.
With modified nanocellulose, they were made by grafting onto the column and film in duplicate, analyzing the initial concentration and after 24 h of complexation. The kinetic analysis was carried out with film using a batch procedure with the removal of 8 mL aliquots at each predefined interaction time (0, 30, 60, 180, 360, 720 and 1440 min). The entire test took place under slow agitation (50 RPM on a shaking table) and at a temperature of 25 °C.
The aliquots were quantified through the reaction of free glyphosate with ninhydrin and sodium molybdate at a temperature of 100 °C in triplicate [
18]. The mean and standard deviation were calculated.
The values of glyphosate adsorbed per gram of nanocellulose and modified nanocellulose were calculated for each time at which the aliquots were removed (
qt). The value of glyphosate adsorbed per gram of nanocellulose at the equilibrium point (
qe) for the two nanocellulose materials was also calculated. The 8 mL aliquots taken were considered while adjusting the volume of the solution (VSol) (Equations (1) and (2)):
For Equation (1), calculations of the amounts of glyphosate (mg) adsorbed per amount of nanocellulose (g) were made for each time that aliquots were removed, where [ ] initial is the initial concentration of glyphosate in the solution;
Vsol. Is the volume of the solution, which was initially 0.1 L but changed with each aliquot removed; [ ]
tx is the concentration of glyphosate in the solution at each time
x; and the adsorbent mass is the masses in grams of nanocellulose, which for this work was 0.05 g:
Equation (2) shows the calculation of the total glyphosate (mg) absorbed at the equilibrium point of the reaction, where [ ] te is the concentration of glyphosate in the solution at the time at which equilibrium occurred.
The pseudo-first- and pseudo-second-order models were plotted as described in the literature (ln(qe − qt) versus time and (t/qt) versus time, respectively), and information was provided about the types of bonds between the nanocellulose and glyphosate. The Weber and Morris model was obtained by graphing qt versus t0.5, and from this, it was possible to understand where the interactions occurred with greater prevalence: in the pores or on the surface of the nanocellulose.
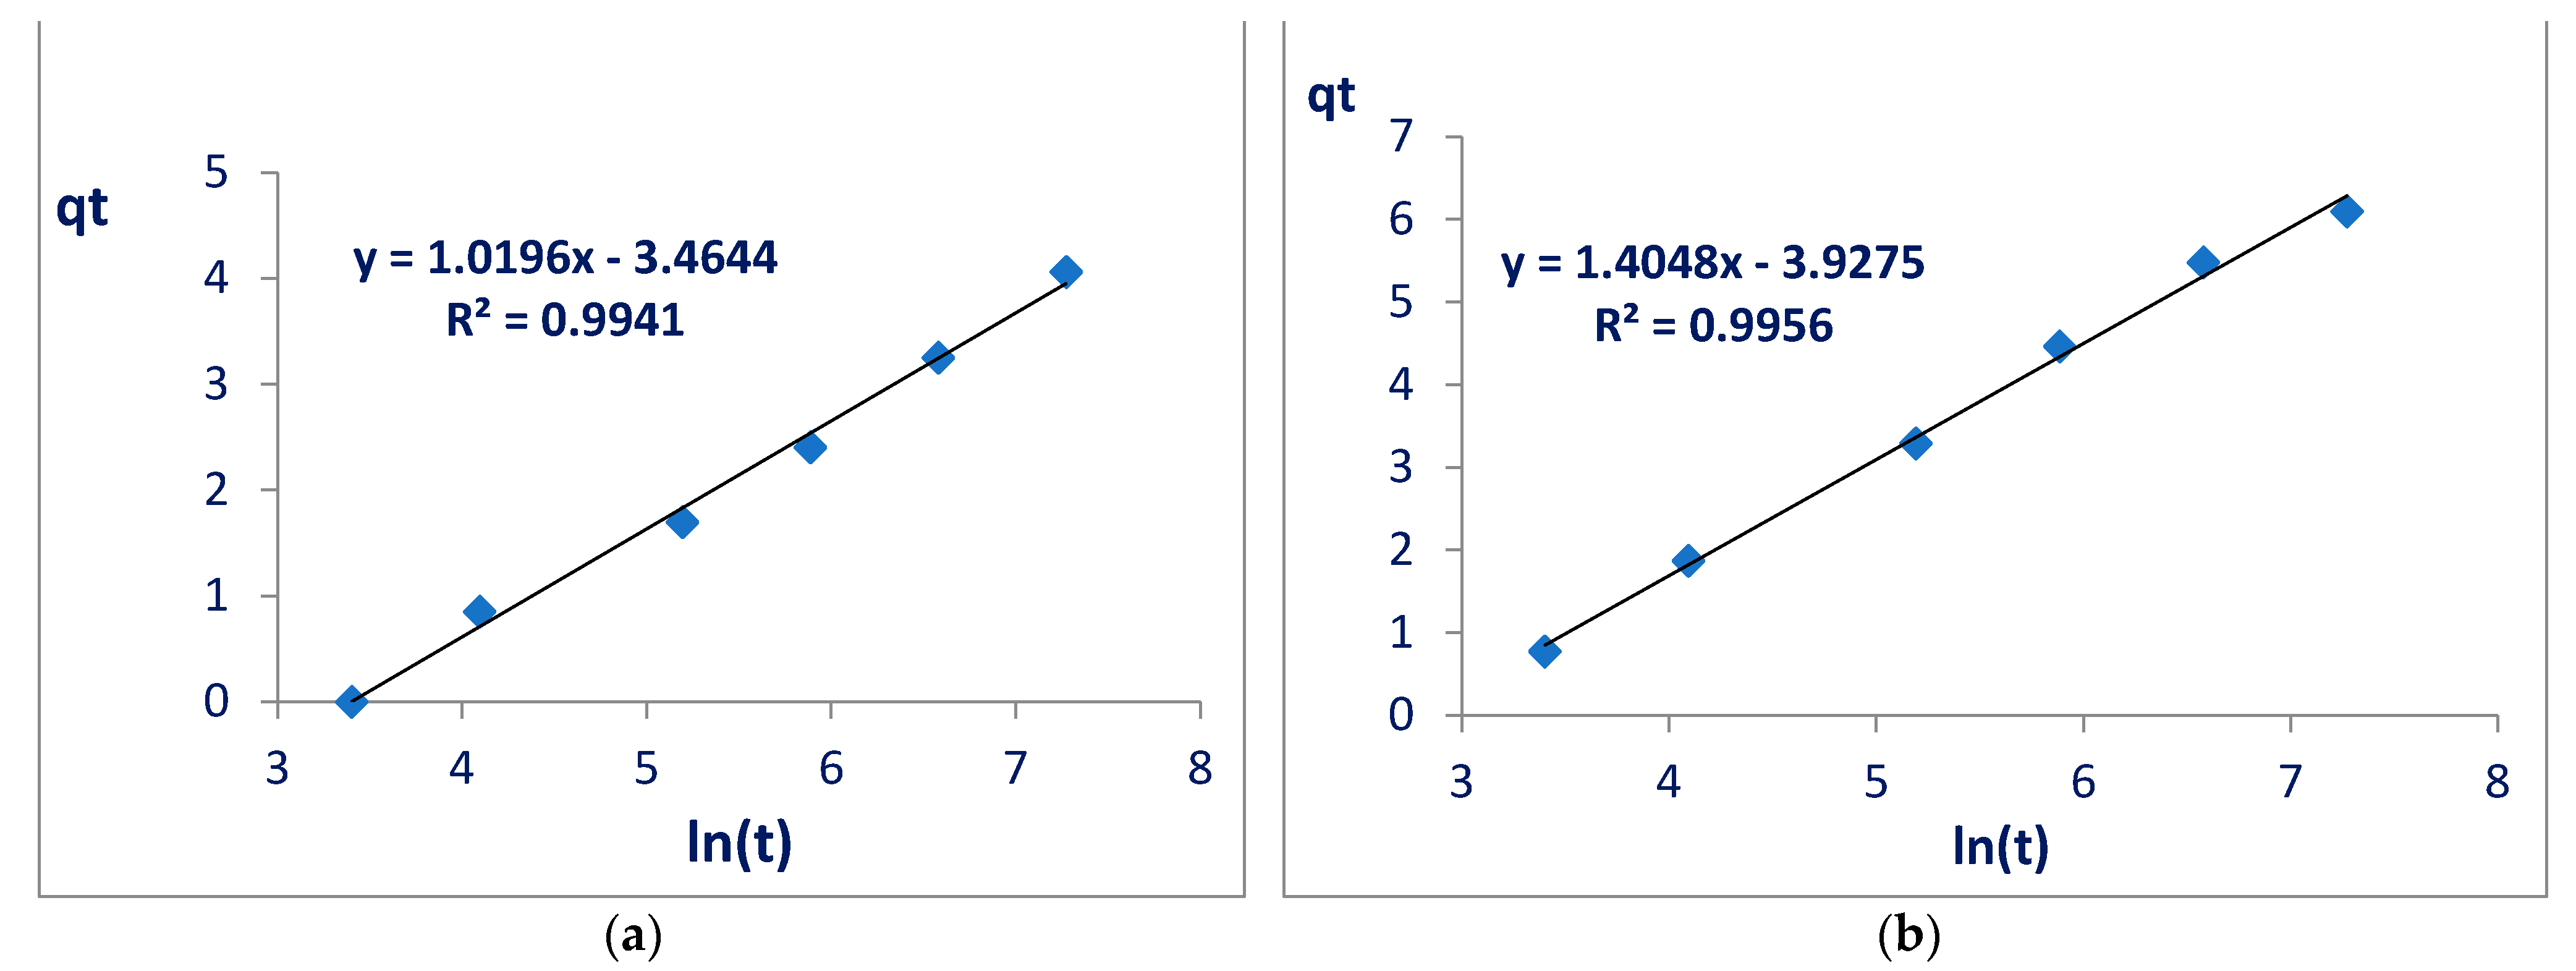
The last model calculated was that of Elovich, which was obtained by the graph formed with the values of qt versus ln(t). With this model, it was possible to calculate the adsorption rates of glyphosate on nanocellulose (the speed at which interactions occurred) and the constants of desorption (value of glyphosate that could be desorbed in milligrams of glyphosate per gram of adsorbent).
The quantification of glyphosate consisted of the reaction with ninhydrin and subsequent determination in a spectrophotometer (Hach brand, model DR3900) at 570 nm. The calibration curve varied from 0.25 to 10.0 mg·L
−1. Ninhydrin (the reagent responsible for the developed color) and sodium molybdate (the catalyst) were added to the glyphosate standards and heated, standardizing the reaction time to 30 min. The purplish color was proportional to the concentration of glyphosate present in the solution [
19].
To verify the sensitivity of the method and its precision and repeatability, the values of the limits of detection (LD) and quantification (LQ) and the relative standard deviation (%DPR) were calculated. Experiments with the blank were carried out for 48 h to evaluate the stability of glyphosate in the solution.
3. Results and Discussion
The characterization of nanocellulose is an important factor in understanding the interaction mechanisms that can occur with contaminants, specifically when referring to the proposal of a methodology aimed at environmental remediation.
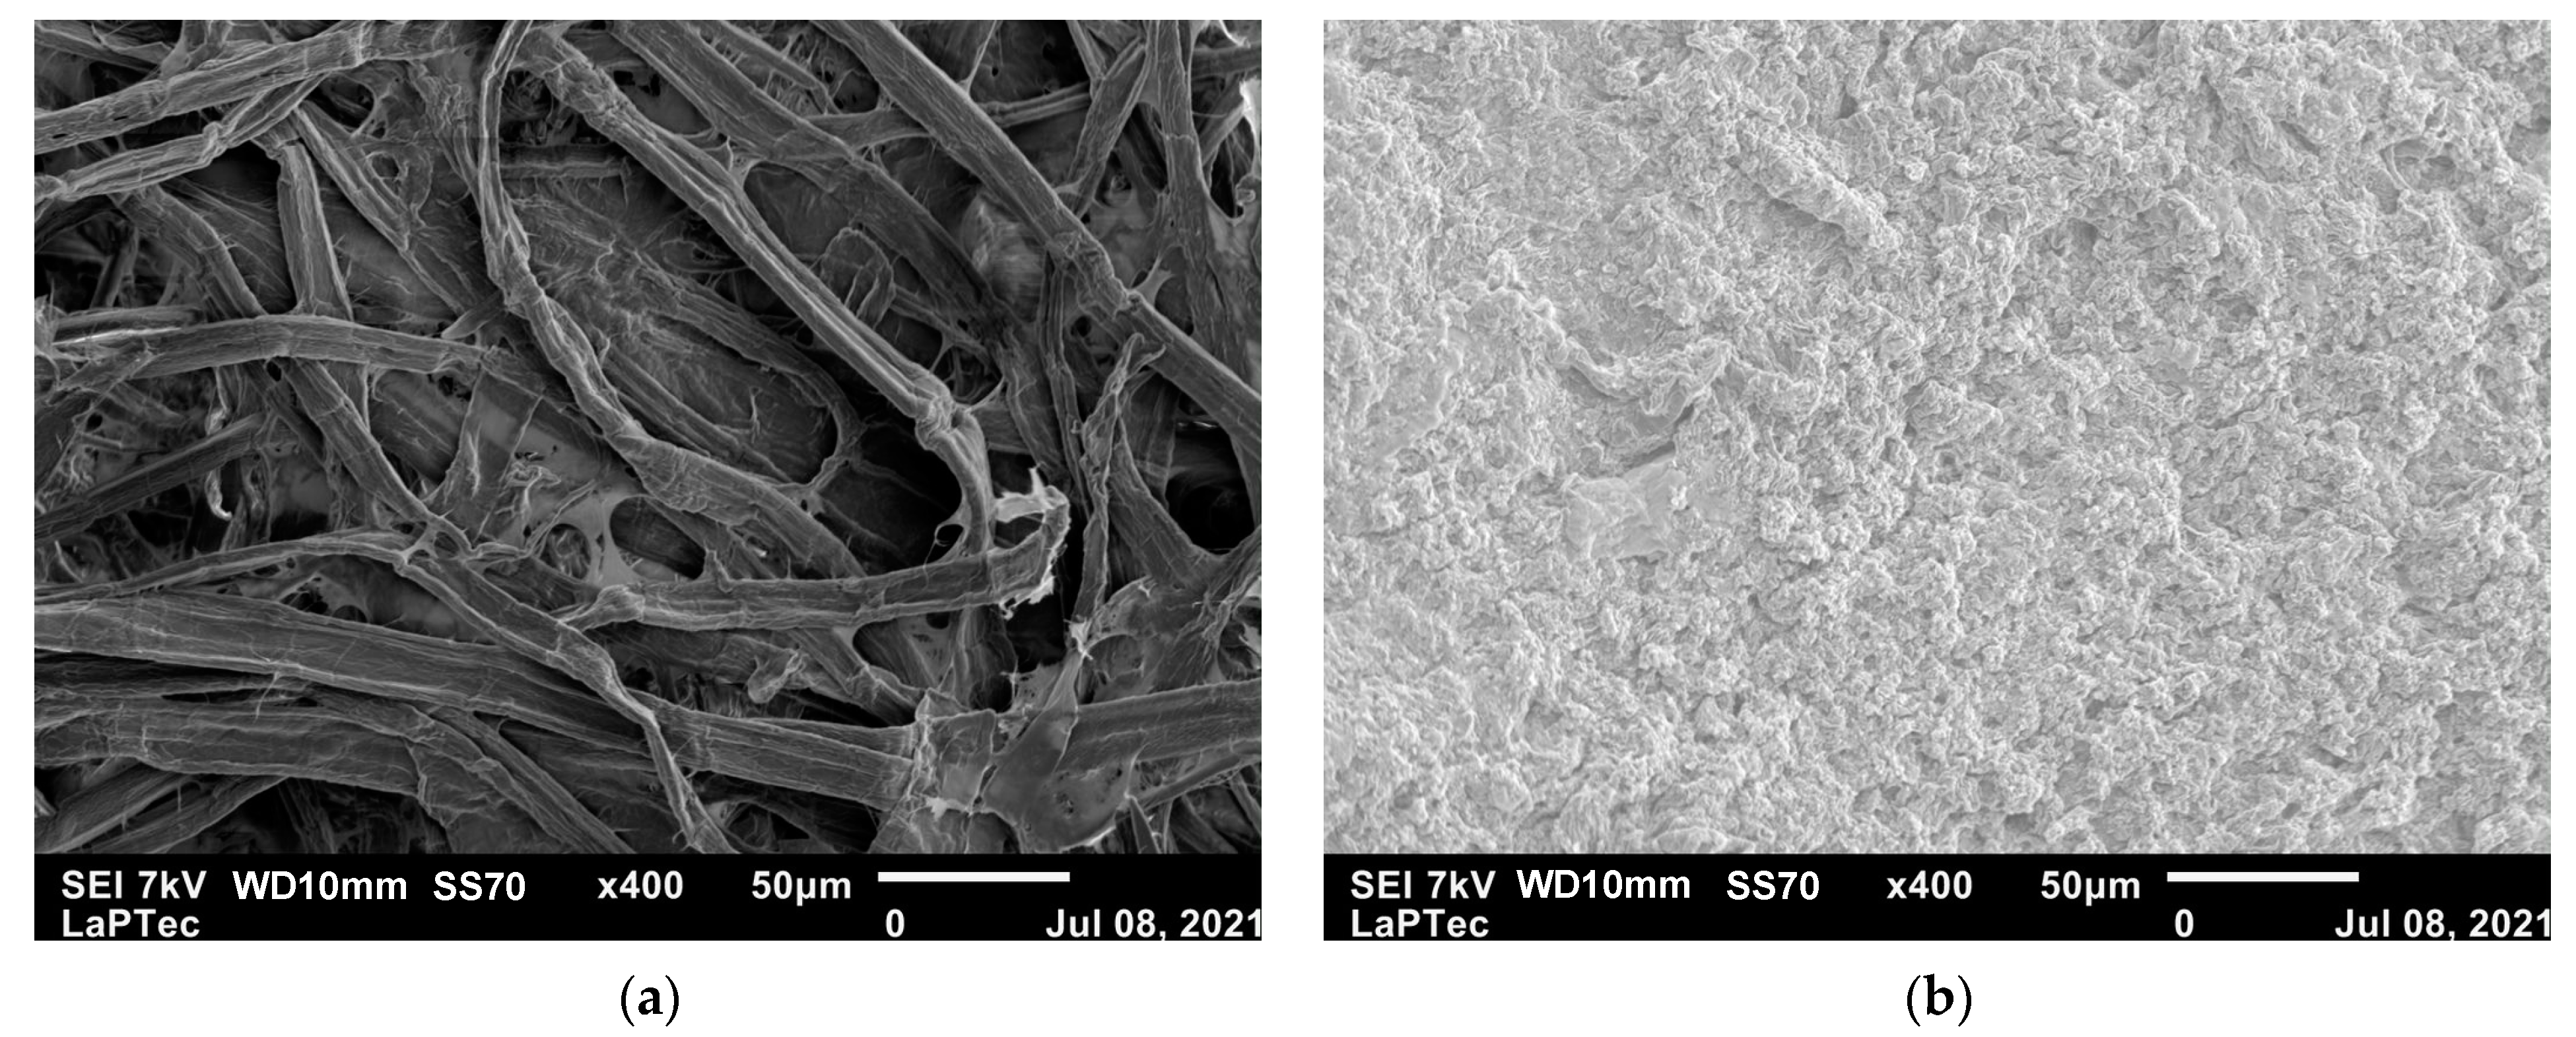
From the scanning electron microscopy images obtained for nanocellulose, the presence of fibrils was observed, which is common in the mechanical obtaining process (
Figure 1a). After organomodification, the structure changed, with microfibrils no longer visible but incorporation of the organosilicate material occurring (
Figure 1b).
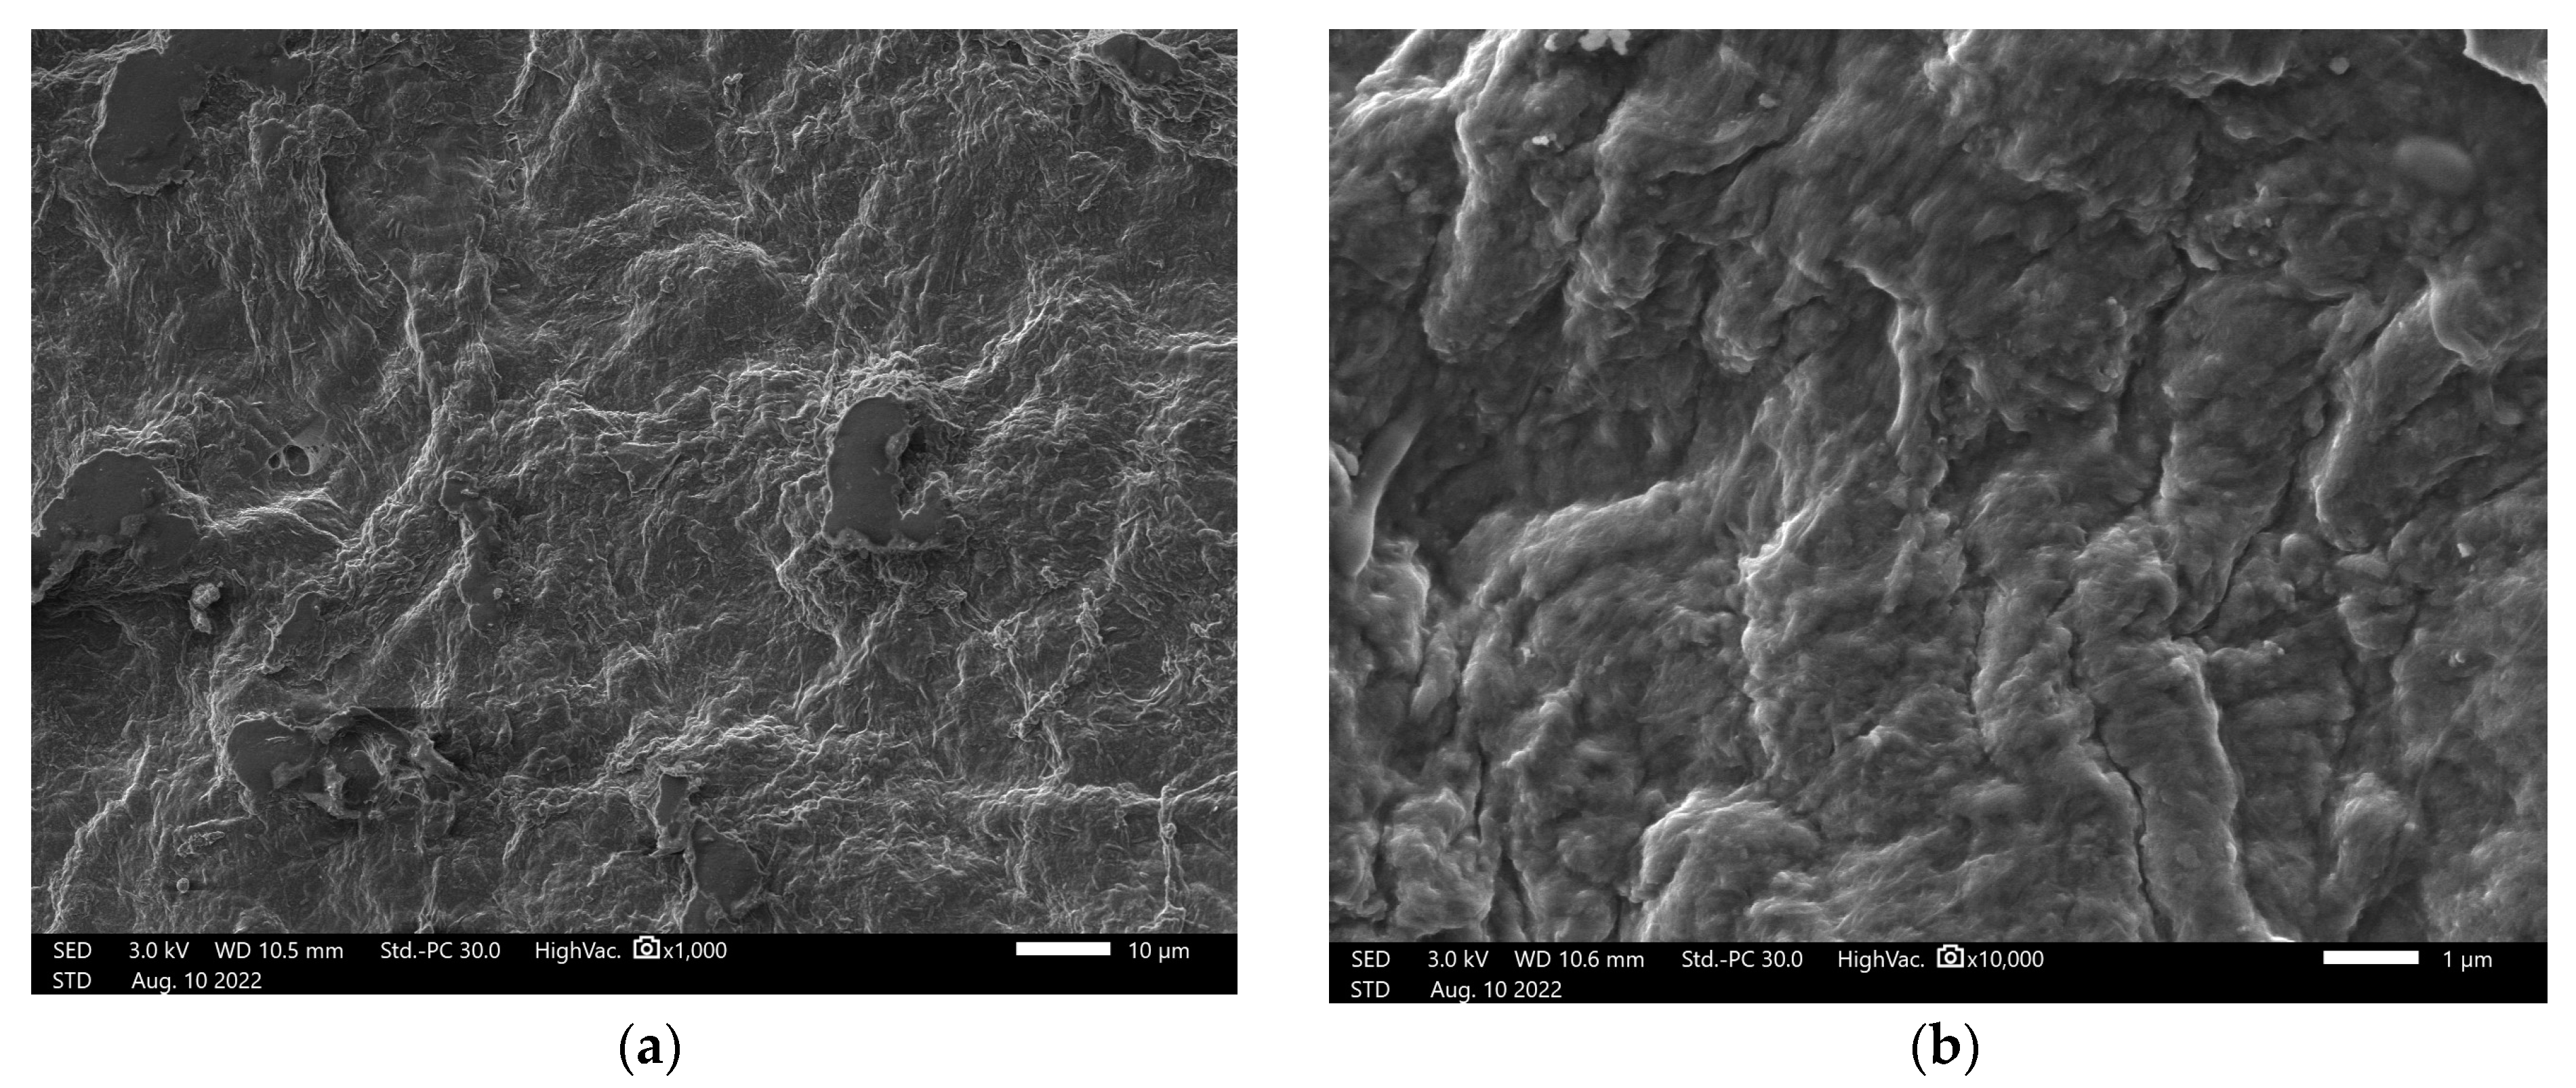
Organomodified nanocellullose was evaluated from 1000- to 100,000-fold magnifications (
Figure 2). The image magnified 100,000 times indicates that one of the measurements of the fibrils had a diameter smaller than 100 nm, indicating that after organomodification, the nanocellulose presented nanoscale parameters. A special arrangement of greater roughness and apparent relief was observed.
Through energy dispersive spectroscopy (EDS), it can be observed that there was formation of a material where the nanocellulose was coated by SiO
2 groups present in the tetraorthosilicate (
Figure 3). Nitric acid promoted hydrolysis with the formation of silanol groups (Si-OH) and the Si-OH bond being more reactive than C-OH, and thus silicon became a strong nucleophile where substitution occurred. The nanocellulose then reacted with 3-aminopropyltriethoxysilane, incorporating the amino group into the original nanocellulose structure [
17].
The main elements identified in the nanocellulose were carbon (approximately 45%) and oxygen (approximately 40%). In the modified nanocellulose, it was also possible to observe the presence of silicon and a value of 53% for the percentage of oxygen, which was higher than that of the nanocellulose (around 40%). This was due to the organomodification of nanocellulose, which included 3-aminopropyltriethoxysilane, for the original molecule, increasing the oxygen content in addition to silicon and nitrogen becoming part of the new molecule. The presence of nitrogen is difficult to observe through EDS due to its low atomic mass, but it was confirmed by spectroscopy in the Fourier transform infrared (FTIR) region (
Figure 4).
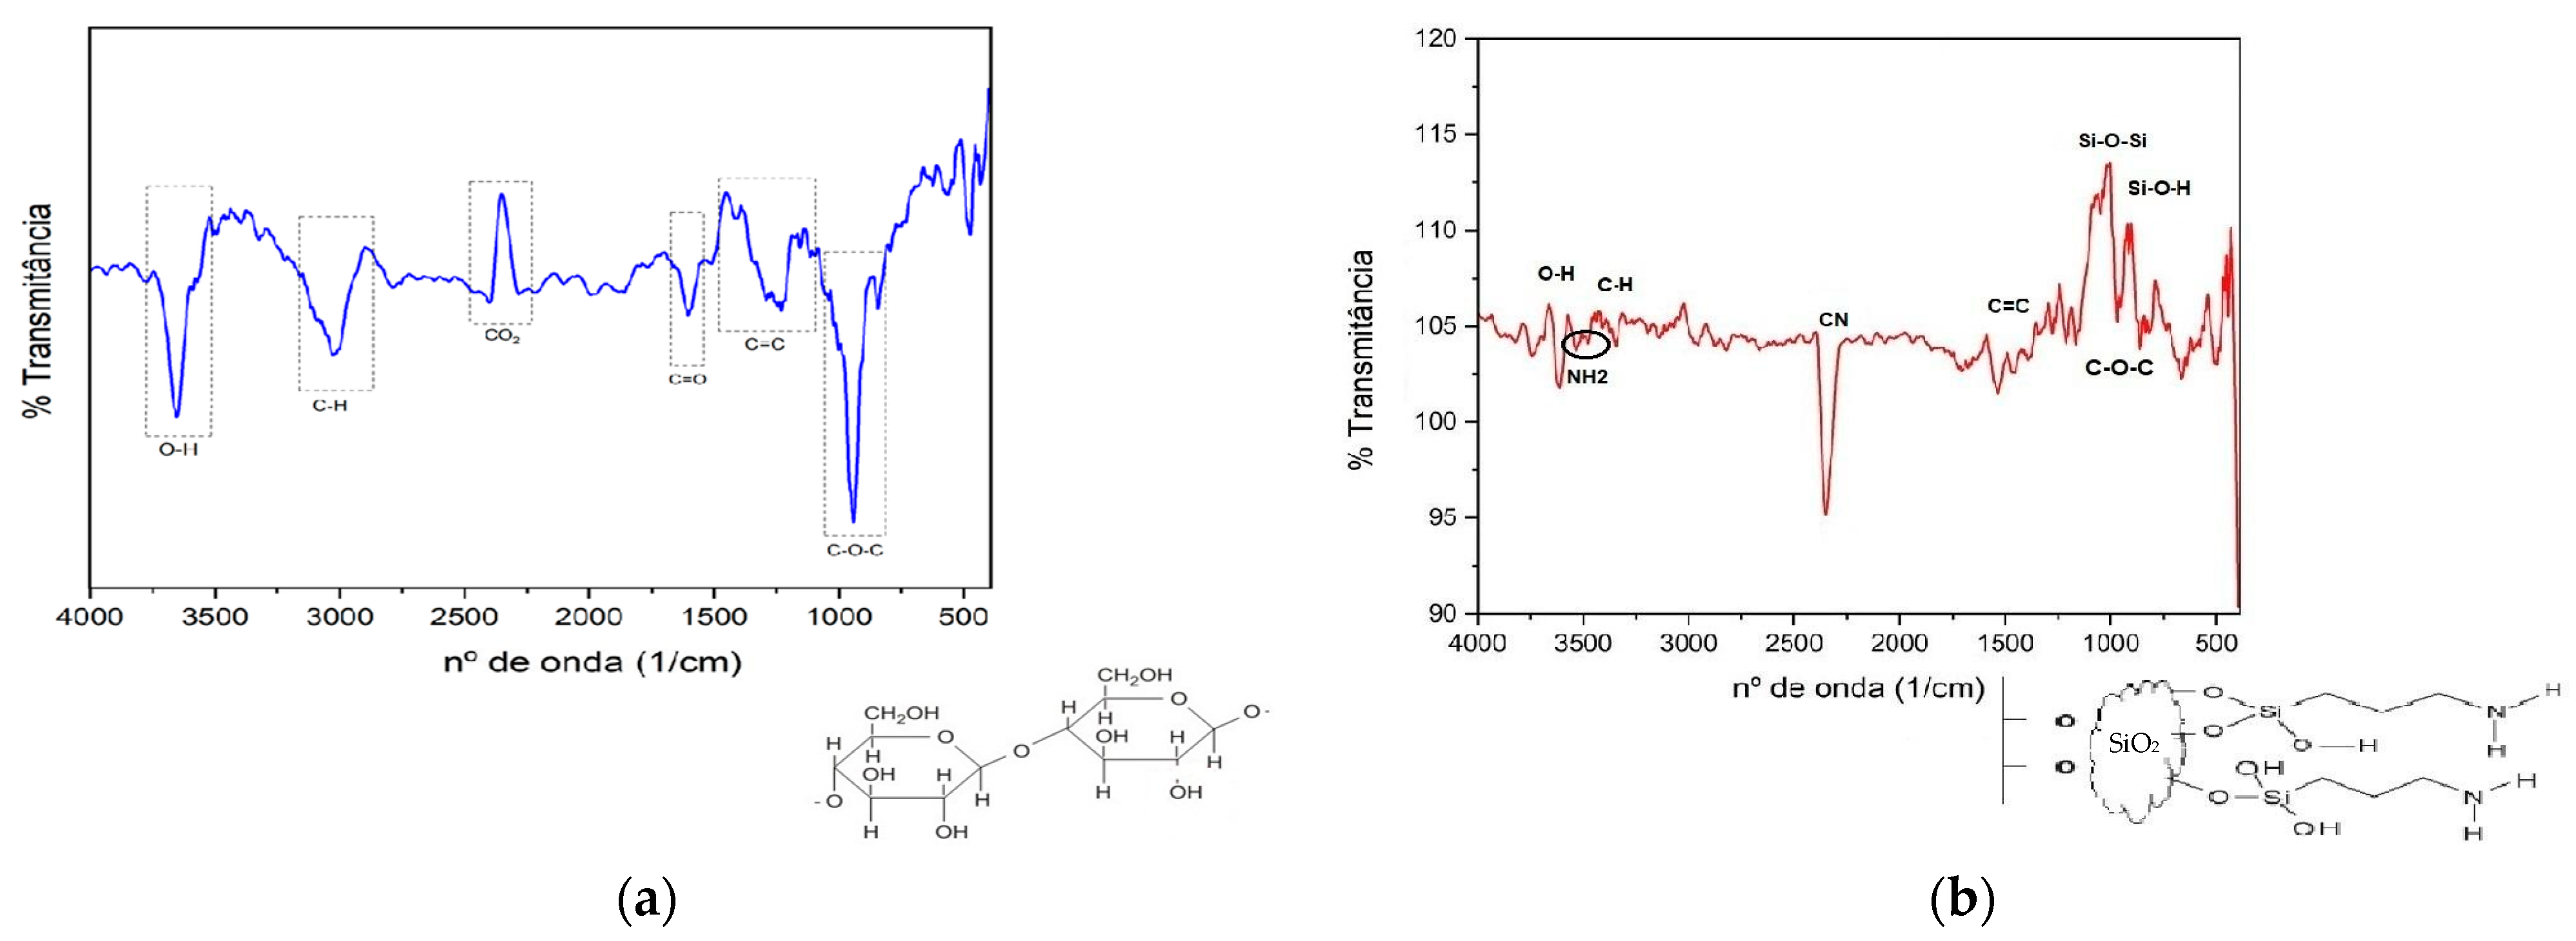
From the spectra in the infrared region (
Figure 4), it is possible to observe the difference in the functional groups present in the nanocellulose (
Figure 4a) and modified nanocellulose (
Figure 4b), highlighting the presence of amino groups. In the infrared spectrum for nanocellulose, in addition to the expected groups, it was possible to verify some groups that could be attributed to the residual presence of lignin from eucalyptus pulp, the raw material for nanocellulose. They were C=C between 1440 and 1100 cm
−1 and C=O at 1600 cm
−1. Furthermore, a rather characteristic band at 2340–2400 cm
−1 indicates O=C=O, and it is most likely that atmospheric carbon dioxide was adsorbed into the nanocellulose film. The other groups identified proved the expected bonds in the nanocellulose structure: O-H between 3220, and 3500 cm
−1, C-H at 2900 cm
−1 and C-O-C close to 1000 cm
−1 [
20,
21,
22].
In the spectrum for the modified nanocellulose, in addition to the original nanocellulose bands, proof of the success of the reaction can be seen, with the band at 964 cm
−1 referring to the Si-O-H bond and the one between 1020 and 1090 cm
−1 being attributed to the Si-O-Si bond, which was responsible for the coupling of 3-aminopropyltriethoxysilane to the O- groups of nanocellulose. Double stretching between 3300 and 3500 cm
−1 was also observed, proving the incorporation of the NH
2 group into the nanocellulose. The accentuated stretching downward close to 2250 cm
−1 is characteristic of the triple bond between carbon and nitrogen, with one justification being the possible dehydration of the modified nanocellulose film [
23].
The UV-VIS spectrophotometric determination method for glyphosate is an alternative that is easy to handle, quick, low in cost, sensitive and reproducible. The calibration curve presented a linear coefficient of determination of 0.9908 and the following straight-line equation: C = −2.003 + 15.505A, where C is the glyphosate concentration, −2.003 is the linear coefficient, 15.505 is the angular coefficient and A is the absorbance read at 570 nm. The limit of detection (LD) and the limit of quantification (LQ) were 0.004 and 0.013 mg·L
−1 respectively. The value of the relative standard deviation (DPR) was 3.41%, a result acceptable for ANVISA, which is a DPR of up to 5% [
24]. Bhaskara and Nagaraja [
19] presented validation of the method obtaining a limit of detection (LD) of 0.04 mg·L
−1, limit of quantification (LQ) of 0.11 mg·L
−1 and relative standard deviation for the average of seven determinations of a standard (DPR) of 1.74%.
For kinetic studies, adsorption analyses were carried out on dialysis membranes by immersion in a glyphosate solution for 24 h with no recovery of glyphosate. Then, in a new test for the same period with the nanocellulose in direct contact with glyphosate in aqueous solution, the results indicated that 9% of the glyphosate was removed. We continued with new ways to verify the ability of nanocellulose to adsorb glyphosate. In a packed column, perfusing glyphosate solution (with the aid of a peristaltic pump) and in the form of a dry film, the percentages of glyphosate removal were maintained, being practically the same as those in the test with nanocellulose directly dispersed in solution (8.9 and 9%, respectively).
Nanocellulose showed a greater glyphosate removal capacity when dispersed in solution and in the form of a dry film, with practically equal values. From the results obtained, it can be seen that the dialysis membrane interfered with the interaction between nanocellulose and glyphosate, making it impossible to remove glyphosate from the solution. It is believed that the membrane (SERVAPOR MWCO, with a pore size of 0.25 nm) was not capable of promoting the diffusion of glyphosate so that it could interact with the nanocellulose contained in the membrane due to the size of its pores.
The modified nanocellulose proved to be better for removing glyphosate when compared with the unmodified nanocellulose, showing 26.9% removal when placed in a glass column and 27.9% when used in the form of a dry film.
The two tested forms of modified nanocellulose had practically the same performance (in the column or dry film) regarding glyphosate adsorption, but the dry film test was slightly better. For environmental applications, it is interesting to use this in films, which is why adsorption studies were carried out on the films.
The adsorption values obtained in this work were efficient when compared with other results in the literature (
Table 1).
The results of the kinetic studies (
Table 2) indicated correlation coefficient values (R
2) greater than 0.9, and this indicates that the two linear models fit the data obtained.
These results indicate that physical and chemical interactions occurred with the two materials, with the pseudo-second-order chemical interactions prevailing, as indicated by their having the highest correlation coefficient (
Table 3).
The pseudo-first-order model considered that interactions between species occurred through the occupation of unoccupied sites on the adsorbent; that is, the interactions were weaker because they were physical-chemical-type bonds (physiosorption interactions). In the pseudo-second-order model, adsorption was proportional to the square of the number of active sites on the surface, and the bonds were chemical; that is, they were more effective when involving the exchange or donation of electrons between the adsorbate and adsorbent. In this type of adsorption, exchanges occur at specific binding sites and initially form a single layer. However, the formation of other layers may occur through physisorption. The results obtained indicate that this is what happened with both nanocellulose examples.
The chemical and structural modification promoted in the organomodification of nanocellulose enhanced the chemisorption processes, as it increased the pseudo-second-order R2 from 0.99 to 1. As for the physisorption interactions, it is assumed that they also occurred with more intensity, as the adjustment of the straight line (R2 of the pseudo-second-order model) increased from 0.96 to 0.99.
The observations obtained by the models are consistent with what is observed in the EDS images (
Figure 3): a much greater complexity in the structural arrangement of the modified nanocellulose when compared with the unmodified nanocellulose. It is believed that this complexity increases the active sites for physicochemical interactions promoted by “empty” spaces and induced or temporary charges. Furthermore, the modified nanocellulose now has another functional group, the amino, which is capable of chemical interaction with glyphosate.
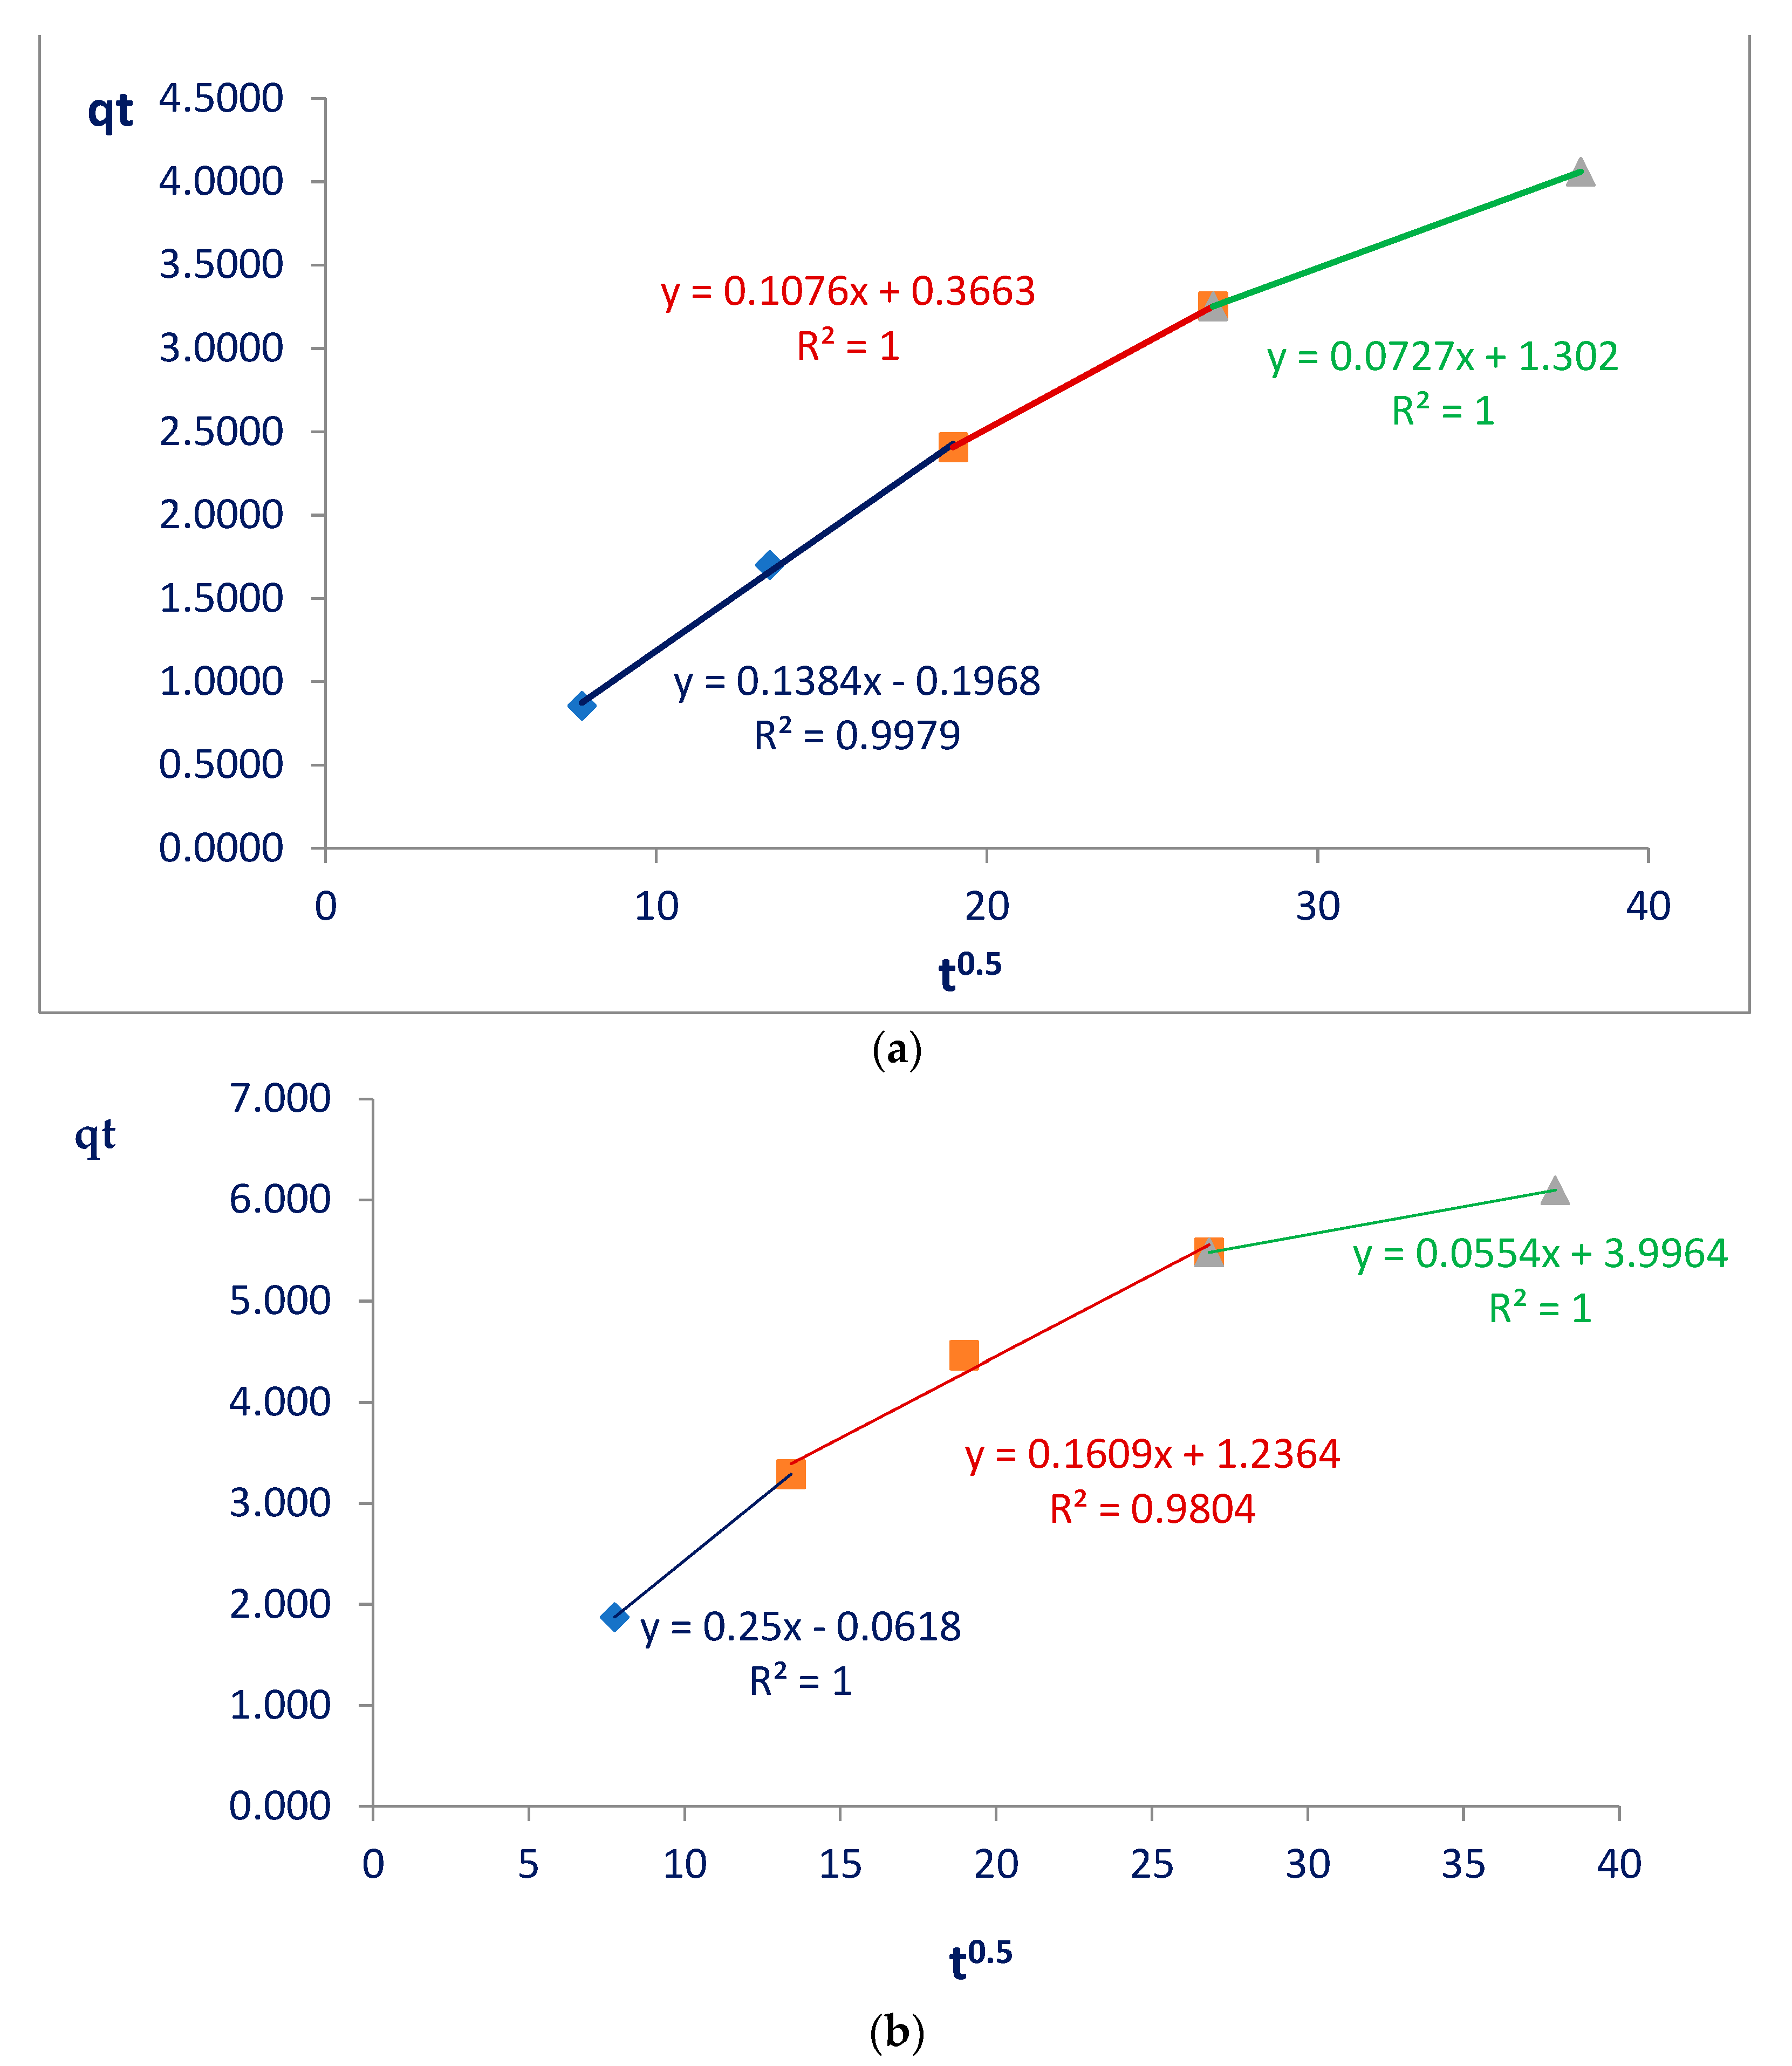
The Weber and Morris model (
Figure 5) verified how intraparticle diffusion occurred, and the Elovich model was employed to understand the initial adsorption rate on the surface of nanocellulose and modified nanocellulose as well as how much glyphosate was subject to desorption, indicating more details about the adsorption process.
In the Weber and Morris models, when observing the straight lines formed by the first points (initial stages of adsorption, referring to the blue lines), a linear coefficient equal to zero would indicate that intrapore diffusion would be controlling the adsorption process. The results obtained were different from zero: 0.2 and 0.06 for the nanocellulose and modified nanocellulose, respectively. Therefore, intrafilm diffusions were occurring (
Figure 5). This was already expected since nanocellulose has a film format made up of nanofibrils in the shape of threads.
By applying this model, it was also possible to determine the rate-limiting steps of the entire adsorption process [
23]. The results for the two nanocelluloses indicate three stages, with different interaction speeds defined by the angular coefficients which were, in this model, the intraparticle diffusion coefficients (Kd) of each straight line. By following the straight lines (first in blue, seconnd in red and third in green), it was possible to verify in both materials a decrease in the speed of interactions between the nanocellulose and glyphosate (
Figure 5):
Nanocellulose: Kd1 = 0.14 > Kd2 = 0.11 > Kd3 = 0.07;
Modified nanocellulose: Kd1 = 0.25 > Kd2 = 0.16 > Kd3 = 0.05.
The diffusion speeds decreased in both cases studied. The drop in velocity from the first to the second stage was also more pronounced for the modified nanocellulose, which may indicate large adsorption on the external surface.
For each of the stages with quite different speeds, we have the following (
Figure 5):
Another piece of information that the model provided us is that the greater the linear coefficient of each straight segment, the greater the thickness of the film. The values increased in each straight segment; that is, the thickness of the film would become greater over time, and this was expected since diffusions were occurring and glyphosate was accumulating on the surface of the film. This increase in film thickness was also more significant in the modified nanocellulose, varying from 0.06 to 3.99. With nanocellulose, this variation was from 0.2 to 1.3. These values show that glyphosate diffused more intensely on the surface of the modified nanocellulose and caused large thickening of the film:
Equation (3) is a representation of the straight line equation obtained by the Weber and Morris model, where qt is the amount of adsorbed glyphosate (mg) per amount of nanocellulose (g) at each time; Kd is the intraparticle diffusion coefficient; and C is the constant that relates to resistance to diffusion. (Its value gives an idea of the thickness of the boundary layer of the film formed).
From the straight line equation in the graphs of the Elovich model (
Figure 6), it is possible to calculate the initial adsorption rate constants (α) and the desorption constant (β). Here, α refers to the adsorption rate and is expressed in mg g
−1 min
−1, whereas β is the desorption constant and indicates the amount of glyphosate that is likely to undergo desorption (mg g
−1). The values of α and β (
Table 3) calculated from the Elovich linearization line, given by Equation (4), indicated values consistent with the literature:
where qt is the amount of adsorbed glyphosate (mg) per amount of nanocellulose (g) at each time; α is the initial adsorption rate (mg g
−1min
−1); β is the desorption constant (mg g
−1); and t is time.
Table 3.
Values of adsorption rate (α = alpha) and desorption constant (β = beta), calculated from the Elovich model graph.
Table 3.
Values of adsorption rate (α = alpha) and desorption constant (β = beta), calculated from the Elovich model graph.
| Material | α
(mg g−1 min−1) | β
(mg g−1) | R2 | Reference |
|---|
| Nanocellulose | 0.03 | 0.98 | 0.9941 | This work |
| Organomodified nanocellulose | 0.09 | 0.71 | 0.9956 | This work |
| Nickel and aluminum nitrate, with double hydroxide layer | 0.00156 | 0.11 | 0.994 | [28] |
| Weak alkaline fiber (FFA1) | 0.003 | 114.4 | 0.991 | [29] |
The calculated values for α and β once again indicated better performance from the modified nanocellulose when compared with the unmodified nanocellulose, as the adsorption rate tripled (from 0.03 mg g−1 min−1 to 0.09 mg g−1 min−1) and the desorption constant decreased (from 0.98 mg g−1 to 0.71 mg g−1). When compared with works available in the literature, it can be observed that the initial adsorption rates for the two nanocelluloses are much better, adsorption occurred in the range of 10× faster, and the desorption constants were higher than those for nickel and aluminum nitrate but much smaller than that for alkaline fiber. Considering the two materials in this work, Elovich’s models demonstrate that the adsorption of modified nanocellulose is faster and more stable.
