Article

Molecular Fingerprinting of the Biodegradation of Petroleum Organic Pollutants in Groundwater and under Site-Specific Environmental Impacts

by
Mingxing Yang
1,2,
Yuesuo Yang
3,*,
Xinyao Yang
4,
Xiaoming Song
4,
Xinqiang Du
3 and
Ying Lu
3
1
School of Resource and Environment Engineering, Guizhou Institute of Technology, Guiyang 550003, China
2
Engineering Research Center of Carbon Neutrality in Karst Areas, Ministry of Education, Guizhou Institute of Technology, Guiyang 550003, China
3
Key Laboratory of Groundwater and Environment, Jilin University, Ministry of Education, Changchun 130021, China
4
Key Laboratory of Eco-restoration of Regional Contaminated Environment, Shenyang University, Ministry of Education, Shenyang 110044, China
*
Author to whom correspondence should be addressed.
Water 2024, 16(13), 1773; https://doi.org/10.3390/w16131773
Submission received: 13 May 2024 / Revised: 13 June 2024 / Accepted: 17 June 2024 / Published: 22 June 2024
(This article belongs to the Special Issue Persistent and Emerging Organic Contaminants in Natural Environments)

Abstract

:
A quantitative and qualitative assessment using molecular markers derived from compound-specific indices for indicating groundwater impacted by petroleum spills in an oil field was recently undertaken and demonstrated serious contamination, with both high total petroleum hydrocarbons (TPH) (3.68–7.32 mg/L) and hazardous compounds in the groundwater. A petroleum source was identified, and the analysis revealed a decreasing trend of fresh petroleum input, along with groundwater advection and an increasing trend of biodegradation potential at locations farther from the source. This was confirmed via microbial analysis with both biodegrading microorganisms and diversity indices (Shannon, Simpson, and Pielou) and the principal component analysis (PCA) modeling approach, which classified the field samples into three types according to the distribution correlations between different organic compounds. Biodegradation was believed to be the dominant sink of hydrocarbons due to the increasing Pr/C17 and Ph/C18 values with seasonal changes. Raised temperatures activated the microbial degradation process; specifically, low-weight hydrocarbons degraded more rapidly than high-weight hydrocarbons, resulting in the accumulation of an unresolved complex mixture of bioproducts at locations that were farther away. Spatially, the Pr/C17 and Ph/C18 values increased from the upstream to the downstream areas, showing substantial biodegradation. The relationships between the molecular markers and chemical indices were quantified via canonical correlation analysis (CCA) to visually explain the interactive reaction processes. It was also demonstrated that the biodegradation of petroleum organics can be characterized by the consumption of dissolved oxygen and a decreasing Pr/Ph ratio, due to system reduction. These results demonstrate that compound-specific molecular markers, coupled with biochemical parameters, can effectively support a better understanding and effective fingerprinting of the fate and transport of petroleum organic contaminants, thus offering valuable technical support for a cost-effective remediation strategy.

1. Introduction

Groundwater contamination by petroleum hydrocarbons is a widely recognized and serious environmental risk, due to the widespread accidental release of petroleum hydrocarbons [1,2,3,4,5] and their carcinogenic and mutagenic effects on human health [6,7,8]. Such release accidents frequently occur in oilfields [9,10]. Petroleum is a complex mixture that contains thousands of different organic compounds with various physical-chemical-biological features [11,12,13], which differentiate their fate and migration pathways and make in situ remediation complicated [14,15]. Once hydrocarbon contaminants infiltrate into the subsurface and groundwater, they are subjected to various natural attenuation processes [16,17], which can be divided into abiotic processes and biodegradation [18,19]. Because of this environmentally friendly feature, biodegradation is considered a promising approach and has been widely used in groundwater petroleum remediation [20]. It is important to note that the biodegradation of petroleum organic pollutants is a dynamic and intricate process that is influenced by various environmental factors, the composition of the pollutant mixture, and the diversity of microbial populations present at the contaminated site [21,22]. However, these changes remain unpredictable, especially in the subsurface environment, where contaminants and microbes are mutually influenced by groundwater, soil, and air, leading to a great challenge in determining their distribution and communities [23]. The main limitation of oil pollution evaluation is that analyzing the pollution process based solely on pollutant concentration may be insufficient and inconsistent, which may lead to uncertainty or even errors in the evaluation outcomes. More importantly, different petroleum organic components have distinct chemical structures, resulting in varied migration processes in the soil and groundwater. This is a primary reason why a single remediation method is often insufficient to completely remove complex oil pollution. Therefore, an effective and accurate assessment of the biodegradation process, based on compound classification, is a prerequisite for the remediation of pollution remediation projects [24,25]. Another challenge in remediating oilfield leakage-type petroleum pollution is repeated contamination caused by prolonged oil extraction, which makes it difficult to accurately locate specific pollution sources in the subsurface environment [26,27].
Although petroleum components undergo transformation during the transportation process, the molecular structures of these components have the capability to retain certain stable chemical structures and characteristic decomposition patterns [28,29]. Therefore, the molecular structural features (as revealed by the GC-MS (gas chromatography-mass spectrometry) technique) of the components can be used to analyze the transformation patterns of the components [30,31,32,33,34]. It has been reported that hydrocarbons from different biological origins have different odd/even carbon number ratios [35,36]. For example, the carbon preference index (CPI) reflects the relative abundance of odd-numbered and even-numbered carbon atoms in the alkanes contained in organic compounds. According to statistics, the CPI value of petroleum compounds should be less than 1 [37]. Thus, the CPI is often considered as a good indicator of oil pollution [38].
Pristane (Pr) and phytane (Ph) are isoprenoids that are frequently found in petroleum compounds, usually as the major constituents of a wide range of isoprenoid alkanes. They are considered to originate primarily from phytol during diagenesis [39,40]. Shi et al. showed that under oxidizing conditions, phytol may be degraded preferably into pristane; conversely, this alteration is thought to result in a predominance of phytane over pristane under reducing conditions [41]. On the basis of the reaction pathways, a Pr/Ph ratio of >1 would represent an oxidizing condition, whereas a Pr/Ph ratio of < 1 is an indication of a reducing environment [42,43]. These distinct accompanying molecular reaction pathways offer us a special indicator (Pr/Ph, the ratio of pristane to phytane) to determine the redox environment.
According to the biodegradation sequence of different compounds, it is clear that low-molecular-weight hydrocarbons are preferentially consumed, while high-molecular-weight hydrocarbons generally have a relatively stable structure that is more resistant to microorganism metabolism. Therefore, the ratio of low-molecular-weight to high-molecular-weight hydrocarbons (L/H) can be used as a criterion to assess the extent of biodegradation. Similarly, Pr and Ph are barely degradable, while alkanes C17 and C18 degrade more easily; hence, the ratio of Pr/C17 and Ph/C18 could demonstrate the degree of biodegradation [44]. There is a special type of compound, named unresolved complex compounds (UCM), which commonly appear as a bump in the GC-MS spectrum. It has been widely reported that UCM is composed of petroleum-derived products such as ester and phenols (usually non-hydrocarbons), providing a good indicator of the extent of biodegradation. Hence, an increasing concentration of UCM suggests that hydrocarbons are degrading [45].
The biodegradation of hydrocarbons is accompanied by oxidation-reduction reactions that involve breaking chemical bonds and transferring electrons away from the contaminant [46]. Subsurface environments offer electron acceptors such as iron, manganese, sulfate, nitrate, and oxygen to complete the transfer and, consequently, convert original compounds into intermediates. Biodegradation is classified into aerobic and anaerobic reactions according to the characteristics of the electron acceptors, which can distinguish the basic biodegradation pathway. In most cases, electron balances show the complete anaerobic oxidation of these aromatic compounds into CO2 [47]. Furthermore, some intermediates, such as benzylsuccinic acid and methylbenzylsuccicic acid isomers, have been proposed as distinctive indicators for use in the monitoring of anaerobic toluene and xylene degradation in fuel-contaminated aquifers [48,49].
Oxygen is the main participator in aerobic metabolism. It is incorporated by oxygenase and, finally, becomes part of the intermediates. During this process, O2 is reduced. The major byproducts of aerobic respiration are carbon dioxide, water, and an increased population of microorganisms [50]. Dissolved oxygen (DO) concentrations provide estimates for the relative rate of hydrocarbon biodegradation and oxygen drawdown within the plume. Anaerobic respiration uses nitrate (NO3), sulfate (SO42−), metals such as iron (Fe2+) and manganese (Mn4+), or even CO2 as accepting electrons [51].
Oilfields in the northeast of China are critical energy resources and significant industrial centers that have witnessed decades of oil exploitation and are still operating. Consequently, petroleum contaminants are prevalent, both in the surface soil and in groundwater, which poses a significant threat to local residents and the eco-environment. This work presents a comprehensive investigation of petroleum-contaminated groundwater at an oil field in northeast China. The main objectives are to (1) effectively evaluate the composition and distribution of petroleum contamination in groundwater; (2) assess the spatial and temporal features of biodegradation by using molecular markers; and (3) identify the related chemical alterations and their inter-reactions with the environment. The results achieved demonstrate that a combination of molecular markers and chemical indices offers robust indices for the measurement of petroleum hydrocarbon contamination.

2. Materials and Methods

2.1. Site Setting and Sampling Strategy

The study area is located in the northeast of China, a typically cold and arid region. Winter here can last for five months, and the annual average temperature is 4.7 °C. The topographic features of this area characterize it as an alluvial-proluvial plain. The main body of surface water is a local river with 1.8–4 m average water-table fluctuation. This area’s dry season usually occurs in winter each year, while the wet season occurs during July. The elevation in the study area is 130.2–132.5 m, and the contaminated site lies at the junction between the first terrace and a hillock (15–20 m high) that offers a hydraulic gradient for the movement of groundwater. After decades of continuous extraction, the groundwater pollution problem at this oilfield has become very severe. Despite multiple pollution remediation efforts, the complexity of contamination points and the long history of pollution have prevented complete restoration. The main contamination source is an oil–water pit produced by a faulty oil drilling well, located in the southeast corner. Quaternary fine, medium, and coarse sands and gravels are the principal components of the lithology in this area. The shallow aquifer is composed of these media and is 15–20 m thick. The groundwater table lies at 2.0–4.0 m below the surface and fluctuates by 0.5 m annually. The general direction of groundwater flow is from southeast (up-gradient) to northwest (down-gradient). For the purpose of accurate investigation regarding both source identification and migration pathways in the groundwater of different types of organic petroleum compounds, 13 monitoring wells were established within the contaminated site, and groundwater samples were collected every month from those wells. During the sampling process, groundwater from the monitoring well was initially extracted using a bailer. To prevent degradation from exposure to sunlight and air, a 500 mL amber sampling bottle was filled with groundwater samples. Then, 2 mL of hydrochloric acid was added to adjust the pH of the samples to less than 2. The sampling bottles were sealed with aluminum foil to prevent air from entering, and the samples were stored at 4 °C indoors. The petroleum organic hydrocarbons and water chemical properties of all those samples were analyzed. In addition, to study the spatial migration characteristics of petroleum pollutants in groundwater, 3 sections were set up along the direction of the water flow (Section 1) and perpendicular to the direction of the water flow (Section 2 and Section 3), respectively, to analyze the impact of groundwater flow on the migration of petroleum pollutants (Figure 1).

2.2. Hydrocarbon Analysis

2.2.1. Extraction of Hydrocarbons

We used the dichloromethane liquid-liquid extraction method to extract samples. Then, we transferred the entire 500 mL water sample to a separating funnel, rinsed the sample bottle with dichloromethane, and added a rinsing solution to the separating funnel. Then, 20 mL of dichloromethane was added to the separating funnel, the sample was shaken for 10 min and allowed to settle into layers, and then the dichloromethane extract was collected in a brown bottle. These steps were repeated three times. Finally, we evaporated the collected extract to 1 mL using a rotary evaporator at 45 °C and used GC-MS to determine the organic components.

2.2.2. GC-MS Conditions

The hydrocarbon analyses were performed using an Agilent 6890N-5975 GC-MS system. GC-MS was employed to determine the concentration under the following test conditions: (1) chromatographic conditions involved a capillary column (50 m × 0.25 mm × 0.25 μm). The gas chromatography inlet temperature was set at 250 °C, with split injection (split ratio 10:1). High-purity helium (99.999% purity) was used as the carrier gas, with a constant current mode and a column flow of 10 mL/min. The temperature-programming process began at 35 °C, was maintained for 3 min, and then was ramped up to 150 °C at a rate of 10 °C/min, held for 2 min, and, finally, increased to 200 °C at a rate of 20 °C/min for 2 min. (2) The mass spectrometry conditions included an electron multiplier voltage of 2108 eV, a GC-MS interface temperature of 250 °C, an ion source temperature of 230 °C, and electron energy set at 70 eV. The full scan mass range was 50–400 m/z. Hydrocarbon identification was achieved by comparing retention times with internal standards.

2.2.3. Inorganic Analysis

Inorganic materials, such as Fe3+, Mn2+, and SO42−, were detected to indicate the oxidation-reduction conditions in the groundwater system. Samples for Fe/Mn were acidified with hydrochloric acid, while samples for sulfide were treated with 1 mol/L of sodium hydroxide and 1 mol/L of zinc acetate as stabilizers. The sampling bottles were filled to the top with no headspace, sealed with aluminum foil, protected from sunlight during shipping, and stored at 4 °C for subsequent laboratory analysis. Total petroleum hydrocarbons were analyzed using infrared spectrophotometry (JDS-108U+). K+ and Na+ were measured using flame atomic absorption spectrophotometry; Ca2+, Mg2+, NO3, Cl, and Fe3+ were determined through titration; SO42− was quantified using the turbidity method. The analytical methods followed the Quality Standards for Groundwater (GB/T 14848-2017) in China [52]. Additionally, a multiparameter water quality analyzer (Hach-HQ40) was used to assess other groundwater properties. For rapid sample analysis, a HANNA handheld multiparameter portable water quality meter was employed to measure the dissolved oxygen (DO), pH, temperature, electrical conductivity (EC), oxidation-reduction potential (ORP), and other parameters in groundwater.

2.2.4. Microbial Analysis

  • Microbial Incubation
Biodegradation is a process in which microbes consume hydrocarbons to obtain carbon and energy resources for their growth and reproduction. The population of microbes is crucial for determining the extent of biodegradation. In this study, we utilized the plate culture method to quantify the number of microbes in water samples, measured in CFU/mL. Upon the collection of water samples, the microbes underwent incubation using three different types of cultured medium: (1) beef extract–peptone medium consisting of 3 g beef extract, 10 g peptone, 5 g NaCl, 15–20 g agar, 1000 mL water, with solution pH set at 7, and sterilized at 121 °C for 30 min. (2) Starch agar medium containing KNO3 1 g; NaCl 0.5 g; (NH4)2SO4 1 g; K2HPO4 5 g; MgSO4 0.5 g; CaCl2 0.1 g; with trace elements FeSO4 0.01 g; MnSO4 0.003; ZnSO4 0.003; solution pH set at 7. (3) PDA medium composed of 200 g potato, 20 g sucrose (or glucose), 15–20 g agar, 1000 mL water, and the solution pH set at 7. The potatoes were peeled, cut into pieces, boiled for half an hour, and filtered through gauze, then the sugar and agar were added, and the water was adjusted to 1000 mL after dissolving, with the solution pH set at 7, and finally sterilized at 121 °C for 20 min. For the sugar in the formula, sucrose was added for mold culture, while glucose was added for yeast, actinomycetes, and bacillus culture.
2.
Screening of Dominant Strains
After culturing the microorganisms from the site on different media, most of the site’s microorganisms were obtained. To identify microorganisms with growth advantages for future degradation of the contaminated site, well-growing single colonies are selected and picked from numerous colonies. These are initially streaked on fresh solid medium plates for isolation and cultivation. After 2 days, well-growing single colonies are selected again for streaking and isolation. The purified single colonies are then preserved in solid slant culture tubes.
3.
Molecular Testing of Microbes
Microorganisms present in the samples were collected and their genomic DNA was extracted using the BS423 column genomic DNA isolation kit (Sangon Biotech, Shanghai, China), following the manufacturer’s instructions. The variable region V3 of 16S rDNA was amplified with the forward primer F27 and the reverse primer R1492. F27 was designed with a 40-base GC clamp at the 5′ end to aid in the separation of DNA fragments. PCR was carried out in a 50 μL reaction mixture containing 0.2 mM of each primer, 0.2 mM of deoxynucleoside triphosphates (dNTP), 2 U of Taq DNA polymerase, and 1 μL of undiluted DNA. The PCR thermocycling program consisted of initial denaturation at 94 °C for 5 min, followed by 30 cycles of denaturation at 94 °C for 1 min, annealing at 55 °C for 1 min, extension at 72 °C for 45 s, and a final extension at 72 °C for 10 min. Subsequently, the amplified products were sequenced by a commercial DNA sequencing service (BGI Co., Beijing, China) to identify the microbial species.
4.
Microbial Community Structure Analysis
Shannon, Simpson, and Pielou are three diversity indices that are used to calculate the carbon source utilization diversity of environmental microbial communities, assessing the species richness, the dominance of the most common species, and species in the environmental microbial community, respectively.
The Shannon index (H) is a function that combines the diversity of species and the number of species. The higher the value, the richer the community structure and diversity. The calculation formula for the Shannon index is:
H = i = 1 S P i ln P i
where Pi = ni/N, ni is the relative luminosity of band i, N is the total relative absorbance of the lane, and S is the number of operational taxonomic units (OTUs) in the calculated sample.
The Simpson index (D), also known as ecological dominance, reflects the role and status of dominant species in the community. For the same species, the higher the index, the simpler the community structure and diversity. Its calculation formula is:
D = i = 1 S P i S
The Pielou index (E) is used to evaluate the evenness of species in a given sample. The closer its value is to 1, the smaller the difference in the number of species in the sample microbial community. The Pielou index is calculated as follows:
E = H / ln S

2.3. Determination of Molecular Markers

Molecular markers can be applied to fingerprint the distribution features of petroleum hydrocarbons and to provide additional information on the redox environment and the extent of degradation of the spilled oil. These indicators are the CPI, odd/even predominance (OEP), the ratio of low-molecular-weight hydrocarbon to high-molecular-weight hydrocarbon (L/H), unresolved complex mixture (UCM), the ratio of pristane to phystane (Pr/Ph), the ratio of pristane to n-C17 (hydrocarbon with 17 carbon atoms) (Pr/C17), and the ratio of phytane to n-C18 (hydrocarbon with 18 carbon atoms) (Ph/C18). The calculation equations for these markers are presented below:
CPI = 1 2 C 15 + C 17 + C 19 + C 21 + C 23 C 14 + C 16 + C 18 + C 20 + C 22 + C 15 + C 17 + C 19 + C 21 + C 23 C 16 + C 18 + C 20 + C 22 + C 24
OEP = C 25 + 6 C 27 + C 29 4 C 26 + 4 C 28
L / H = Σ C 6 C 20 / Σ C 21 C 30

2.4. Statistical Analysis

Principal component analysis (PCA) was employed to distinguish the distribution similarity and dissimilarity of sampling locations to reveal the contamination level and source of the different compounds. A data matrix comprising 13 sampling sites and 10 variables was used. The relationships between molecular markers and chemical indices were examined using canonical correlation analysis (CCA) to comprehensively explain the extent of biodegradation and redox condition. Statistical processing was performed with the CANOCO program for Windows 4.5.

3. Results and Discussion

3.1. Distribution of Hydrocarbons at the Site

The main source of petroleum hydrocarbon organic compounds in the groundwater at the research site is primarily various oil leaks that occurred during the oil drilling process, resulting in significant pollution after long-term accumulation. The main source of pollution at the site is an oil pit in the southeast corner, where petroleum contaminants collect and continuously infiltrate into the soil and groundwater through rainfall leaching and gravity. Moreover, this oil pit happens to be located upstream of the groundwater flow at the site, causing abandoned crude oil to migrate with the water flow, thereby leading to a larger area of pollution. When tested, the total petroleum hydrocarbons (TPHs) in the shallow groundwater ranged from 3.68 to 7.32 mg/L, with an average value of about 4.75 mg/L, which significantly exceeds the acceptable national water quality standard in China, demonstrating serious petroleum contamination in the study area (Table 1). The highest TPH concentration in the groundwater appeared at S1, with an average TPH value reaching 6.23 mg/L, while the lowest appeared at Z20, with an average TPH value reaching 4.26 mg/L. The average TPH concentration contours in different wells are shown in Figure 2. It is clearly shown that a contamination plume originated in the southeast of the site and then developed, along the path of groundwater flow, to the northwest.
In order to discuss the specific distribution diversities of the different compounds, hydrocarbons were divided into three types, based on the results of GC-MS analysis and their different functional groups: alkane hydrocarbon (ALH), aromatic hydrocarbon (ARH), and unresolved complex mixture (UCM).

3.1.1. Alkane Hydrocarbons

Alkane hydrocarbons are a principal component of crude oil and contain various molecular formations with different carbon numbers. The individual ALH concentration in groundwater ranged from 1.26 to 4.79 mg/L, with an average of 65.6% in TPH, which displayed a distribution trend similar to that of TPH. The highest and lowest ALH concentrations were detected in S1 (4.79 mg/L, March) and Z10 (1.26 mg/L, July), with a carbon number from C6 to C30, including cycloalkanes (e.g., hexamethylene and heptamethylene), straight-chain hydrocarbons and their homologous compounds, and isoprenoid hydrocarbons (such as Pr and Ph). According to the analysis results, low-weight hydrocarbons played a dominant role in shallow groundwater, and their percentage of ALH ranged from 56.2% to 73.5%. This demonstrates the intrusion of a fresh petroleum source. This may be due to the relatively high solubility in water that is frequently demonstrated by ALHs, which enables their migration with groundwater. While migrating in the aquifer, the ALH underwent various weathering progresses such as adsorption, evaporation, and biodegradation (discussed below), which explains the decreasing amount of ALH.

3.1.2. Aromatic Hydrocarbons

Aromatic hydrocarbons have a unique molecular structure that possesses a benzene ring. On the basis of ring numbers, aromatic hydrocarbons can be divided into two main categories: BTEX (one ring) and PAH (two or more rings) [53]. The toxicity of petroleum contaminants mainly arises from aromatic compounds such as benzene, toluene, ethylbenzene, naphthalene, and anthracene, which are highly poisonous materials that were detected in every well. The concentration of aromatic hydrocarbons in the groundwater varied from 0.13 to 2.71 mg/L (more specifically, benzene, 0.01–0.31 mg/L; ethylbenzene, 0.08–0.98 mg/L). Aromatic compounds are highly volatile but demonstrate low dissolubility. This may be the reason for their rare occurrence around Z9, which was far removed from the contamination source. These intrinsic properties, weakening their migration ability in groundwater, resulted in a centralized region in S1 and Z1, indicating that these were the sources of petroleum. However, in regions of downward groundwater flow, such as Z10, the concentrations ranged from 0.39 to 0.78 mg/L, suggesting strong contamination. This may result from long-term submergence in a crude oil environment.

3.1.3. Unresolved Complex Mixture

Alongside ALH and ARH, the links between UCM and degraded petroleum are well known. UCM was also present in all samples from the shallow groundwater [54]. Compared to alkanes, UCM is more resistant to biodegradation and, thus, has a greater tendency to remain and accumulate in the environment. UCM is generally considered to be composed of many intermediate products (such as ester and alcoholic hydrocarbons) that are produced during various weathering processes. Thus, the occurrence of high concentrations of UCM in the samples indicates that this area was polluted by the weathered products of petroleum hydrocarbons, while areas affected by fresh oil contamination tend to have relatively higher concentrations of n-alkanes. This was demonstrated by the diversity in their concentrations among different wells. For instance, wells near the oil–water pit had low UCM concentrations (S1, 0.60 mg/L; Z1, 0.66 mg/L), suggesting moderate microbial activities around the source area because new fresh compounds may not be able to fully come into contact with microbes. Conversely, after a long period of migration and reaction with many other chemicals, the UCM levels increased in the downstream areas of groundwater flow, such as at Z9 (1.72 mg/L) and Z10 (1.88 mg/L).

3.1.4. Molecular Marker Analysis

The CPI and OEP values of organic compounds in the water represent the dominance of odd/even carbon atom numbers in n-alkanes. The range of CPI values was 0.53–0.97, with the highest value observed at S1, the lowest at Z9, and an average of 0.78. The range of OEP values was 0.61–1.30, with the highest value occurring at S1, the lowest at Z21, and an average of 0.87 (Table 2). The CPI and OEP values in all the groundwater samples were both close to 1, which further proved the existence of petroleum contamination. In addition, there was a decreasing trend in CPI and OEP values along the groundwater flow direction; this finding was in perfect agreement with the TPH distribution.

3.1.5. PCA Analysis of Petroleum Hydrocarbons

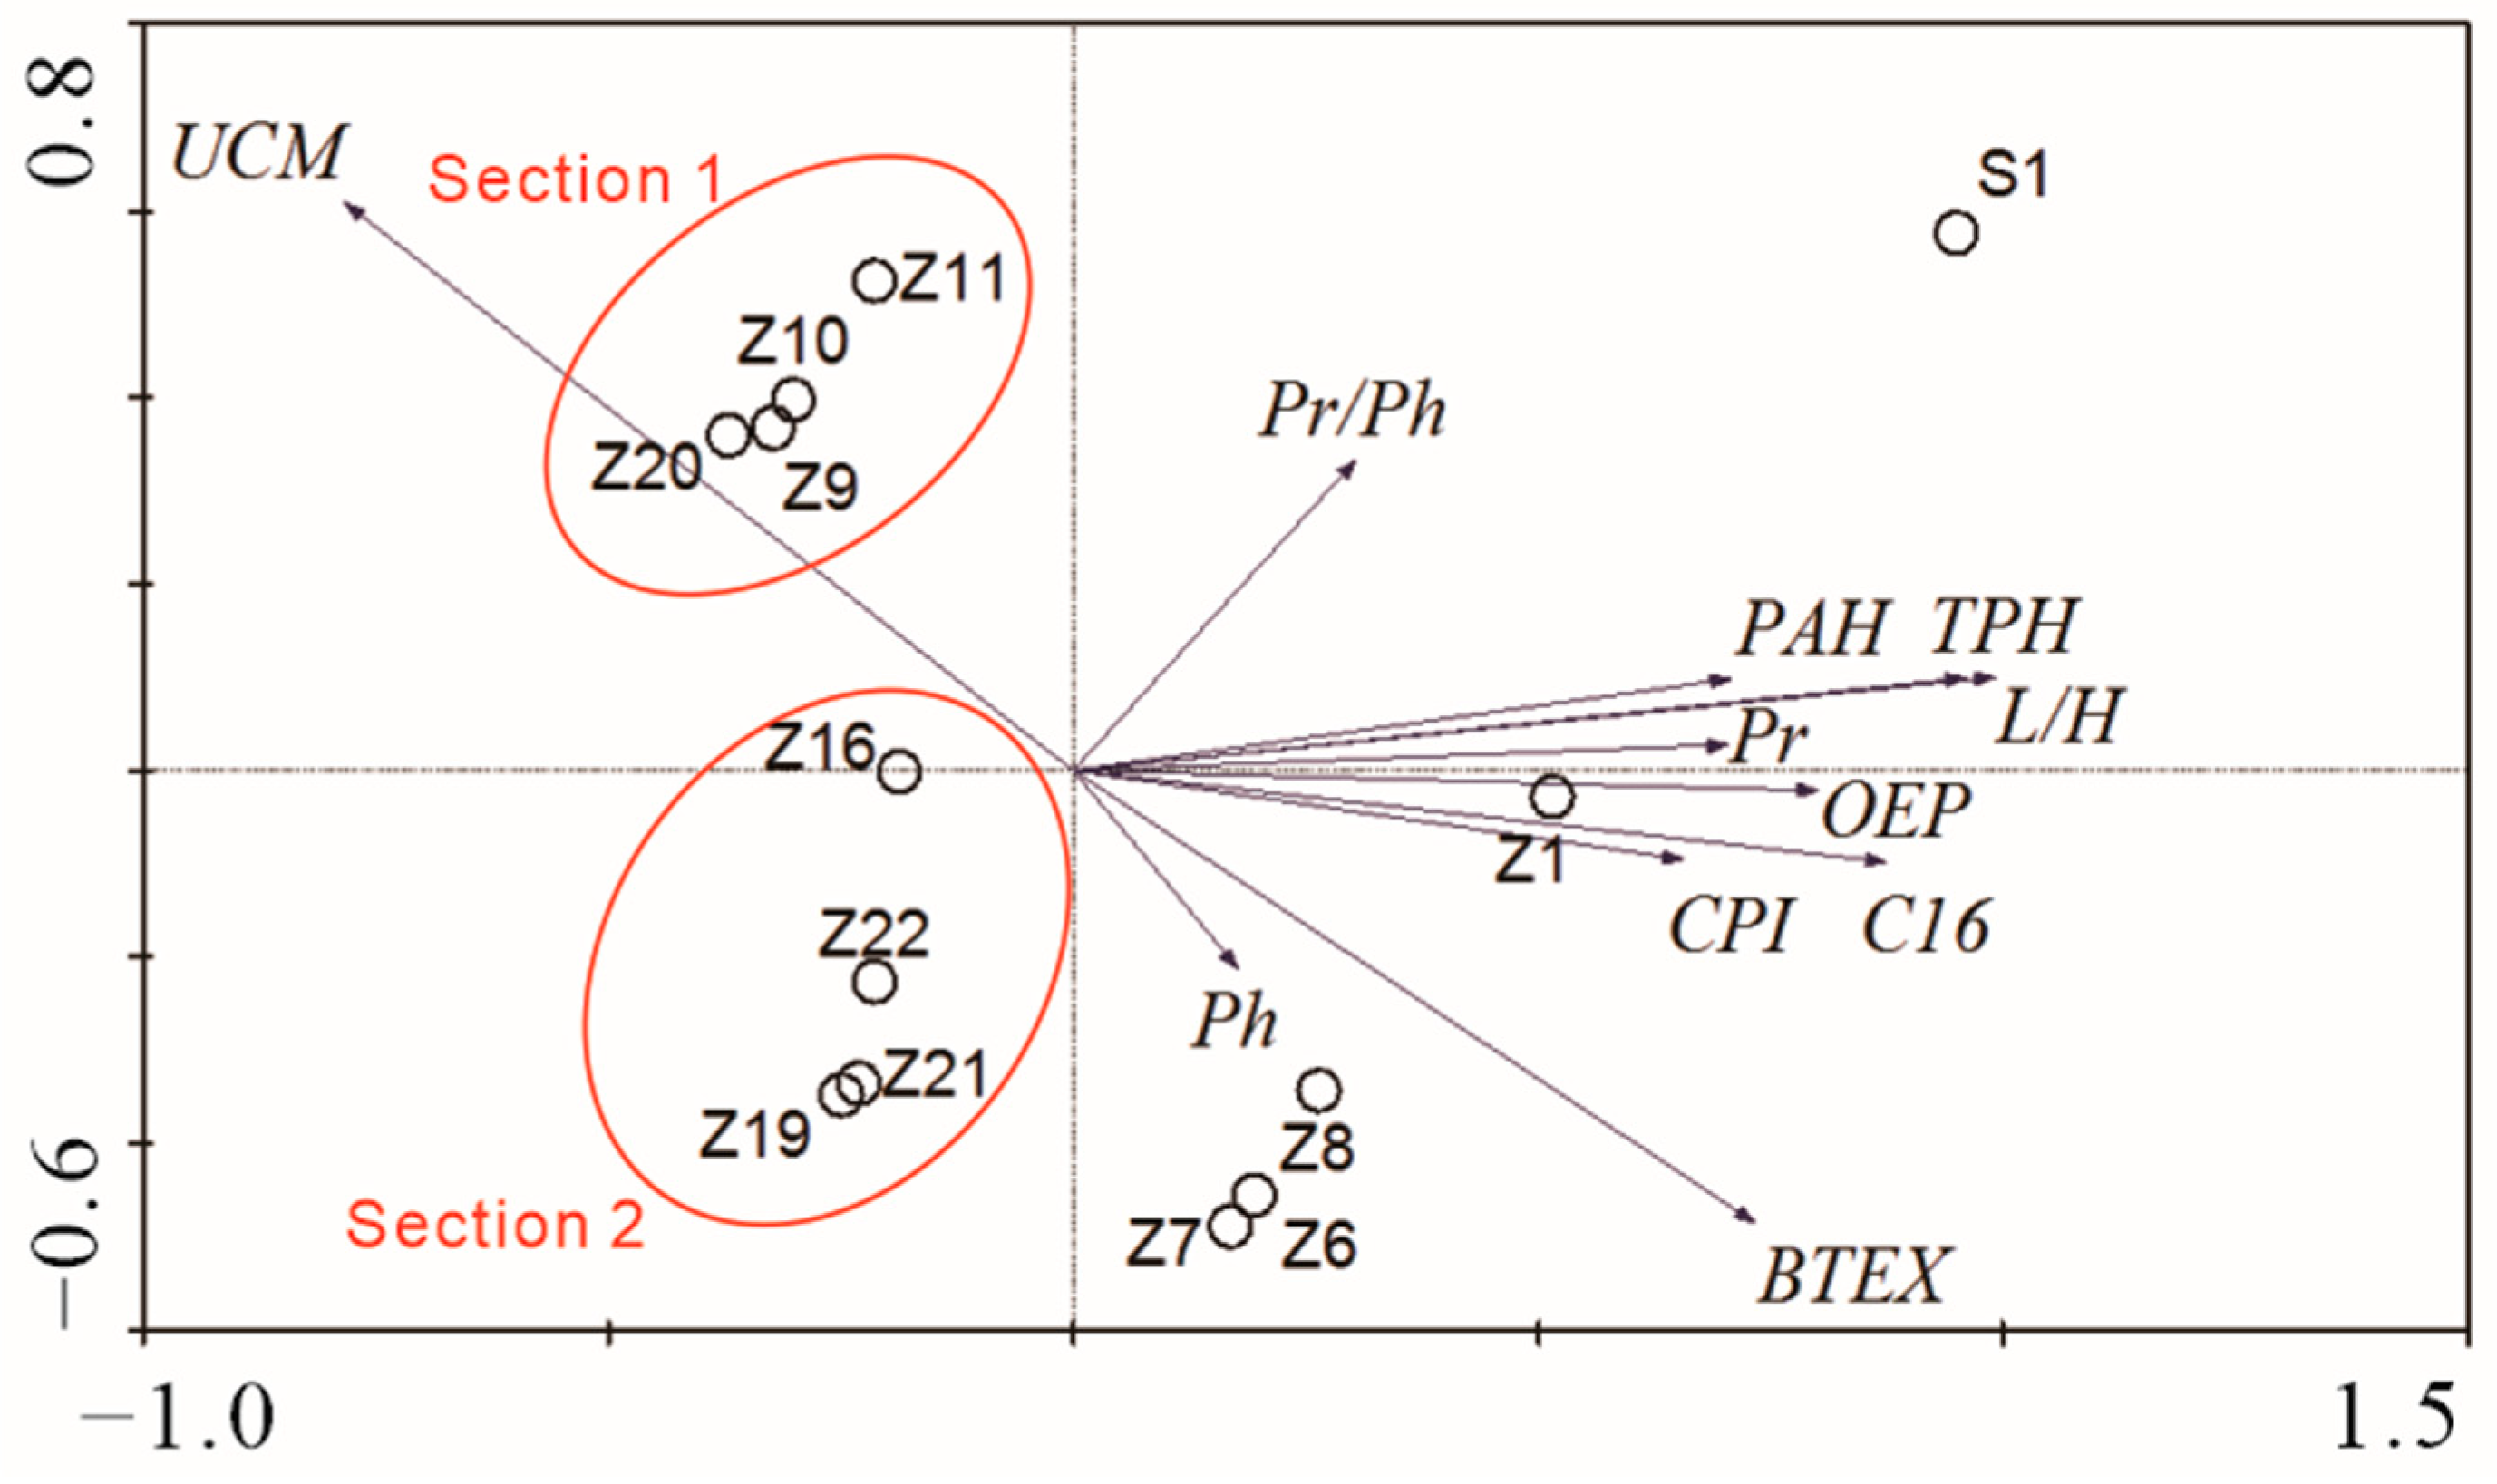
The detected results were statistically analyzed to describe the distribution characteristics of compounds and the similarity/dissimilarity of sampling locations. The PCA results showed that the first and second axes explained 86.0% and 6.5% (the cumulative percentage variance explained by the two axes was 92.5%) of the total variance, respectively (Figure 3). The positive value of PC1 on the horizontal axis indicated an association with Pr, Ph, BTEX, and PAH, which suggests fresh petroleum contamination, while the UCM, as defined by the negative value on the axis, suggests that the hydrocarbons that were present were mainly from biodegradation. The sampling locations had three main compositional patterns: First, wells in the first and second quadrants showed a positive relation with TPH, C16, Pr, Ph, and BTEX (high concentrations of all those chemicals suggest a strong influence from the nearby oil–water pit). Second, wells in the third quadrant (Z16, Z19, Z21, and Z22) demonstrated a medium contamination level, which may indicate a weathered area that is critically controlled by physical processes (such as volatilization and diffusion). Third, wells in the fourth quadrant revealed a positive relationship with UCM, which may be interpreted as the biodegraded component from fresh hydrocarbon inputs.

3.2. Biodegradation of Petroleum Hydrocarbons

Consumption by microbes as an energy and carbon source is a common sink pathway for petroleum hydrocarbons. However, the potential for biodegradation is quite variable, depending on the different molecular structures of the compounds. For example, isoprenoid hydrocarbons are more resistant to biodegradation than n-alkanes (such as C17 and C18). Thus, the Pr/C17 and Ph/C18 ratios in isoprenoid hydrocarbons are much higher than 1, indicating deeply degraded hydrocarbons [48]. These ratios are used to evaluate the extent of biodegradation in groundwater. Chemical properties during biodegradation are also utilized to further explain material alterations.

3.2.1. Biodegrading Microorganism Analysis

After cultivating the microorganisms in the groundwater at the site, 67 strains of oil-contaminated bacteria were extracted. Eight strains with excellent growth were selected, according to the culture medium type and growth characteristics. These eight strains included: three strains of bacteria (SX1, SX2, and SX3), three strains of actinomycetes (SF1, SF2, and SF3), and two strains of fungi (SZ1 and SZ2). We extracted DNA from the eight microorganisms and performed gel electrophoresis and PCR, followed by electrophoresis detection, and finally conducted gene sequencing on the samples. The obtained sequences were submitted to GenBank, and the online BLAST tool provided by NCBI was used to compare the sample gene sequences with those in the database for similarity. The 16S rDNA gene sequences of the eight strains and their closest species with high similarity in GenBank were shown in Table 3. These strains have been reported to possess strong organic matter degradation capabilities [55,56,57,58].
After plate culture, we used an optical microscope to observe the typical characteristics of each strain, as shown in Figure 4. SX1 is Gram-negative, appearing in long strips. Characteristics such as flagella, spores, and capsules can be observed. SX2 is Gram-positive; sporulation can be observed, with no flagella and capsule, showing a needle shape and sparse distribution. Comparing the characteristics of the three bacterial strains, it can be seen that SX3 (hook-shaped) has the greatest number, and the strain size is between the other two strains, which means that the bacteria can more easily attach to TPH. Although SX1 has a small number of bacteria, the bacteria are neatly arranged and elongated, giving more reaction space than with SX2. Among the actinomycetes, SF3 is the most numerous, and its surface is partly wrinkled. However, SF2 has many wrinkles on its surface and has spore filament branches growing on it. Its bacterial body distribution is relatively loose, which can provide a larger space for the degradation of TPH. In contrast, the bacterial cells of SF1 are smaller and more scattered, which is not conducive to the degradation of TPH. Fungi can be observed with septate hyphae, non-septate hyphae, and conidia. SZ1 has the largest number, a smaller size, and a wrinkled bacterial surface, and finds it easier to react with TPH than SZ2. To sum up, SX3, SF2, and SZ1 are all smaller in size and have a larger number of bacteria, so they have a greater specific surface area and a relatively favorable reaction space, which provides good conditions for the degradation of TPH.
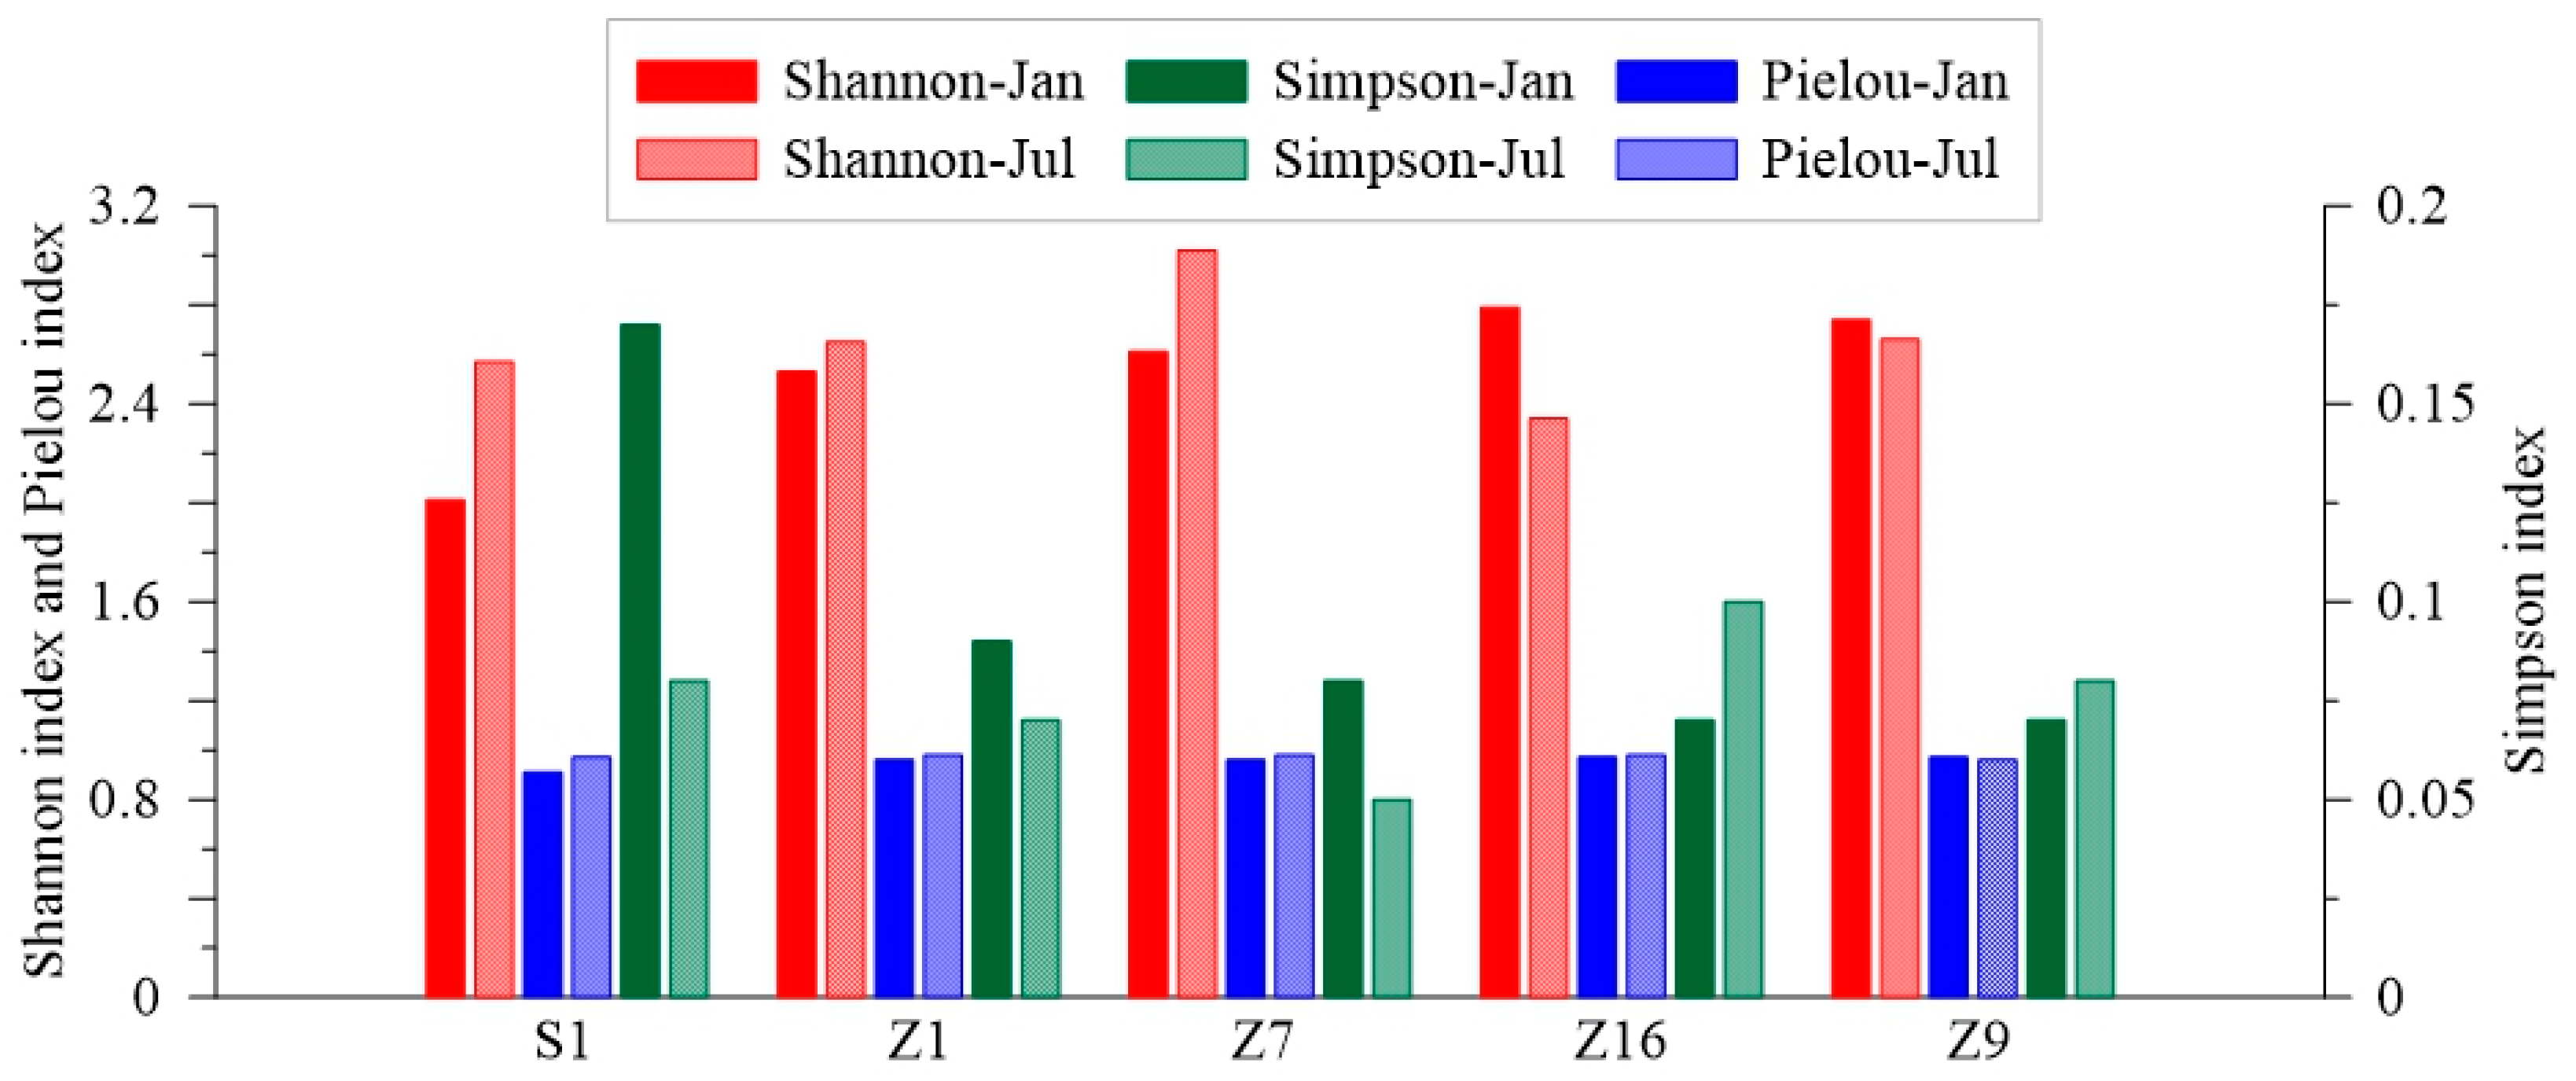
Figure 5 compares the diversity index (Shannon, Simpson, and Pielou) of January (winter and dry season) and July (summer and wet season) in groundwater at the study sites. There is a good negative correlation between the Shannon index and the Simpon index, indicating that the richer the microbial community population in the groundwater, the lower the ecological dominance, and these findings were consistent with those reported in [18,59]. The Pielou index and the Simpon index are negatively correlated, but the degree of correlation is not as high as for the Shannon index, mainly because the Pielou index depends largely on the number of species in the system; under the same conditions the difference in ecological dominance between species-rich and species-less systems is not obvious.
In the direction of groundwater flow from S1 to Z9 (Section 1), as the concentration of TPH decreases, the Shannon index shows a gradually increasing trend, indicating that the diversity of microorganisms was increasing, which is consistent with the change trend of the measured number of microorganisms (Figure 6). This result shows that as pollutants migrate in the groundwater, they are continuously degraded by microorganisms, causing their number and diversity to increase. Similarly, the Simpson index gradually decreased, indicating that the microbial structure and diversity in groundwater became increasingly abundant. The spatiotemporal difference of the Pielou index did not change much, which is related to the low microbial content at the site.
Seasonal comparison shows that the Shannon index in S1, Z1, and Z7 are low in winter and high in summer, while the Simpson index is high in winter and low in summer, both indicating that the microbial diversity is higher in summer than in winter. It is clearly demonstrated that rising temperature is conducive to the growth and reproduction of microorganisms. However, the opposite situation occurs in Z16 and Z9 (the Shannon index is higher in winter than in summer, while the Simpson index is lower in winter than in summer). The reasons for this phenomenon may be that Z16 and Z9 are far away from the pollution leakage point and are downstream of the site, which means that they can be affected by dilution from upstream water.

3.2.2. Spatial Features

The biodegradation of petroleum hydrocarbons can vary significantly in terms of the reaction pathways, reaction extents, and produced intermediates, due to environmental influences. According to the PCA results, petroleum contamination can be divided into three sections on the basis of contamination levels: Section 1, including S1, Z1, Z7, Z16, and Z9 wells, exhibits the effects of groundwater flow and a diversity of microbial activities; Section 2 characterizes the central region of the area; and Section 3 is characterized by degraded contamination. The correlation analysis results of PCA at the sampling sites clearly indicated that the classification (grouping Z16, Z19, Z21, and Z22 as similar sites and Z9, Z10, Z11, and Z20 as similar sites) was consistent with the positional classification results of the sampling wells in the study area, which were related to the distance from the pollution source. These results also represented the gradient positional classification of groundwater petroleum pollutants forming pollution plumes. The sample analysis results, depicting the spatial features of biodegradation, are shown in Figure 6.
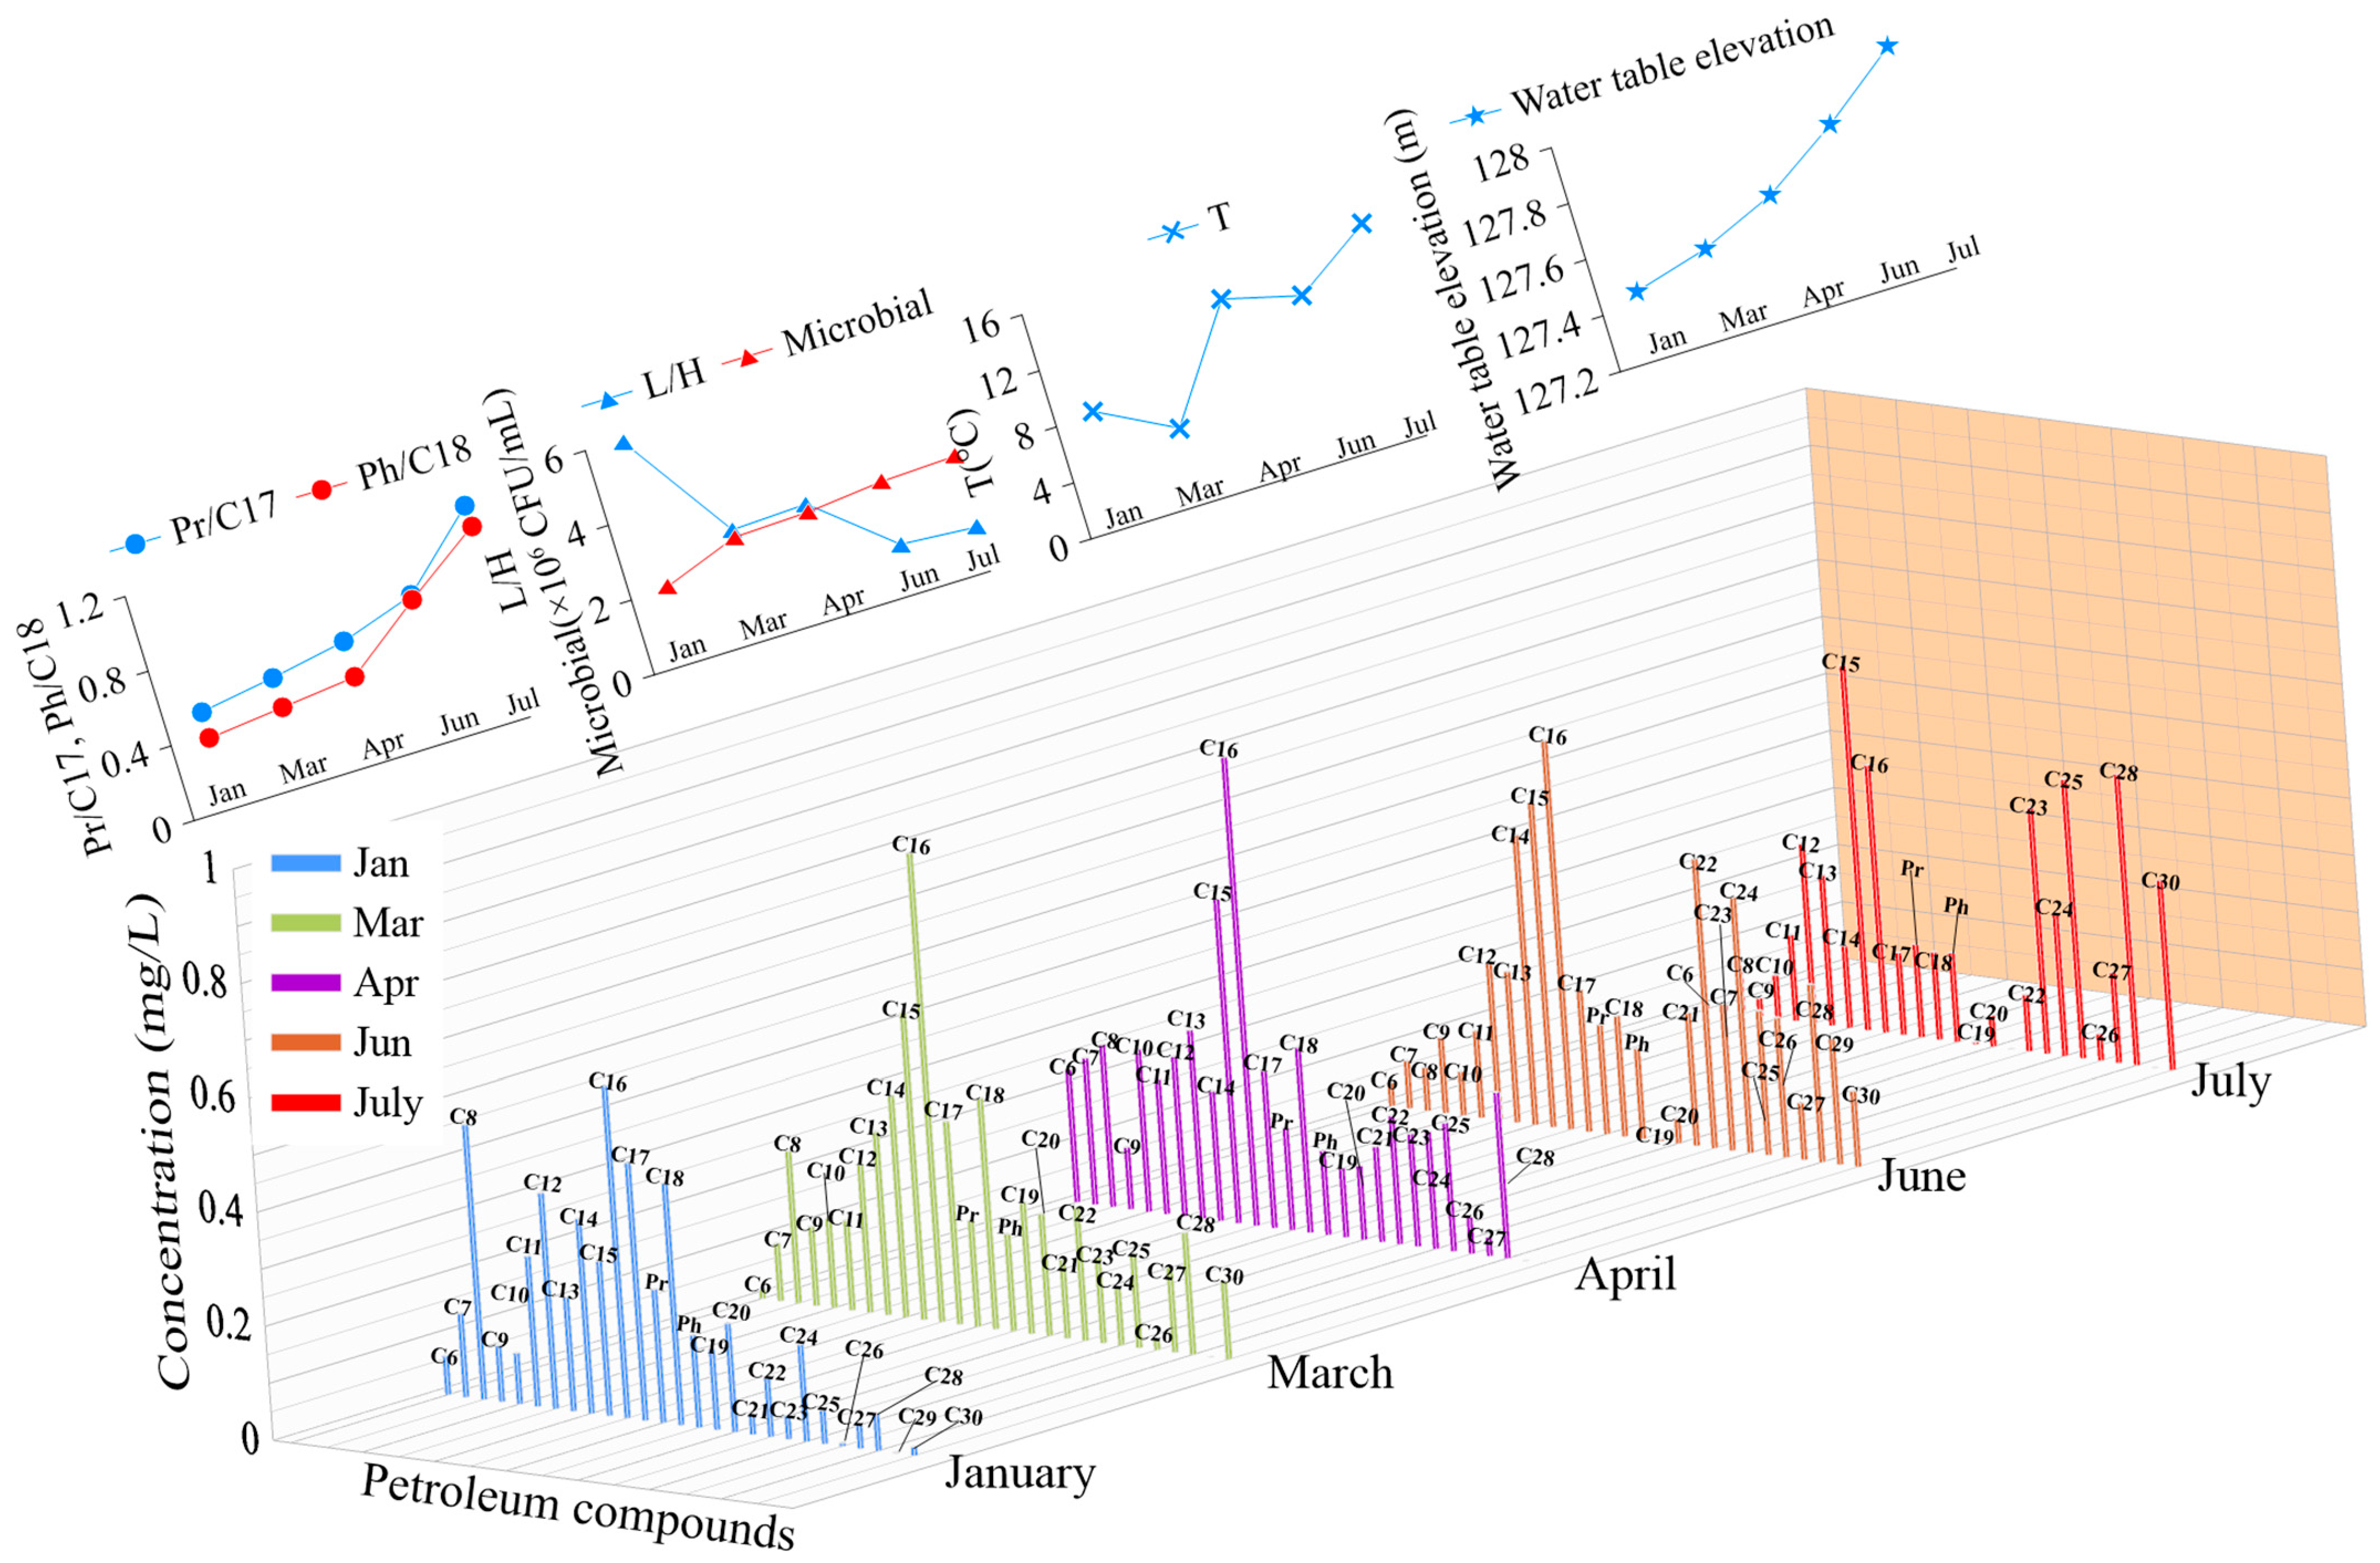
Figure 6 clearly demonstrates that along the path of groundwater flow (Section 1), the levels of short-chain compounds decreased, while heavy-chain compounds accumulated, resulting in a decrease in the L/H ratio from 5.43 (S1) to 0.98 (Z20) in winter and from 2.59 (S1) to 2.14 (Z20) in summer. This trend matches well with the conventional hierarchies of petroleum biodegradation, which begin with the loss of straight-chain alkanes, followed sequentially by acyclic isoprenoids and highly branched and cyclic saturated hydrocarbons. This conclusion is supported by the decreasing L/H ratio due to the continuous loss of low-weight compounds. In addition, the increasing ratio values of Pr/C17 and Ph/C18 explain the finding that while petroleum hydrocarbons were migrating with the groundwater, they were constantly consumed by microbes, leading to the growth of the microbial population (S1: 1.70 × 10⁶ CFU/mL in winter and 2.15 × 10⁶ CFU/mL in summer, Z9: 3.18 × 10⁶ CFU/mL in winter and 4.14 × 10⁶ CFU/mL in summer) and the compositional alteration of compounds.
The hydrocarbon composition in groundwater samples from wells in Section 2 and Section 3 changed only slightly. This may be because both Section 2 and Section 3 were not located in the direction of groundwater flow and were not affected by the flushing action and migration of groundwater. Instead, they only experienced processes such as dispersion and degradation. However, the Pr/C17 and Ph/C18 values were also maintained at around 1, indicating that biodegradation was occurring.

3.2.3. Temporal Features

Seasonal changes result in dramatic variations in environmental factors such as temperature, atmospheric pressure, and microbial activity. More importantly, the groundwater table varies due to precipitation. The results of the groundwater compositional analysis for Z1 from January to July are shown in Figure 7 these demonstrate the clear influence of seasonal changes. (1) Winter conditions: The study area is a cold region in China, where 1–2 m of surface soil is frozen during the winter, and contaminants in the soil cannot penetrate, leading to a decrease in TPH. In addition, microbial activity decreases in cold conditions; therefore, the Pr/C17 and Ph/C18 values were low. (2) Spring conditions: The rising temperature from March to April melted the frozen soil and increased the amount of infiltration contaminants that were originally retained in the soil. Then, the concentration of low-weight hydrocarbons rose from 4.50 mg/L to 4.81 mg/L, which suggested fresh petroleum input. (3) Summer conditions: Precipitation in this area commonly happens in June and July; these months are also a period of dramatic increases in temperature. These climate changes resulted in a dilution of contaminant concentration. However, the increasing values of Pr/C17 and Ph/C18 ratios indicate intense biodegradation, which results in microbial accumulation. Other factors, such as the temperature and water table elevation, also validate this conclusion.

3.3. Canonical Correspondence Analysis (CCA) of Indicators

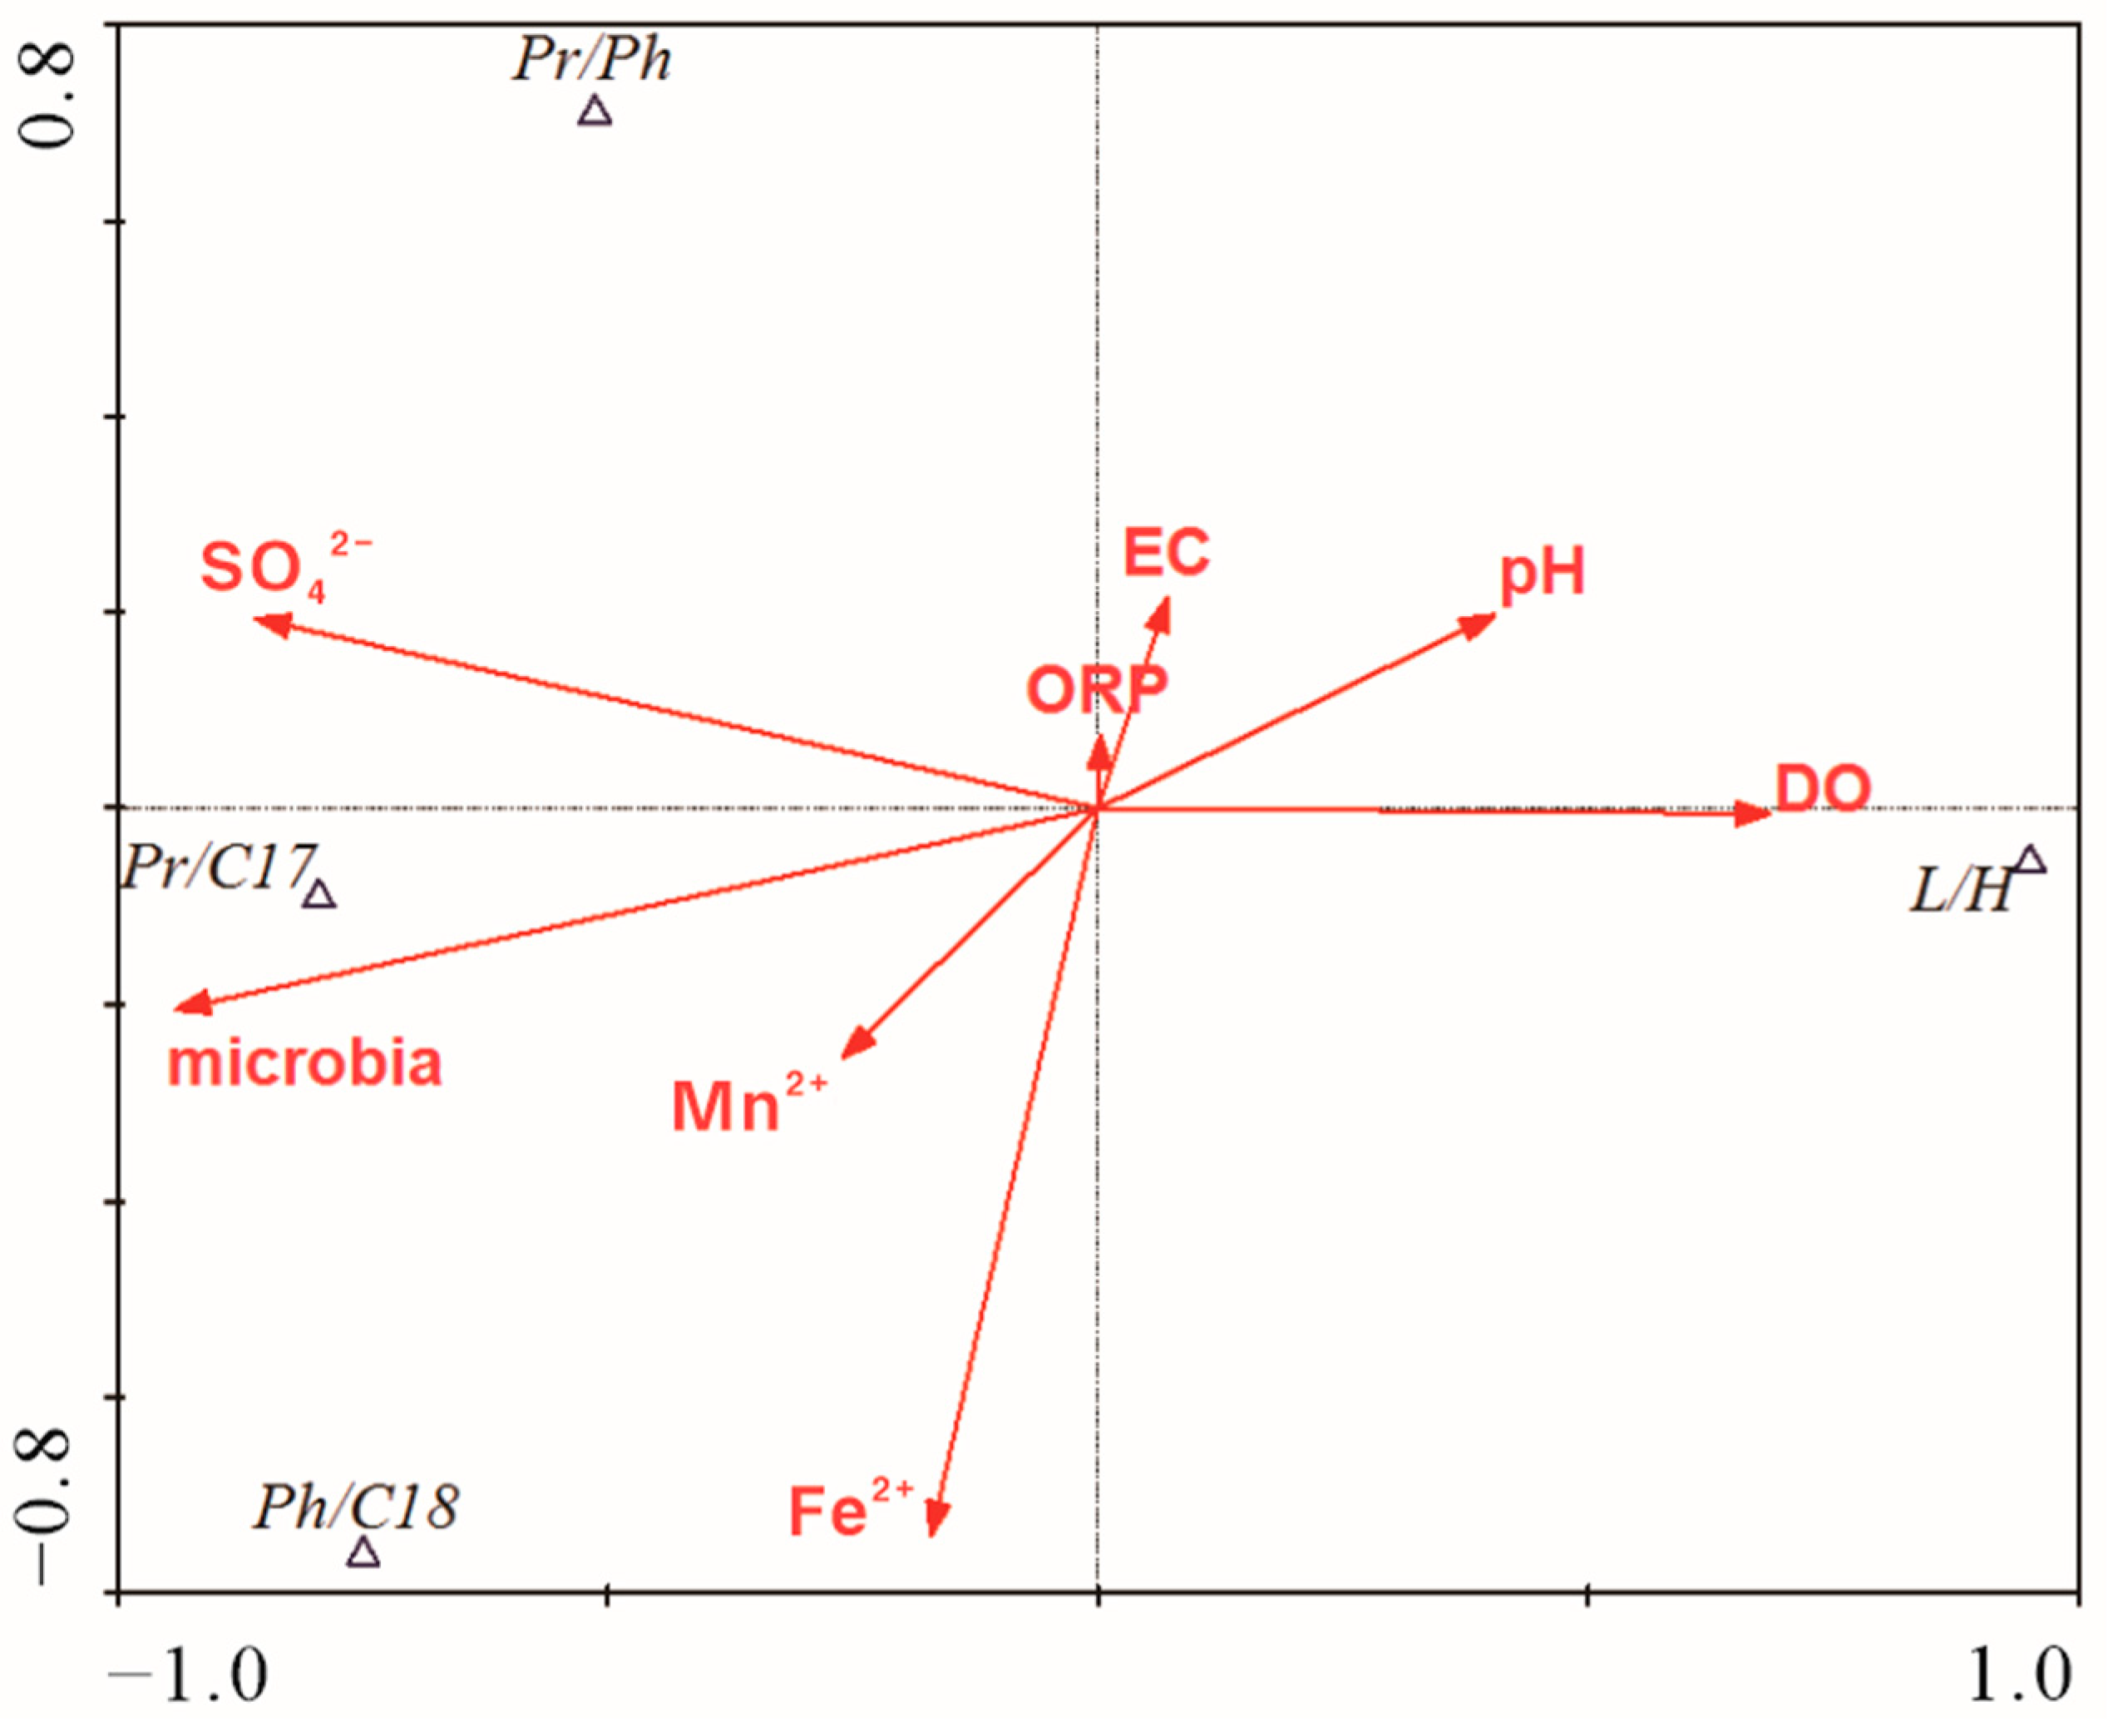
Molecular markers can be used to provide a comprehensive explanation of compound reaction processes that are strongly controlled by environmental chemicals. Therefore, these two types of parameters should have an intrinsic relationship that can be combined to interpret changeable environmental conditions. The relationships between molecular markers and chemical indices were examined using canonical correspondence analysis (CCA). The molecular indices considered were Pr/Ph, Pr/C17, Ph/C18, and L/H, while the chemical markers were dissolved oxygen (DO), electrical conductivity (EC), the oxidation-reduction potential (ORP), pH, SO42−, Fe2+, Mn2+, and the microbial population. A summary of statistics and a CCA ordination biplot are shown in Table 4 and Figure 8.
Table 4 shows that the correlation index between the molecular markers and chemical indices was high (0.962 and 0.916), demonstrating that these indicators are closely related and showing the high likelihood of their efficacy as environmental indicators.
Figure 8 clearly demonstrates that DO was positively related to Pr/C17 and Ph/C18 but negatively related to L/H, explaining the consumption of DO during the biodegradation of low-weight hydrocarbons such as C17 and C18, which increased the value of Pr/C17 and Ph/C18 while it decreased the value of L/H. For the same reason, the environment changed to reducing conditions, as proven by the lowered value of Pr/Ph. Furthermore, as biodegradation was accompanied by the growth and breeding of microbes, the microbial population rose dramatically. Fe2+, Mn2+, and SO42− are signals of reducing conditions, and their negative relationship with DO is clearly shown.

4. Conclusions

This article comprehensively explains the levels and sources of petroleum contamination in an oilfield and discusses the extent of biodegradation by coupling molecular markers, microbial indices (population of microbes, types of stains, diversity index of microbes), and chemical indices. Quantitative and qualitative detections made via GC-MS, as well as the deduced molecular markers (CPI, OEP, Pr/Ph, etc.), revealed that the petroleum contamination was mainly caused by the oil–water pit, and the contamination plume was strongly controlled by the groundwater flow and biodegradation process. S1 and Z1 were the closest monitoring wells to the oil–water pit and demonstrated the highest TPH concentrations, which were primarily dominated by ALH. Groundwater flow was a key factor in the transportation of petroleum pollution. The data from the monitoring wells in Section 1 (S1→Z1→Z7→Z16→Z9, along the direction of groundwater flow) showed that the pollution concentration of ALH gradually decreased but the UCM was enriched. Those conclusions agreed with the results of the PCA and CCA, which suggested that different well sections had different compositional patterns due to their location and unique redox conditions. CCA revealed that molecular alterations were accompanied by chemical changes in terms of oxygen consumption and the accumulation of bioproducts during the microbial degradation of hydrocarbons. The spatial and temporal features of biodegradation were proven by the Pr/C17, Ph/C18, and L/H ratios, acting as biomarkers based on the biodegradation-resistant dissimilarities of different compounds. More specifically, isoprenoids were more resistant to biodegradation than the low-weight hydrocarbons, and seasonal factors such as temperature and precipitation influenced this process in terms of microbial activity; thus, the increased Pr/C17 and Ph/C18 and decreased L/H values were indicators of biodegradation. According to the diversity analysis of microorganisms, the Shannon index and Simpson index both indicated that the microbial diversity is higher in summer than in winter, illustrating that the microbial degradation of pollutants was stronger during the wet season (summer) than in the dry season (winter); furthermore, during the wet season, due to rainfall infiltration, the groundwater pollution plume was more pronounced in the direction of groundwater flow.
Through this study, it can be observed that although groundwater petroleum pollution poses challenges such as diverse pollutant types, significant differences in properties, and difficulty in remediation, the organic components of petroleum pollution can serve as analytical markers for tracing pollution sources, tracking pollutant migration pathways, and assessing the degree of biodegradation. This can also serve as an important scientific basis for selecting differential treatment methods, such as using air sparging (AS) in volatile-substance-rich areas, permeable reactive barriers (PRB) in areas along the direction of groundwater flow, and biological degradation in areas with refractory UCM. Ultimately, this research provides a scientific basis for efficient and cost-effective groundwater petroleum pollution remediation schemes.

Author Contributions

Conceptualization, Y.Y.; methodology, M.Y.; software, X.S. and Y.L.; formal analysis, M.Y. and X.Y.; investigation, M.Y. and Y.L.; data curation, M.Y. and X.Y.; writing—original draft preparation, Y.Y. and M.Y.; writing—review and editing, M.Y. and X.D.; visualization, X.D. and X.S.; supervision, Y.Y. and M.Y. All authors have read and agreed to the published version of the manuscript.

Funding

This research was sponsored by the Guizhou Provincial Basic Research Program (Natural Science) (QKHJC-ZK(2022)-General 186); the National Natural Science Foundation of China (grant Nos. 41602275, 41977298, 42277189, 42172284); the High-Level Talent Introduction Program for the Guizhou Institute of Technology (2023GCC085); the Guizhou Provincial Key Technology R&D Program (QKHZC(2023)-General 143); the Provincial Higher Education Teaching Content and Curriculum System Reform Project of Guizhou Province (2023223); the Education and Teaching Reform Research Project of Guizhou Institute of Technology (XJJG-2022-22533); the Open Fund from the Key Lab of Eco-restoration of Regional Contaminated Environment (Shenyang University), Ministry of Education (KF-22-02); and the Provincial Key Disciplines of Guizhou Province-Geological Resources and Geological Engineering (ZDXK (2018)001).

Data Availability Statement

The original contributions presented in the study are included in the article; further inquiries can be directed to the corresponding author.

Conflicts of Interest

The authors declare no conflicts of interest.

References

  1. Apulu, O.G.; Potravny, I.M.; Sukhorukova, I.V. Methods of Justification and Selection of Technologies for Remediation of Oil-contaminated Land. Ecol. Ind. Russ. 2021, 25, 38–43. [Google Scholar] [CrossRef]
  2. Crivellari, A.; Bonvicini, S.; Tugnoli, A.; Cozzani, V. Key performance indicators for environmental contamination caused by offshore oil spills. Process Saf. Environ. 2021, 153, 60–74. [Google Scholar] [CrossRef]
  3. Behera, D.; Krishnakumar, S.; Anoop, A. Occurrence, distribution and sources of petroleum contamination in reef-associated sediments of the Gulf of Mannar, India. Mar. Pollut. Bull. 2023, 196, 115576. [Google Scholar] [CrossRef] [PubMed]
  4. Zhang, D.; Hu, Q.; Wang, B.; Wang, J.; Li, C.; You, P.; Zhou, R.; Zeng, W.; Liu, X.; Li, Q. Effects of single and combined contamination of total petroleum hydrocarbons and heavy metals on soil microecosystems: Insights into bacterial diversity, assembly, and ecological function. Chemosphere 2023, 345, 140288. [Google Scholar] [CrossRef]
  5. Gao, H.; Wu, M.; Liu, H.; Xu, Y.; Liu, Z. Effect of petroleum hydrocarbon pollution levels on the soil microecosystem and ecological function. Environ. Pollut. 2022, 293, 118511. [Google Scholar] [CrossRef] [PubMed]
  6. Yu, B.; Zhang, Y.; Zhou, Y.; Feng, X. BTEX in the environment: An update on sources, fate, distribution, pretreatment, analysis, and removal techniques. Chem. Eng. J. 2022, 435, 134825. [Google Scholar] [CrossRef]
  7. Verena, K.; Uta, P. Quantitative review summarizing the effects of oil pollution on subarctic and arctic marine invertebrates. Environ. Pollut. 2023, 319, 120960. [Google Scholar]
  8. Pehnec, G.; Jakovljević, I.; Godec, R.; Štrukil, Z.S.; Žero, S.; Huremović, J.; Dzepina, K. Carcinogenic organic content of particulate matter at urban locations with different pollution sources. Sci. Total Environ. 2020, 734, 139414. [Google Scholar] [CrossRef]
  9. Guo, W.; Zhang, S.; Wu, G. Quantitative oil spill risk from offshore fields in the Bohai Sea, China. Sci. Total Environ. 2019, 688, 494–504. [Google Scholar] [CrossRef]
  10. Qu, Z.; An, C.; Yue, R.; Bi, H.; Zhao, S. Assessment of the infiltration of water-in-oil emulsion into soil after spill incidents. Sci. Total Environ. 2023, 896, 165325. [Google Scholar] [CrossRef]
  11. Mansour, M.S.M.; Abdel-Shafy, H.I.; Ibrahim, A.M. Petroleum wastewater: Environmental protection, treatment, and safe reuse: An overview. J. Environ. Manag. 2024, 351, 119827. [Google Scholar] [CrossRef] [PubMed]
  12. Ji, X.; Tiraferri, A.; Zhang, X.; Liu, P.; Gan, Z.; Crittenden, J.C.; Ma, J.; Liu, B. Dissolved organic matter in complex shale gas wastewater analyzed with ESI FT-ICR MS: Typical characteristics and potential of biological treatment. J. Hazard. Mater. 2023, 447, 130823. [Google Scholar] [CrossRef] [PubMed]
  13. Haider, F.U.; Ejaz, M.; Cheema, S.A.; Khan, M.I.; Zhao, B.; Liqun, C.; Salim, M.A.; Naveed, M.; Khan, N.; Núñez-Delgado, A. Phytotoxicity of petroleum hydrocarbons: Sources, impacts and remediation strategies. Environ. Res. 2021, 197, 111031. [Google Scholar] [CrossRef] [PubMed]
  14. Kumari, S.; Das, S. Bacterial enzymatic degradation of recalcitrant organic pollutants: Catabolic pathways and genetic regulations. Environ. Sci. Pollut. Res. Int. 2023, 30, 79676–79705. [Google Scholar] [CrossRef] [PubMed]
  15. Xu, C.; Qaria, M.A.; Xu, Q.; Zhu, D. The role of microorganisms in petroleum degradation: Current development and prospects. Sci. Total Environ. 2023, 865, 161112. [Google Scholar]
  16. Padhye, L.P.; Srivastava, P.; Jasemizad, T.; Bolan, S.; Hou, D.; Shaheen, S.M.; Rinklebe, J.; O’Connor, D.; Lamb, D.; Wang, H. Contaminant containment for sustainable remediation of persistent contaminants in soil and groundwater. J. Hazard. Mater. 2023, 455, 131575. [Google Scholar] [CrossRef] [PubMed]
  17. Cao, S.; Zhan, G.; Wei, K.; Zhou, B.; Zhang, H.; Gao, T.; Zhang, L. Raman spectroscopic and microscopic monitoring of on-site and in-situ remediation dynamics in petroleum contaminated soil and groundwater. Water Res. 2023, 233, 119777. [Google Scholar] [CrossRef] [PubMed]
  18. Li, C.; Cui, C.; Zhang, J.; Shen, J.; He, B.; Long, Y.; Ye, J. Biodegradation of petroleum hydrocarbons based pollutants in contaminated soil by exogenous effective microorganisms and indigenous microbiome. Ecotox. Environ. Saf. 2023, 253, 114673. [Google Scholar] [CrossRef] [PubMed]
  19. Romantschuk, M.; Lahti-Leikas, K.; Kontro, M.; Galitskaya, P.; Talvenmäki, H.; Simpanen, S.; Allen, J.A.; Sinkkonen, A. Bioremediation of contaminated soil and groundwater by in situ biostimulation. Front. Microbiol. 2023, 14, 1258148. [Google Scholar] [CrossRef]
  20. Cai, D.; Wang, Y.; Zhao, X.; Zhang, C.; Dang, Q.; Xi, B. Regulating the biodegradation of petroleum hydrocarbons with different carbon chain structures by composting systems. Sci. Total Environ. 2023, 903, 166552. [Google Scholar] [CrossRef]
  21. Wang, S.; Wang, D.; Yu, Z.; Dong, X.; Liu, S.; Cui, H.; Sun, B. Advances in research on petroleum biodegradability in soil. Environ. Sci.-Process. Imp. 2021, 23, 9–27. [Google Scholar] [CrossRef]
  22. Hoang, S.A.; Sarkar, B.; Seshadri, B.; Lamb, D.; Wijesekara, H.; Vithanage, M.; Liyanage, C.; Kolivabandara, P.A.; Rinklebe, J.; Lam, S.S. Mitigation of petroleum-hydrocarbon-contaminated hazardous soils using organic amendments: A review. J. Hazard. Mater. 2021, 416, 125702. [Google Scholar] [CrossRef]
  23. Mishra, P.; Kiran, N.S.; Romanholo Ferreira, L.F.; Yadav, K.K.; Mulla, S.I. New insights into the bioremediation of petroleum contaminants: A systematic review. Chemosphere 2023, 326, 138391. [Google Scholar] [CrossRef]
  24. Wang, H.; Liu, D.; Lv, Y.; Wang, W.; Wu, Q.; Huang, L.; Zhu, L. Ecological and health risk assessments of polycyclic aromatic hydrocarbons (PAHs) in soils around a petroleum refining plant in China: A quantitative method based on the improved hybrid model. J. Hazard. Mater. 2024, 461, 132476. [Google Scholar] [CrossRef] [PubMed]
  25. Bhuyan, B.; Kotoky, R.; Pandey, P. Impacts of rhizoremediation and biostimulation on soil microbial community, for enhanced degradation of petroleum hydrocarbons in crude oil-contaminated agricultural soils. Environ. Sci. Pollut. Res. 2023, 30, 94649–94668. [Google Scholar] [CrossRef]
  26. Wu, B.; Guo, S.; Zhang, L.; Wang, S.; Liu, D.; Cheng, Z.; Si, N. Spatial variation of residual total petroleum hydrocarbons and ecological risk in oilfield soils. Chemosphere 2022, 291, 132916. [Google Scholar] [CrossRef] [PubMed]
  27. Samuel, O.; Othman, M.H.D.; Kamaludin, R.; Dzinun, H.; Imtiaz, A.; Li, T.; El-badawy, T.; Khan, A.U.; Puteh, M.H.; Yuliwati, E. Photocatalytic degradation of recalcitrant aromatic hydrocarbon compounds in oilfield-produced water: A critical review. J. Clean. Prod. 2023, 415, 137567. [Google Scholar] [CrossRef]
  28. Houlahan, S.; Errington, I.; Hose, G.C.; King, C.K.; George, S.C. Anthropogenic petroleum signatures and biodegradation in subantarctic Macquarie Island soils. Chemosphere 2023, 325, 138395. [Google Scholar] [CrossRef]
  29. Pehr, K.; Baczynski, A.A.; Bekker, A.; Hoffmann, A.; Freeman, K.H.; Poulton, S.W.; Love, G.D. Compound-specific carbon isotope measurements of individual lipid biomarkers from immature Ediacaran rocks of Baltica. Org. Geochem. 2023, 182, 104641. [Google Scholar] [CrossRef]
  30. Shen, X.; Zhou, M.; Zhu, X.; Zhang, J.; Xu, J.; Jiang, W. Chemical composition and antioxidant activity of petroleum ether fraction of Rosmarinus officinalis. Heliyon 2023, 9, e21316. [Google Scholar] [CrossRef]
  31. Monaghan, J.; Richards, L.C.; Vandergrift, G.W.; Hounjet, L.J.; Stoyanov, S.R.; Gill, C.G.; Krogh, E.T. Direct mass spectrometric analysis of naphthenic acids and polycyclic aromatic hydrocarbons in waters impacted by diluted bitumen and conventional crude oil. Sci. Total Environ. 2021, 765, 144206. [Google Scholar] [CrossRef] [PubMed]
  32. de Oliveira, O.M.; Queiroz, A.F.D.S.; Cerqueira, J.R.; Soares, S.A.; Garcia, K.S.; Pavani Filho, A.; Rosa, M.D.L.D.S.; Suzart, C.M.; Pinheiro, L.D.L.; Moreira, Í.T. Environmental disaster in the northeast coast of Brazil: Forensic geochemistry in the identification of the source of the oily material. Mar. Pollut. Bull. 2020, 160, 111597. [Google Scholar] [CrossRef] [PubMed]
  33. Spurgeon, D.J.; Wilkinson, H.; Civil, W.; Hutt, L.; Armenise, E.; Kieboom, N.; Sims, K.; Besien, T. Worst-case ranking of organic chemicals detected in groundwaters and surface waters in England. Sci. Total Environ. 2022, 835, 155101. [Google Scholar] [CrossRef] [PubMed]
  34. Stern, G.; Macdonald, C.R.; Carvalho, P.C.; Wolfe, T. Baseline levels and characterization of hydrocarbons in surface marine sediments along the transportation corridor in Hudson Bay: A multivariate analysis of n-alkanes, PAHs and biomarkers. Sci. Total Environ. 2023, 855, 158718. [Google Scholar] [CrossRef] [PubMed]
  35. Li, Y.; Fang, Y.; Zhou, Q.; Xu, X.; Liu, J.; Zhou, G.; Wang, J. Geochemical insights into contribution of petroleum hydrocarbons to the formation of hydrates in the Taixinan Basin, the South China Sea. Geosci. Front. 2021, 12, 100974. [Google Scholar] [CrossRef]
  36. Hu, X.; Wang, X.; Zhao, S.; Cao, L.; Pan, Y.; Li, F.; Li, F.; Lu, J.; Li, Y.; Song, G. Uncovering the dynamic evolution of microbes and n-alkanes: Insights from the Kuroshio Extension in the Northwest Pacific Ocean. Sci. Total Environ. 2023, 875, 162418. [Google Scholar] [CrossRef]
  37. Vivian, U.O.; Leo, C.O.; Achugasim, O. Aliphatic Hydrocarbon Fingerprints of Some Crude Oil Polluted Soils from Niger Delta, Nigeria. Chem. Eng. Sci. 2018, 5, 1–5. [Google Scholar]
  38. Cai, F.; Wang, R.; Cai, J.; Huang, Q.; Huang, Z.; Xu, Y.; Yang, Q. Investigation of the maturation effects on biomarker distributions in bituminous coals. Org. Geochem. 2022, 173, 104496. [Google Scholar] [CrossRef]
  39. Song, D.; Chen, Y.; Wang, T.; Li, M.; Li, P. Organic geochemical compositions of Mesoproterozoic source rocks in the Yanliao Rift, Northern China. Mar Pet. Geol. 2021, 123, 104740. [Google Scholar] [CrossRef]
  40. Mehta, B.; Ankit, Y.; Basu, S.; Anoop, A. Characterization of sedimentary organic matter and depositional processes in the Mandovi estuary, western India: An integrated lipid biomarker, sedimentological and stable isotope approach. Appl. Geochem. 2021, 131, 105041. [Google Scholar]
  41. Shi, H.; Gao, W.; Zheng, Y.; Yang, L.; Han, B.; Zhang, Y.; Zheng, L. Distribution and abundance of oil-degrading bacteria in seawater of the Yellow Sea and Bohai Sea, China. Sci. Total Environ. 2023, 902, 166038. [Google Scholar] [CrossRef] [PubMed]
  42. Liu, X.; Liu, G.; Jiang, W.; Song, Z.; Wang, N. Organic geochemistry and petrology of source rocks from the Banqiao Sag, Bohai Bay Basin, China: Implications for petroleum exploration. Petrol. Sci. 2022, 19, 1505–1515. [Google Scholar] [CrossRef]
  43. Asemani, M.; Rabbani, A.R.; Sarafdokht, H. Origin, geochemical characteristics and filling pathways in the Shadegan oil field, Dezful Embayment, SW Iran. J. Afr. Earth Sci. 2021, 174, 104047. [Google Scholar] [CrossRef]
  44. Liu, Q.; Xia, C.; Wang, L.; Tang, J. Fingerprint analysis reveals sources of petroleum hydrocarbons in soils of different geographical oilfields of China and its ecological assessment. Sci. Rep. 2022, 12, 4808. [Google Scholar] [CrossRef]
  45. Kim, S.; Woo, H.; An, S.; Chung, J.; Lee, S.; Lee, S. What determines the efficacy of landfarming for petroleum-contaminated soils: Significance of contaminant characteristics. Chemosphere 2022, 290, 133392. [Google Scholar] [CrossRef] [PubMed]
  46. Varjani, S. Microbial degradation of petroleum hydrocarbons. Bioresour. Technol. 2017, 223, 277–286. [Google Scholar] [CrossRef]
  47. Laczi, K.; Kis, Á.E.; Szilágyi, Á.; Bounedjoum, N.; Bodor, A.; Vincze, G.; Kovács, T.; Rákhely, G.; Perei, K. New Frontiers of Anaerobic Hydrocarbon Biodegradation in the Multi-Omics Era. Front. Microbiol. 2020, 11, 590049. [Google Scholar] [CrossRef]
  48. Zhang, X.; Li, X.; Chen, X.; Sun, Y.; Zhao, L.; Han, T.; Tian, L.; Weng, L.; Li, Y. A nitrogen supplement to regulate the degradation of petroleum hydrocarbons in soil microbial electrochemical remediation. Chem. Eng. J. 2021, 426, 131202. [Google Scholar] [CrossRef]
  49. Liu, Y.; He, Y.; Liu, Y.; Tao, S.; Liu, W. Assessing spatiotemporal sources of biogenic and anthropogenic sedimentary organic matter from the mainstream Haihe River, China: Using n-alkanes as indicators. Sci. Total. Environ. 2022, 834, 155382. [Google Scholar] [CrossRef]
  50. Fragkou, E.; Antoniou, E.; Daliakopoulos, I.N.; Manios, T.; Theodorakopoulou, M.; Kalogerakis, N. In Situ Aerobic Bioremediation of Sediments Polluted with Petroleum Hydrocarbons: A Critical Review. J. Mar. Sci. Eng. 2021, 9, 1003. [Google Scholar] [CrossRef]
  51. Wang, J.; Zhang, Y.; Ding, Y.; Song, H.; Liu, T.; Zhang, Y.; Xu, W.; Shi, Y. Comparing the indigenous microorganism system in typical petroleum-contaminated groundwater. Chemosphere 2023, 311, 137173. [Google Scholar] [CrossRef] [PubMed]
  52. GB/T 14848-2017; Quality Standard for Ground Water. General Administration of Quality Supervision, Inspection and Quarantine of the People’s Republic of China, Standardization Administration of China. Standards Press of China: Beijing, China, 2017.
  53. Sahoo, B.M.; Kumar, R.B.V.V.; Banik, B.K.; Borah, P. Polyaromatic Hydrocarbons (PAHs): Structures, Synthesis and their Biological Profile. Curr. Org. Synth. 2020, 17, 625–640. [Google Scholar] [CrossRef] [PubMed]
  54. Huang, L.; Ye, J.; Jiang, K.; Wang, Y.; Li, Y. Oil contamination drives the transformation of soil microbial communities: Co-occurrence pattern, metabolic enzymes and culturable hydrocarbon-degrading bacteria. Ecotox. Environ. Saf. 2021, 225, 112740. [Google Scholar] [CrossRef] [PubMed]
  55. Wang, X.; Liu, B.; Li, X.; Lin, W.; Li, D.; Dong, H.; Lei, W. Biosurfactants produced by novel facultative-halophilic Bacillus sp. XT-2 with biodegradation of long chain n-alkane and the application for enhancing waxy oil recovery. Energy 2022, 240, 122802. [Google Scholar] [CrossRef]
  56. Gautom, S.; Bora, B.; Talukdar, P.; Ahmed, A.; Sawarkar, A.N.; Saikia, R.; Geed, S.R.; Verma, J.S. Optimized approach for naphthalene wastewater biodegradation by Enterobacter ludwigii NS12 isolated from petroleum industry sludge: Bioreactor study and kinetic investigation. J. Water Process Eng. 2024, 62, 105359. [Google Scholar] [CrossRef]
  57. Mou, B.; Gong, G.; Wu, S. Biodegradation mechanisms of polycyclic aromatic hydrocarbons: Combination of instrumental analysis and theoretical calculation. Chemosphere 2023, 341, 140017. [Google Scholar] [CrossRef] [PubMed]
  58. Aziz, Z.S.; Jazza, S.H.; Dageem, H.N.; Banoon, S.R.; Balboul, B.A.; Abdelzaher, M.A. Bacterial biodegradation of oil-contaminated soil for pollutant abatement contributing to achieve sustainable development goals: A comprehensive review. Results Eng. 2024, 22, 102083. [Google Scholar] [CrossRef]
  59. Mayans, B.; Antón-Herrero, R.; García-Delgado, C.; Delgado-Moreno, L.; Guirado, M.; Pérez-Esteban, J.; Escolástico, C.; Eymar, E. Bioremediation of petroleum hydrocarbons polluted soil by spent mushroom substrates: Microbiological structure and functionality. J. Hazard. Mater. 2024, 473, 134650. [Google Scholar] [CrossRef]
Figure 1. Location of sampling wells and a typical hydrogeological profile (A–A1) of the contaminated oil field.
Water 16 01773 g001
Figure 2. Average TPH contours and the CPI and OEP values of groundwater at each sampling well.
Water 16 01773 g002
Figure 3. Scatter plot of hydrocarbon concentrations and molecular markers from PCA analysis.
Water 16 01773 g003
Figure 4. Observation of the morphologies of different strains.
Water 16 01773 g004
Figure 5. Seasonal comparison of microbial diversity indices in groundwater along the flow direction at the site.
Water 16 01773 g005
Figure 6. The distribution of hydrocarbons and molecular markers in different sections.
Water 16 01773 g006aWater 16 01773 g006b
Figure 7. Distribution and variation characteristics of petroleum contaminants in groundwater at Z1.
Water 16 01773 g007
Figure 8. Relation between molecular markers and chemical indices from CCA analysis.
Water 16 01773 g008
Table 1. Concentrations of TPH and different types of compounds at the sampling wells.
StationS1Z1Z6Z7Z8Z9Z10Z11Z16Z19Z20Z21Z22
TPHJanuary5.125.084.774.694.314.134.174.154.694.744.124.354.37
March6.256.014.834.794.624.584.874.684.564.384.024.134.41
April7.096.245.715.585.415.375.275.594.745.525.935.335.32
June7.326.414.284.214.134.024.834.294.454.164.184.154.13
July5.395.124.414.344.153.933.953.683.913.823.953.953.82
ALHsJanuary3.612.822.741.841.811.822.582.442.532.851.542.482.06
March4.794.253.612.923.112.192.532.163.162.922.752.282.58
April4.273.773.683.653.262.382.752.922.512.632.683.432.77
June3.312.642.152.282.011.382.451.642.082.511.451.611.58
July2.992.093.082.522.021.591.261.511.932.251.582.161.52
ARHsJanuary0.211.210.730.960.660.530.720.710.720.260.320.580.84
March0.820.910.610.890.710.490.510.860.630.510.720.630.73
April1.130.560.820.670.620.580.510.910.580.450.330.230.29
June2.710.680.540.520.810.990.390.280.310.321.191.110.97
July0.970.590.310.320.410.590.780.470.350.180.360.130.30
UCMJanuary0.981.030.690.340.380.850.530.581.010.960.951.031.31
March0.600.660.550.370.421.651.511.650.280.390.951.210.99
April1.612.151.161.211.512.131.881.551.511.991.961.290.57
June1.281.251.561.381.221.631.712.231.380.841.621.431.33
July1.341.110.991.521.611.721.881.661.561.221.911.381.77
Table 2. Average concentrations of petroleum hydrocarbons, inorganic parameters, and molecular marker values.
SitesS1Z1Z6Z7Z8Z9Z10Z11Z16Z19Z20Z21Z22
Markers
CPI0.970.940.870.730.900.530.580.920.930.830.590.610.74
OEP1.301.080.960.940.850.700.630.690.920.780.820.611.06
L/H4.433.012.322.262.631.201.211.591.321.091.081.201.28
Pr/Ph1.071.210.810.870.891.111.320.691.060.810.680.750.58
Pr/C170.530.650.680.670.691.411.201.361.121.391.281.160.95
Ph/C180.410.460.420.480.431.130.851.050.520.781.032.080.56
DO3.963.213.682.432.362.651.933.562.52.511.892.692.85
EC97316322427130813321668469120012821489168210411832
ORP−14.62−120.36−34.31−94.65−86.21−83.414.09−24.29−115.68−33.41−93.98−83.96−106.78
Fe3+1.667.2913.9712.8716.2218.337.527.037.032.596.8735.6611.39
Mn2+1.91.261.521.821.923.421.891.482.311.881.283.73.72
SO42−1.584.733.151.582.6211.0315.757.8812.615.757.889.456.3
Table 3. Gene sequence analysis of microbes.
Microbial TypeMicrobial NumberBacterium with Related
Bacterial Sequence
Accession
Number
Similarity (%)
BacteriaSX1Bacillus amyloliquefaciensNC_009725.1100
SX2Bacillus subtilisAEHM01000001.199
SX3Bacillus subtilisNC_014976.196
ActinomycetesSF1Sphingomonas sp.AJ71739298
SF2Alpha proteobacteriumAF23599499
SF3Sphingomonas sp.AY42969396
FungiSZ1Penicillium italicumAF54809198
SZ2Aspergillus versicolorAB00841199
Table 4. Summary of the statistical results of the CCA.
Axes1234
Eigenvalues0.1420.0460.0060.020
Correlations between two type parameters0.9620.9160.9570.000
Cumulative PV of indices66.087.290.399.7
Cumulative PV of markers73.196.7100.00.0
Sum of all eigenvalues0.214
Sum of all canonical eigenvalues0.194
Disclaimer/Publisher’s Note: The statements, opinions and data contained in all publications are solely those of the individual author(s) and contributor(s) and not of MDPI and/or the editor(s). MDPI and/or the editor(s) disclaim responsibility for any injury to people or property resulting from any ideas, methods, instructions or products referred to in the content.