1. Introduction
Floods are a widely spread hydrological hazard at the global level, with significant economic and social impacts on local communities. It is very important to analyze and map flood risks with a view to sustainable territorial planning and the appropriate development of infrastructure. Flood risk assessment has become increasingly vital due to the growing frequency and intensity of flooding events driven by climate change, urbanization, and other environmental factors.
Such an analysis may have several types of approaches. The first of them uses qualitative analyses based on expert judgment. Another approach includes quantitative methods based on the numerical relationship between the affected elements and the hazard itself.
The present study is a combination of the two approaches and can, thus, be considered a semi-quantitative analysis. The results are partly subjective and largely based on expert knowledge [
1]. However, they are used because they are simple analyses, capable of integrating large sets of data [
2,
3,
4] and have proven to be effective for regional studies [
5,
6,
7,
8]. In Romania, the subject of flood risk has been addressed in various studies and from different perspectives [
9,
10,
11,
12].
The main purpose of this work is to map and assess the flood risk in the Gilort River floodplain, between the Bălcești and Bolbocești towns, Romania (the study area lacks methodological approaches to map and assess the flood risk), using multi-criteria spatial analysis. It aims to integrate a comprehensive series of factors, both natural and social, in order to offer an accurate description of the study area. This approach is a useful method to incorporate large spatial data sets and generate an efficient risk estimation.
There are many works worldwide on multi-criteria analysis [
13,
14,
15]. It was first presented by van Herwijnen [
16], and there were a series of works in which the multi-criteria analysis was applied to identify the flood risk [
1,
17,
18,
19,
20,
21]. There are recent studies on this topic [
22,
23,
24] which use GIS and remote sensing techniques to map and assess flood risk. This study follows a similar methodology, aiming to include new factors, both natural (such as bank erosion and riparian vegetation distribution) and social (vulnerable social groups, housing density), and also aims to use official data for flood band distribution.
Floods represent a hazard spread globally, with different magnitudes and impacts depending on the natural and anthropic conditions in which it occurs. It is essential to understand the particularities of each region in order to assess the flood risk. The importance of this study lies in understanding the particularities of the study area in order to assess the flood risk. Therefore, identifying flood risk in an area can be seen as a tool for prevention and control of the local community’s integrity. It is important to have such approaches and studies at the local level, covering limited areas and taking into account the specific characteristics of the studied area. The present study aims to present a methodology for identifying flood risk, starting from the risk calculation formula and considering both natural and anthropogenic factors. The structure of this paper begins with a description of the study area and the detailed working methodology. Subsequently, it focuses on presenting and analyzing the results of each point of interest: the physical vulnerability of the area to floods, the social vulnerability of the area to floods, the total vulnerability of the area, and the flood risk as the final result.
There are a series of challenges and future directions regarding flood risk research, such as adapting to the unpredictable nature of climate change, which remains a significant challenge, necessitating flexible and dynamic flood management strategies, integrating data from various sources, and ensuring that its accessibility and usability for stakeholders is critical for effective decision making and ensuring that flood risk management strategies address the needs of all population segments, particularly marginalized and vulnerable groups, is essential for sustainable resilience. This paper aims only to identify the spatial distribution of flood risk. Risk management will be a part of future studies in the area.
Study Area
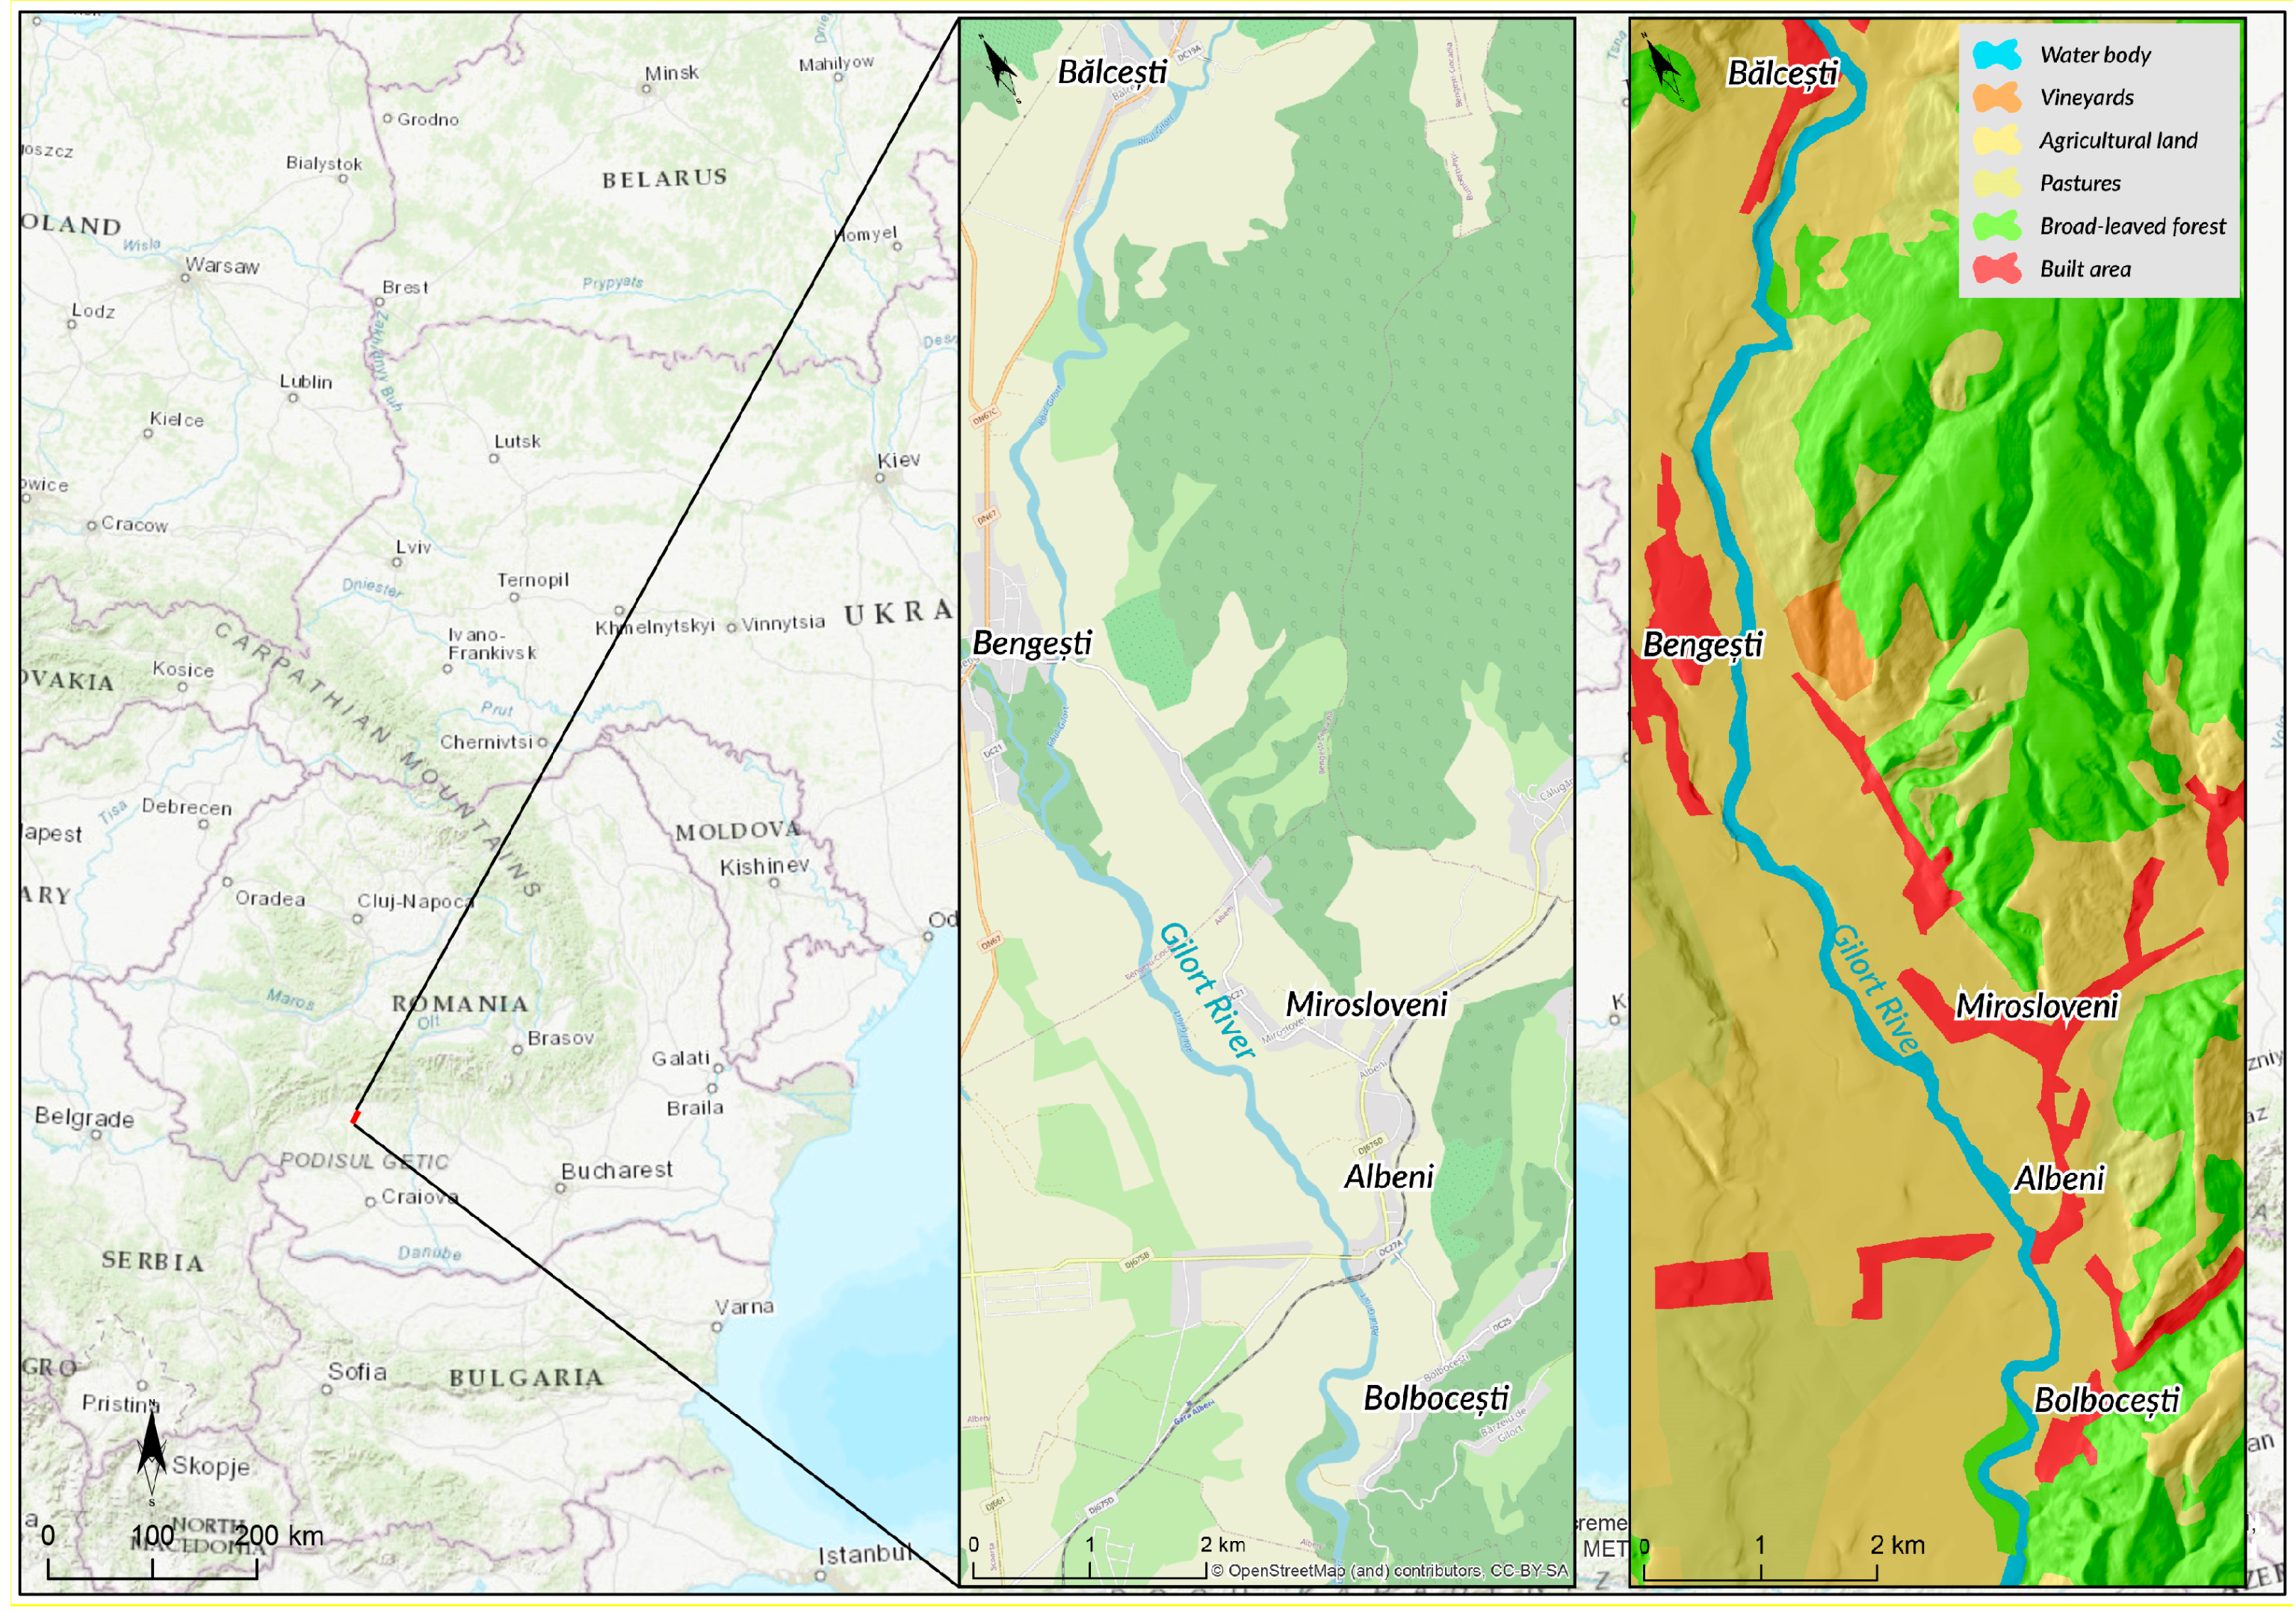
The study area is located in southwestern Romania (
Figure 1), in the Gorj Subcarpathians unit. The length of the Gilort River in this area, measured on the thalweg, is approximately 5 km.
The altitude range is between 227 and 503 m. Lower altitudes characterize depressive areas and valley corridors, and the higher altitudes characterize hill areas, with the Gorj Subcarpathians being a highly fragmented relief unit. The slope of the terrain varies between 0° (quasi-horizontal surfaces, located mainly in the river floodplain, respectively, or on interfluves) and 45° (specific to the slopes). The geological composition is exclusively composed of sedimentary rocks with different characteristics. There are sand, gravel, and loessoid deposits (alluvial deposits), as well as marl, clay, gypsum, salt, and quartz conglomerates [
25,
26]. From a pedological point of view [
27], there are two distinct groups of soils: specific floodplain soils (alluvial soils) and soils specific to the topography and geographical position (especially brown argillaceous soils, brown eumesobasic soils, and rendzine).
The process of gleization on these soils is null or very small (the soil map of Romania, 1973). The average flow of the Gilort River in the study area is about 10 m3/s.
Regarding the human component, the localities located in the study area have a total population of less than 3000 inhabitants (the maximum value recorded in Bengești—2723 inhabitants). The age groups of interest for the analysis are those under 14 and those over 65 years old. The highest population values for these categories are also recorded in the town of Bengești (595 inhabitants over 65 years and 388 inhabitants under 14 years).
The Gilort River is a Carpathian type river, with a sub-South Carpathian subtype, with pluvio-nival water supply, with maximum flows in the months of May–June. These characteristics are variable, depending on the arrangement of the Carpathian chain, the general movement of air masses, the specific characteristics of the relief units crossed, but also the specific discharge regime for the tributary rivers. In this case, the Carpathian chain plays a significant role in the general movement of air masses and the precipitation regime in the study area. It has a transversal arrangement, in a general west–east direction, imposing a role as an orographic barrier in the path of southern air masses (with a general south–north movement direction), but also in the path of western air masses, which are able to penetrate from the Transylvanian Hill Depression only through wide valley corridors (the Jiu Valley corridor in this case).
To facilitate data analysis, data were transposed into a graphic format (
Figure 2). Based on this graph, we observed a flow regime in accordance with the river typology and the physico-geographical characteristics of the area. The flows generally presented values below 10 m
3/s; the maximum values slightly exceeded 25 m
3/s and were recorded in the months of April–May in accordance with the melting of snow from the mountain peaks. There were also two floods recorded in the reference period, one on 11 June 1970, with a flow rate of 78.1 m
3/s, and the second flood was recorded on 15 August 1969, with a flow rate of 104 m
3/s, representing the highest recorded value of liquid flow for the analyzed period.
Recent data were obtained for the period 2006–2017, measured at the Târgu Cărbunești hydrological station, and the measurement was digital. The graphic representation of the data is shown in
Figure 3.
In this time interval (2006–2017), the situation is different from the previous one. A clear typology of the flow regime can no longer be observed, with constant values during the year and maximum values in the months of April–June; much higher values of the flows are identified in each month of the year (values exceeding 50 m3/s), recorded as flash-flood events. However, it can be observed that the classic pattern of the Carpathian rivers is followed to some extent, with most of the maximum values (peaks) being recorded in the spring months and the beginning of summer, with an extension of the interval from March to the end of June. Also, the appearance of a new interval of high values, similar to that of spring, this time in the period October–December, is remarkable. This can be correlated with global climate change. By increasing the average annual and monthly temperatures, the precipitation in the months of October–December is predominantly in liquid form, and this aspect determines the immediate feeding of the river.
Compared to the interval 1965–1970, in the interval 2006–2017, significantly more flood episodes were recorded, among which the following are mentioned: 24 March 2007—81.81 m3/s, 4 April 2013—145.4 m3/s, 19 April 2014—75.59 m3/s, reactivated on 25 April 2014—78.31 m3/s, 6 May 2017–83.82 m3/s, 15 May 2014—93.82 m3/s, 29 May 2012—91.9 m3/s, 15 June 2016—117.52 m3/s, 29 July 2014—173.88 m3/s, 23 October 2007—158.48 m3/s, and 19 November 2007—98.49 m3/s. It can be observed that both the frequency of flood episodes and their intensity increased compared to the values identified in the previous interval.
2. Materials and Methods
This work is based on multi-criterial analysis, which includes a number of indicators relevant to determine the flood risk. The general risk calculation formula is RISK = HAZARD × VULNERABILITY [
1], and this formula was used in the present approach; so, for the accuracy of the results, the two elements must be calculated and analyzed individually. For this type of hazard (flooding with a recurrence period of 50 years), the following data sets were used: the topographic map, scale 1:25,000 (1982) for extracting the level curves, formulating the digital elevation model (DEM, re-interpolated to 5 m) and slope, Romania’s geological map 1:200,000 (1968), Romania’s soil map 1:200,000 (1973) [
26,
27], statistical data sets obtained from the National Institute of Statistics, the spatial distribution of towns from the National Agency of Cadastre and Real Estate Advertising, and the flood band of the Gilort River obtained from the Jiu Water Basin Administration.
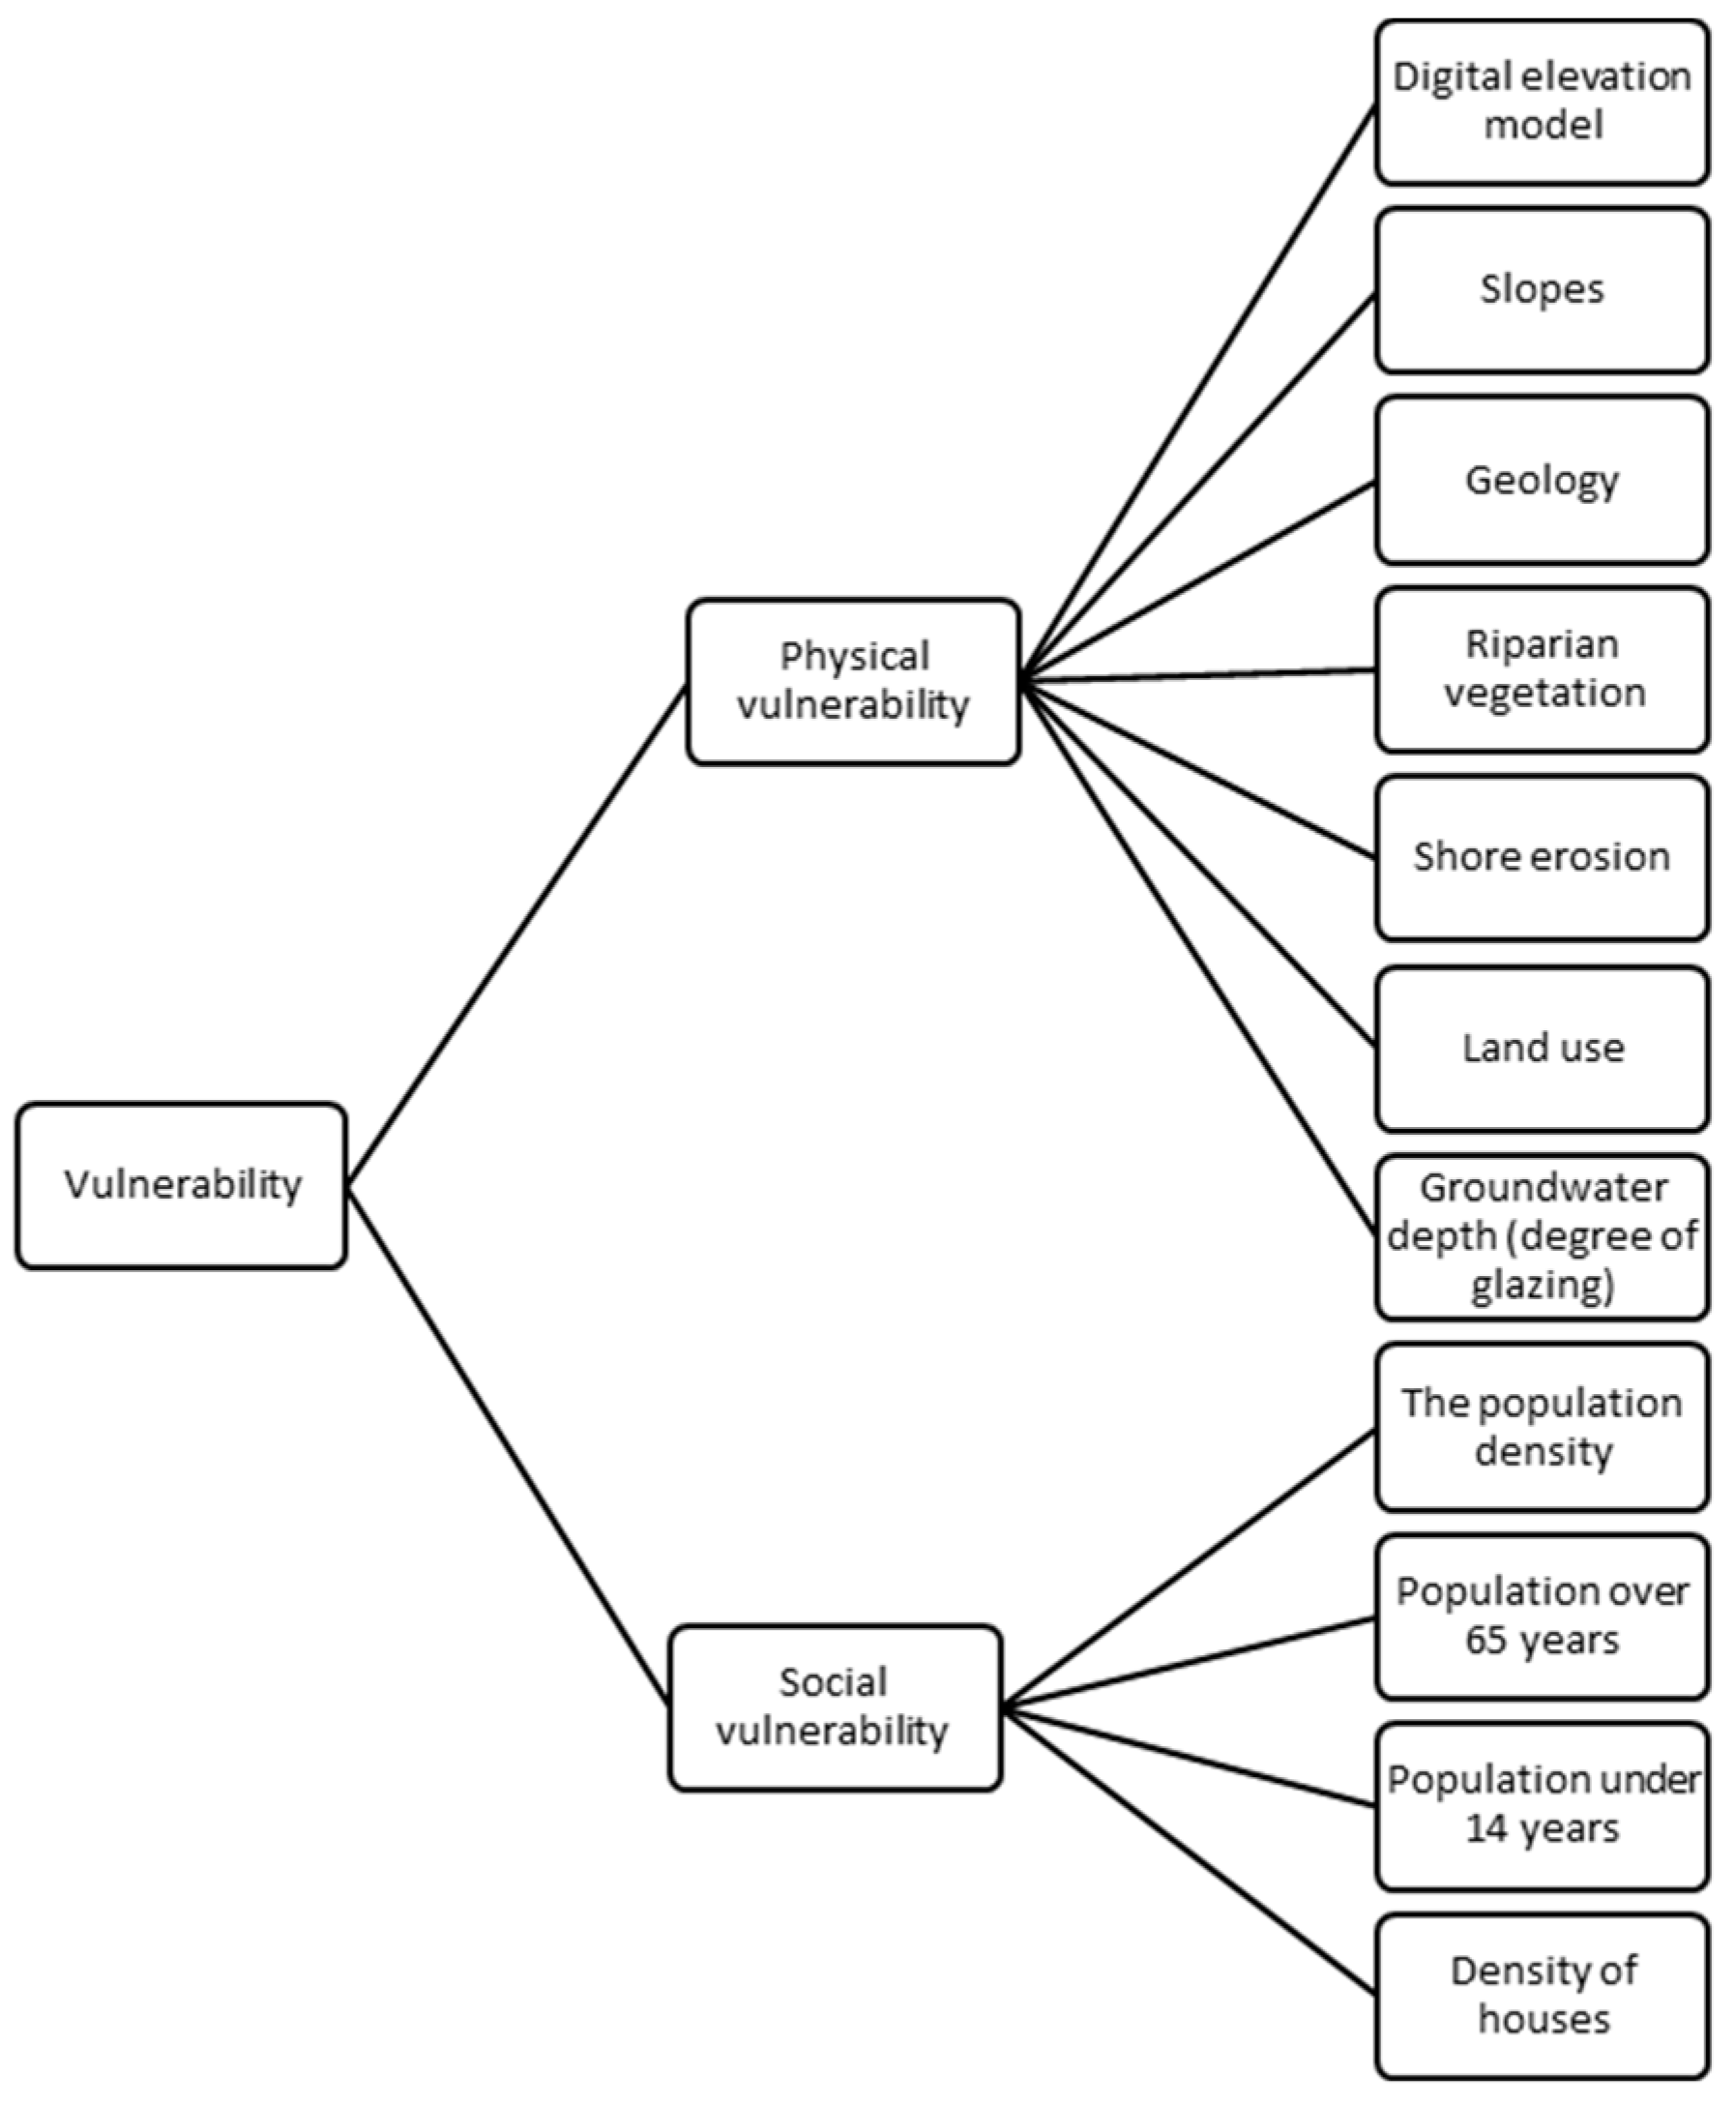
The vulnerability of the area to this type of hazard must be treated in a dual perspective: the physical vulnerability of the area (the way in which the shape of the relief and the natural elements are affected) and the social vulnerability (the damage to the population and socio-economic activities). In order to summarize the concept of vulnerability, the following schema (
Scheme 1) was achieved.
The contours extracted from the Romanian topographic map (1:25,000), re-interpolated at 5 m, were used to formulate the digital elevation model. The lower the altitude, the greater the vulnerability of the terrain as the possibility of flooding is higher at lower altitudes. The digital elevation model was used to calculate the slope gradient. The lower the slope (measured in degrees), the lower the flash flood movement speed, which meant that the water stagnated for a long period of time, increasing the vulnerability of the area. Geological elements are important in terms of the degree of compaction of the rock, where the greater the porosity of the rock, the faster water can flow into it, leading to a decrease in the vulnerability of the territory. The riparian vegetation patches present natural barriers to the propagation of the flood wave. Bank erosion, or the Bank Erosion Hazard Index (BEHI), is an indicator that provides information on the bank’s potential for erosion according to specific morphometric and geological characteristics. The Bank Erosion Hazard Index (BEHI) was assessed in the field, following the methodology proposed by Rosgen [
28]. This approach advocates for an empirical method within a predictive model framework, synthesizing individual bank erosion processes. This indicator was considered necessary because the higher the BEHI, the more the banks are at risk of “breaking” in the event of a flash flood. This creates the possibility of the flood spreading radially. This indicator has been calculated based on measurements in the field. Land use, although essentially an indicator created by man-made intervention, is treated as a physical element. This indicator shows maximum vulnerability within the perimeter of built spaces. The degree of gleization can be taken into account in conjunction with the depth at which the groundwater is found. Thus, the higher the degree of gleization, the soil saturation level is higher and, therefore, decreases the soil retention capacity, increasing the vulnerability of the terrain.
Social vulnerability refers to the population of the affected area, expressed in terms of population density. Social vulnerability increases in proportion to population density values. Populations over 65 years and under 14 years, respectively, are the most vulnerable social groups due to age, health problems, reduced mobility (over 65 years), or an inability to raise awareness of the danger (under 14 years). The density of houses can be seen in the light of the potential material damage that can occur as a result of hazard occurrence. A series of data, such as categories of professions, the level of education, damage to infrastructure in general, and the number of people with disabilities, could have been taken into account, but the data were not available at the moment of the study, which comprises one of the limitations of this paper.
For input data, which were both text and numeric, values were required to be assigned and normalized. The attribution of values was made on the basis of the impact the indicator had on the analysis (cost or benefit), and the normalization of data was conducted using the following formula:
Given that the indicators do not have an equal impact on vulnerability of any type, weighting was required. This was conducted using the ILWIS 3.4 software with the Spatial Multi-Criteria Analysis tool. Weighting was performed with pairwise type, where the indicators were compared in pairs based on their importance and impact. These are as follows:
Physical vulnerability: elevation 0.33, slopes 0.22, bank erosion 0.05, land use 0.19, geology 0.04, riparian vegetation 0.13, and soil 0.04
Social vulnerability: population density 0.32, population under 14 years 0.22, population over 65 years 0.38, and density of houses 0.08.
After the two indicators were calculated, they were combined using equal weights to achieve the total vulnerability of the area. It was added to the hazard (the Gilort flood band) using equal weights, and the risk of flooding was obtained.
The flood band in a vector format represents the spatial distribution of floods with a 50-year rollback period as the maximum data available for the study area.
The resulting flood risk values range from 0 to 1 and are thus divided into five equal classes (very low, low, medium, high, and very high), using a range of 0.2.
The methodology for identifying the physical, social, and total vulnerability as well as the risk of flooding in the study area was based on the multiplication of raster data sets and processing the statistical values generated.
3. Results and Discussions
3.1. Physical Vulnerability
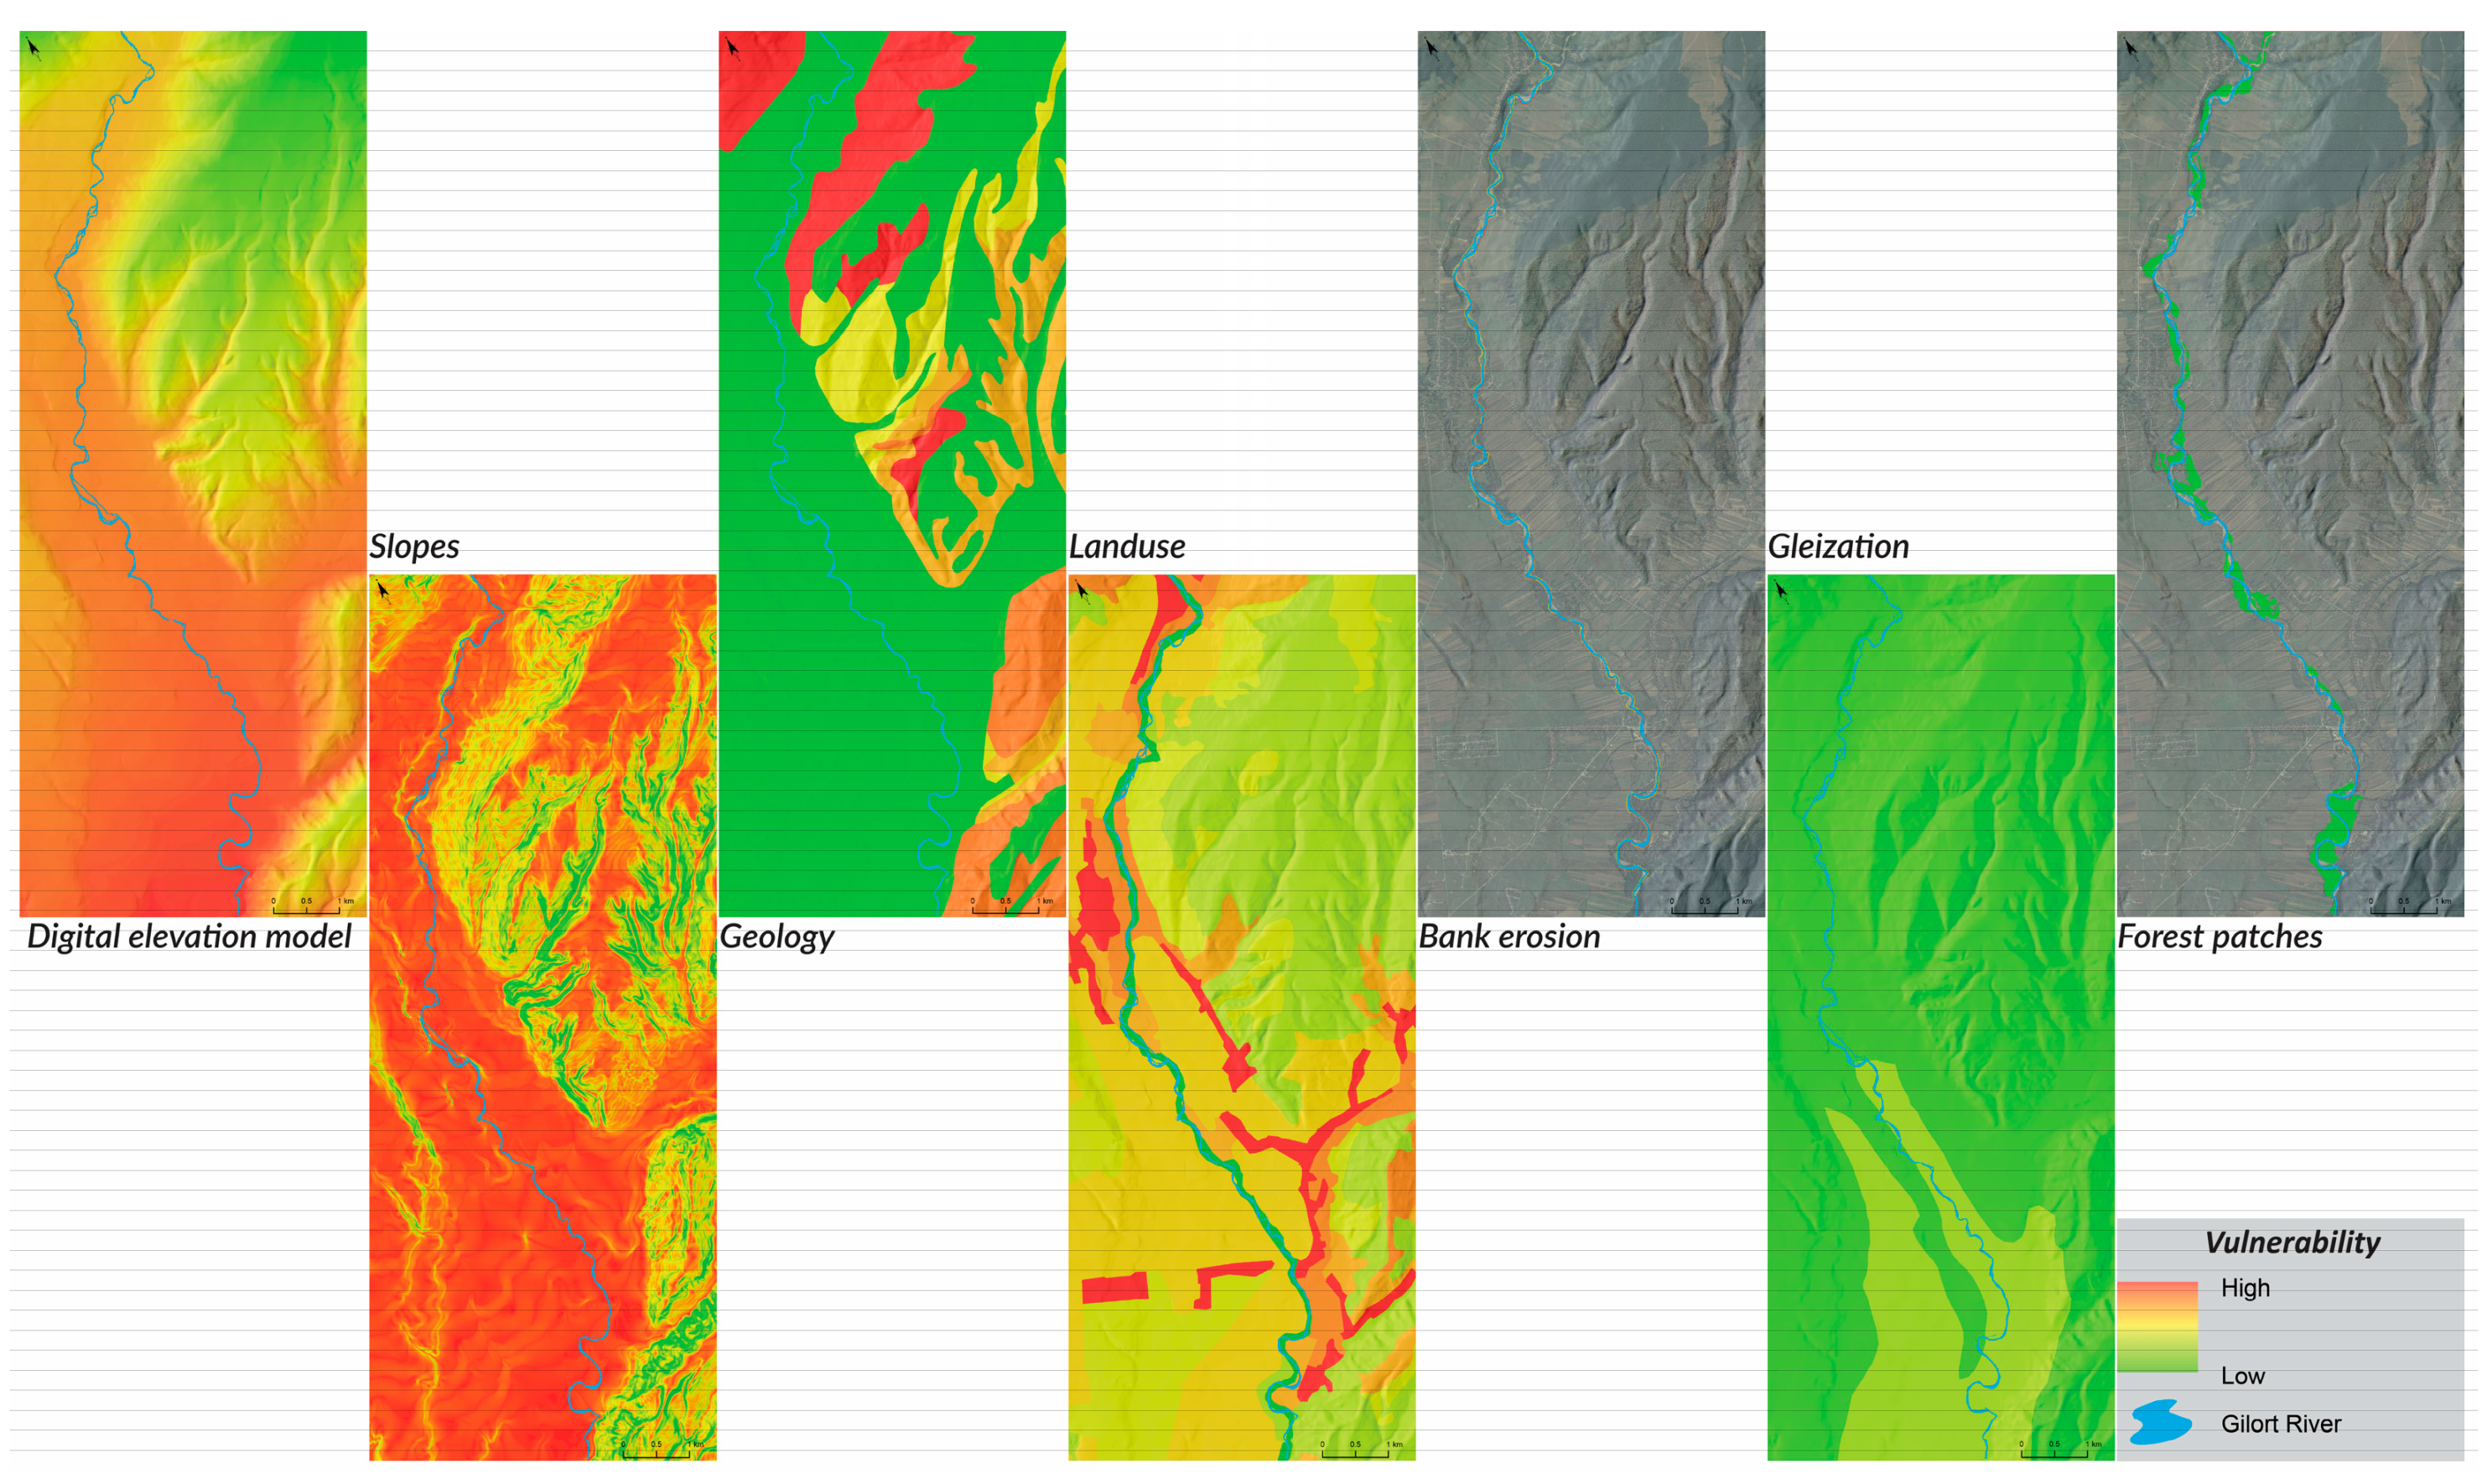
For the calculation of the physical vulnerability of the study area in the event of a flood, the parameters mentioned above (elevation, slope, bank erosion, land use, geology, riparian vegetation, soils) were processed, the input data were normalized, and the entire database was rasterized (
Figure 4). This paper aims to include as many elements as possible in order to reflect the reality in the field. Similar studies take into consideration natural factors such as land use [
22,
24], elevation, and slope [
23].
For the elevation, high and very high vulnerabilities were identified in the floodplain areas (which represent most of the study area as having the highest potential for the flood wave to spread) and along the watercourses, both permanent or temporary, where the altitude of the terrain was reduced. Low and very low vulnerability was identified on the interfluves in the eastern half of the study region where altitudes were above 400 m.
Looking at the slopes, it can be noted that the flat or quasi-horizontal surfaces (slopes below 5°), which characterize the valley corridors, have high and very high vulnerability, while high slopes are less vulnerable to flooding. The land use has a medium, high, and very high vulnerability in the proximity of the river for two reasons: the concentration in this area of the localities and the population (the towns of Bălcești, Bengesti, Albeni, Mirosloveni, Bolbocesti) and most of the land along the river is agriculturally used; thus, the economic impact of a flood would be high (the above-mentioned towns have an agricultural profile so that land degradation or set-aside would affect the local economy). In geological composition, sand and gravel (alluvial deposits) predominate [
25], with distribution along minor channels and floodplains. They offer the area low vulnerability, as they are non-cohesive rocks, which allow water to be quickly infiltrated into the groundwater. The intensity of the gleization process is very low in the study area, so the vulnerability of the region from this point of view is also low.
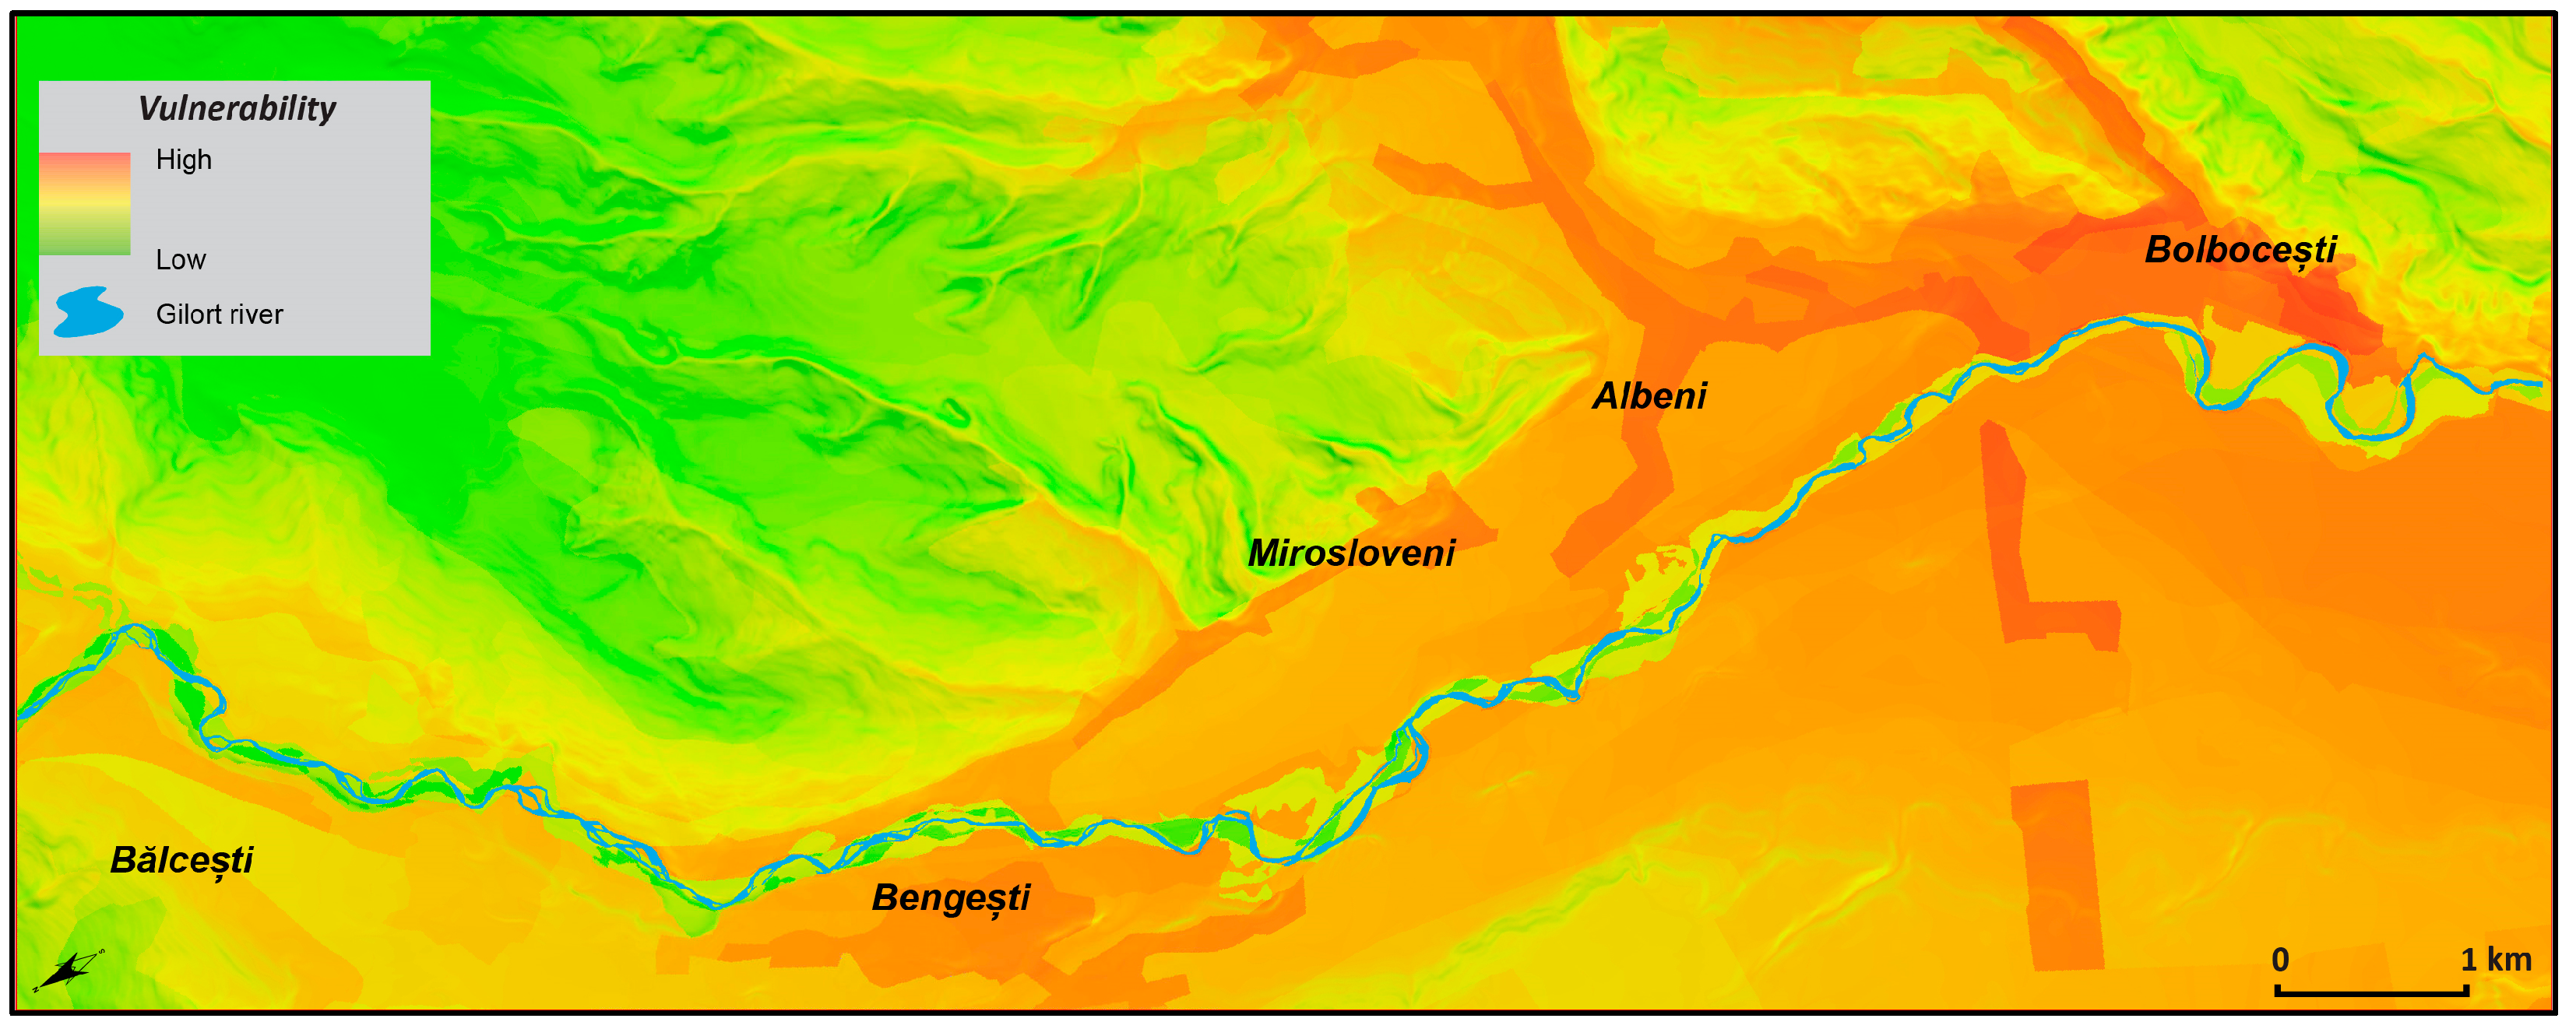
The physical vulnerability of the area was determined through the multiplication of rasters. The result is shown in
Figure 5.
Thus, it turned out that the highest physical vulnerability is present in the area of the floodplain, where settlements exist or where agricultural land predominates, which are the main factors affected in the event of floods. Vulnerability decreases in the eastern part of the study area. It should be noted that the physical vulnerability of the area is lower in the riverbed and in its immediate proximity, as there is a relatively uniform distribution of riparian vegetation patches along the river course. By extracting the area data, a percentage distribution of vulnerability was obtained (divided into five classes—the “very low” class did not register values) (
Table 1).
Compared to other similar studies, this paper aimed to identify the flood risk in a mainly rural area, with a low population density; therefore, the physical vulnerability of this area is of great importance.
3.2. Social Vulnerability
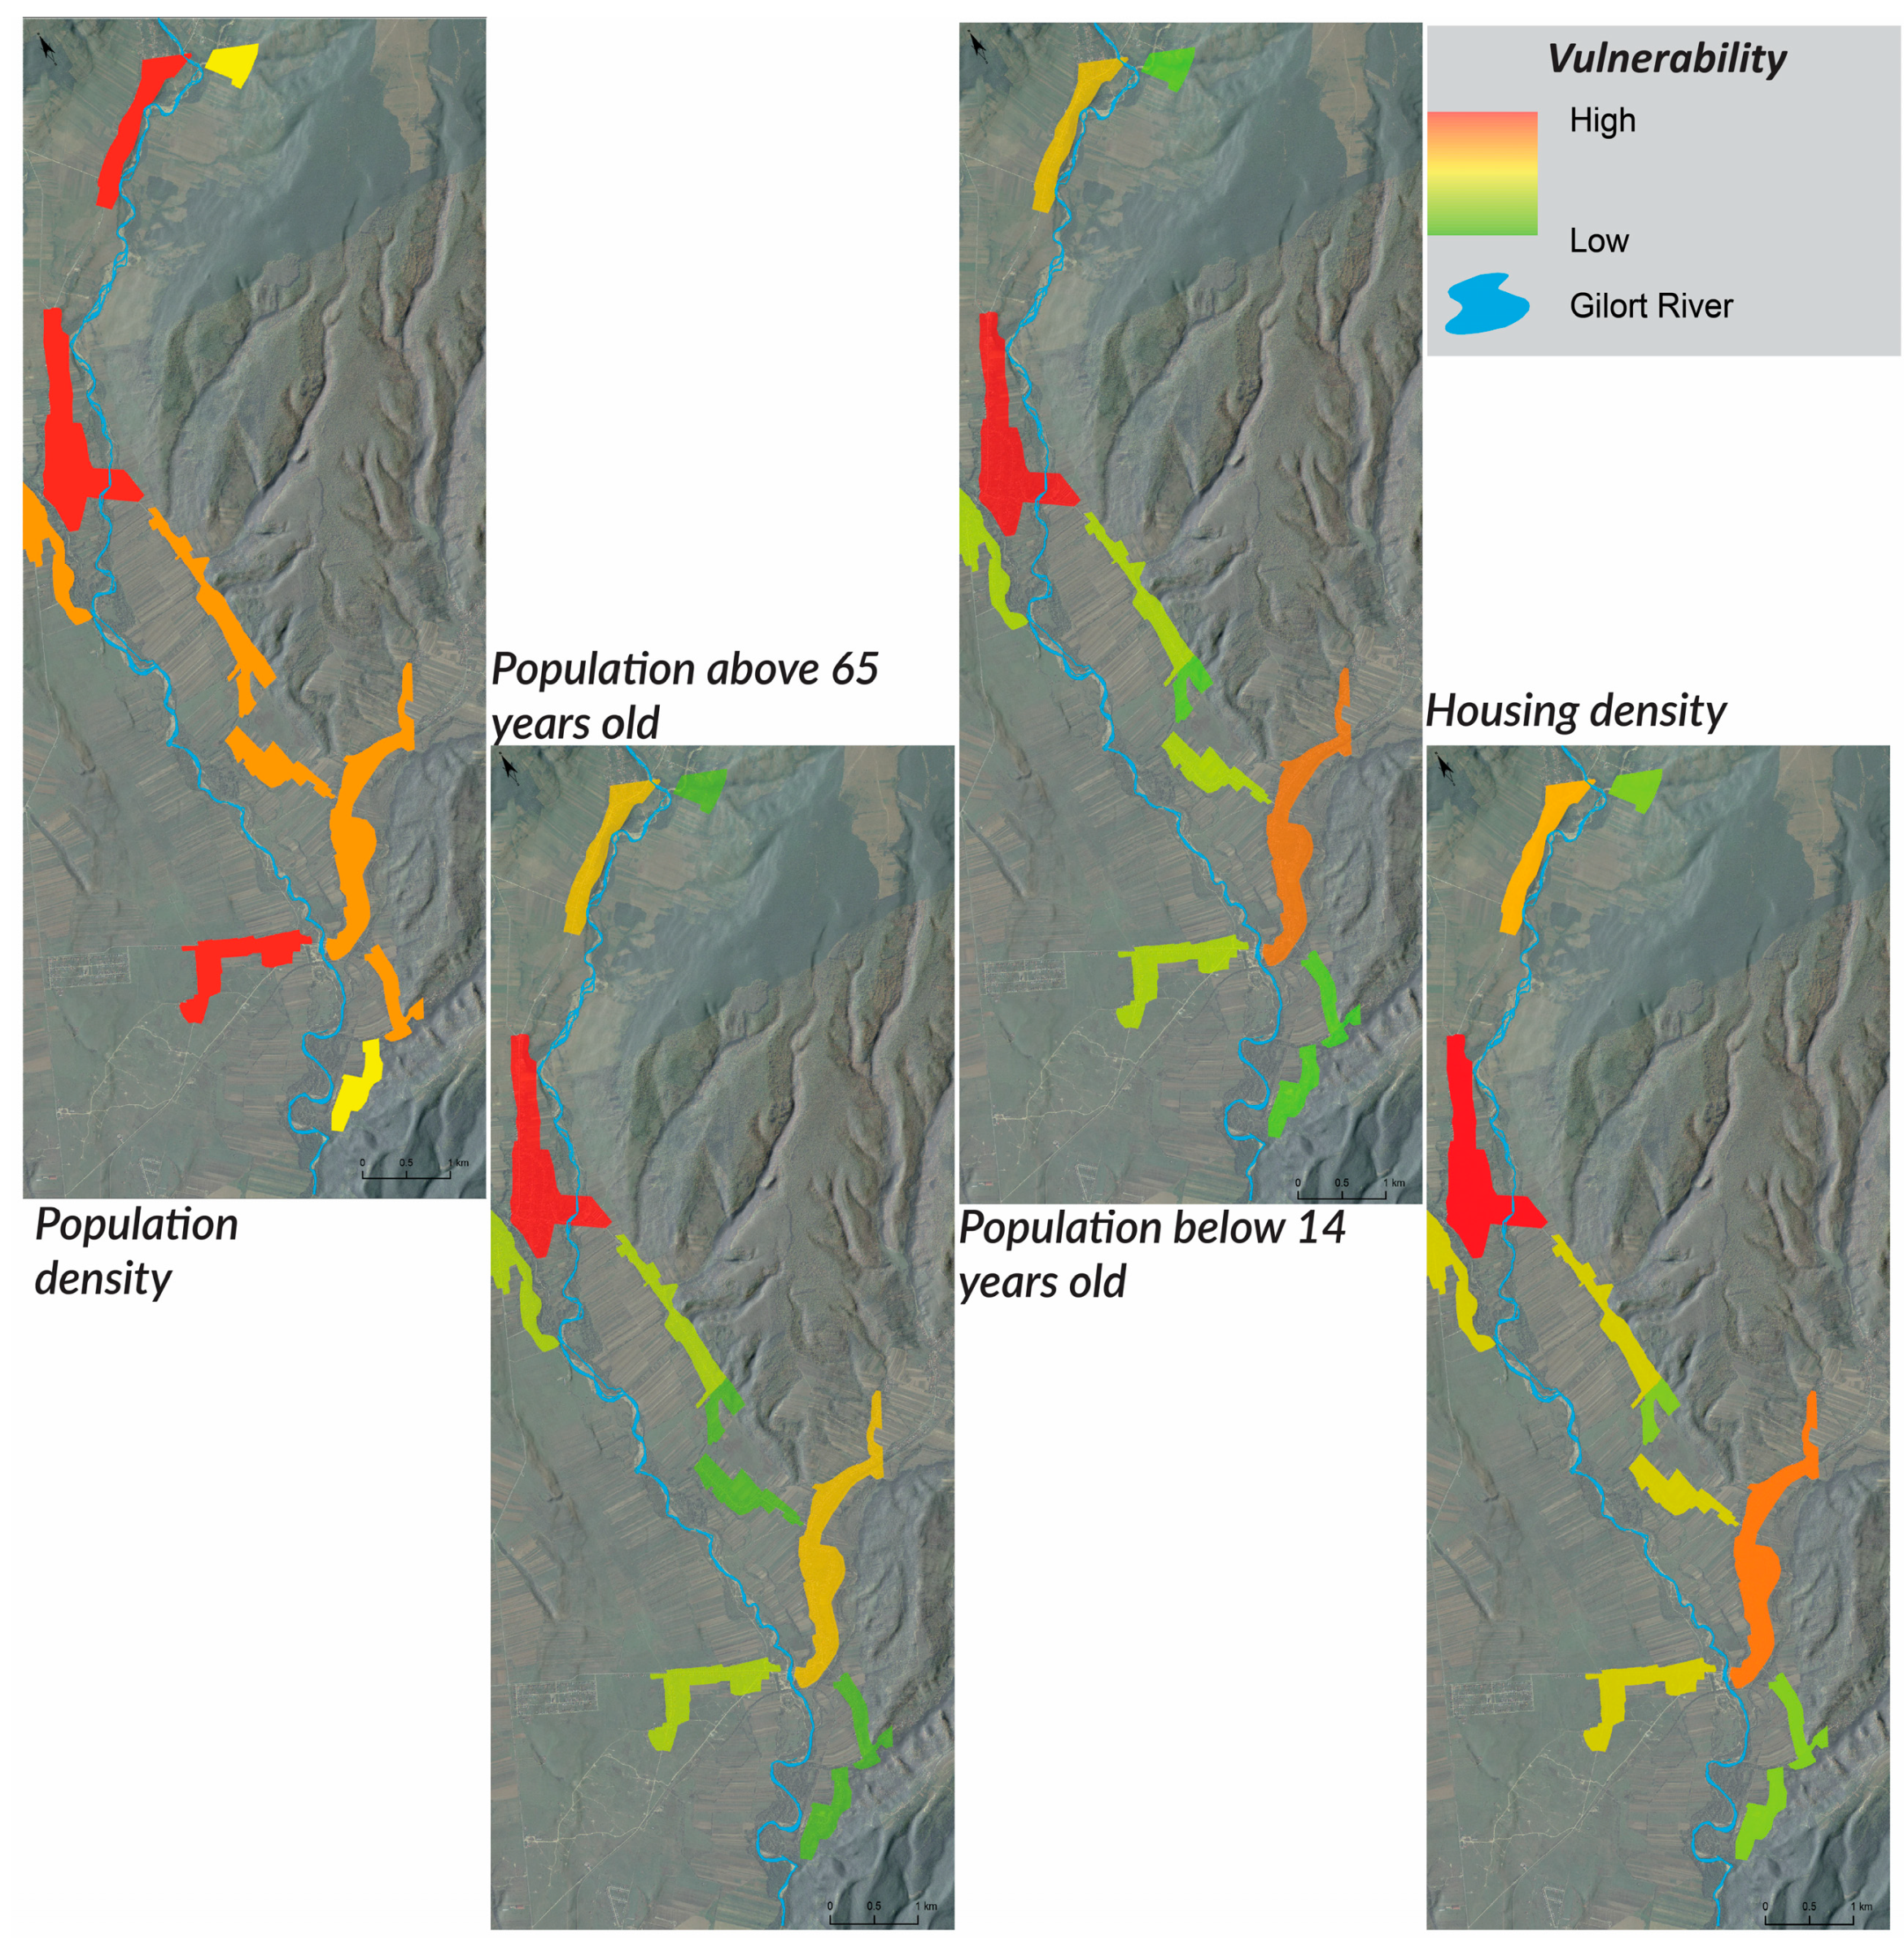
The following parameters were used to calculate social vulnerability in the event of a flood (population density, population under 14, population over 65 years, and density of houses) and were processed; the input data were normalized, and the entire database was rasterized (
Figure 6). The statistical data used for the population are shown in
Table 2.
For all the parameters considered, the highest values were recorded in Bengesti town, which is also the most important settlement in the study area. This was followed by Albeni town, as well as values of population and importance in the area.
The distribution of social vulnerability in the region is shown in
Figure 7. The highest values of social vulnerability were recorded in the two mentioned localities. The average vulnerability was recorded in the village of Bălcești (located to the north of the study region). The area, not including permanent settlements, was considered to have zero social vulnerability.
Average values of social vulnerability were recorded in the southern part of the village of Mirosloveni, and the lowest values were recorded in the village of Bolbocesti as a result of the distribution of demographic parameters considered relevant for this analysis.
The statistical results for social vulnerability are presented in
Table 3. As a result of the fact that this study refers to a hilly area with dispersed villages, over 95% of the area showed low and very low social vulnerability.
Compared to similar studies on the matter, this paper aimed to include the most relevant social factors for the study area. Ekmekcioglu [
22], took into consideration factors such as education level and income level when discussing the vulnerability of an urban area, where income and education level disparities occurred between neighborhoods, but we considered this to not be applicable in a rural area with relative homogenous income and education level. On the other hand, we focused on basic factors, such as vulnerable populations, the number of houses, population density, and house density. Also, the flood’s impact on infrastructure is not relevant at this scale because the road density is low. The river erosion impact on infrastructure in the study area is a subject approached in a different paper [
29].
Table 2.
Population statistics (source: NSI, 2020) [
30].
Table 2.
Population statistics (source: NSI, 2020) [
30].
| | Albeni | Bengești | Bălcesti | Mirosloveni | Bolbocești |
|---|
| Total population | 2009 | 2723 | 805 | 588 | 211 |
| Population under 14 y.o. | 288 | 388 | 115 | 84 | 30 |
| Population above 65 y.o. | 333 | 596 | 176 | 97 | 35 |
| No. of houses | 502 | 681 | 147 | 147 | 53 |
| House density (house/sq.km) | 282.67 | 340.91 | 189.73 | 284.61 | 200.78 |
Table 3.
Distribution of social vulnerability by class.
Table 3.
Distribution of social vulnerability by class.
Social
Vulnerability | Area
km2 | Percentage
% |
|---|
| Very low | 67.36 | 94.27 |
| Low | 1.64 | 2.29 |
| Medium | 1.41 | 1.97 |
| High | 0.00 | 0.00 |
| Very high | 1.05 | 1.47 |
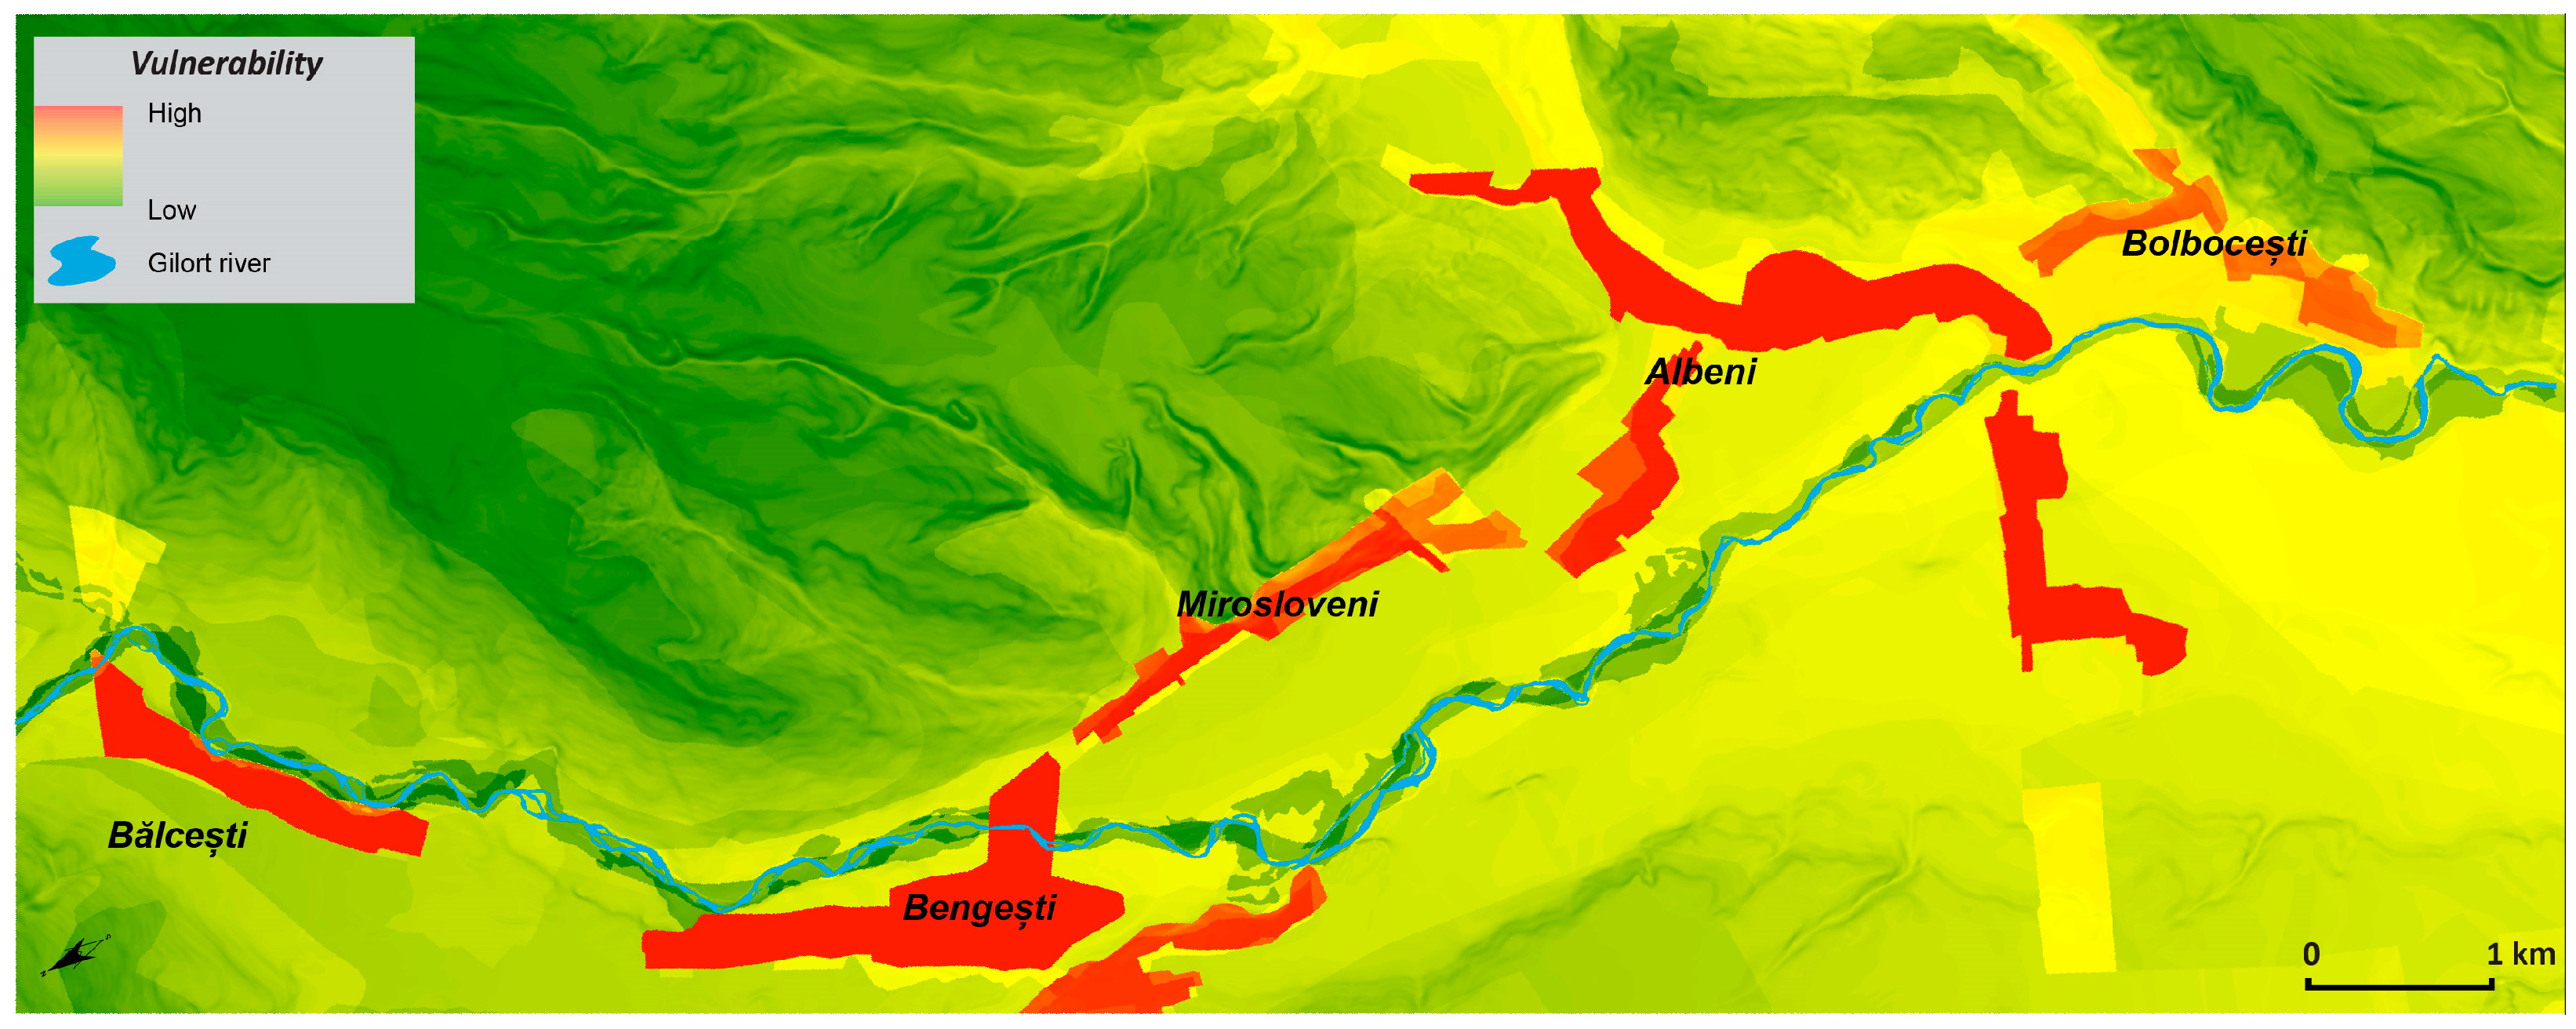
The two types of vulnerability were combined (using equal weights) to achieve the total vulnerability of the study area (
Figure 8). It can be noted that the highest values of vulnerability were recorded in the proximity of human settlements, where both types of calculated vulnerabilities are present. The floodplain area has medium vulnerability, while the hill areas with higher altitudes and higher pitch slopes are less vulnerable. More than 90% of the study area has low and very low vulnerability, and the highest values characterize the built spaces.
The total vulnerability by class (
Table 4) shows that over 90% of the areas present low and very low vulnerability, and medium, high, and very high vulnerability is identified in towns where both physical and social conditions are met. As an example, we bring into discussion low elevation areas, where the low and very low vulnerability classes are at a high percentage. This is mainly because, even if the physical conditions incline towards high vulnerability, the social factor is not present or very lowly represented; therefore, the total vulnerability tends to have low and very low values.
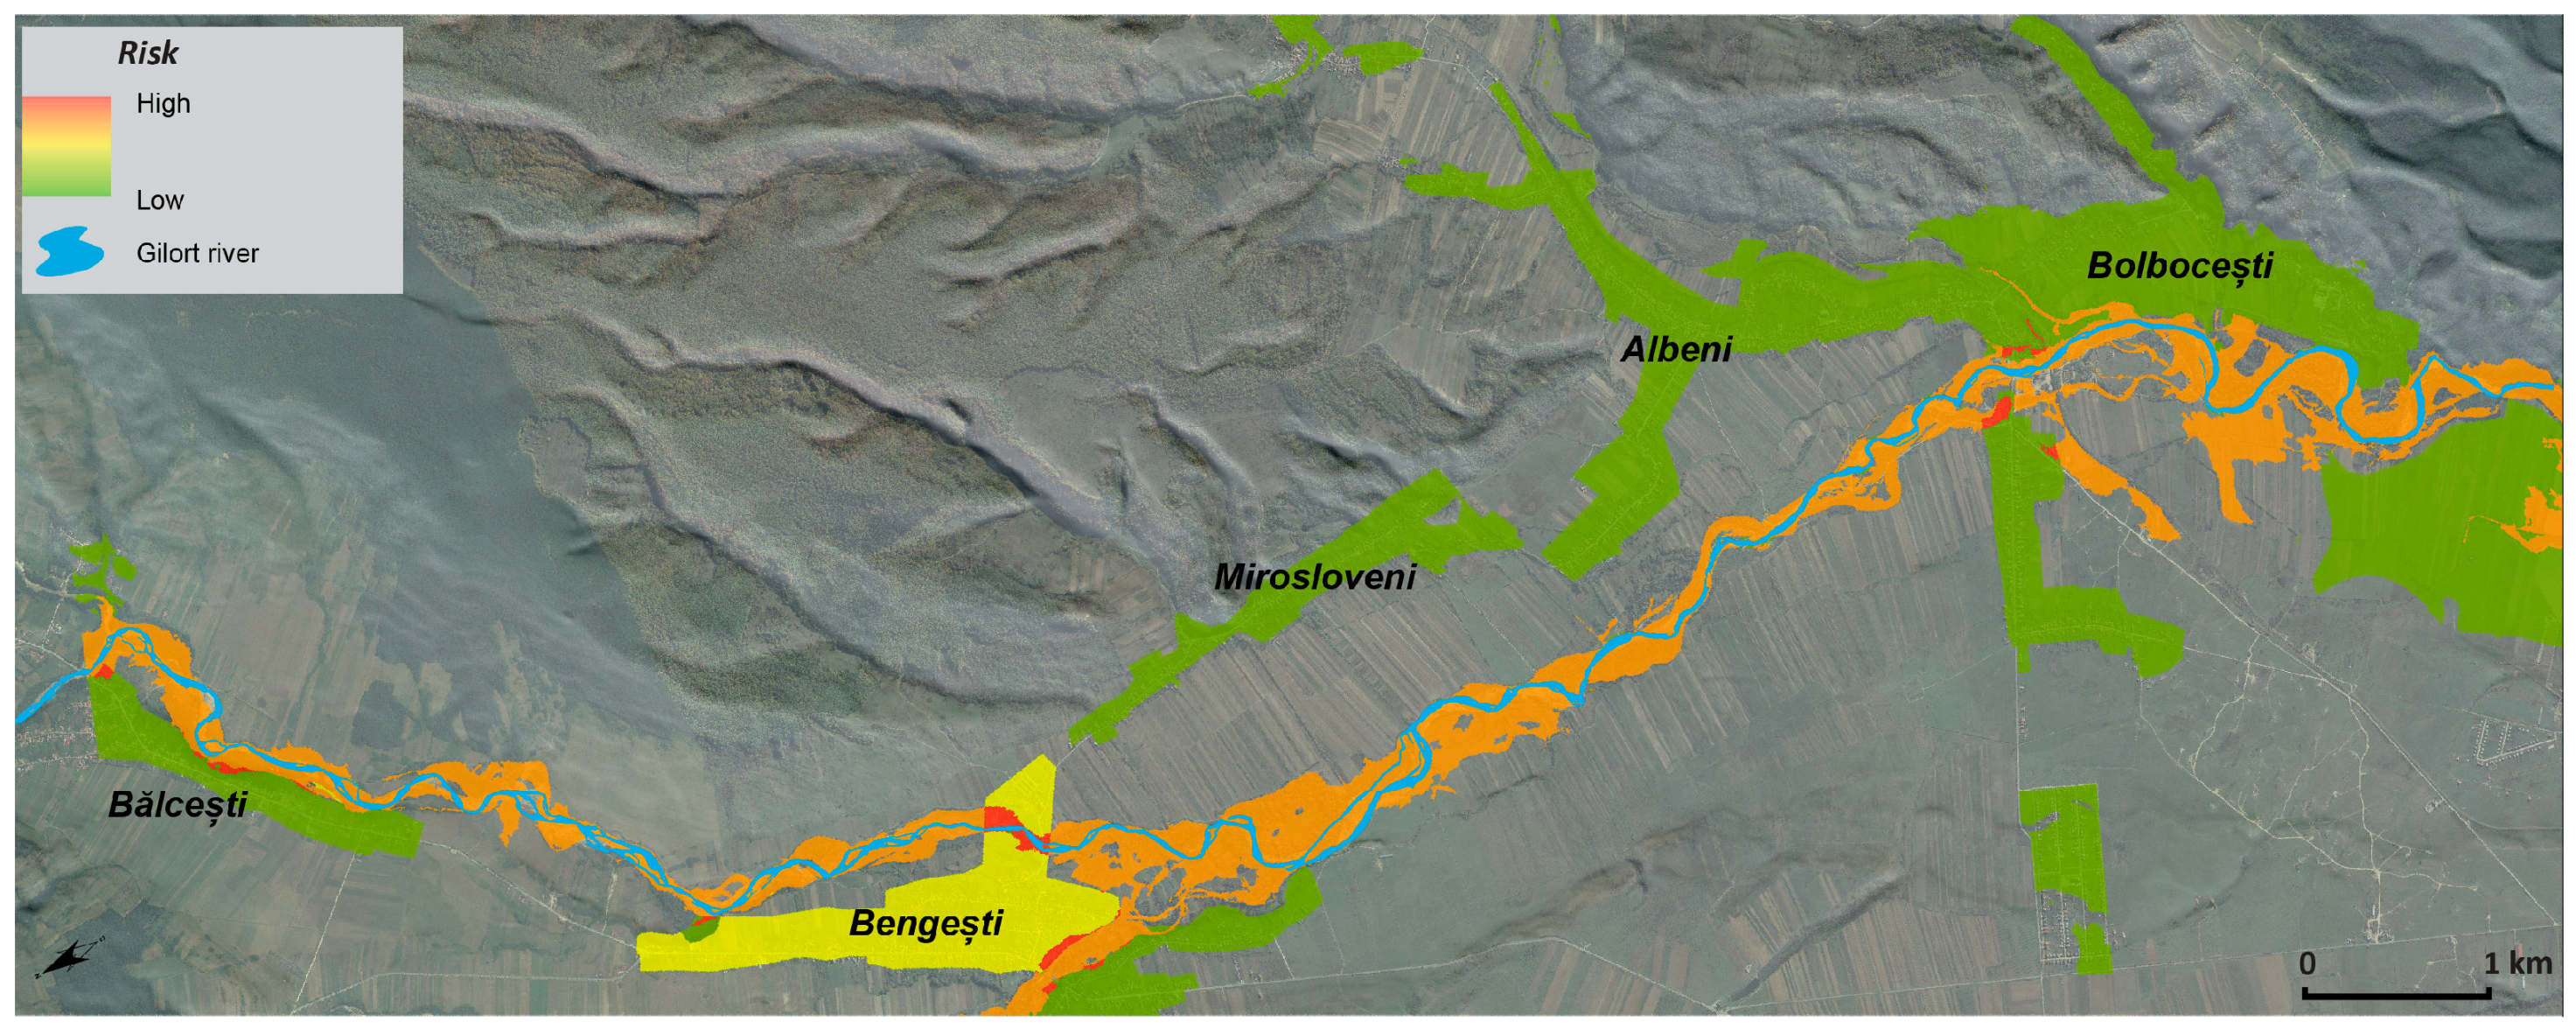
The flood risk distribution (
Figure 9) was based on the risk calculation formula, with the following two components: hazard and vulnerability. Thus, the hazard was considered the flood band of the Gilort River (recurrence period of 50 years). Raster data sets representing hazard and vulnerability were aggregated using equal weights, and the result was the spatial distribution of flood risk. Five risk classes (ranging from very low to very high) were identified in the study area, and their spatial and percentage distribution is as follows: very low risk: 63.53 km
2 (88.90%), low risk 3.27 km
2 (4.57%), medium risk 1.23 km
2 (1.72%), high risk 3.37 km
2 (4.71%), and very high risk 0.07 km
2 (0.1%). It is noted that the highest flood risk figures were recorded where the flood band intersected the area of development of the localities (in the case of the Bengești and Albeni), and all conditions for material and human damage were met.
The remaining locations in the study area identified medium, low and very low values, with a number of upstream exceptions (Bălcești) where high-risk values were present. Over 75% of the existing settlement area had a low and very low risk, 20% had medium risk, and only 3.29% had high and very high risk. High-risk values were also identified in the Gilort River floodplain throughout the flood band.
Risk distribution by class was extracted based on the obtained results and is presented in
Table 5, but only for the areas inside towns, in order to obtain a more accurate image of the impact on the local communities.
Most of the town areas studied presented a low and very low flood risk (76.7%), especially Bălcești, Mirosloveni, Albeni, and Bolbocești towns. There were also considerable areas with medium flood risk, such as Bengești town, mainly because of its position at a confluence between Gilort, a river, and a tributary river, and also because, in terms of population, Bengești town has the highest number of people in every vulnerable class. The high and very high-risk areas were identified in Bălcești, Bengești, and Albeni, where the flood band overlaps directly with the town area. The results are comparable to other similar studies, with high flood risk in areas with high population and housing densities, especially areas with low elevation and slopes positioned in river proximity.
4. Conclusions
Flooding is a hydrological hazard with a significant impact on population, construction, and economic activities. Identifying the hazard is not sufficient, and the economic impact of the hazard must be taken into account. Such analysis may be carried out using GIS techniques, taking into account elements of physical and social vulnerability. For the study area, the risk of flooding is high where the flood band intersects the built area, with the most affected localities being Bengesti and Albeni.
The limitations of the study relate in particular to the accuracy and variety of the data available at the time. For example, in order to assess social vulnerability, a series of factors would have been appropriate for this study, such as the number of people with disabilities, the level of education, and damage to infrastructure.
Our findings reveal high-to-very-high levels of physical vulnerability, particularly in low-lying regions characterized by low slopes, land use patterns, and groundwater depth. Conversely, social vulnerability exhibits medium to very high values predominantly within urban areas, thereby influencing overall vulnerability based on town distribution.
Regarding the flood risk, there were only three towns with high risk in limited areas: Bălcești, Bengești, and Albeni. This is mainly related to the river’s proximity, with the constructions being close to the main channel.
By changing the weights and numbers of vulnerabilities and factors, it was possible to obtain different risk distributions based on the different importance assigned. This allows for different scenarios, depending on the main objective set for the study.
Such analysis may be used as a decision-making tool for risk management and may be extended to all types of natural hazards.
Our study provides a foundation for further research aimed at developing effective flood risk mitigation strategies, leveraging the insights garnered from our comprehensive analysis.
