Article

Establishing a Geo-Database for Drinking Water and Its Delivery and Storage Components with an Object-Based Approach

by
Yakup Emre Coruhlu
1,* and
Sait Semih Altas
2,3
1
Geomatics Engineering, Karadeniz Technical University, 61080 Trabzon, Türkiye
2
Graduate School of Natural and Applied Sciences, Karadeniz Technical University, 61080 Trabzon, Türkiye
3
Trabzon Water and Sewerage Administration General Directorate (TISKI), 61900 Trabzon, Türkiye
*
Author to whom correspondence should be addressed.
Water 2024, 16(12), 1753; https://doi.org/10.3390/w16121753
Submission received: 31 May 2024 / Revised: 13 June 2024 / Accepted: 14 June 2024 / Published: 20 June 2024
(This article belongs to the Section Water Resources Management, Policy and Governance)

Abstract

:
Infrastructure facilities that serve the city as a whole and should be considered as a whole should be built in an orderly and planned manner, just as cities are. Infrastructure facilities become obsolete over time. Aging infrastructure facilities may become unserviceable over time. When the need for maintenance and repair arises, it is mandatory to renew or replace infrastructure facilities. In this case, necessary maintenance/repair and renovation works should be completed as soon as possible. These infrastructure facilities may not be transferred to maps in the digital environment and may often be managed with person-oriented information, not institutional. There is a problem for decision makers, namely, that the construction, maintenance, repair and governance of infrastructure facilities cannot be carried out systematically, on time and effectively. The only way to provide such a service is through the combined use of today’s informatics, Geographical Information System (GIS) and Global Navigation Satellite System (GNSS) technologies, unlike the classical methods of the past. The aim of the study is to effectively manage the scarce resource of drinking water and its facilities, which are an important component of infrastructure facilities, with a method that uses current mapping technologies and informatics facilities. Especially after Infrastructure for Spatial Information (INSPIRE) and the transformation of Land Administration Domain Model (LADM) to the International Organization for Standardization (ISO) standard, Turkish National Geographic Information System (TNGIS) studies and many academic studies carried out in Türkiye have been modelled with Unified Modelling Language (UML) diagrams in accordance with LADM. Similarly, within the scope of this study, UML diagrams were prepared, and then a GIS database was established. Thanks to field workers, chiefs, engineers and others working on water pipelines, all necessary data, classic, as-built and digital, were gathered. These were collected in different ways in order to conduct spatial and non-spatial analysis in the study area of Trabzon. The most important result from the study is that the entire drinking water infrastructure of Trabzon has been transferred to the system in a structure that allows spatial queries, ensuring that damage detection on water components, maintenance and repair processes are carried out in the shortest time and at the lowest cost. The investigation and application of a sensor-integrated GIS-aided system, making it possible to control and monitor the use of lost and illegal water to be controlled as well as inform consumers who will be affected by possible maintenance and repair, is recommended.

1. Introduction

The world population is moving intensively from rural to urban areas [1]. All creatures living in both rural and urban areas need water [2]. In addition to the increase in the world population, factors such as global warming, greenhouse gas emissions, limited land use, erosion and depletion of natural resources threaten the life cycle [3,4]. This frightening scenario especially endangers clean water resources. In addition, because water resources are not unlimited, it can cause great danger for living things [5]. In such dangerous situations, effective water management becomes important [6]. Taking the scarce resource of water from its source and delivering it to water consumers is very important for people. It is known that in recent years, studies of topics such as clean water, water saving, water-related infrastructure works and reflecting water costs to water consumers at a minimum level have also increased [7].
Drinking water facilities infrastructure should be handled with a holistic infrastructure information system consisting of different parts [8]. Today, the spatial and non-spatial information of most existing drinking water lines is not known with certainty. The main reason for this situation is that the information regarding the underground systems is not recorded regularly during or after the intense infrastructure investments brought about by rapid urbanization. As a result of the absence of infrastructural maps or sketches or a failure to use them, these infrastructure systems can only be found non-spatially and randomly by certain people who are mainly field workers for water delivery and storage components. However, the management of water systems may be negatively affected when the people in question leave the institution responsible for water transmission for certain reasons such as retirement, resignation or death. These systems, whose existence usually comes to mind with a malfunction, interruption, odour or a possible flood, should be considered as a geographical infrastructure information system [9].
Insufficient information regarding lines and other network components in infrastructure management may cause many problems in field applications. In particular, lack of spatial information on infrastructure lines and components and unplanned or superficial attempts to solve malfunctions are among the important problems that need to be handled very well in times of emergency [10].
One of the ways of drinking water management is infrastructure information systems, which is a sub-branch of management information systems [11]. Changes in existing drinking water potential, loss/leakage accumulation, and monetary and temporal profit generation can be achieved with these information systems [12]. Drinking water and its malfunctions can be catalogued in a smart system, allowing spatial and non-spatial queries [13]. These data can be transferred to a database and stored, queried, published and analysed [14]. Institutions dealing with infrastructure need an information system that can perform dynamic data exchange, query, analysis, planning and archiving at any time, independently of people such as employees and managers [15]. As is known, in case of any malfunction in the drinking water network, the relevant unit wants to detect the malfunction and fix the problem as soon as possible. However, after the failure is resolved, from the moment the water is delivered to the consumers again, the type of land, its location, the effort spent to detect the failure, the time to repair the failure, the material used to eliminate the failure, the number of people working on troubleshooting the failure and the location of the failure may be forgotten. However, recording spatial and non-spatial information on malfunctions and tracking the malfunctions’ intensity status with these records is possible with GIS.
INSPIRE is a geographical information platform launched by the member states of the European Parliament with the aim of sharing environmentally relevant spatial data within Europe and creating a common spatial data infrastructure system. INSPIRE aims to establish a spatial data infrastructure in Europe by determining standards for the production and sharing of spatial data in Europe. INSPIRE aims to determine the necessary standards for the EU to produce, develop and present spatial data according to the determined standards and to develop services such as industry, tourism, agriculture and transportation [16].
Türkiye, which participated in the e-Europe project that started in 1999 and the e-Europe plus project developing subsequently, started the e-Türkiye transformation process. Türkiye has become one of the exemplary countries in e-transformation and e-Government. TNGIS (Turkish National Geographical Information Systems) studies have been included in e-Türkiye. TNGIS was developed using Unified Modelling Language (UML) in accordance with LADM and INSPIRE. There are 32 geographical themes within the scope of TNGIS. Water, which is an indispensable resource for people, is handled under the infrastructure theme, which is one of 32 themes [17]. Many institutions follow TNGIS studies and work in coordination with the General Directorate of Geographic Information Systems, which carries out the TNGIS project. Regarding water, Water and Sewerage Administrations in Metropolitan Municipalities and Special Provincial Administrations participate in the work.

1.1. Definition of the Problem

There are some problems in the management of drinking water infrastructure data obtained from the literature and field practices. Many parts of the drinking water infrastructure and delivery and storage components are buried underground; therefore, mapping drinking water components has not always been possible thus far. If drinking water components are not precisely mapped when they are constructed, if there is a need to reach the components after some time, location may not be possible. Although the upper and lower structures that make up cities are built in different years, above-ground structures can always be mapped. However, it may not always be easy to map underground structures. However, it may not always be easy to map underground structures. Lines and equipment built at high cost and labour expenditure may not be accessible geographically in the future, and the management of these infrastructure facilities may become difficult. As is known, managing anything well requires that thing to be handled thoroughly and all its features to be well known. The problem addressed in this study is the lack of a geographical database and an information system in the management of drinking water for the purpose of carrying drinking water to people as its consumers.

1.2. Aim of the Study

This study aims to manage the problems encountered in the management and operation of the drinking water infrastructure in a sustainable structure in the digital environment, making use of technology rather than human-based and classical methods. In this way, it is expected to reduce costs, save manpower, prevent time losses and increase efficiency. Thus, a drinking water geographical information system was established in the study region of Trabzon Province, which will contain information about the water source, water line, water tank, water pumping centre and valves of the drinking water infrastructure in the selected regions, in addition to malfunction information regarding these infrastructure components in the region. By collecting these data in a single database, querying them spatially and performing various spatial analyses, this study is envisaged to solve the problems related to the drinking water infrastructure and meeting the needs of the consumers. This study aims to establish a drinking water infrastructure information system that can monitor and provide solutions to negative situations such as malfunctions and interruptions, support project and investment studies and assist with disruptions in field work by obtaining all geographical data.

1.3. Methodology

In the study, the process steps presented Figure 1 were followed methodologically. Detailed literature research and current situation analysis were carried out on drinking water infrastructure systems. As literature data, scientific sources such as the previous period 10th and 11th Development Plans and the current 12th Development Plan, European Union Water Directives and national legislations, projects and articles were used. The problem of the study was defined with inferences obtained from literature and field studies. The purpose of the study was to eliminate the problems stated in the problem definition. The sub-goals that will serve the purpose of the study can be explained as follows. First of all, the geographical data model was adapted from TNGIS, and then all possible scenarios for the drinking water information system were visualized with UML diagrams. The data model to be put forward in the study was created as a draft through field scanning and office studies, and then the data sets were decided. Field studies were carried out in selected regions as special case studies. The data required in the model were obtained from different sources with different data collection tools. Data were provided by different methods: digitization of existing classical maps that were previously created; up-to-date field studies on drinking water lines under construction; digital operational plans (as-built plans); and, for lines built in older times that did not have an operation plan, the processing of lines into orthophoto maps thanks to field workers. All collected data were transferred to the database. At the end of the entire process, analysis, queries and reporting were entered in the GIS database for all components of the drinking water infrastructure in a form suitable for spatial and non-spatial data analysis.

2. Materials and Methods

2.1. Infrastructure Information System

Infrastructure is a discipline that is too important to be neglected [18]. Neglecting infrastructure can cause not only financial losses but also loss of life [19]. In order to minimize all losses, the use of infrastructure information systems should be expanded. Infrastructure Information Systems is one of the sub-applications of GIS: natural gas, drinking water, wastewater, rainwater, telecommunications, electricity, etc. An Infrastructure Information System is a spatial information system that examines the relationships between infrastructure information and the related superstructure facilities [20].

2.2. INSPIRE Components

INSPIRE components enable environmental geospatial data sharing between public sector organisations, facilitate public access to geospatial data across Europe and support cross-border policy-making. The Hydrography theme, which is INSPIRE’s water-related theme, covers lakes, streams, basins and all geographical objects related to them [16]. Application areas of INSPIRE can be listed as follows:
  • Water Supply;
  • Water Transportation;
  • Monitoring of Water Resources;
  • Management of Recreation Areas;
  • Land Use Planning and Management;
  • Research on Biodiversity;
  • Freshwater Fishing;
  • Purification of Wastewater;
  • Monitoring of Pollution;
  • Hazardous Waste Storage Site Identification

2.3. LADM: ISO 19152 Standard

LADM is an international standard designated by ISO as ISO 19152 [21] and has made great contributions to understanding the importance of data modelling in issues [22] such as land administration [23]. such as land administration (Lemmen et al., 2015). LADM can support the development of application software for land administration and can help minimize excessive data redundancies and duplication. LADM provides terminology for land management [24]. In addition, the INSPIRE Directive aims to create a European Union spatial data infrastructure for the purposes of EU environmental policies and activities that may have an impact on the environment. The INSPIRE Directives that came into force on 15 May 2007 have been applied [16]. In addition, the INSPIRE Directive aims to create a European Union spatial data infrastructure for the purposes of EU environmental policies and activities that may have an impact on the environment. INSPIRE Directives that came into force on 15 May 2007 have been applied [25].

2.4. Türkiye’s National Geographical Information System (TNGIS)

TNGIS is an e-government project aiming to establish a GIS infrastructure in accordance with technological developments, create a web portal for public institutions and organizations to present the geographical information they are responsible for to consumers via a common infrastructure, compose content standards that can meet the needs of all consumer institutions of geographical data and determine geographical data exchange standards [26].
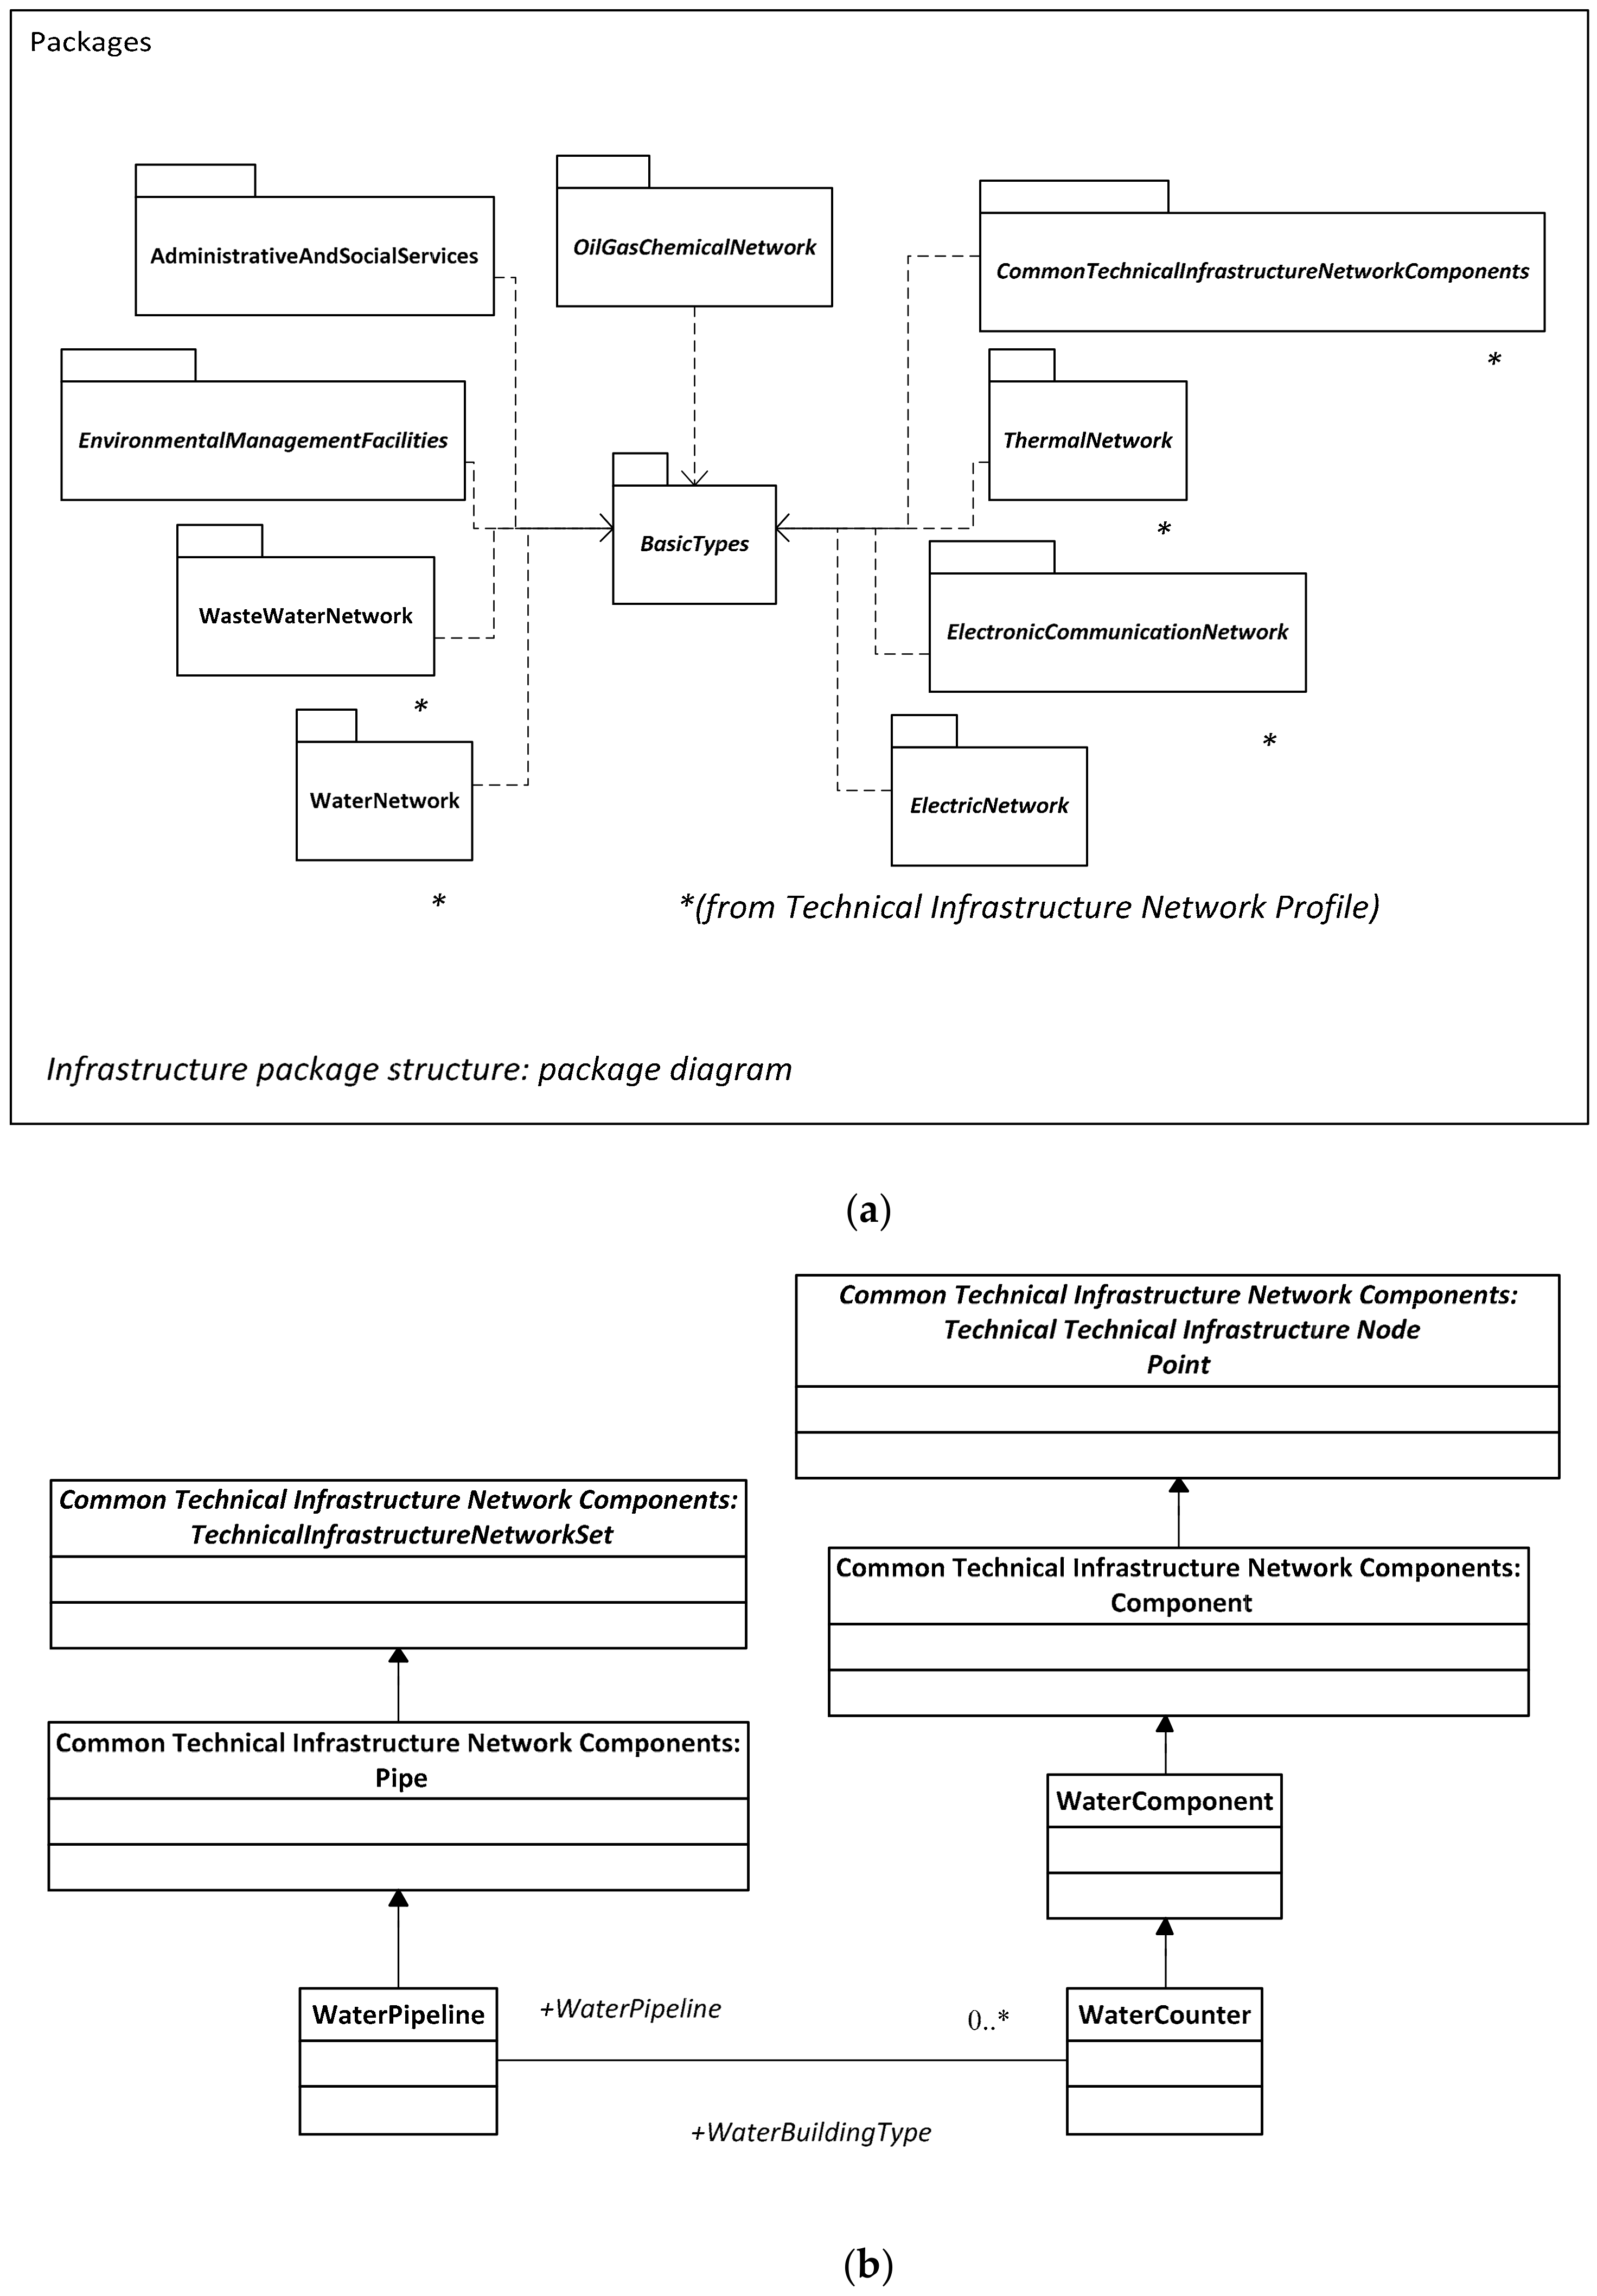
TNGIS infrastructure theme seen in Figure 2a includes wastewater, waste management, water and electricity utilities, etc. public services such as technical infrastructure and civil defence, education, health, management, etc. The package structure of the TNGIS infrastructure theme, with details from country scale to city scale, is presented in Figure 2b. This technical infrastructure section, which contains many details, is discussed under 6 headings: water, wastewater, electricity, oil/gas/chemistry, thermal and electronic communication. The water network subject to this study is among these packages.
Within the TNGIS UML model, the classes of the “Water Network” data set under “Technical Infrastructure Network Profile” are shown in Figure 3, and these classes have different or common features. Within the “Water Network” are the classes “Water Pipeline”, “Water Component”, “Water Counter”, “Water Structure” and “Water Supply Region”. Classes also have different or common non-spatial information.
The 12th 5-year Development Plan, published in 2023 and setting out all kinds of work and targets to be carried out for 5 years between 2024–2028, discusses the actions to be taken in almost every field from a broad perspective. A number of visionary policies have been developed for the effective management of water in the 12th Development Plan. The plan explained the objectives required for the implementation of these policies.
As it is known, one third of the world’s population lives in arid and semi-arid climate zones with water stress. Considering all the activities in the world, it can be said that the amount and quality of water is not sufficient. Accessible fresh water resources, which are less than 1.2% of the world’s total water resources, face problems such as pollution, drought, climate change, rapid population growth, water losses and unsustainable overuse. These situations prevent millions of people around the world from accessing clean water [28].
Although UML is not a programming language, it is a standard diagramming and relational modelling language used for software development. It consists of a combination of methods that determine and explain how software systems can be modelled [29]. Thanks to the design carried out before establishing an information system with UML, unexpected logic errors can be minimized, the coding process of the designed model becomes easier, program development costs decrease, memory usage becomes more efficient, time is saved and communication in interdisciplinary studies can become simpler and more effective [30]. In this sense, researchers working in the field of land management use the UML language just as they use INSPIRE and LADM. Many different studies have been conducted in Türkiye in accordance with LADM using UML visualizations. Some of these are cadastral and land registry applications [31], an object-based data model of purchase and sale transactions [32], implementation for 3D spatial planning through the integration of LADM standards [33], a real estate valuation approach for land consolidation [34], geographical database design for cemetery site location selection [35], real estate valuation data model design for Türkiye [36], geographical data model development for protected areas [37], legal and social aspects of real estate valuation for land consolidation [38], protection of foundational properties in Türkiye [25] and global scientific production of LADM-based research [39].

2.5. Water Management

Water is one of the indispensable and most basic components of life. Although approximately 75% of the earth is covered with water, the proportion of drinkable water is only around 0.74%. Drinking water is water that is safe for consumption by living things and will not cause health problems when consumed. Although water is such an important resource for living things, it is in danger of depletion. The fact that water has become a depleting resource for various reasons makes water management very important [40]. The amount of accessible drinking water is expressed as 1.2% [28]. On the other hand, the water rate given as 0.74% is expressed as the rate of potable water [40]. According to them, it is obvious that there are two different figures about accessible drinking water and potable drinking water, because there two figures represent two different explanations, but one conclusion that human beings must be careful to distribute, control and use drinking water.
There are many institutions and organizations active on a global, regional and national scale in the world to ensure equal and fair sharing and usage for water security. The United Nations (UN) plays an active role in water management with its many programs and institutions. One of the most important of these institutions is the United Nations Water Agency. The institution has targets such as providing clean drinking water through integrated management of water resources, water quality, water pricing and climate change [41].
The World Water Council, a multinational platform, was founded in 1996 and is headquartered in Marseille. The Council works for the purpose of taking the most effective decisions at all levels in order to raise awareness of fair water use in the world, to protect, develop and plan water resources, to manage water level use and to ensure global sustainability [42].
The International Union for Conservation of Nature and Natural Resources (IUCN), one of the world’s largest and most established networks, aims to protect water resources. IUCN works to produce solutions by bringing together the UN, governments, academia, the private sector and civil society to provide sustainable use of water, fair and equal sharing and protection of ecosystems [41].
The EU accepts water as a heritage that needs to be protected, not as a product focused on financial gain. One of the important directives regarding water management in EU legislation is the Water Framework Directive (WFD) [43].
Türkiye’s 12th development plan, which takes into account all other water-related legislations and WFDs regarding water, indicates that it is necessary to create sustainable systems by ensuring sustainable, holistic, effective and efficient water usage and to establish the National Water Information System [28].
Turkish national water legislation includes the following:
  • Law on Water No. 831 [44];
  • Law No. 1053 on Drinking, Domestic and Industrial Water Supply to Settlements with Municipal Organizations [45];
  • Law on the Establishment and Duties of İSKİ General Directorate No. 2560 [46];
  • Metropolitan Municipality Law No. 5216 [47];
  • Municipality Law No. 5393 [48]
There are institutions responsible for the administrative management of water in many states in the world and in Türkiye. There are important institutions that undertake the role of water management in Türkiye and these institutions have important duties. One of these is the State Hydraulic Works (SHW) [28]. Another important institution is the General Directorate of Water Management (GDWM), and some of its main duties are: to create policies for the protection and sustainable use of water resources, to ensure integrated basin management by making upper basin-based planning and to coordinate national and international water management. One of the duties and powers of GDWM is to create a national water database [48,49,50]. Apart from SHW and the GDWM, another institution that provides water-related services in Türkiye is the municipalities. The water-related duties of municipalities can be listed as follows: to distribute water, to provide sewage services, to build and operate treatment plants and to carry out and inspect water discharges. In places where there are no metropolitan municipalities, there are special provincial administrations (SPA). SPAs provide water and sewage services to settlements outside the municipal borders.
Technical management of drinking water infrastructure is discussed in three separate parts: drinking water resources, drinking water suppliers and system components in drinking water transmission. Water intake structures, water tanks, headwaters, transmission lines, network lines, pumping centres and valves are the most important components among system components. Another important component is drinking water infrastructure failures such as damaged water components.
Almost all countries in the world are in search of new water resources, whether they have water problems in their own lands or not. That every country is rich in water is a total misconception. Water resources should be used in a planned, healthy and sustainable manner. Water resources are generally located far from city centres [51].
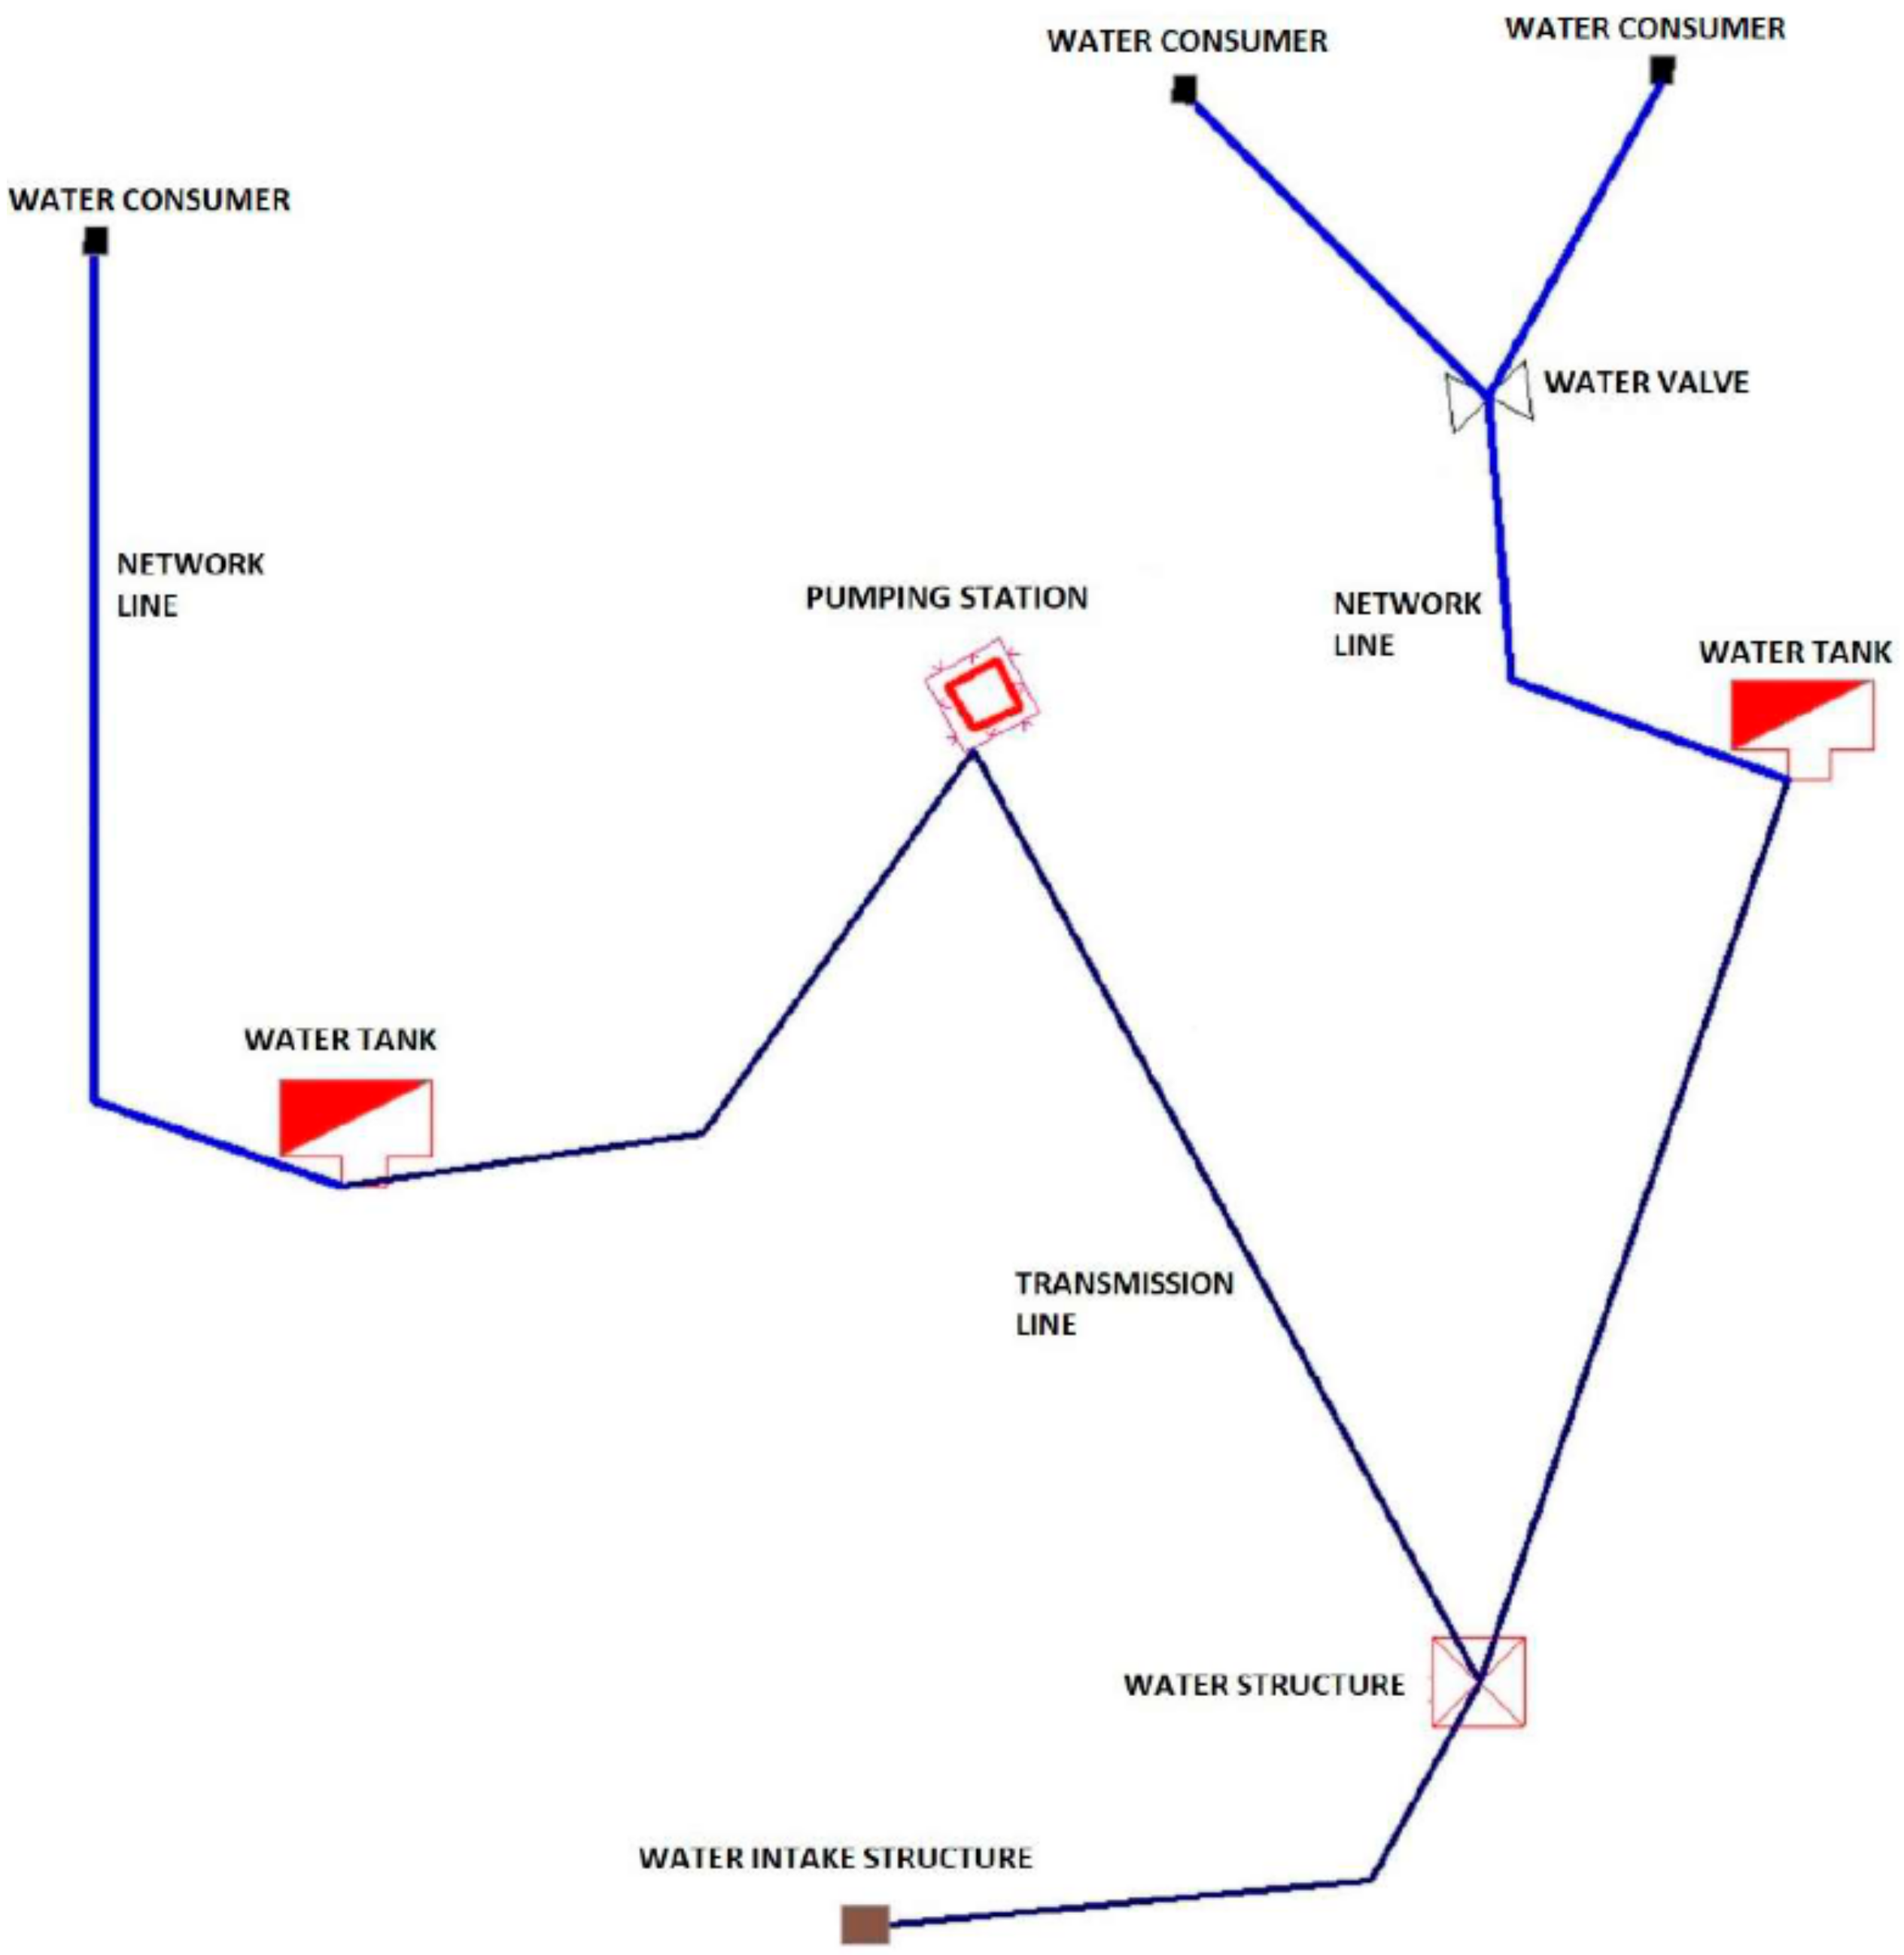
Certain system components are involved in the supply and transmission of drinking water. They can be listed as water intake structures, transmission lines, network lines, consumer connections, pumping stations, discharge facilities, system valves and water tanks. Figure 4 is prepared for the conceptual representation of the drinking water system.

2.6. Drinking Water Failure/Malfunction

Some problems may occur while delivering drinking water to consumers, as is true of any other infrastructure system. The material used may become obsolete at the end of its economic life or may malfunction due to environmental conditions, resulting in the need for repair and renewal. As known relevant institutions receive dozens of reports every week about network failures and pipe bursts. While sometimes the failure point is easily detected, sometimes it may be difficult to detect. Water flow can be monitored with various sensors installed in the water network, and these sensors can also be used to detect water failures. One of the important disruptions in the operation of the drinking water infrastructure is the bursting of water pipes and water outages [52]. The failure of a pipe should not be thought of as merely leaking and losing water. Apart from water loss, repair costs, interruption of local people’s water supply and damage to public trust may occur. The total cost of a malfunction should be considered in direct proportion to the repair time. Therefore, rapid detection of failures is an important part of a drinking water infrastructure management [53].
Intervention in any malfunctions that may occur in drinking water services is important. Good management of drinking water infrastructure facilities can be achieved with a geographical information system for all scenarios such as planning, maintenance, repair and malfunction. A healthy inventory of the information about where and how many lines and facilities of the drinking water infrastructure are pinpointed and the non-spatial information of the components must be kept. In addition, precise locational information is needed in addition to the existing infrastructure, type of failures, frequency of failures, time-season when the failure occurs, size of the failure.

2.7. Obtaining Drinking Water Data

Different data collection tools can be used to obtain the desired data in a geographic information system. The data and data collection methods used in this study are explained in detail below.

2.7.1. As-Built Plans

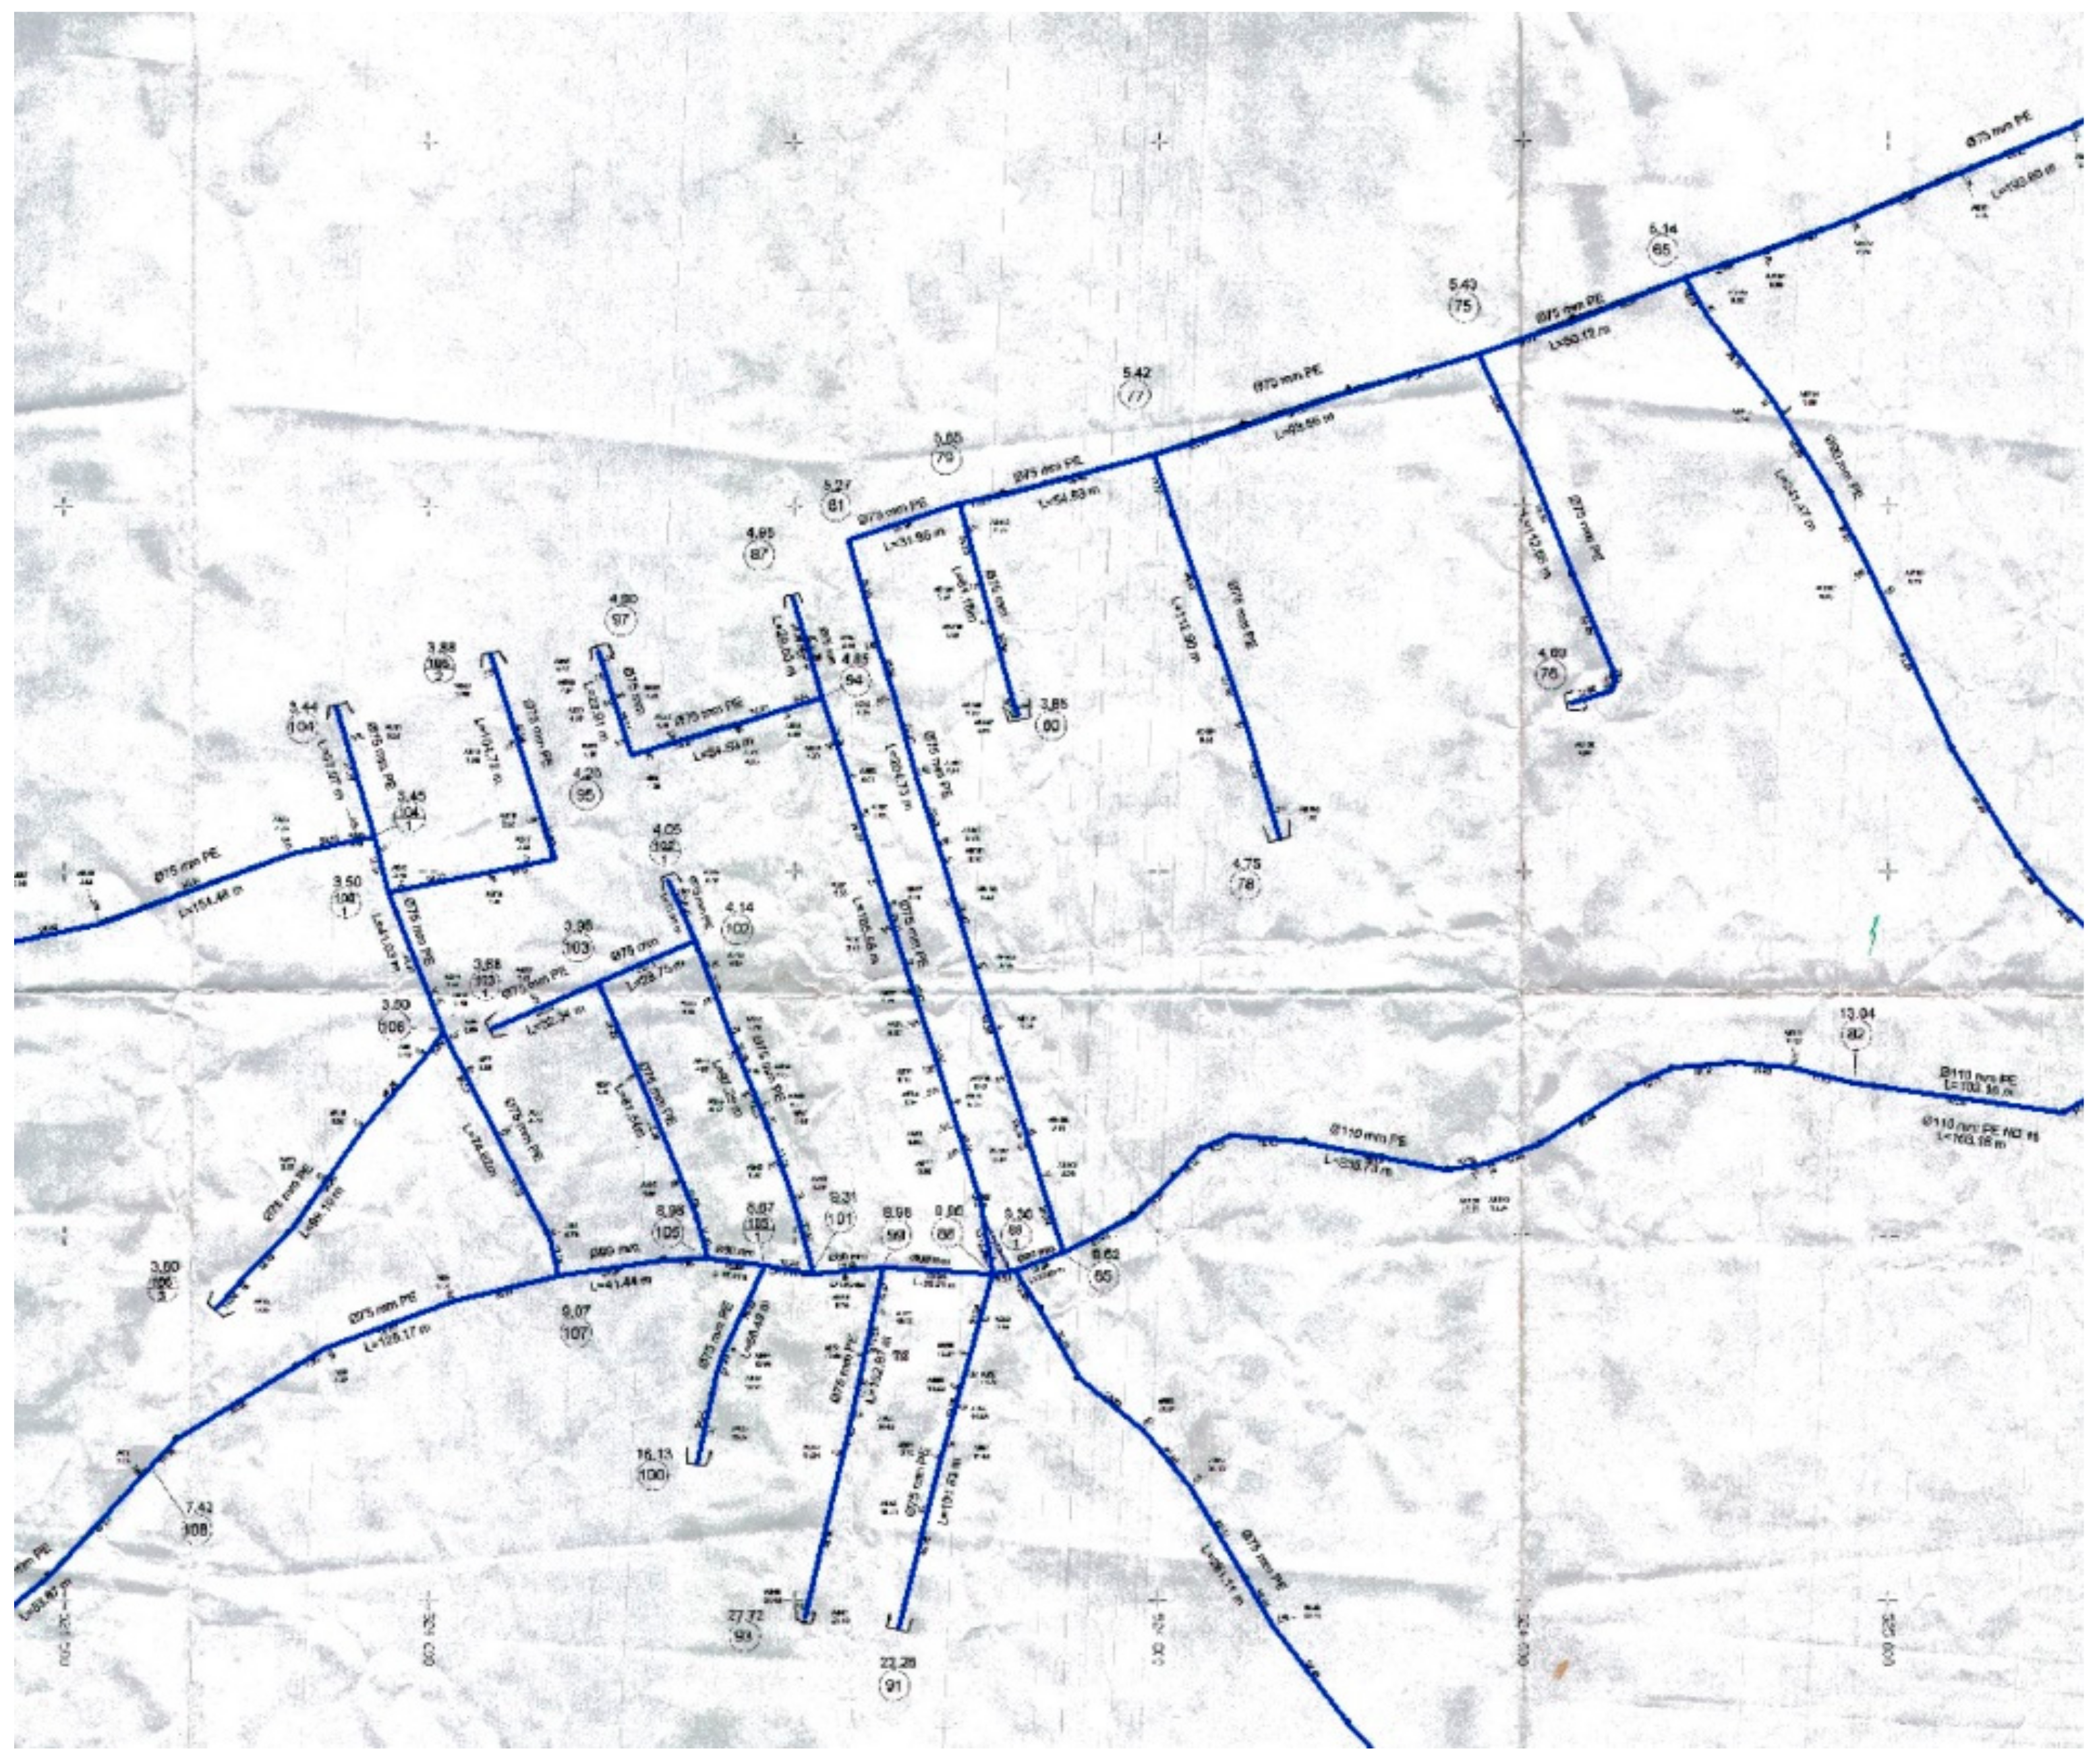
Field measurements of all completed infrastructure, lines, facilities and equipment are included in the digital operation plan. Namely, the numerical business plan contains spatial and non-spatial information. A digital business plan is the most reliable data source for an infrastructure information system. In numerical business plans, manufacturing or manufacturing changes made in the application project are shown. Infrastructure organizations need operating plans to determine and store the final state of production, and in the absence of this information, they cannot manage the infrastructure facility.

2.7.2. Digitization of Up-to-Date Maps

To create a database, paper maps of operations in Figure 5 that do not have a digital business plan must be obtained. In the study, paper maps of up-to-date business plans were scanned and digitized and converted into vector data so that all objects were transferred to separate layers.

2.7.3. Processing Lines on Orthophoto Maps with the Aid of Field Workers

This method is widely used in a region where there is no operating plan or layout of its infrastructure. In most infrastructure institutions, some drinking water infrastructure facilities that do not have any maps can be mapped. During the field study, among the infrastructure components that are not on the map, those on the ground (valve, header, tank, etc.) are first identified. These detected components are measured, and the relationship of these measured components with other lines that cannot be measured or known is determined with the help of orthophoto maps.

2.7.4. Data Collection for Failure/Malfunction

In a drinking water infrastructure information system, identifying failure points and transferring them to the information system is of great importance in order to prevent possible repeated failures. For this reason, malfunctions reported by consumers also provide great opportunities for system administrators as a data collection tool. As a matter of fact, failure notifications can provide important opportunities for identifying water components whose locations are not known exactly today, even though they were manufactured years ago. The location information of the drinking water components whose failures are able to be detected during the field study can be taken and transferred to the GIS database. Infrastructure components, non-spatial data such as type, diameter, etc. can also be provided. Apart from the contribution of failure points to the route of the lines, regular follow-up of failures can be made thanks to the information system. Thus, the management of drinking water infrastructure can be facilitated thanks to the failure points collected digitally and monitored via GIS. Pipes that fail frequently can be identified and the need for a different investment in that area can be determined.

3. Results

3.1. Study Area

Research and findings were made regarding the management of drinking water infrastructure. Possible problems that may arise in the absence of spatial information systems in drinking water management have been examined with the support of literature. After revealing the problems, the requirements analysis of the GIS to be used in their solution is discussed. The first operation that needs to be carried out before establishing a GIS database is requirements analysis. GIS studies have been carried out according to certain standards in the world and in our country in recent years. UML diagrams were created for the classes determined specifically for the study, taking into account the “Water Network Profile” under the “Infrastructure Theme” in TNGIS, which was developed in accordance with LADM standards and INSPIRE directives. With these standards, all processes such as acquisition, use and sharing of data should be carried out in formats to be determined. As a matter of fact, drinking water management should be considered as a geographical data model and the system should be designed in a sustainable structure by providing data suitable for this data model. All data about drinking water infrastructure, have been provided thanks to three methods: digital operation plan (as built), digitization of existing maps and processing of lines into orthophoto maps with the help of field workers. In addition, the study also aims to detect failures in existing water networks and transfer them spatially to the drinking water geographic information system, to estimate network components with intense failure potential and to prioritize such areas in possible future maintenance and repair works. Although the study is generally carried out within the responsibility area of Trabzon Metropolitan Municipality Trabzon Drinking Water and Sewerage Administration General Directorate (DWSAGD in Turkish abbreviation TISKI), the chosen pilot application area is the Pelitli neighbourhood in Ortahisar/Trabzon.
Requirements analysis can also be explained as the initial part where the data types and applications to be used for the purpose of creating the GIS database will be decided. In the Strategic Plan prepared by TISKI for the 2015–2019 period and presented on its website, the aspects and needs of the institution that it considers inadequate are those related to the study. It can be summarized as the lack of a geographical information system and the lack of existing drinking water transmission line and network information in digital environment [54]. Similarly, the current institutional plan of TISKI declares that the existing drinking water transmission line and network plans are not in digital form, the infrastructure works and map studies related to drinking water are insufficient and GIS data related to drinking water are absent [55].

3.2. Creating UML Diagrams Related to Drinking Water Infrastructure

In this part of the study, UML usage scenario, UML activity diagram and UML class diagram were created for drinking water infrastructure. The usage scenario and activity diagram have been prepared to help understand the static model much better. In this way, the priority status of the processes and which process should be carried out by which units can be clarified.
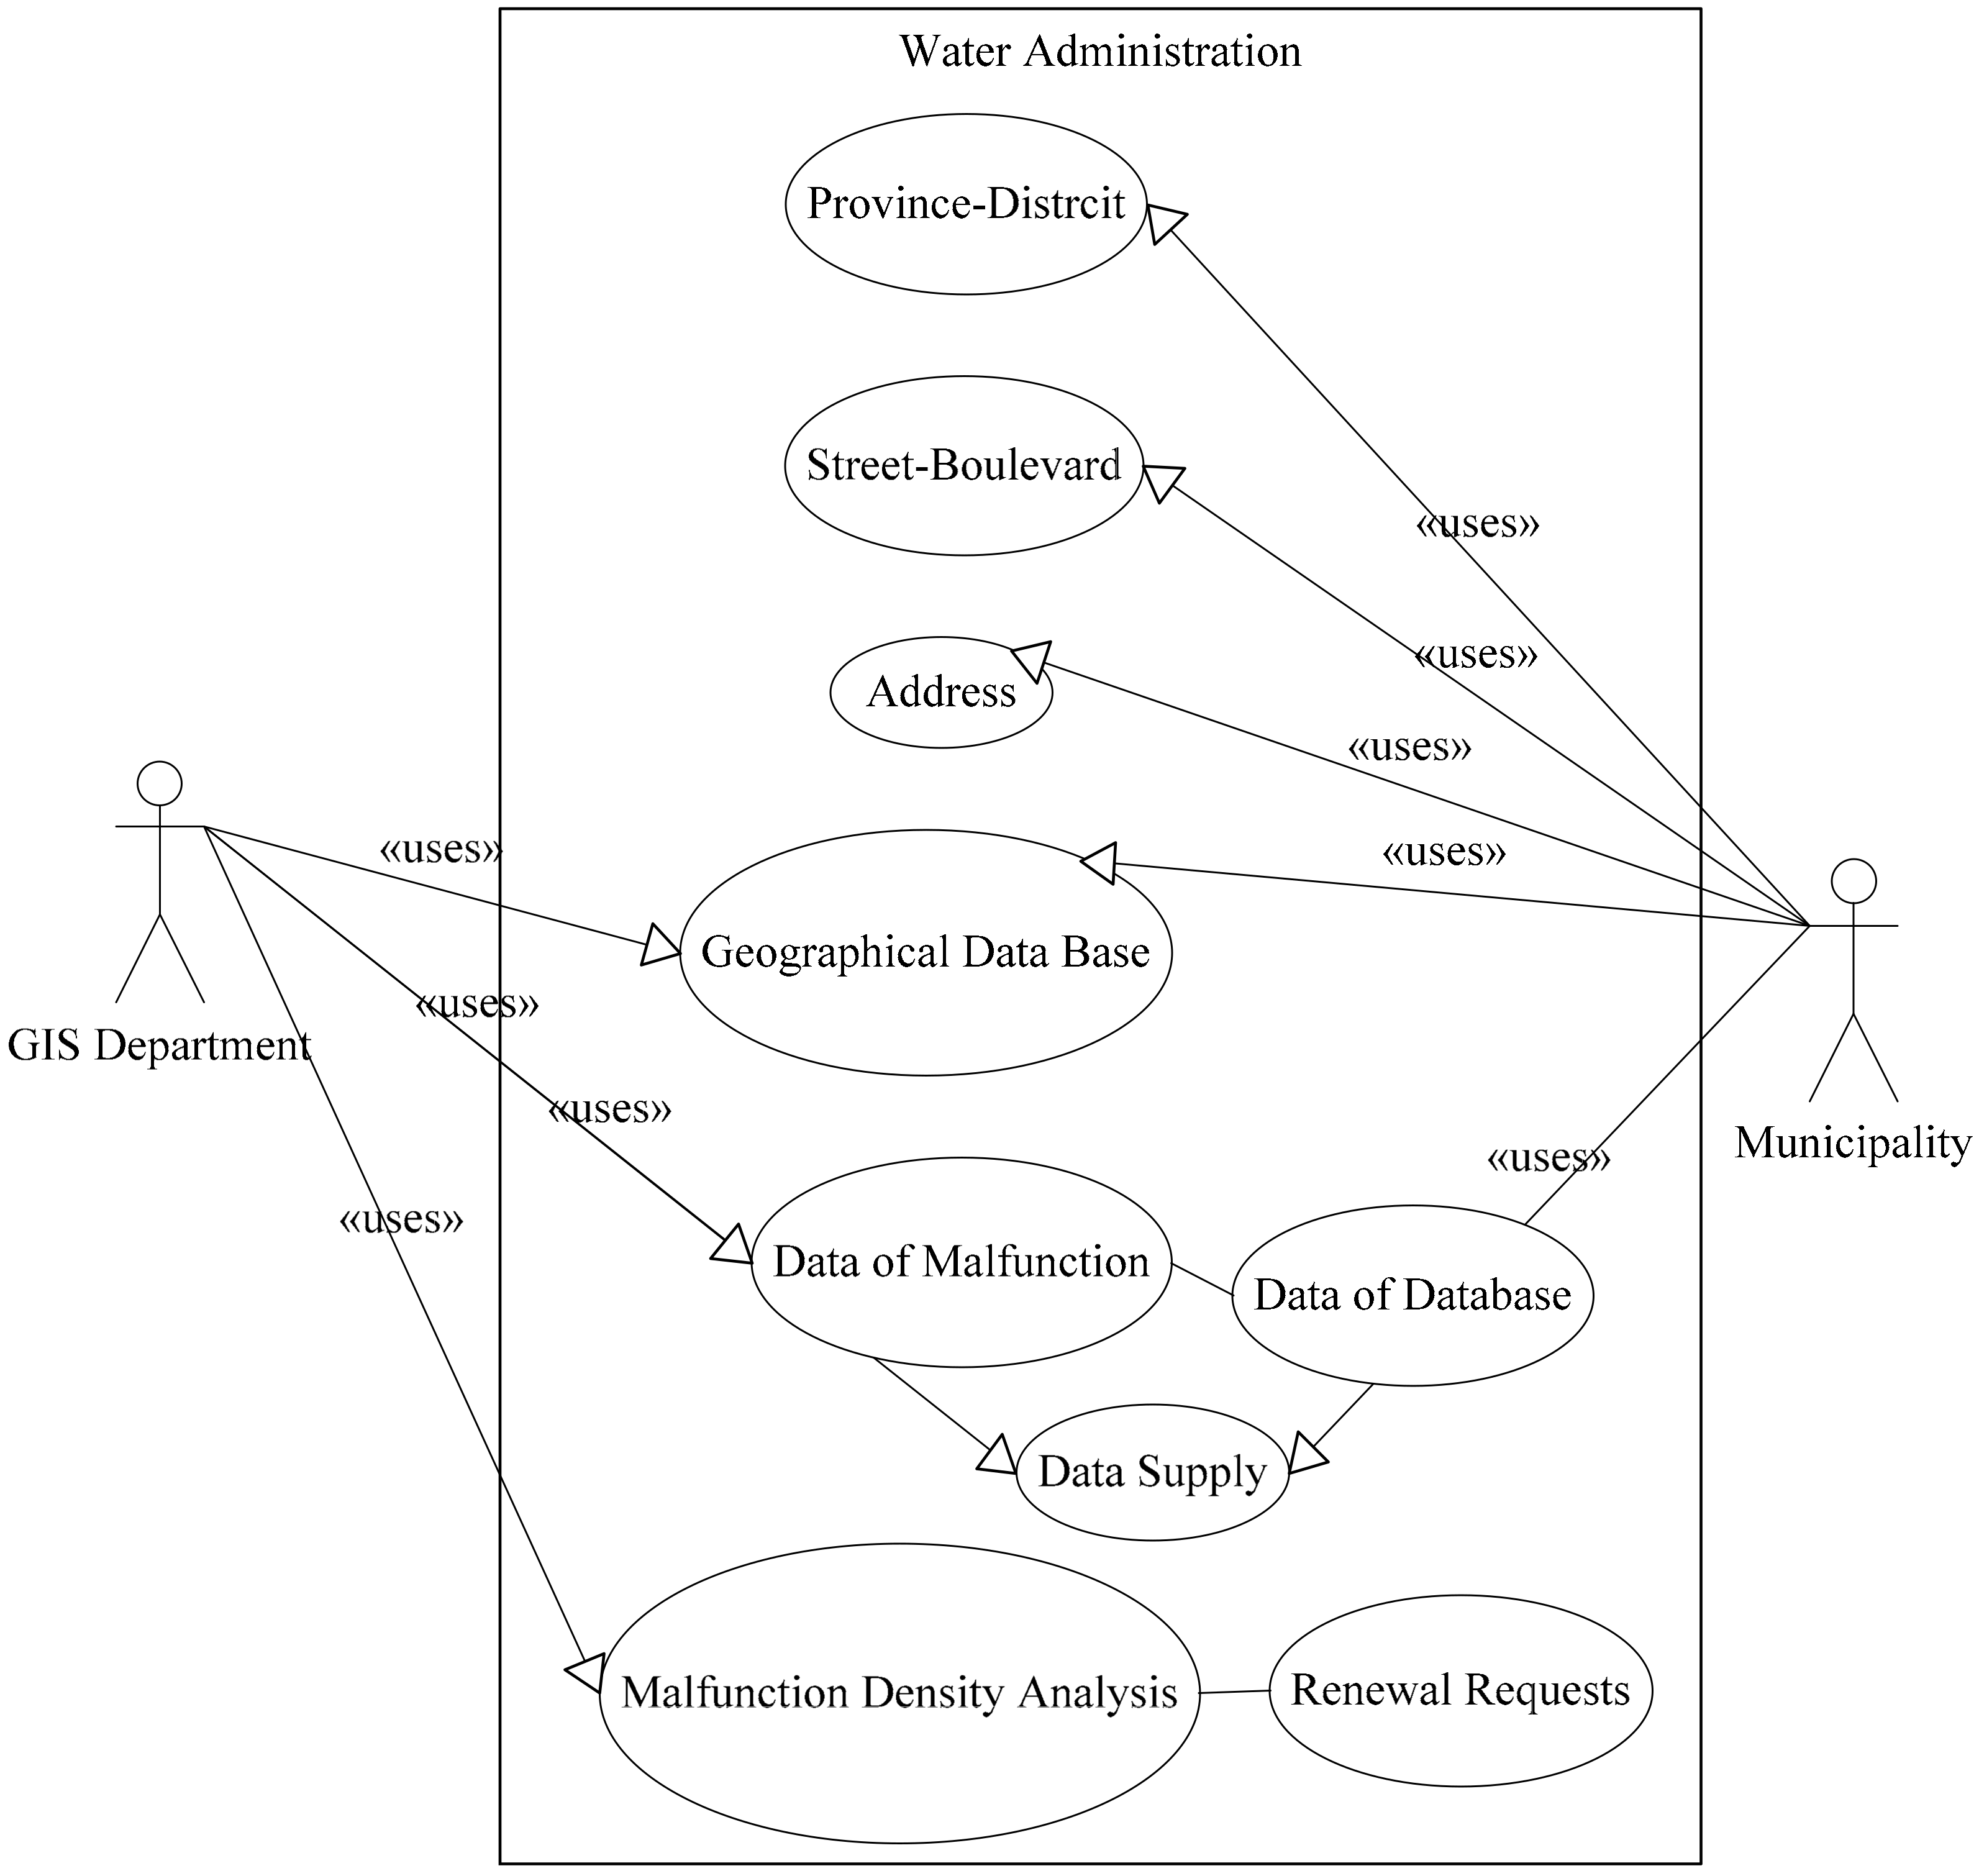
Use-case diagrams are diagrams that explain how the system works and what actions it carries out from the perspective of another observer. The main benefits provided by use-case diagrams can be listed as identifying the characteristics that determine the system, better defining the consumer-related parts of the software by software developers and creating examples for testing the software.
A usage scenario was created for the study and is presented in Figure 6. The data and stakeholders in these processes are also modelled. This diagram contains district, neighbourhood, road/street and street address data as well as infrastructure and failure data for the Trabzon Drinking Water Geographic Information System (TISCBS). The exact malfunction location coordinates to be obtained after the establishment of the information system has also taken its place as a data set in the system. Defects, complaints and malfunctions in maintenance/repair work that occur over time can be stored in the information system together with their spatial data. According to the diagram, it may also be necessary to renew the drinking water infrastructure by performing a failure density analysis.
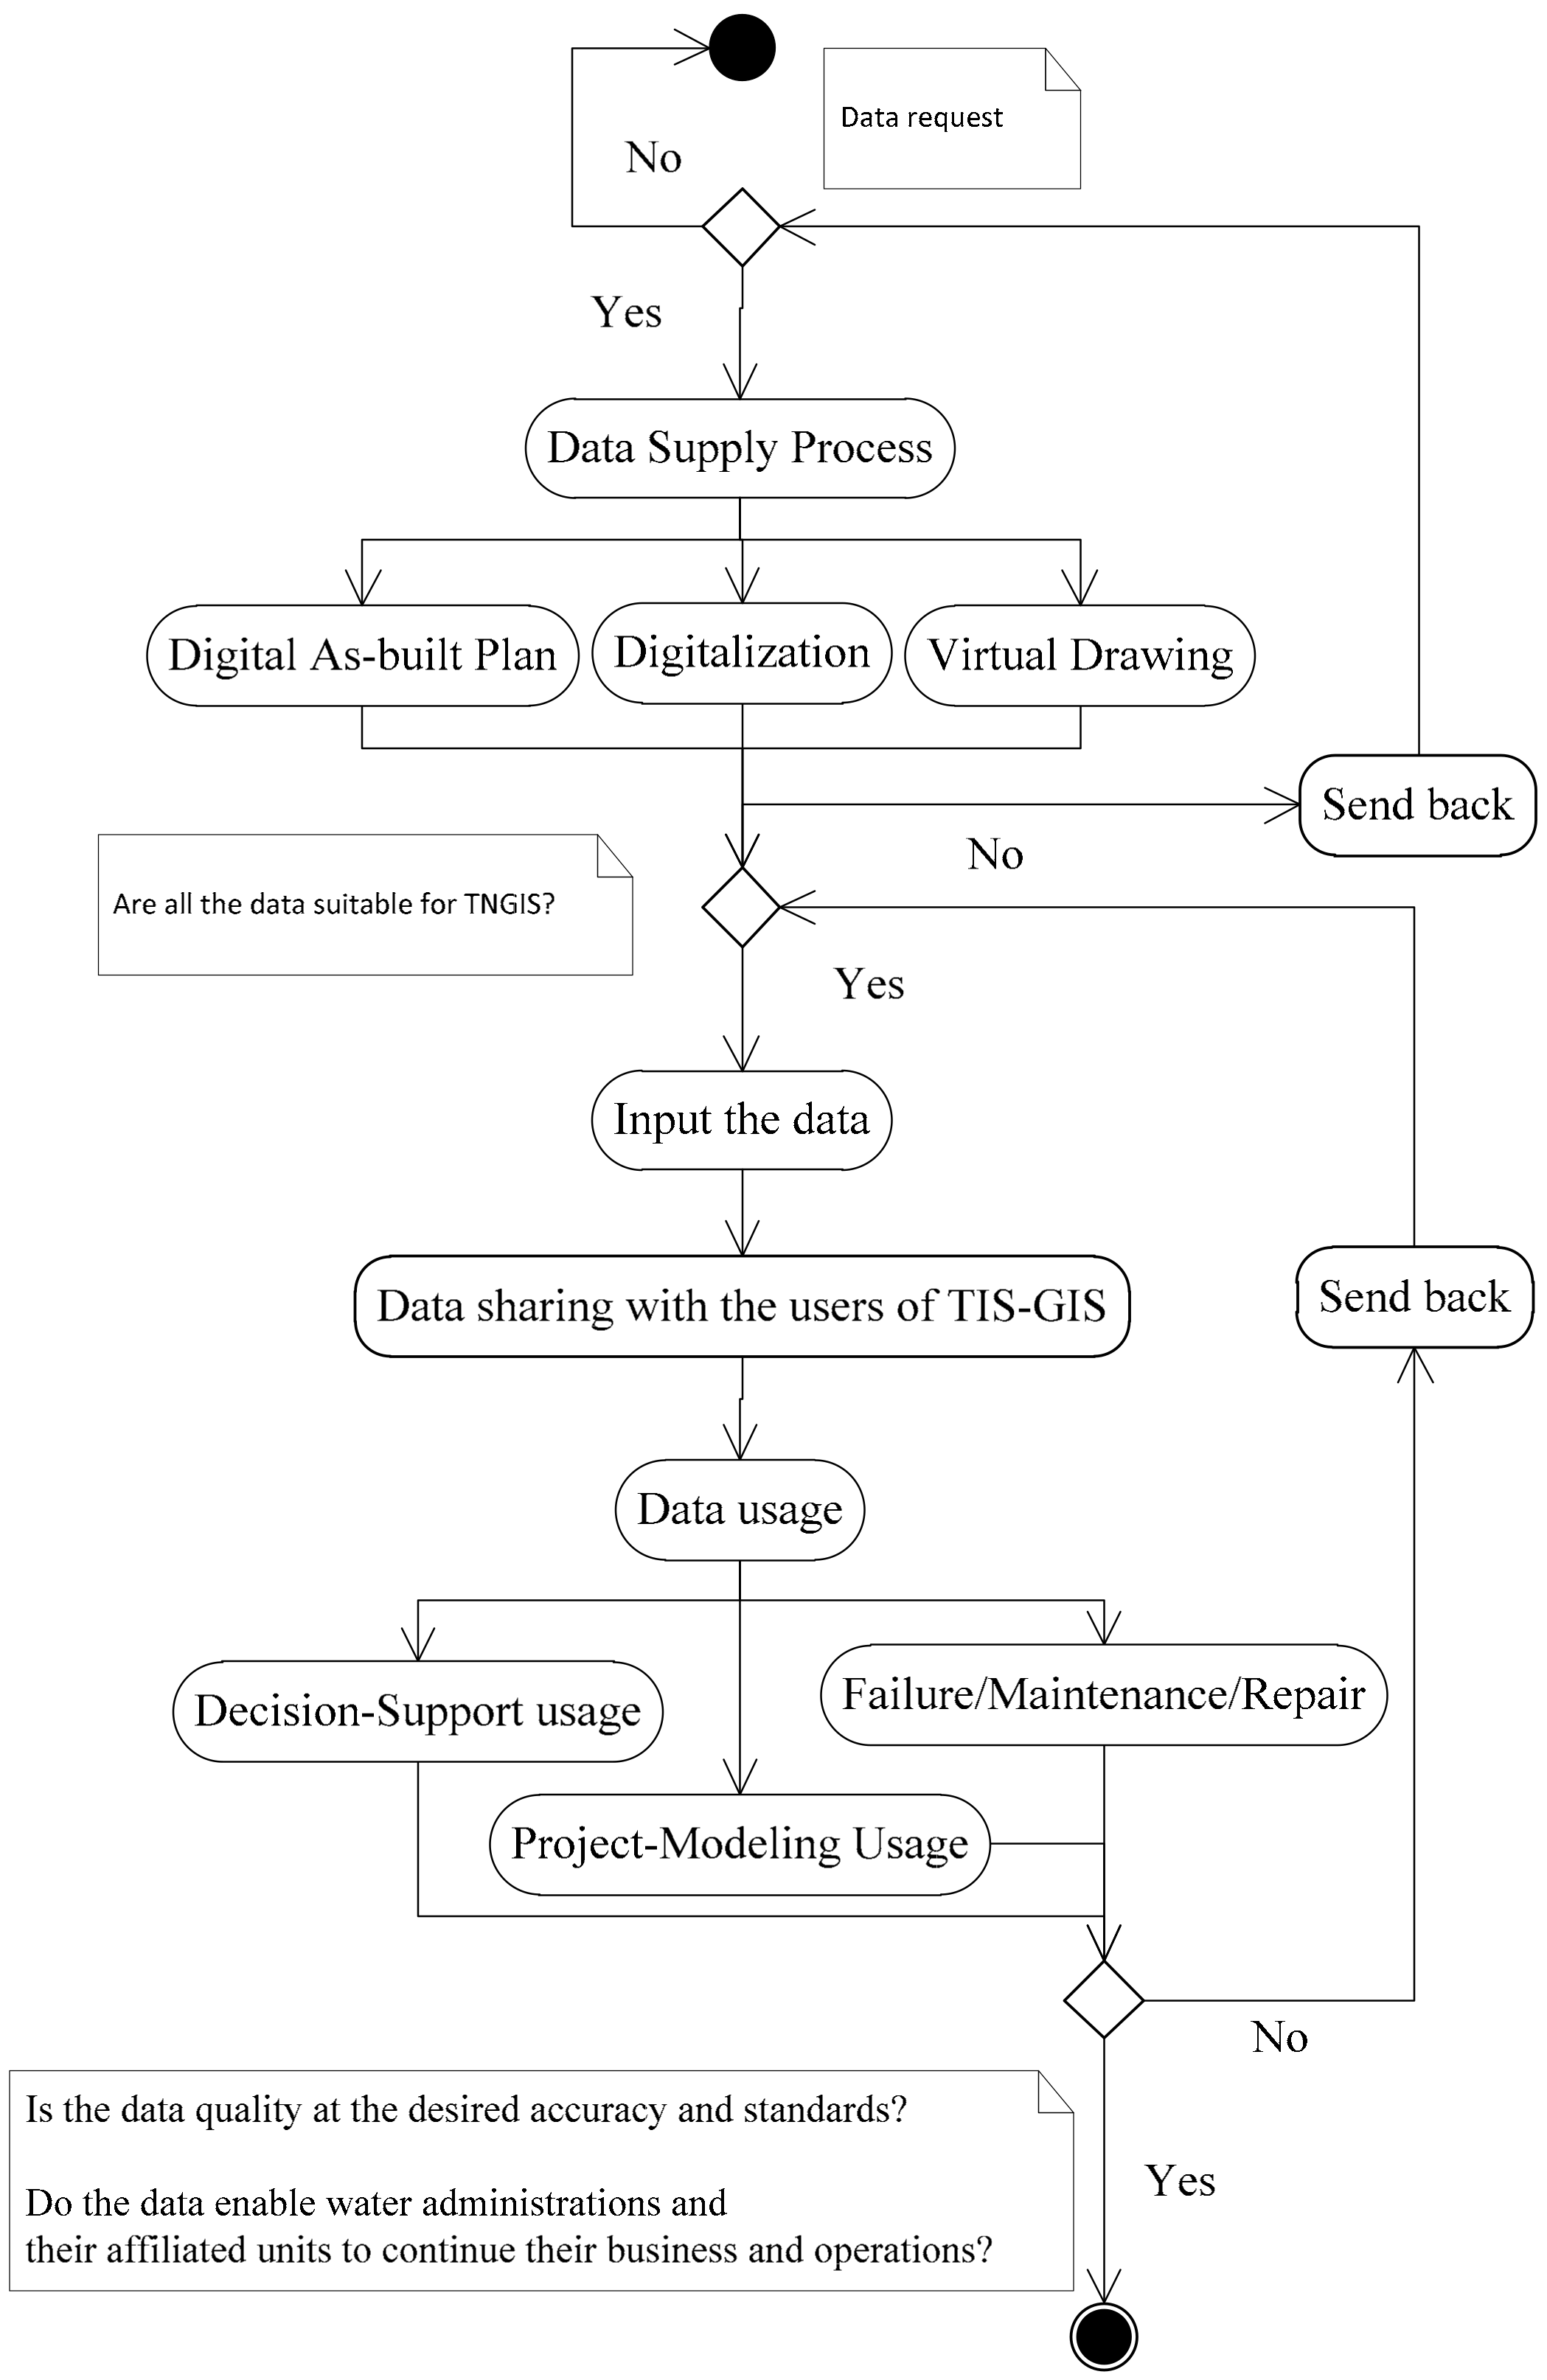
An activity diagram, one of the UML diagram types, is used to describe the sequence of activities in the process [56]. The UML activity diagram visualized for this study is presented in Figure 7. When a GIS for drinking water infrastructure is considered through this diagram, if the requested data is available as a result of the data request, the process is completed in a short time. If the requested data is not available, the necessary data can be acquired thanks to some steps. Data can be obtained through digital business plans, digitization or virtual drawing methods. The current data can be used for decision-support, project-modelling and failure/maintenance/repair.
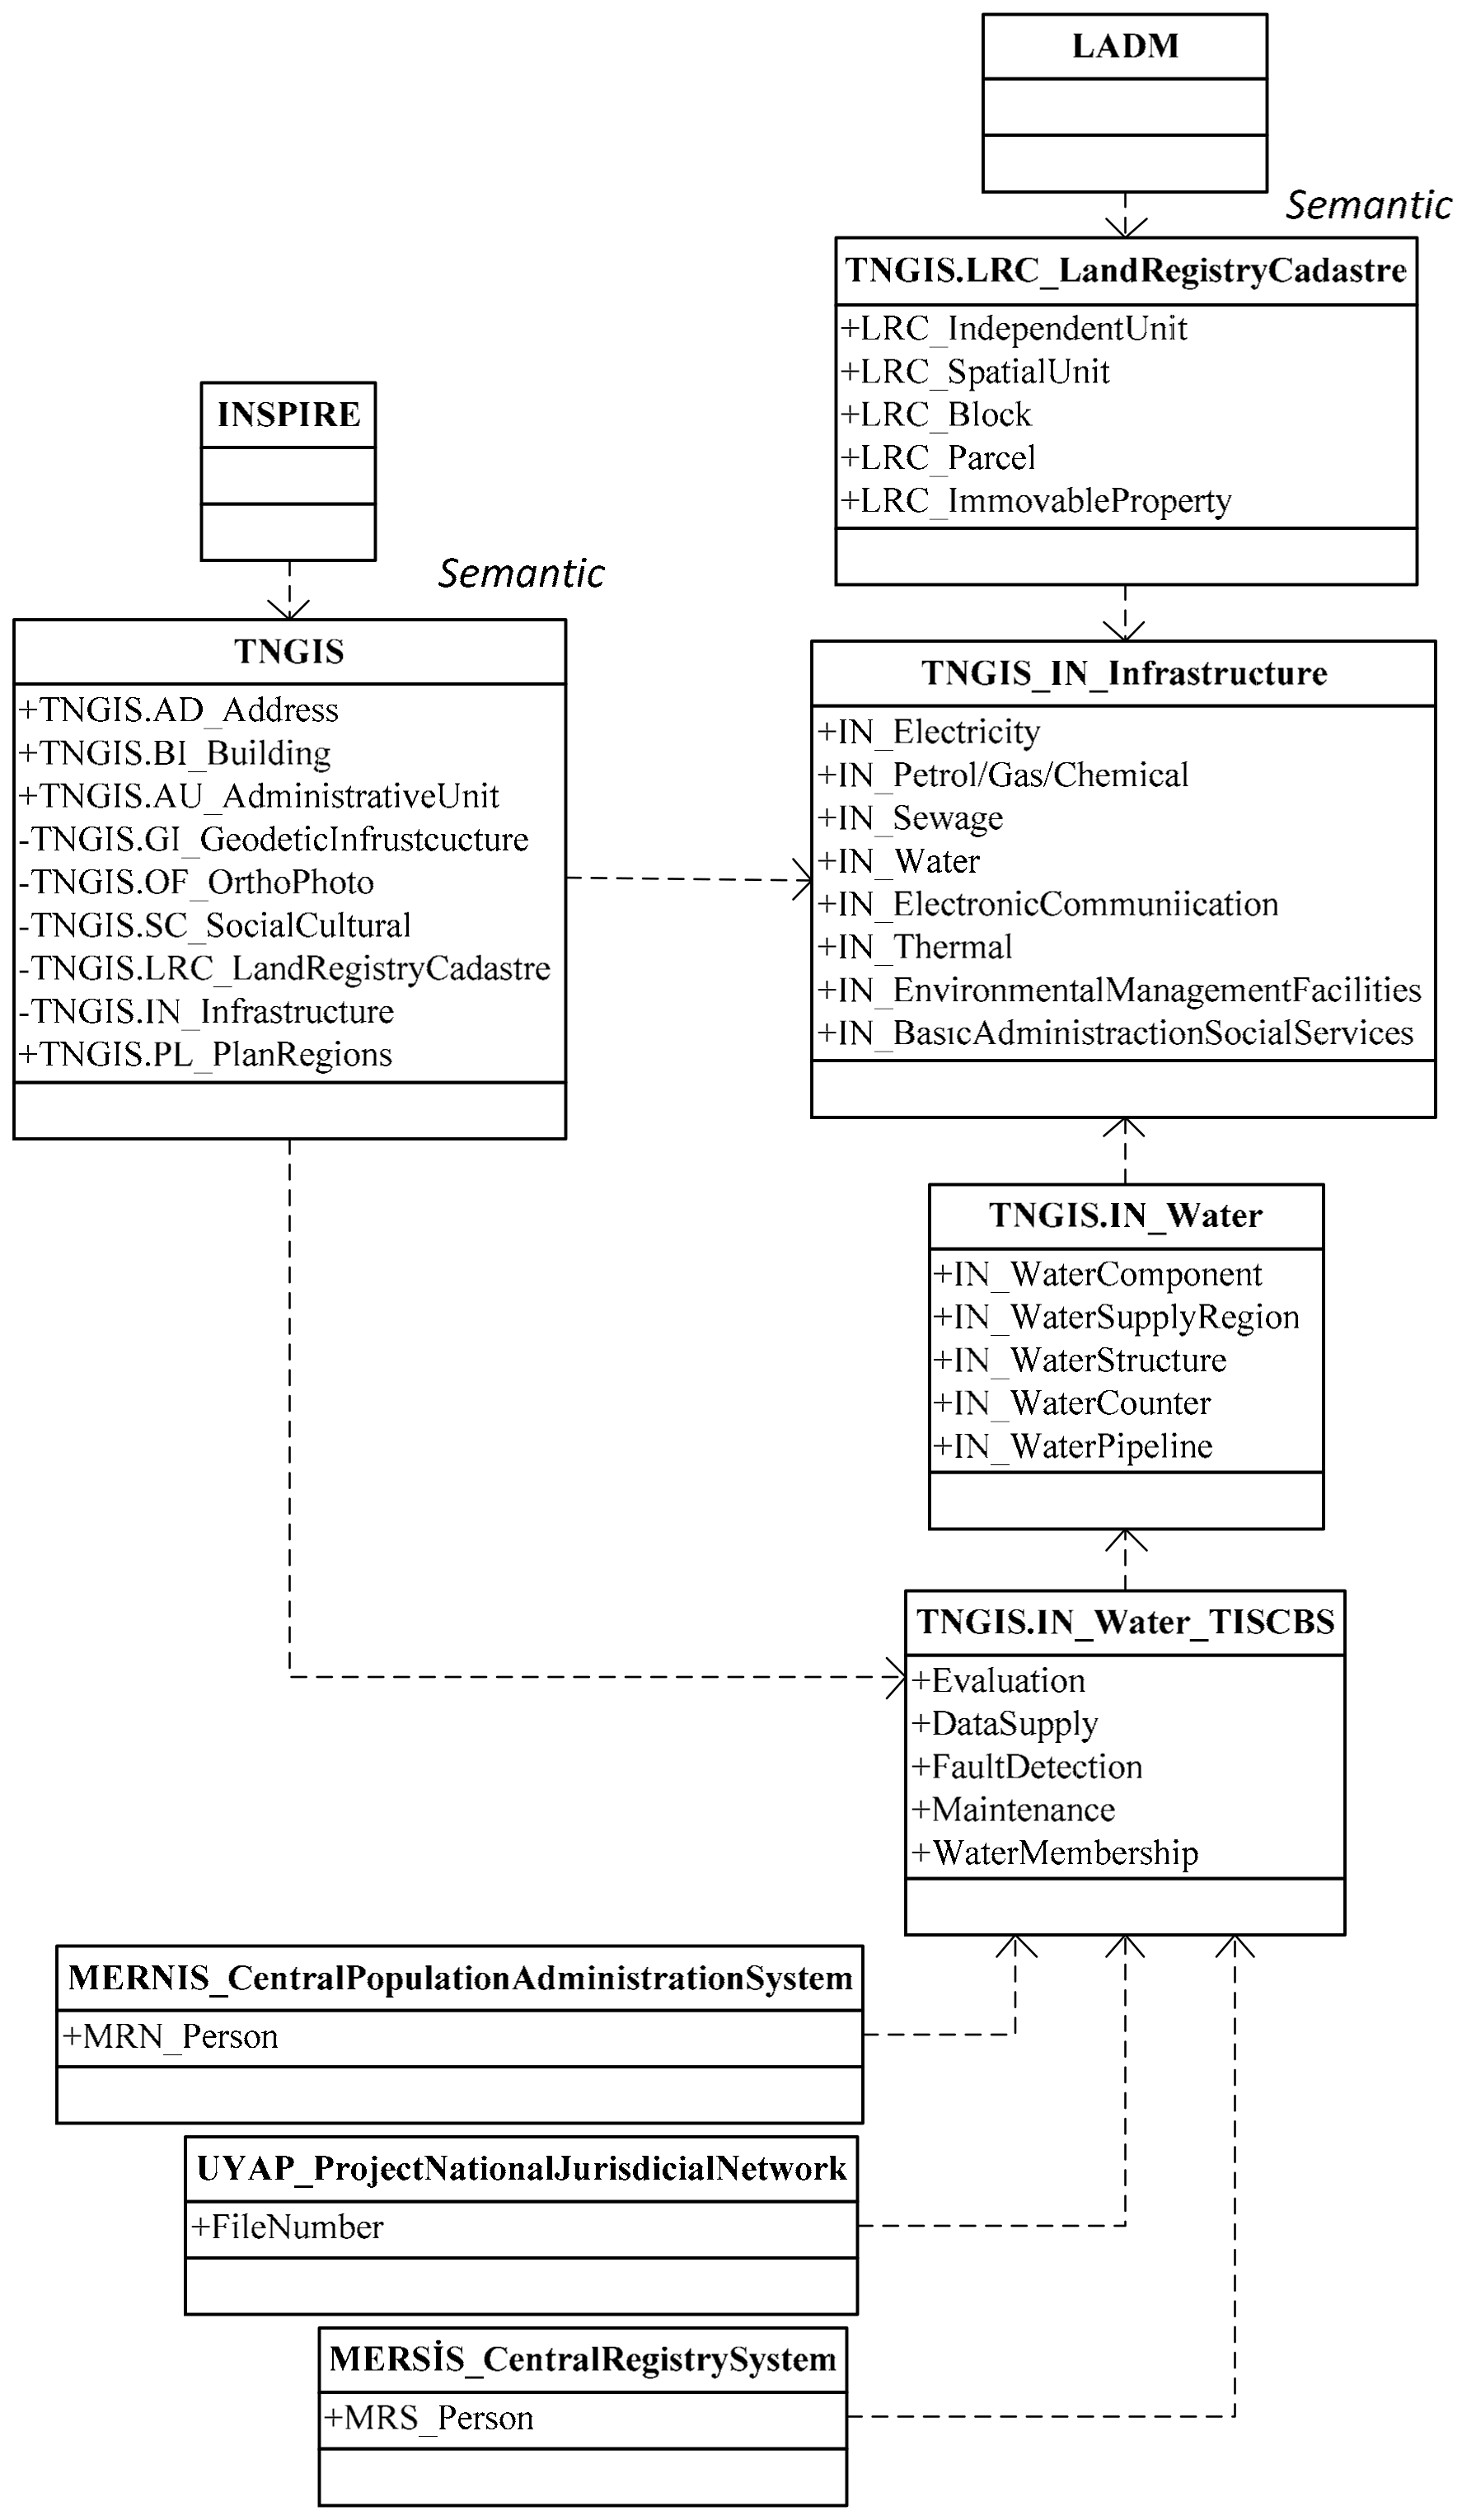
Which data sets are included in the designed TISCBS model and their representation are important and are illustrated in Figure 8 using the package diagram. It is important to develop data sets in an integrated structure with ISO and INSPIRE standards and TNGIS data themes [57]. TISCBS was designed especially based on the “TNGIS.IN_Infrastructure” data theme. “TNGIS.IN_Water_TISCBS” Model data sets, in an integrated structure with LADM, INSPIRE and ISO standards and TNGIS data themes, are given below.
UML class diagram is used to define object types within a system and their relationships with each other. In the classes designed in the system; the LRC_ prefix represents the relationship of the data produced by GDLRC with the designed system, and the class with the IN_ prefix, another prefix, represents a class related to infrastructure data. TNGIS_AD class is the address theme and is the definition of a piece of land or building that is subject to ownership in terms of its geographical location and function. The MRN_ prefix is the class that shows the data obtained from the MERNİS project of the General Directorate of Population and Citizenship Affairs, and the MERSİS_ prefix is the data obtained from MERSİS, the Central Registry System of the Ministry of Customs and Trade [25]. TNGIS.IN_Water shows the class belonging to the water sub-theme under the Infrastructure theme. Classes other than these classes are the classes related to the data produced by TISCBS. The relationships of all these classes with each other and the characteristics of the relationship type are shown in the diagram below. In this representation, the presence of multiplicity expressions (such as 0…1, *, 0) and the relationships of the classes with each other are shown in Figure 9.
Classes within the TNGIS LRC theme and Address theme and classes under the Infrastructure theme are discussed together. Drinking water information systems should be managed within a geographical information system, taking into account address, land registry and cadastral data. The land object, which is the basic component of land management, and the water network under the TNGIS Infrastructure data theme are discussed together. “WaterMembership” class is defined as the class that includes the connection of the people who benefit from the water with the relevant institution, “Evaluation” class is defined as the class that includes the data request. “Data” class is defined as the class that includes the production of data with digital as-built, digitalization and virtual drawing methods. The “FailureDetection” class defines the class that contains information about the water failure that occurs, and the “Maintenance” class defines the class that contains the information and actions that occur during the maintenance/repair process of the drinking water failure. The “FailureType” class contains the type of failure that occurs and is defined through the code list profile. Expressing the “Entity” and “WaterMembership” classes and the relationship between them with numbers is called multiplicity. According to this, if there is one person, there may not be one water consumer or there may be more than one water consumer. At the same time, if there is at least one water membership, there must be at least one person [58,59].

3.3. GIS Database and Its Application Based on Designed UML Model

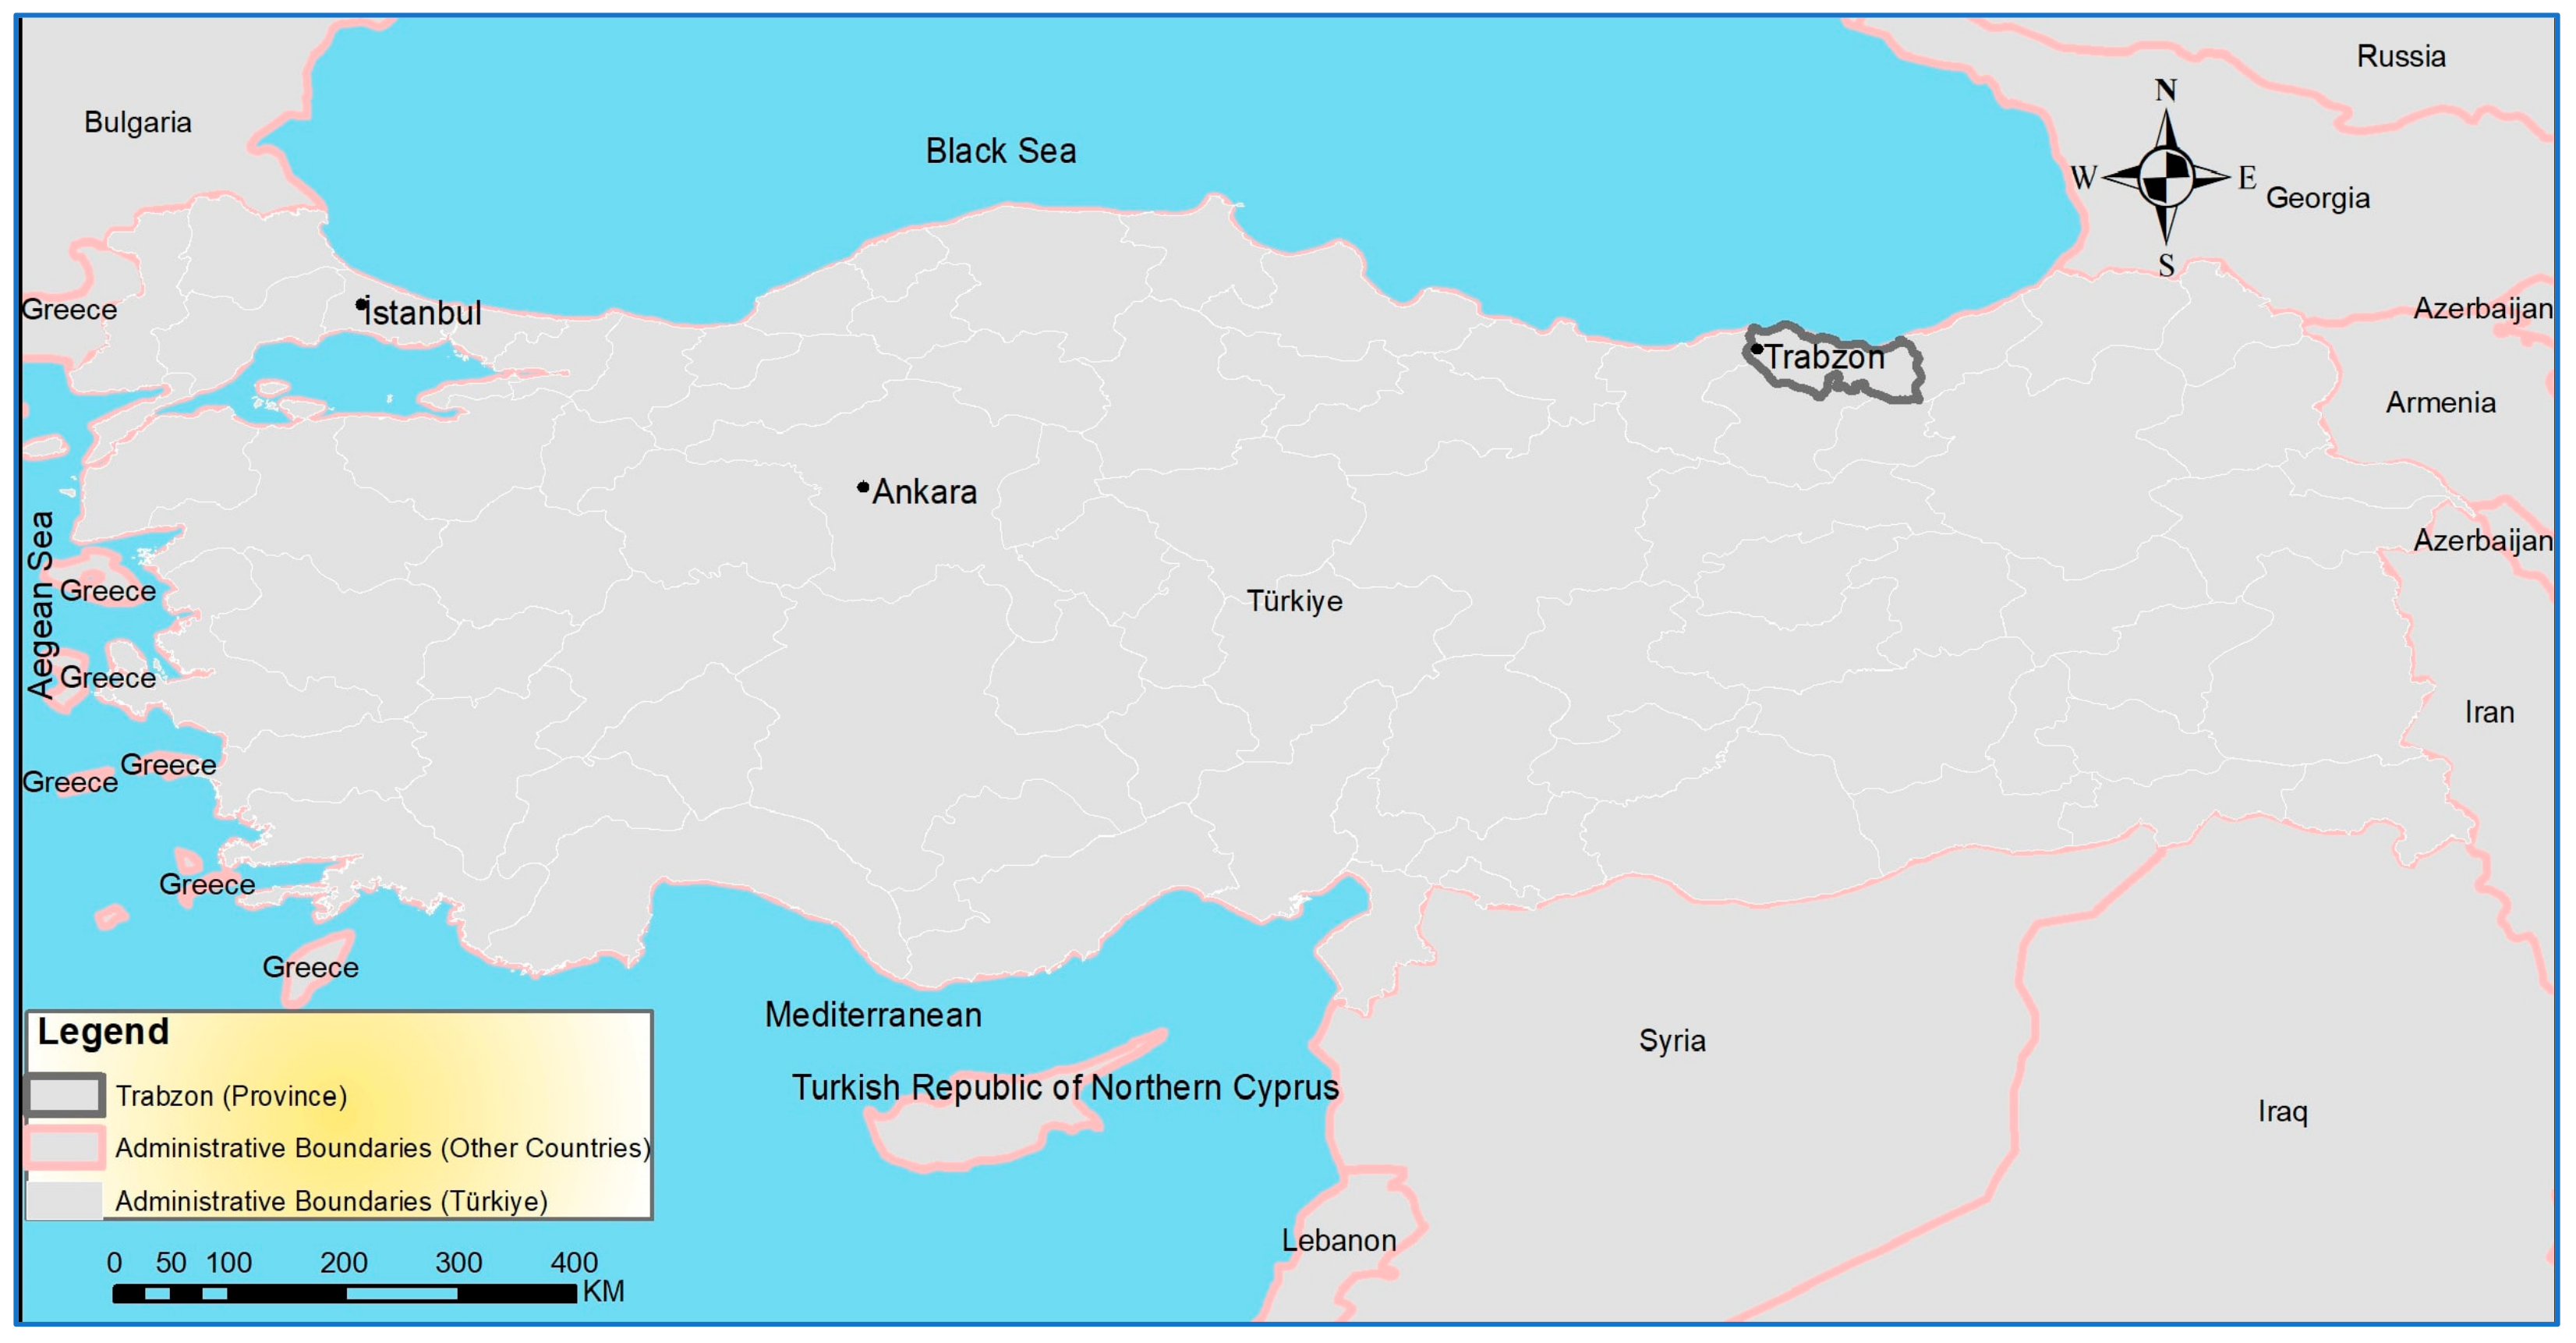
The application of the geographical information system developed in accordance with TNGIS regarding the solution of the problem discussed in this study has been carried out throughout the Trabzon Metropolitan Municipality. Analysis of water consumer data has been carried out in Trabzon’s Pelitli District. As in the model, in practice, the classes within the TNGIS Cadastre theme and Address theme and the classes under the Infrastructure theme are handled together. The location map of the application area is presented in Figure 10. A database design was first made with the help of the data model developed before the application. Then, taking into account the existing and obtainable data, the application phase of the developed database began.
Approximately 820,000 people live in Trabzon, which is the study region, and it is known that there are more than 400,000 water memberships. Within the scope of the application, the data of approximately 5300 km of water lines, including 1800 km of transmission lines and 3500 km of network lines throughout Trabzon were obtained. Spatial data for approximately 2000 water tanks associated with the lines was also provided. Apart from infrastructure data, neighbourhood borders, road/street data and water consumer structure data of the study area were obtained. In the application, failure/malfunction data of the Pelitli neighbourhood, which was determined as the study sub-region, was also used.
In addition to the geographical data provided, non-spatial data to be included in the database design was also obtained in order to be used in positional and non-spatial queries [60]. Thus, drinking water lines, tanks, street data, building data and failure data can be queried and reported. With the study, spatial and temporal density maps of failure data can also be prepared.
After the non-spatial data of the geographical data were transferred to the database, a GIS database suitable for spatial analysis and query was created. Information such as the type of lines, diameter, type, pressure, data source, production date, from which warehouse they are fed and in which neighbourhood they are located were added into GIS presented in Figure 11.
In practice, water failure detection teams transfer the spatial data of failure points to the geographical database containing drinking water infrastructure data via ArcGIS Desktop 10.8. Similarly, in this study, water failure data was transferred to the GIS database. Thus, location information where maintenance/repair teams go for failure detection and repair and the streets associated with the relevant locations were revealed. In addition to the location data of water failure, the diameter and type of water failure lines and water failure date information can also be transferred to the application. The visual of the GIS application is shown in Figure 12 for spatial data. Thanks to this approach, the geographic information system used can be transformed into a structure that can provide clues on how to prioritize malfunctions and possible renewal/maintenance works, rather than merely a structure in which data are catalogued in a smart system.
Thanks to the application, all infrastructure components in the database can be queried. Water tanks, lines and streets belonging to the drinking water infrastructure can be queried according to their non-spatial information. With the application, failure point data and street data can be associated with each other. Streets associated with failure point data can be coloured and sized according to the number of failures. Figure 13 shows water failure street map of the application area.
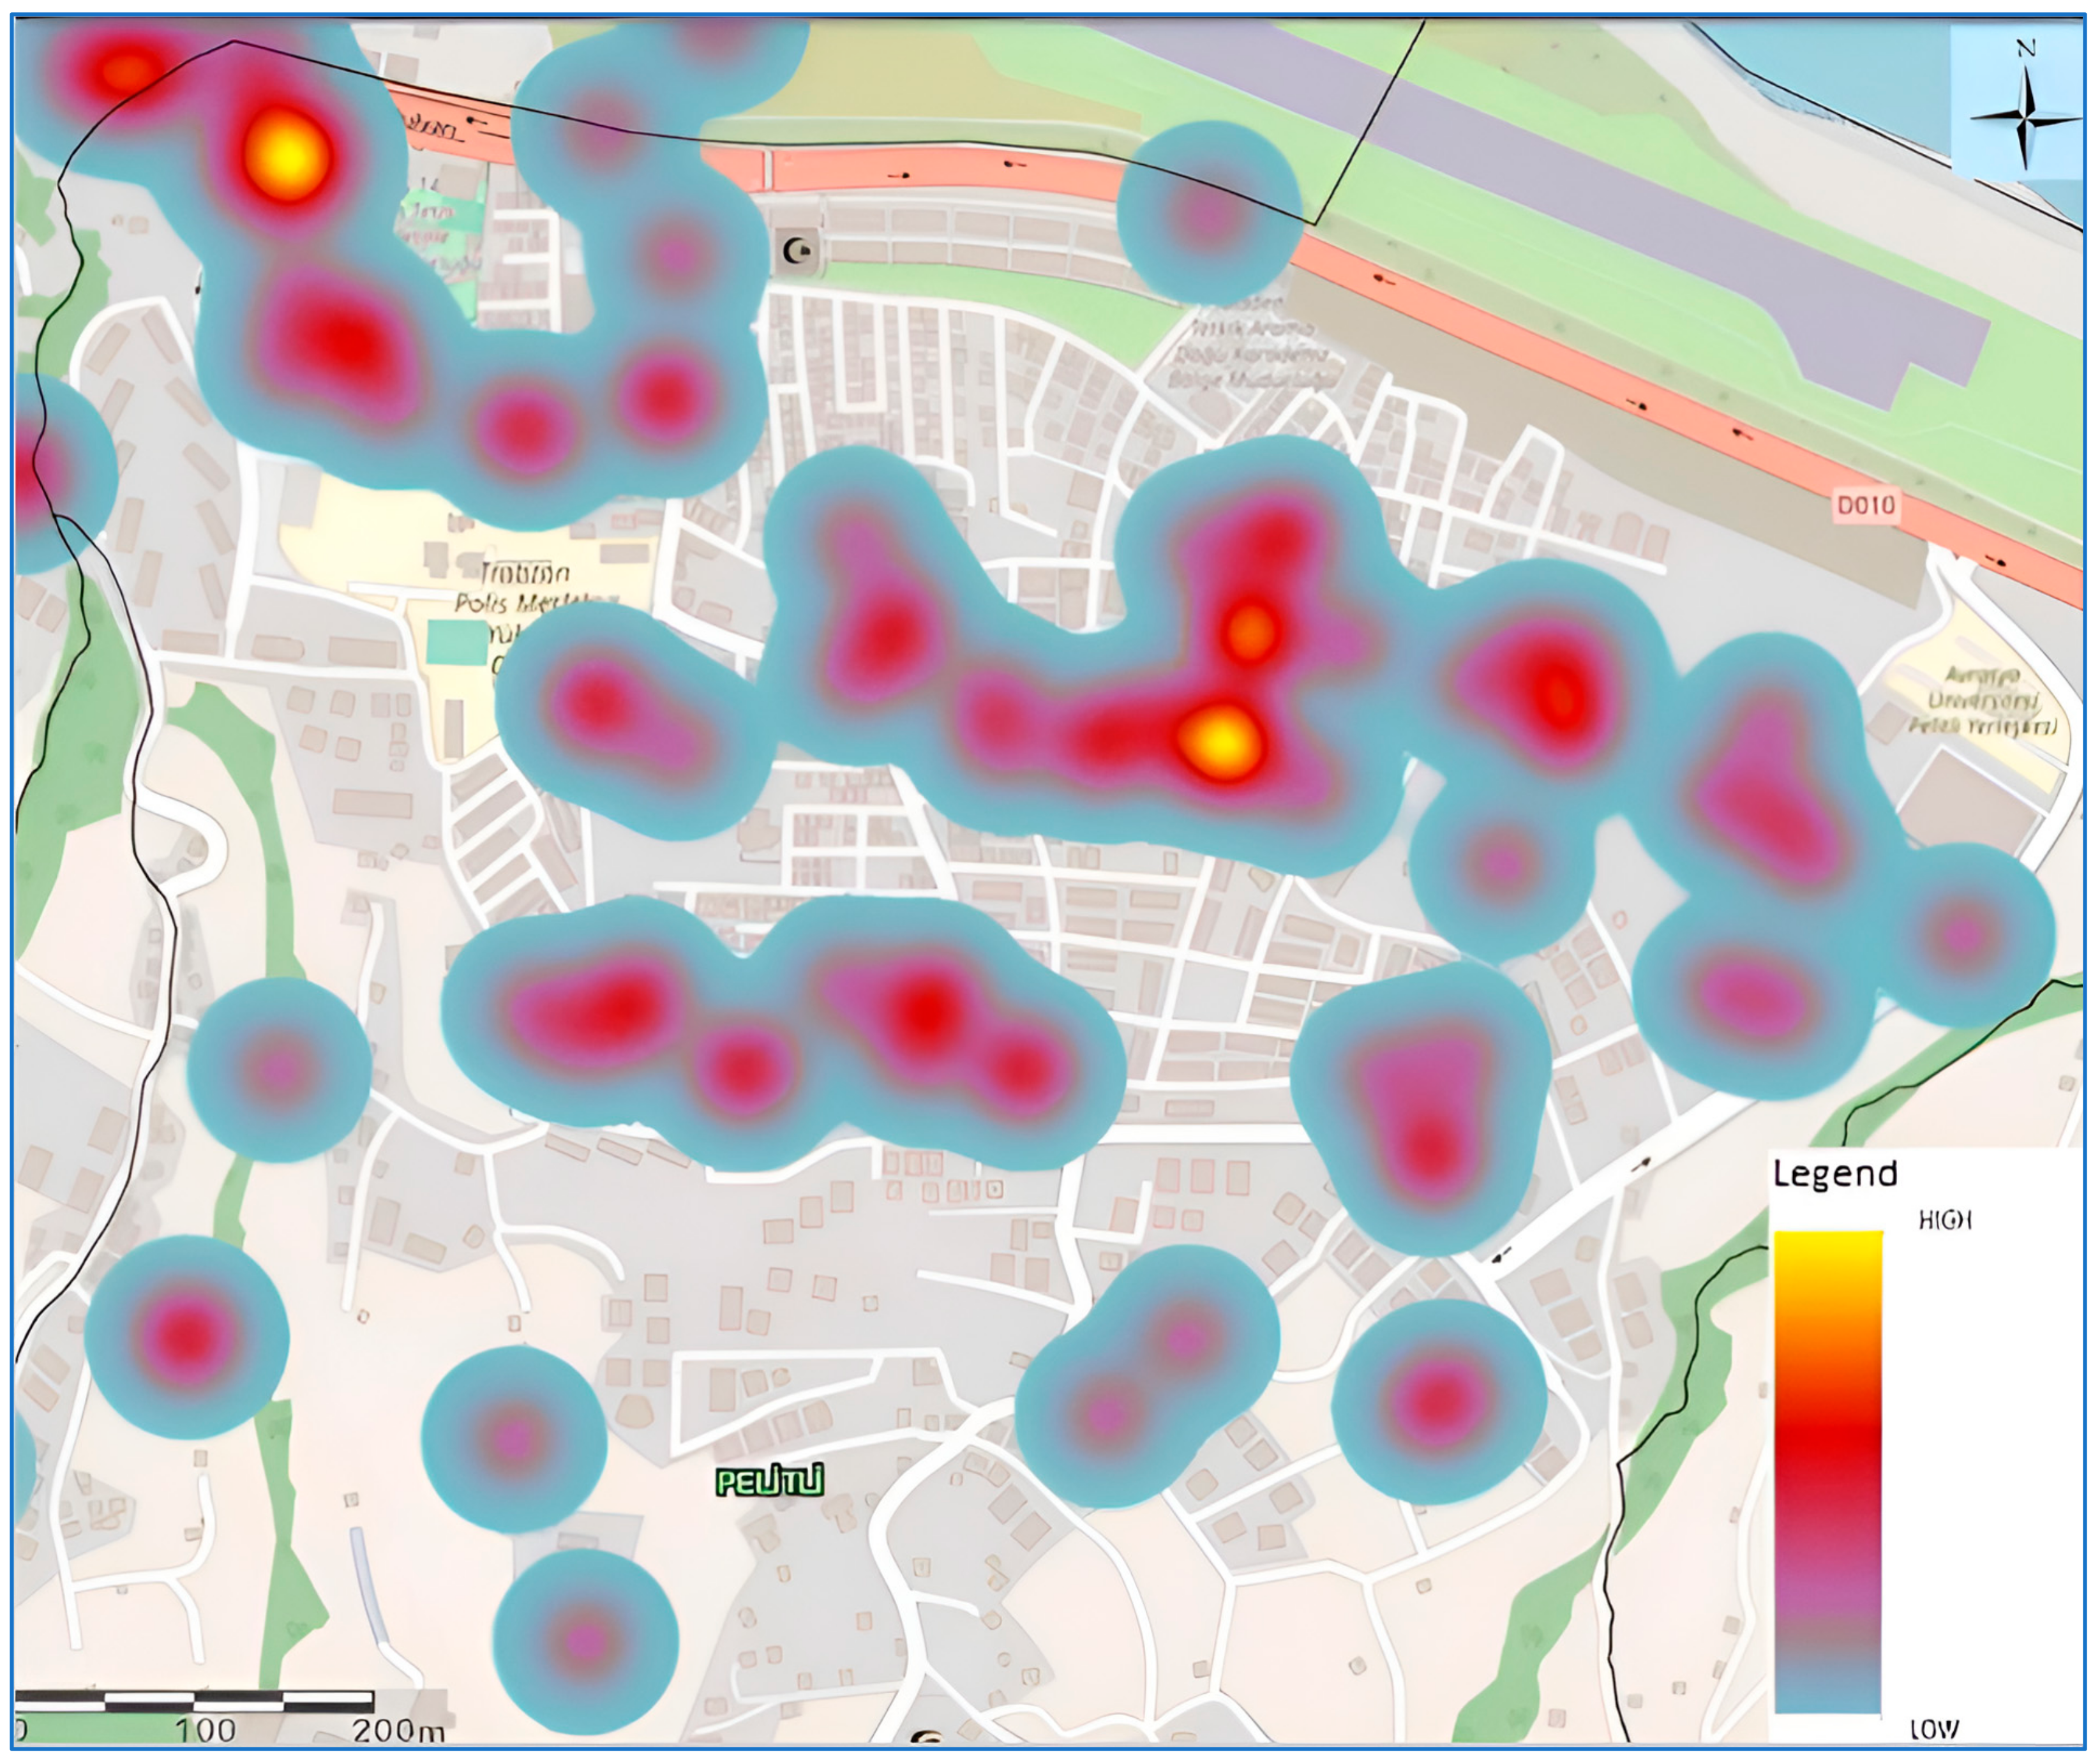
Failure density maps have been created graphically by colouring the failure point data on the map. The failure density map shows where failures are concentrated. The density map provides a better understanding, reading and analysis of data regarding failure frequency. The failure density map of the application area is presented in Figure 14.
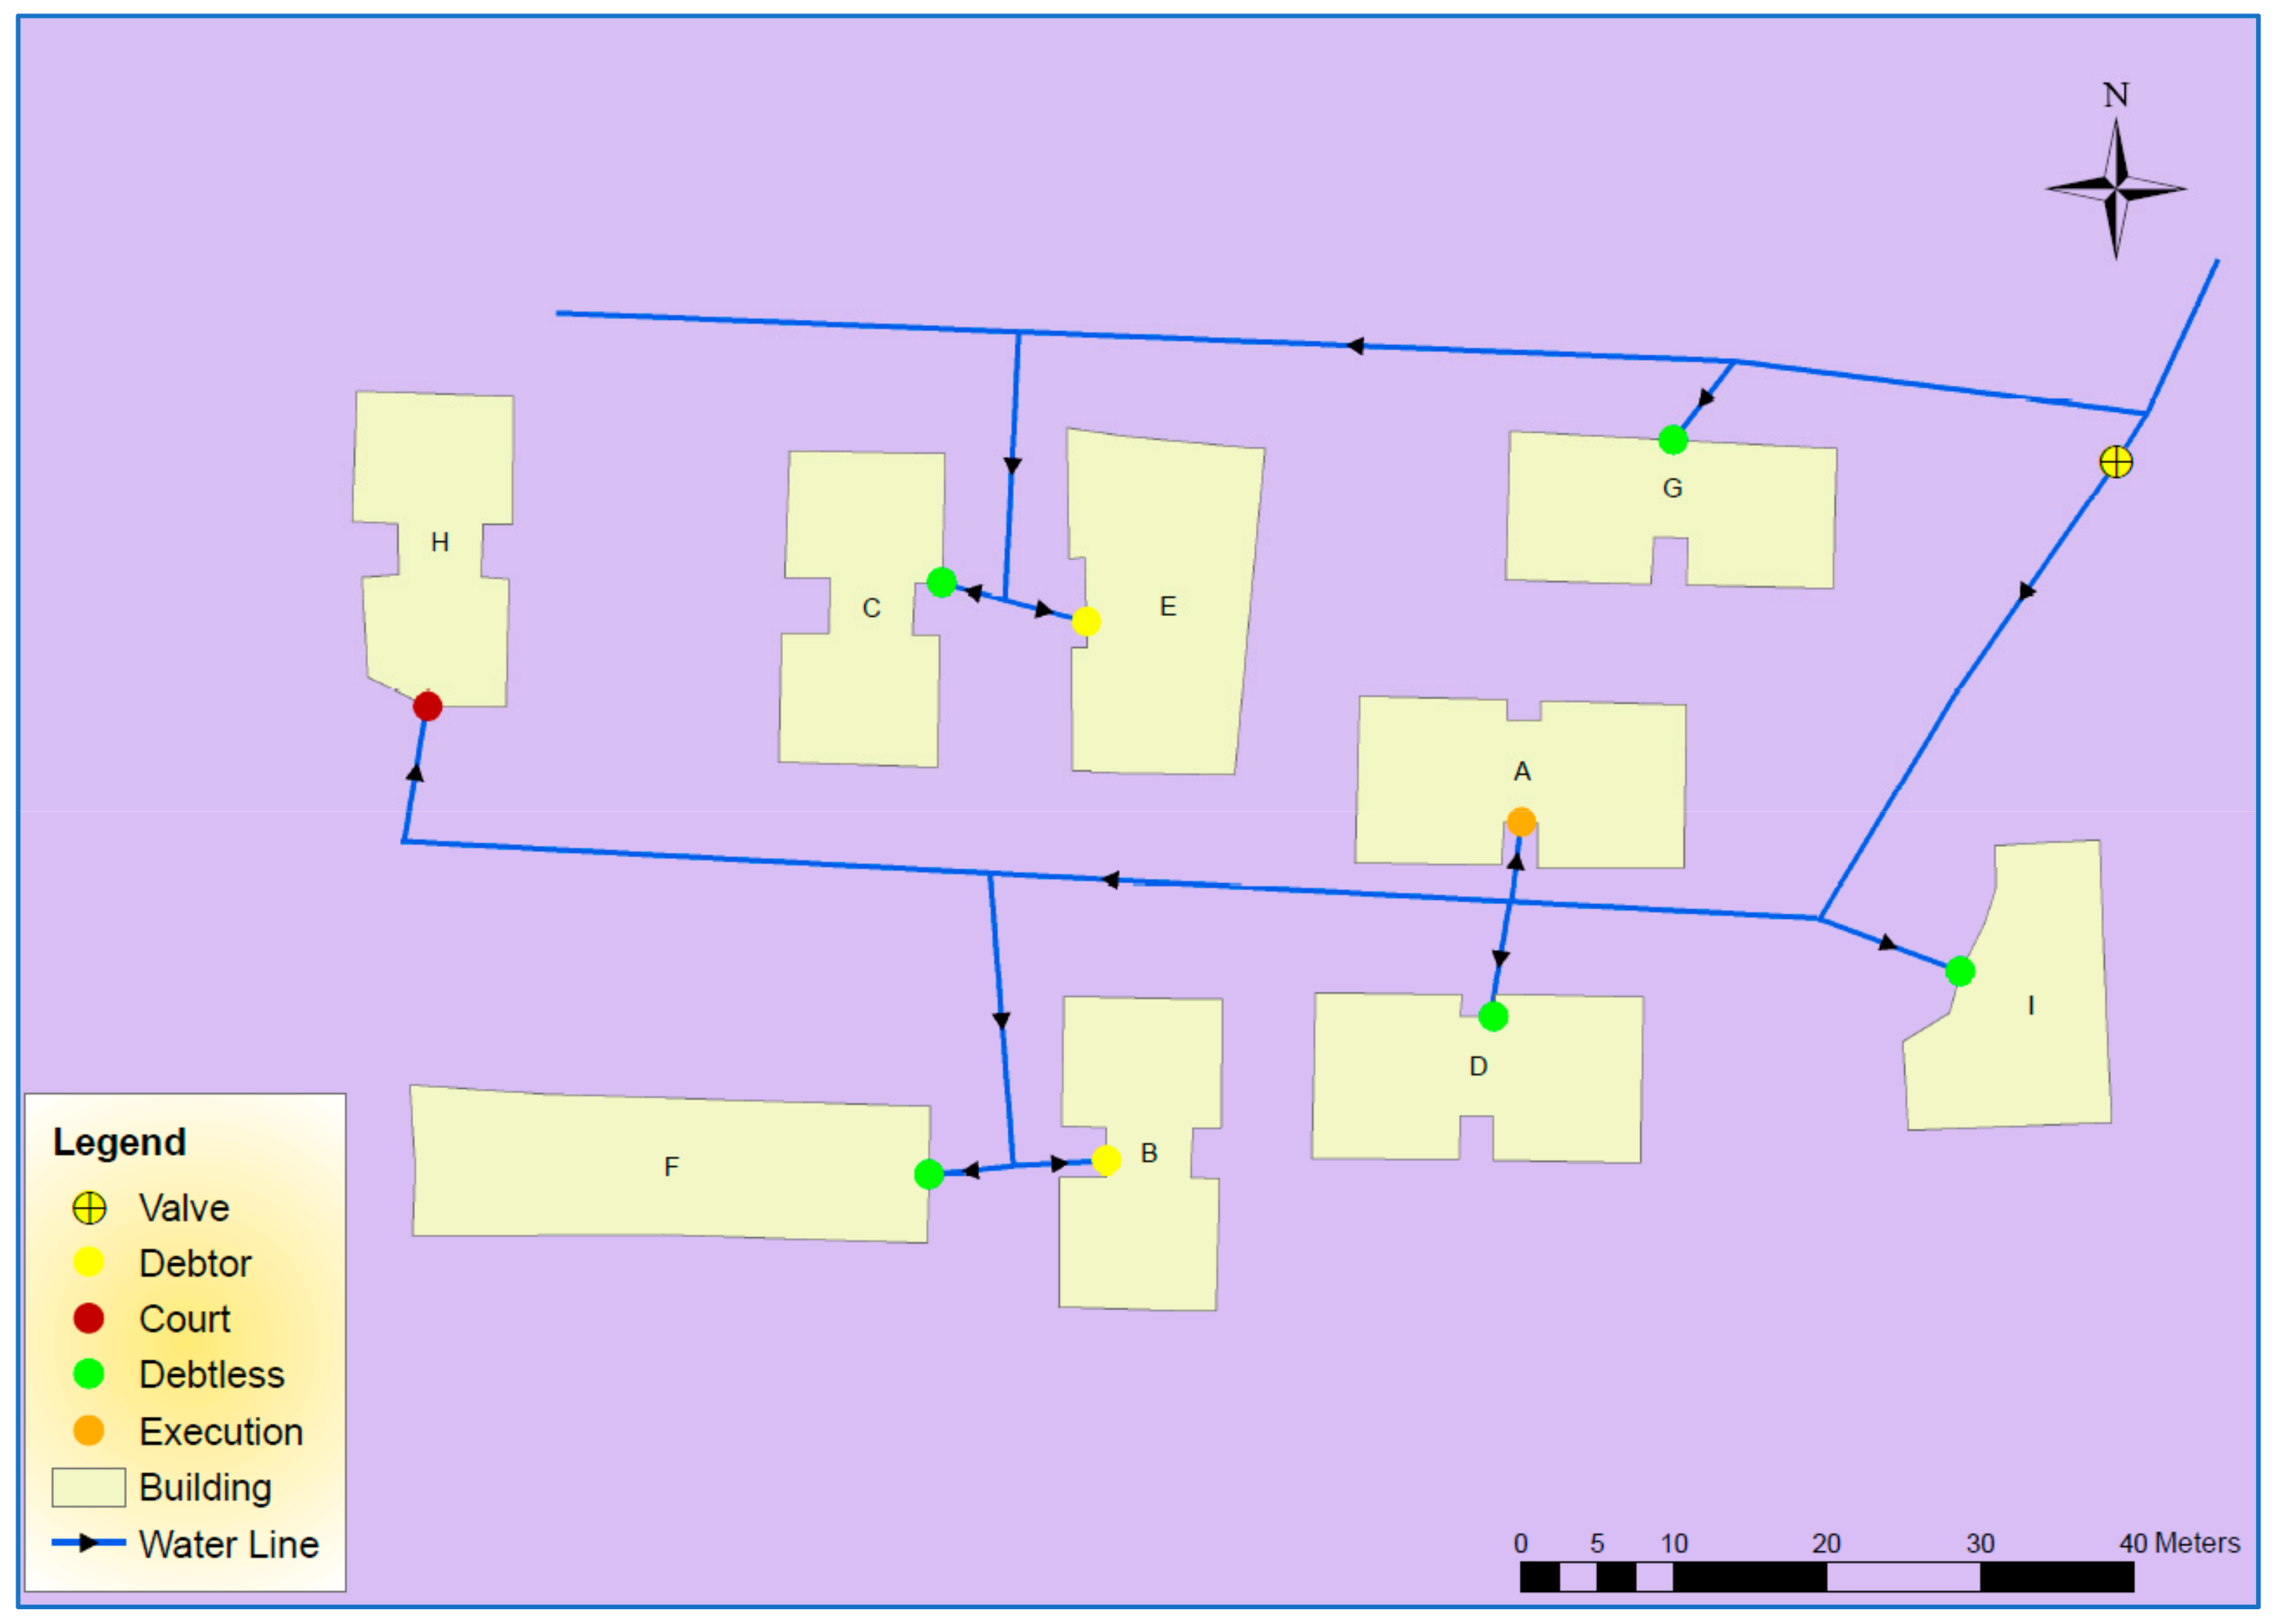
With the application, by using all water components in the transmission of water provided to water consumers, except for infrastructure and fault data; water outage, water consumption, construction year information of water lines and debt status can be queried. Additionally, in case of planned water outages or sudden malfunctions, which structures will be affected can be determined. As seen in Figure 15, in case of detection of damaged water components whose locations are shown with a red dot, the necessity of closing the relevant water valve can be analysed. The water consumers in buildings A, B, D, F, H, I will be affected by the water cut that occurs due to the malfunction, but the water consumers in buildings C, E, G will not be affected. In such a case, there is no need to notify all water consumers in the relevant neighbourhood and to cut off water for all of them. Namely, water cuts will only be made to relevant water consumers.
With the application, in addition to infrastructure, fault and address data, debt status information regarding drinking water membership of water consumers in buildings can be transferred to the system. With the application, debt inquiries can be accessed according to the locational units of each consumer. This situation is presented in Figure 16 using sample data.
Water consumption amounts of sample buildings in the study area can be shown and the wear and tear level of the lines transmitting water to consumers can also be analysed. For this purpose, the construction/manufacturing dates of the water components, which are an indicator, can be taken into consideration. For this purpose, a map has been prepared and presented in Figure 17. In addition to density analysis to detect damaged water components, the application can also create a density map according to the debt payment status of water consumers. With the debt density map, how long payment deadlines are delayed in which districts, neighbourhoods or regions of the whole province can be analysed.

4. Findings and Discussions

Managing the “land asset”, which has become a scarce resource around the world [58], in accordance with the INSPIRE standards developed by the EU [16] and LADM standards developed by the ISO [22] is targeted by world countries, especially developed countries [23]. A similar purpose is also aimed with the combination of the “land registry” and “cadastre” information systems, which have existed for Türkiye since 1990’s. This system, named TNGIS, is going very well in coordination with the e-Türkiye transformation project [26]. The cadastral parcel, called a “land object” by FIG [61], is the basis of all these services in Türkiye. In fact, this approach is based on managing the transition process of cadastral parcels and the other immovable properties, defined as a “land object”, from land registry and cadastral systems to the data model, at certain standards, regardless of the country [62]. In parallel with these international approaches, Türkiye is trying to manage its geographical assets with a geographical data model and web based platforms. As it is known, exemplary e-government applications carried out on a “real estate basis” are extremely effective today. Inter-institutional collaborations are increasing day by day, and all work and transactions continue to be transferred from classical environments to digitals in Türkiye. The number of public services offered through the e-government portal reached 7516 as of December 2023, and the number of mobile services reached 4413. As of the same period, 64.12 million registered users can benefit from these services [28]. Relevant real estate owners, institutions and municipalities can already access some data via e-Türkiye. Municipalities can also carry out similar processes regarding the geographical assets under their responsibility via e-government. This study, which is a municipal service, has been handled within the specified TNGIS standards based on LADM standards and e-government system, completed with the design and application of drinking water geographical information system for the study area.
Superstructure and infrastructure works in Trabzon have intensified, especially in the centre, in connection with the transformation process into a metropolitan municipality in recent years. With the development of the city, there has been an increase in public services such as water, sewage, natural gas and electricity. In this study, the existence and operation of water infrastructure, one of the public services, in the city of Trabzon is discussed. By using the field studies, examined plans and notifications received by the institution (TISKI), which spatial and non-spatial data regarding the drinking water components buried underground are of great importance for manufacturing, construction, maintenance and repair works have been determined.
The drinking water data theme is literally modelled with TNGIS [27]. With this study, a drinking water data model has been developed by taking faults such as damaged water components and consumer data, which are not included in the TNGIS drinking water data model, into account. In addition, the model has been made more understandable with other UML diagrams, namely activity, package and user-state diagrams [63]. Then, various spatial analyses have been carried out in the determined study area, based on the impressions and experiences obtained from the drinking water information system studies in the entire responsibility area of TISKI.
Before establishing a drinking water infrastructure information system, what kind of system would be designed was researched in detail. Classic infrastructural paper maps, which were produced before 2014, and digital maps, which have been produced since the year 2014, are the main data sources. All drinking water infrastructure components in the infrastructure system have been produced from these base maps. Use scenario diagram, activity diagram, package diagram and class diagrams were primarily created with the UML for TISCBS. The model was designed taking the TNGIS.IN_Water class into consideration. Because TNGIS does not include some relevant classes and their information, different classes have also been designed and integrated into the system. In this way, operations such as malfunctions, maintenance/repair, water membership, enforcement proceedings, court processes and consumer notifications can be controlled and followed through the geographical information system.
The entire study was carried out in Trabzon as the pilot region for GIS application. Failure applications of water consumers in the study have been carried out in Trabzon’s Pelitli neighbourhood.
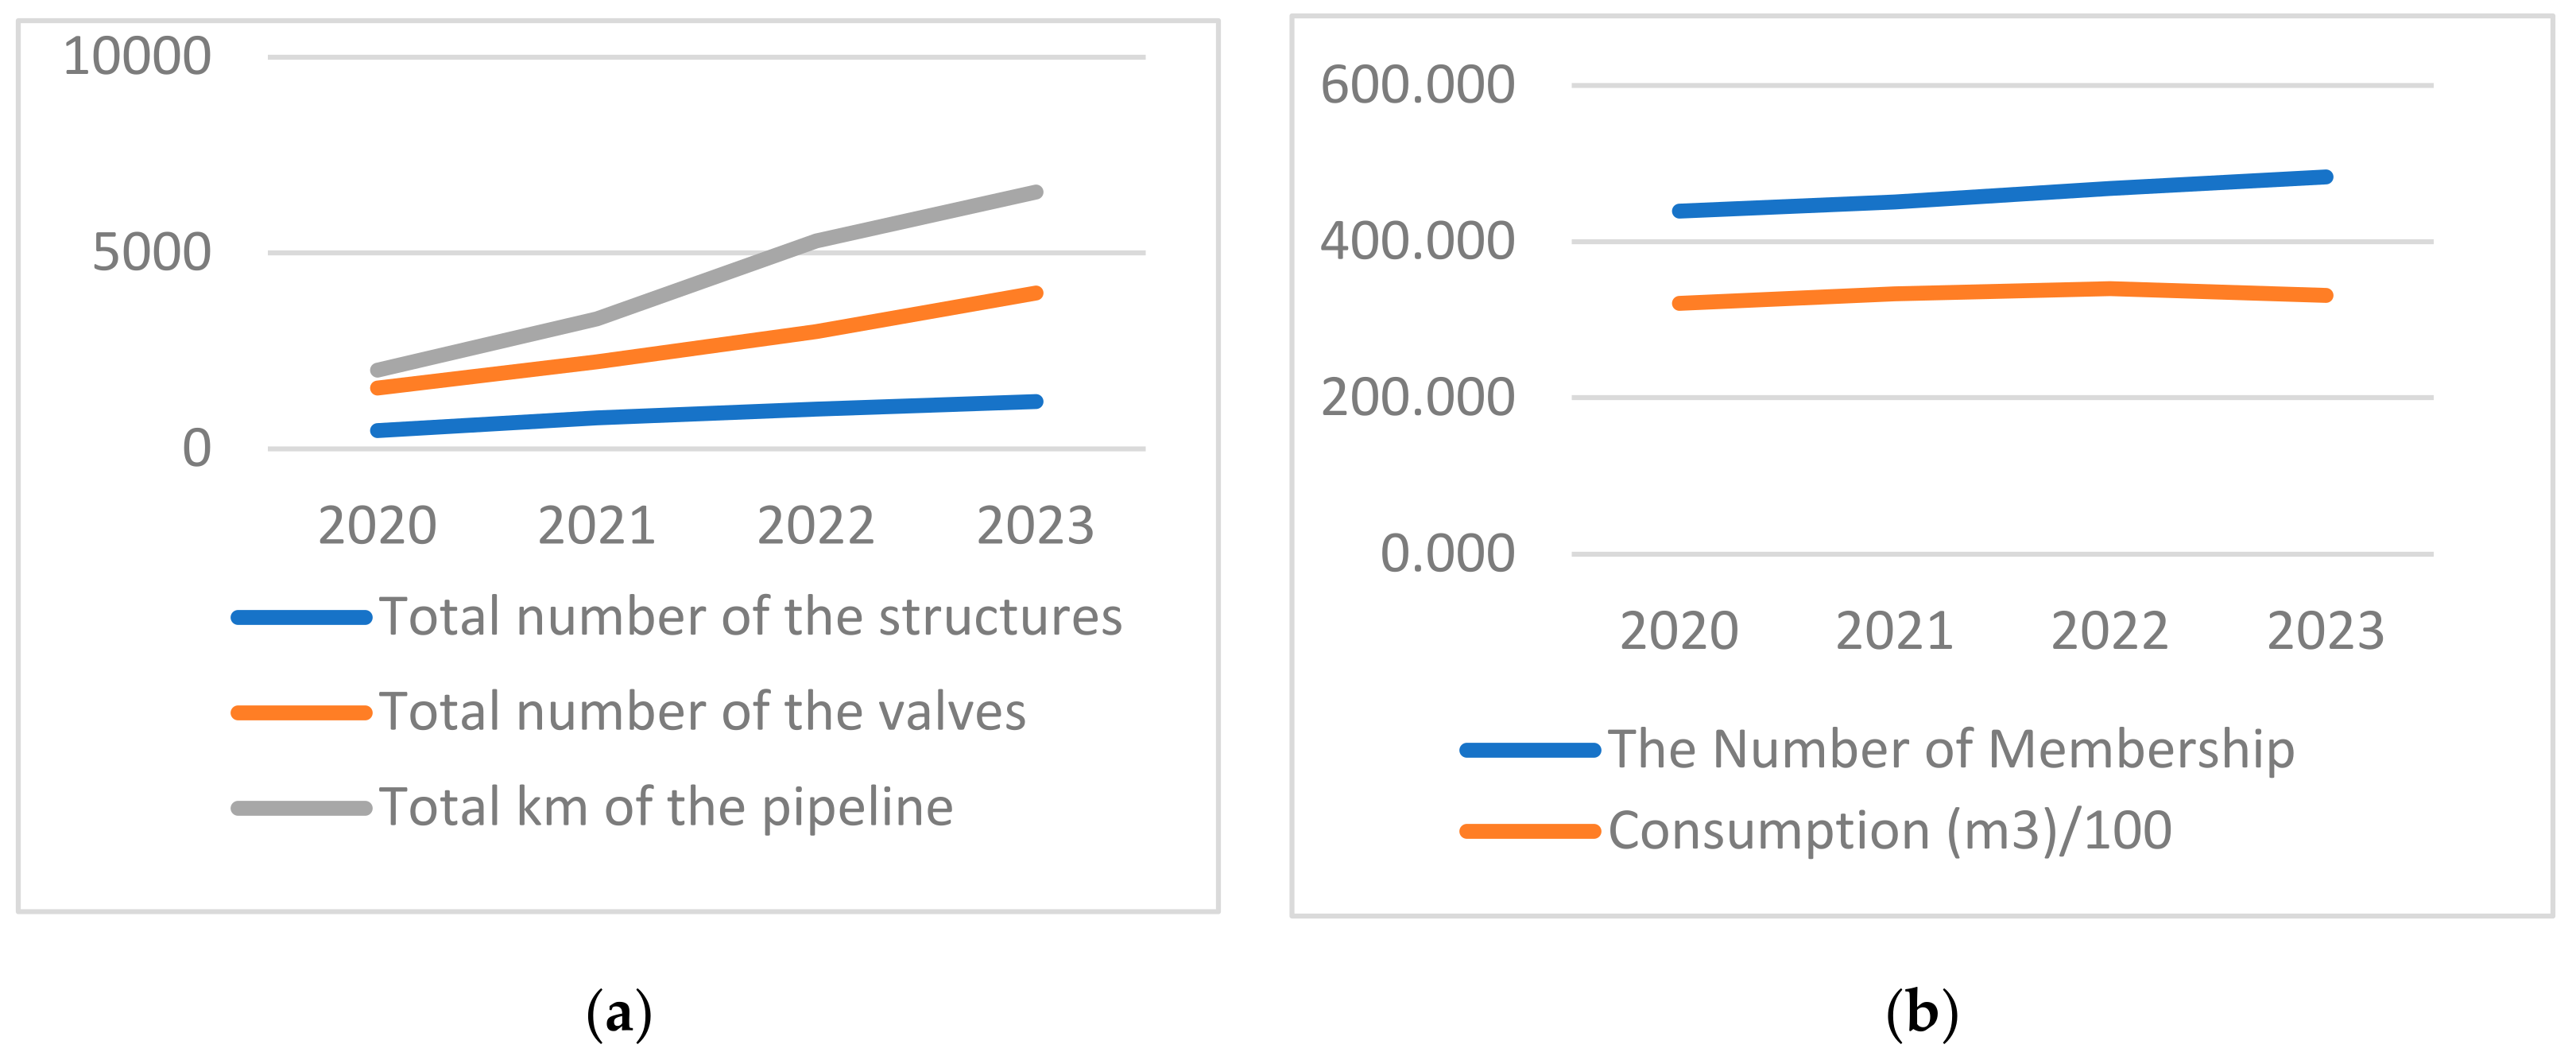
Thanks to the geographical database established with this study, all components of the drinking water infrastructure information system can be queried with their exact locations. In addition, keeping all drinking water elements in the system over time is an indicator of the development of the system. As can be seen, while the total number of the structures was only 464 in 2020, it increases to 789 in 2021, 1012 in 2022 and 1205 in 2023. Similarly, while the total number of valves was only 1556 in 2020, it stands out as 2221 in 2021, 2991 in 2022 and 3980 in 2023. Another data is that while total length (km) of the pipeline was only 2006 km in 2020, it became 3311 in 2021, 5304 km in 2022 and 6554 km in 2023. Another point that has increased in the information system thanks to the database is The Number of Membership. Accordingly, while 439,358 memberships were transferred to the system in 2020, 450,458 memberships in 2021, 468,125 memberships in 2022 and 482,771 memberships in 2023 were defined in the system. The amount of water consumed by all these subscribers can also be analysed as system data together with below-mentioned in Figure 18.
The surface area of Trabzon City is 4685 km2, and the drinking water infrastructure information system covers the entire city. For this reason, spatial resolutions of temporal and infrastructure elements for different years were calculated as in the table below. Water elements per km2 area in 2020 are provided. Structure resolution is calculated as 0.099 (units/km2), Valve resolution is 0.334 (units/km2), pipeline resolution is 0.430 (km/km2) and Membership resolution is 94,502 (membership/km2). Thanks to the database, these data, which increased in 2021 and 2022, will increase in 2023; Structure resolution is calculated as 0.258 (units/km2), Valve resolution is 0.853 (units/km2), pipeline resolution is 1.405 (km/km2) and Membership resolution is 103.51 (membership/km2). The spatial resolution of the data from the database can be seen in Table 1.
In accordance with the data model, geographical and non-spatial data for all components of existing drinking water components built in the past were transferred to the geographical information system. In particular, field studies were carried out due to the fact that elder water components were not known, they remained underground, some water lines were changed over time and the field personnel provided unwritten information based on experience. Classical maps, if available, were used to transfer the old lines to the system. In areas where maps were not available, data on drinking water lines and water components were transferred to the system using the virtual drawing method. In the construction of new drinking water facilities, all data was provided in accordance with the information system, simultaneously with the construction process and in accordance with the digital operation plan.
Faulty water components can be found in a short time if there is an infrastructure map, but if there is no map or digital system, it may take hours to detect the fault spatially. In addition, faulty excavations may be carried out within the scope of the maintenance and repair works of drinking water lines. In such a situation, other infrastructure facilities such as electricity, natural gas, fibre optics, etc., may be damaged. According to the above experiences, there must be a holistic solution approach covering both data model design and GIS application to tackle the problems and analyse all information related to the water components, their malfunction and even water consumers. Therefore, thanks to the availability of consumer, malfunction, enforcement and court information, it may be possible to create an information system that can manage almost all scenarios related to drinking water. By recording the geographical and non-spatial information of the lines that are maintained and repaired, possible future management problems related to these lines can be detected and resolved in a very short time.

5. Conclusions and Recommendations

The geographical data model design was developed primarily by taking TNGIS data schemas for the drinking water infrastructure information system in Trabzon into account. Since TNGIS was prepared according to INSPIRE and LADM standards, the data model designed for this study was conceptually compatible with INSPIRE and LADM. The model is detailed with UML diagrams. After the model design, the phase of establishing a geographical information system suitable for the model began. The geographical information system is designed in a static form, apart from water storage, water transmission and water components. We also discuss a structure that will include address information of consumers and malfunction information of water components. Since all non-spatial data as well as spatial data are included in the system, various positional and non-spatial queries can be made throughout the study area. Consumer information in the entire work area has not yet been transferred to the system on the basis of each independent unit—in the form of water consumers—by TISKI. For this reason, water consumption maps were produced on a parcel/building basis by using the address information of Trabzon’s Pelitli neighbourhood, where the consumer data entry of the study area and the water consumption of consumers were completed. Fault points, faulty water components and faulty lines determined by technical unit employees were identified. Similarly, all faults reported by water consumers and complaints and demands have been associated with water components. Thus, all malfunctions were transferred to the geographical information system, and maintenance and repair works were planned in order of priority. Malfunction density maps of the working area were created. By carrying out possible maintenance and repairs based on these density maps, loss of time and effort was prevented. On the other hand, maps containing temporal payment information based on the debt amount of consumers were produced. The wear and tear and repair need analysis of the drinking water network based on years was carried out by taking the construction year of the water components, construction material and malfunction frequency data into account. Thematic maps were produced for consumers who delayed the payment period of their drinking water debt or did not pay their debt, according to the amount or delay period.
Apart from Türkiye’s 12th 5-year development plan, all countries that are about to come across the risk of living with insufficient drinkable water must find a solution for drinkable water issues as soon as possible. These solutions, which must take all geographical and non-spatial information into account, are very important in managing water and its components throughout the country in 21st century. This study may support qualitative and quantitative improvement of data sets on water resources and may also provide an example of data-based planning for all water-related works and transactions. Thanks to this study, the effectiveness of other national information systems can be increased by providing some spatial and non-spatial information. Municipalities can determine the water loss rate and prevent illegal water use by using this study. This study can also provide data for the municipality to combat water loss and illegal use and can be taken as an example by municipalities.
In this study, the following suggestions were reached from the impressions and field experiences regarding the acquisition, transformation and processing of data. Drinking water infrastructure information systems in the area of responsibility should be established as soon as possible by water and sewerage administrations. After the system is designed in accordance with international geographic data model standards, obtaining spatial and non-spatial data of water components in the short, medium and long term during the implementation phase should be planned. In the short term, all data should be acquired and transferred to the information system in new projects and productions. In the medium term, business plans should be systematically digitized and acquired. In the long term, the virtual drawing method and the measurement of water components above ground level should be carried out. In this way, all drinking water components should be transferred to the system with the contribution of a time-table.
Thanks to devices that can provide remote sensing, such as sensors, etc., to be placed in certain components of the drinking water infrastructure information system in appropriate numbers and quality, water storage, loss, leakage and flow may be monitored more accurately. Water faults that may occur can be detected earlier and more effectively. By integrating the data obtained from these devices into GIS, the system, which is designed as a static structure, can be transformed into a dynamic structure. Finally, it is recommended that similar studies allowing remote sensing devices to be integrated into the GIS carried out in this study in harmony with LADM standards be used in the drinking water infrastructure system.

Author Contributions

Conceptualization, Y.E.C.; methodology, Y.E.C. and S.S.A.; software, Y.E.C. and S.S.A.; validation, Y.E.C. and S.S.A.; formal analysis, Y.E.C. and S.S.A.; investigation, Y.E.C.; resources, Y.E.C. and S.S.A.; data curation, S.S.A..; writing—original draft preparation, Y.E.C.; writing—review and editing, Y.E.C.; visualization, Y.E.C. and S.S.A.; supervision, Y.E.C. and S.S.A.; project administration, Y.E.C. and S.S.A. All authors have read and agreed to the published version of the manuscript.

Funding

This research received no external funding.

Data Availability Statement

Data sharing is not applicable. Restrictions apply to the availability of these data by TISKI.

Acknowledgments

We would like to thank the Trabzon Metropolitan Municipality and TİSKİ General Directorate administrators and staff for their support in the master's thesis prepared by the second author under the consultancy of the first author, which was completed within the scope of the University/Public/Industry Cooperation within the scope of the education protocol signed between Karadeniz Technical University (KTU) and Trabzon Water and Sewerage Administration General Directorate (TISKI). We would like to also thank English Lecturer Rıza IŞITAN (KTU) for his intensive efforts in the writing of the article and in the grammar and grammar editing.

Conflicts of Interest

The authors declare no conflict of interest.

References

  1. Weeks, J.R. Defining urban areas. In Remote Sensing of Urban and Suburban Areas; Springer: Berlin/Heidelberg, Germany, 2010; pp. 33–45. [Google Scholar]
  2. Omole, D.O.; Ndambuki, J.M. Sustainable living in Africa: Case of water, sanitation, air pollution and energy. Sustainability 2014, 6, 5187–5202. [Google Scholar] [CrossRef]
  3. Delgado, J.A.; Groffman, P.M.; Nearing, M.A.; Goddard, T.; Reicosky, D.; Lal, R.; Salon, P. Conservation practices to mitigate and adapt to climate change. J. Soil Water Conser. 2011, 66, 118–129. [Google Scholar] [CrossRef]
  4. Lal, R. Climate change and soil degradation mitigation by sustainable management of soils and other natural resources. Agric. Res. 2012, 1, 199–212. [Google Scholar] [CrossRef]
  5. Gleick, P.H. Water in crisis: Paths to sustainable water use. Ecol. Appl. 1998, 8, 571–579. [Google Scholar] [CrossRef]
  6. Pedro-Monzonís, M.; Solera, A.; Ferrer, J.; Estrela, T.; Paredes-Arquiola, J. A review of water scarcity and drought indexes in water resources planning and management. J. Hydrol. 2015, 527, 482–493. [Google Scholar] [CrossRef]
  7. Bozkurt, Y.; Arslan, R. The Place of Water in the Provision of Publıc Services: The Case of Kutahya Munıcipality. Kastamonu Üniversity J. Fac. Econ. Adm. Sci. 2017, 201–213. [Google Scholar]
  8. Kang, D.; Lansey, K. Scenario-Based Robust Optimization of Regional Water and Wastewater Infrastructure. J. Water Resour. Plan. Manag. 2013, 139, 325–338. [Google Scholar] [CrossRef]
  9. Alıcı, O.V.; Özaslan, K. Digitızation of Infrastructure Systems in Local Admınistration and Prevention of Water Losses. J. Sci. Res. 2016, 3, 204–218. [Google Scholar]
  10. Bayraktar, Z. Information System Design in Accordance with Spatial Data Standards for Infrastructure Coordination Centre: Case Study Trabzon Provınce. Master’s Thesis, Karadeniz Technical University Natural Sciences İnstitute, Trabzon, Turkey, 2019. [Google Scholar]
  11. Cardoso, M.A.; Silva, M.S.; Coelho, S.T.; Almeida, M.C.; Covas, D.I.C. Urban water infrastructure asset management–a structured approach in four water utilities. Water Sci. Technol. 2012, 66, 2702–2711. [Google Scholar] [CrossRef] [PubMed]
  12. Ahopelto, S.; Vahala, R. Cost–benefit analysis of leakage reduction methods in water supply networks. Water 2020, 12, 195. [Google Scholar] [CrossRef]
  13. Zhao, X.; Yu, J.; Lin, Y.; Ning, S. The application of WebGIS technology in coal mine. In Computer Applications in the Mineral Industries; CRC Press: Boca Raton, FL, USA, 2020; pp. 837–840. [Google Scholar]
  14. Clarke, K.C.; McLafferty, S.L.; Tempalski, B.J. On epidemiology and geographic information systems: A review and discussion of future directions. Emerg. Infect. Dis. 1996, 2, 85. [Google Scholar] [CrossRef] [PubMed]
  15. İşitmezoğlu, S.; Ataman, S. The Importance of Infrastructure Information System for Our Country, TMMOB Chamber of Surveying and Cadastre Engineers. In Proceedings of the National Geographic Information Systems Congress, KTÜ, Trabzon, Türkiye, 30 October–2 November 2007. [Google Scholar]
  16. Available online: https://knowledge-base.inspire.ec.europa.eu/index_en (accessed on 15 October 2022).
  17. Available online: https://cbs.csb.gov.tr/cografi-veri-temalari-hakkinda-i-86103 (accessed on 15 October 2022).
  18. Lemanski, C.; Massey, R. Is the Grid People or Product? Relational Infrastructure Networks in Cape Town’s Energy-Housing Nexus. Urban Geogr. 2022, 44, 1305–1329. [Google Scholar] [CrossRef]
  19. Karley, N.K. Flooding and physical planning in urban areas in West Africa: Situational analysis of Accra, Ghana. Theor. Empir. Res. Urban Manag. 2009, 4, 25–41. [Google Scholar]
  20. Aquino Ficarelli, T.R.; Ribeiro, H. The contribution of geographical information systems—GIS in water and sewage companies for water sustainability. In Sustainability in Natural Resources Management and Land Planning; Springer International Publishing: Cham, Switzerland, 2021; pp. 17–29. [Google Scholar]
  21. Lemmen, C.H.J.; Van Oosterom, P.J.M.; Uitermark, H.T.; De Zeeuw, K. Land administration domain model is an ISO standard now. In Proceedings of the Annual World Bank Conference on Land and Poverty, Washington, DC, USA, 8–11 April 2013; World Bank: Bretton Woods, NH, USA, 2013. [Google Scholar]
  22. ISO 19152:2012; Geographic Information-Land Administration Domain Model (LADM). ISO: Geneva, Switzerland, 2012.
  23. Lemmen, C.; Van Oosterom, P.; Bennett, R. The land administration domain model. Land Use Policy 2015, 49, 535–545. [Google Scholar] [CrossRef]
  24. Kalogianni, E.; Janečka, K.; Kalantari, M.; Dimopoulou, E.; Bydłosz, J.; Radulović, A.; Van Oosterom, P. Methodology for the development of LADM country profiles. Land Use Policy 2021, 105, 105380. [Google Scholar] [CrossRef]
  25. Coruhlu, Y.E.; Inan, H.I.; Yilmaz, H.; Demir, O. Geographic Data Model of Foundation İmmovable. Sigma J. Eng. Nat. Sci. 2015, 33, 539–559. [Google Scholar]
  26. Available online: https://www.tkgm.gov.tr/projeler/turkiye-ulusal-cografi-bilgi-sistemi-tucbs (accessed on 21 June 2023).
  27. Available online: https://tucbs-public-api.csb.gov.tr/tucbs/tucbs_uml_model/index.htm (accessed on 21 June 2023).
  28. Available online: https://onikinciplan.sbb.gov.tr/wp-content/uploads/2023/11/On-Ikinci-Kalkinma-Plani_2024-2028.pdf (accessed on 21 June 2023).
  29. Agardi, A. Relontouml: Development of a Model Based on Relational Model, Ontology and UML. Műsz. Tud. Közl. 2022, 16, 1–4. [Google Scholar] [CrossRef]
  30. Eynard, B.; Gallet, T.; Nowak, P.; Roucoules, L. UML based specifications of PDM product structure and workflow. Comput. Ind. 2004, 55, 301–316. [Google Scholar] [CrossRef]
  31. Polat, Z.A.; Alkan, M. Design and implementation of a LADM-based external archive data model for land registry and cadastre transactions in Türkiye: A case study of municipality. Land Use Policy 2018, 77, 249–266. [Google Scholar] [CrossRef]
  32. Coruhlu, Y.E.; Toludan, T. Data model development for ‘buying and selling’ transactions as a real estate acquisition method. Surv. Rev. 2020, 52, 403–414. [Google Scholar] [CrossRef]
  33. Güler, D. Implementation of 3D spatial planning through the integration of the standards. Trans. GIS 2023, 27, 2252–2277. [Google Scholar] [CrossRef]
  34. Tezcan, A.; Büyüktaş, K.; Aslan, T.A. A multi-criteria model for land valuation in the land consolidation. Land Use Policy 2020, 95, 104572. [Google Scholar] [CrossRef]
  35. Coruhlu, Y.E.; Baser, V.; Yildiz, O. Object-based geographical data model for determination of the cemetery sites using SWOT and AHP integration. Surv. Rev. 2021, 53, 108–121. [Google Scholar] [CrossRef]
  36. Kara, A.; Çağdaş, V.; Isikdag, U.; van Oosterom, P.; Lemmen, C.; Stubkjaer, E. The LADM Valuation Information Model and its application to the Türkiye case. Land Use Policy 2021, 104, 105307. [Google Scholar] [CrossRef]
  37. Coruhlu, Y.E.; Çelik, M.Ö. Protected area geographical management model from design to implementation for specially protected environment area. Land Use Policy 2022, 122, 106357. [Google Scholar] [CrossRef]
  38. Ertunç, E.; Muchová, Z.; Tomić, H.; Janus, J. Legal, procedural and social aspects of land valuation in land consolidation: A comparative study for selected Central and Eastern Europe countries and Türkiye. Land 2022, 11, 636. [Google Scholar] [CrossRef]
  39. Polat, Z.A.; Alkan, M.; Paulsson, J.; Paasch, J.M.; Kalogianni, E. Global scientific production on LADM-based research: A bibliometric analysis from 2012 to 2020. Land Use Policy 2022, 112, 105847. [Google Scholar] [CrossRef]
  40. Günhan, Ö. An Appropriate Methodology Study for the Evaluation of Groundwater Quality. Uzmanlık Thesis, T.C, Orman Ve Su İşleri Bakanlığı, Ankara, Turkey, 2014. [Google Scholar]
  41. Available online: www.skdturkiye.org/files/yayin/turkiyede-suyun-durumu-ve-su-yonetiminde-yeni-yaklasimlar-raporu.pdf (accessed on 2 March 2024).
  42. Available online: https://www.worldwatercouncil.org/en (accessed on 2 March 2024).
  43. Güneş, A.M. European Union Water Framework Directive and Turkish Water Law. In Proceedings of the EU, Turkish and German Environmental Law Symposium, Istanbul, Türkiye, 18–20 October 2010; pp. 18–20. [Google Scholar]
  44. Official Gazette, Law on Waters. (831), 28 April 1926. Available online: https://www.mevzuat.gov.tr/mevzuat?MevzuatNo=831&MevzuatTur=1&MevzuatTertip=3 (accessed on 1 August 2021).
  45. Official Gazette, Law on Supply of Drinking, Domestic and Industrial Water to Settlement Areas with Municipal Organizations. (1053), 3.7.1968. Available online: https://www.mevzuat.gov.tr/mevzuat?MevzuatNo=1053&MevzuatTur=1&MevzuatTertip=5 (accessed on 1 August 2021).
  46. Official Gazette, Law on the Establishment and Duties of ISKI General Directorate. (2560), 20 November 1981. Available online: https://www.mevzuat.gov.tr/mevzuat?MevzuatNo=2560&MevzuatTur=1&MevzuatTertip=5 (accessed on 1 August 2021).
  47. Official Gazette, Metropolitan Municipality Law. (5216), 10 July 2004. Available online: https://www.mevzuat.gov.tr/mevzuat?MevzuatNo=5216&MevzuatTur=1&MevzuatTertip=5 (accessed on 1 August 2021).
  48. Official Gazette, Municipal Law. (5393), 13 July 2005. Available online: https://www.mevzuat.gov.tr/mevzuat?MevzuatNo=5393&MevzuatTur=1&MevzuatTertip=5 (accessed on 1 August 2021).
  49. Available online: https://www.dsi.gov.tr/Sayfa/Detay/692 (accessed on 15 February 2024).
  50. Available online: https://www.tarimorman.gov.tr/sygm/menu/27/gorev-ve-yetkiler (accessed on 15 February 2024).
  51. Niemczynowicz, J. Urban hydrology and water management–present and future challenges. Urban Water 1999, 1, 1–14. [Google Scholar] [CrossRef]
  52. Ayadi, A.; Ghorbel, O.; BenSalah, M.S.; Abid, M. A framework of monitoring water pipeline techniques based on sensors technologies. J. King Saud Univ. Comput. Inf. Sci. 2019, 34, 47–57. [Google Scholar] [CrossRef]
  53. Sadeghioon, A.M.; Metje, N.; Chapman, D.; Anthony, C. Water pipeline failure detection using distributed relative pressure and temperature measurements and anomaly detection algorithms. Urban Water J. 2018, 15, 287–295. [Google Scholar] [CrossRef]
  54. Trabzon Drinking Water and Sewerage Administration General Directorate (TISKI), 2015. 2015–2019 Strategic Plan. Available online: https://www.tiski.gov.tr/icerik/detay.aspx?Id=272 (accessed on 15 February 2024).
  55. Trabzon Drinking Water and Sewerage Administration General Directorate (TISKI), 2020. 2020–2024 Strategic Plan. Available online: https://www.tiski.gov.tr/icerik/detay.aspx?Id=3526 (accessed on 15 February 2024).
  56. Egenhofer, M.J.; Frank, A. Object-oriented modeling for GIS. J. Urban Reg. Inform. Syst. Assoc. 1992, 4, 3–19. [Google Scholar]
  57. Polat, Z.A.; Alkan, M.; Sürmeneli, H.G. Determining strategies for the cadastre 2034 vision using an AHP-Based SWOT analysis: A case study for the turkish cadastral and land administration system. Land Use Policy 2017, 67, 151–166. [Google Scholar] [CrossRef]
  58. Inan, H.İ.; Yomralıoğlu, T. Land Administration Domain Model. Jeodezi Jeoinformasyon Derg. 2011, 104, 21–29. [Google Scholar]
  59. Inan, H.I. Spatial Data Model for Rural Planning and Land Management in Türkiye. J. Agric. Sci. 2021, 27, 254–266. [Google Scholar]
  60. Haberl, H. Competition for land: A sociometabolic perspective. Ecol. Econ. 2015, 119, 424–431. [Google Scholar] [CrossRef]
  61. FIG. Cadastre 2014: A Vision for The Future Cadastral System. 1998. Available online: https://fig.net/resources/publications/figpub/cadastre2014/index.asp (accessed on 3 May 2023).
  62. Steudler, D. Cadastre 2014 and Beyond; FIG Publication No:61; International Federation of Surveyors: Copenhagen, Denmark, 2014. [Google Scholar]
  63. Reggio, G.; Leotta, M.; Ricca, F.; Clerissi, D. What are the used UML diagram constructs? A document and tool analysis study covering activity and use case diagrams. In Proceedings of the Model-Driven Engineering and Software Development: Second International Conference, MODELSWARD 2014, Lisbon, Portugal, 7–9 January 2014; Springer International Publishing: Berlin/Heidelberg, Germany, 2015; pp. 66–83. [Google Scholar]
Figure 1. Methodology and study plan.
Water 16 01753 g001
Figure 2. (a) Adapted from TNGIS package diagram of infrastructure theme and simplified [27]. (b) Adapted from water network class diagram and simplified [27].
Water 16 01753 g002
Figure 3. Logical representation of a drinking water distribution system.
Water 16 01753 g003
Figure 4. Example of digital operation plan of the Pelitli neighbourhood water network.
Water 16 01753 g004
Figure 5. Vakfıkebir drinking water lines: paper map produced in 2015.
Water 16 01753 g005
Figure 6. Visualization of drinking water information system with UML use-case diagram.
Water 16 01753 g006
Figure 7. Visualization of drinking water information system with UML activity diagram.
Water 16 01753 g007
Figure 8. “TNGIS.AY_WATER_TISCBS” Model Data Sets.
Water 16 01753 g008
Figure 9. Visualization of drinking water information system with UML class diagram.
Water 16 01753 g009
Figure 10. The study area.
Water 16 01753 g010
Figure 11. Digitized drinking water geo-database.
Water 16 01753 g011
Figure 12. Failure and infrastructure geographical data.
Water 16 01753 g012
Figure 13. Failure street map of the pilot area.
Water 16 01753 g013
Figure 14. Failure density map of the pilot region.
Water 16 01753 g014
Figure 15. Map of structures associated with damaged lines.
Water 16 01753 g015
Figure 16. An example map showing the debt situation of consumers.
Water 16 01753 g016
Figure 17. An example map showing the water consumption of buildings and the year of construction of the lines.
Water 16 01753 g017
Figure 18. Water components, membership and consumption. (a) Water components. (b) Membership and consumption.
Water 16 01753 g018
Table 1. The spatial resolution of the data from the database.
YearStructure
(Units/km2)
Valve
(Units/km2)
Pipeline
(km/km2)
Membership
(Membership/km2)
20200.0990.3340.43094.202
20210.1690.4760.71096.582
20220.2170.6411.137100.37
20230.2580.8531.405103.51
Disclaimer/Publisher’s Note: The statements, opinions and data contained in all publications are solely those of the individual author(s) and contributor(s) and not of MDPI and/or the editor(s). MDPI and/or the editor(s) disclaim responsibility for any injury to people or property resulting from any ideas, methods, instructions or products referred to in the content.