Abstract
In this study, changes in abiotic environmental factors were analyzed based on measured data from Dawangtan Reservoir in Nanning City during 2021–2022. The Carlson Integrated Trophic State Index method was applied to evaluate water quality and eutrophication in the reservoir, considering both exogenous inputs and internal water quality conditions. Additionally, by investigating water quality and biological factors (zooplankton and fish) in the reservoir, this study identified the main drivers influencing phytoplankton outbreaks in Dawangtan Reservoir through redundancy analysis (RDA) and Pearson correlation analysis. The results showed that the combined trophic state index of the reservoir varied between 29.2 and 56.5 throughout the year, with each water quality indicator performing worse during the summer months when temperatures were higher. There was a positive correlation between zooplankton biomass and phytoplankton biomass, and the increase in the proportion of phytophagous fish contributed to the reduction in phytoplankton. The redundancy analysis revealed that the distribution of phytoplankton species was significantly correlated with total phosphorus (TP), pH, dissolved oxygen (DO), and chlorophyll a (Chl-a), with different phytoplankton species responding variably to these environmental factors. Finally, a multiple stepwise regression analysis was used to construct the optimal response equation between Chl-a concentration and environmental factors. The results indicated that pH, Secchi disk (SD), DO, and biological oxygen demand (BOD) were the main factors affecting Chl-a concentration. Therefore, the outcomes of abiotic environmental factors and lake biological resources should be considered in the restoration of eutrophic lakes to achieve the desired restoration effect.
1. Introduction
Multifunctional reservoirs are a critical freshwater conservation, serving to control floods, supply water, maintain ecological environments in river basins, and generate power [1,2]. However, recent increases in human activities have exacerbated eutrophication in many reservoirs due to pollution from agriculture, housing, industry, and tourism. This has resulted in perennial phytoplankton blooms in lakes and reservoirs worldwide, posing a potential threat to both freshwater ecosystems and human health [3,4]. Therefore, the prevention and control of phytoplankton blooms is crucial for the effective management and restoration of freshwater lakes from an ecological standpoint. Analyzing the driving mechanisms of phytoplankton blooms and constructing an effective prediction model is critical for nutrient management and the eutrophication prevention and control of water bodies [5,6]. Phytoplankton outbreaks are influenced by various physical, chemical, and biological factors, such as nutrient inputs, higher water temperatures, adequate light, and stagnant water circulation. Previous research on the distribution characteristics of phytoplankton in water mainly focused on various water quality and hydrodynamic conditions. For example, Tang et al. [7] found that nutrients and phytoplankton biomass are positively correlated with water age during the water transfer process. Tong et al. [8] analyzed the seasonal variation of nutrient concentration in Chaohu Lake, and developed a process-based water quality model to explain the coupling relationship between internal and external loads, nutrient concentration, and phytoplankton biomass. However, it is essential to comprehensively consider changes in both water quality and biological conditions in the reservoir to fully understand the patterns and underlying mechanisms of phytoplankton composition changes.
A substantial body of research has demonstrated that Chl-a is the primary component of phytoplankton in aquatic environments. The concentration of Chl-a serves as an indicator of primary productivity and the degree of eutrophication, making it a crucial tool for studying phytoplankton biomass, water eutrophication, and phytoplankton blooms [9,10,11,12]. Therefore, investigating the factors that influence Chl-a concentration in water is crucial for controlling water pollution and providing a foundation for the prevention and management of eutrophication. For example, Hyo et al. [13] examined the impact of water quality on Chl-a concentration in the Nakdong River in South Korea and identified total phosphorus (TP) and biological oxygen demand (BOD) as the main stressors. Guo et al. [14] monitored the water quality of a reservoir in Northeast China for five years and conducted binary and multiple regression analyses to identify the factors affecting Chl-a concentration in different seasons. In addition, predicting the trend of Chl-a concentration is crucial for the early warning of phytoplankton blooms, the development of a modern watershed ecological monitoring system, and ensuring water supply security [15,16]. Multiple regression analysis is widely used to explore the relationship between key variables and other parameters due to its simplicity and efficiency, with many researchers utilizing this method to predict Chl-a concentrations [17,18,19]. Franklin et al. [20] developed a mathematical model for predicting Chl-a concentrations using principal component analysis (PCA) and multiple linear regression analysis (MLR) methods. Their results demonstrated the effectiveness of this approach in predicting Chl-a concentrations.
The goal of this study is to provide data support and a scientific basis for reducing the risk of phytoplankton outbreaks and controlling water pollution in the reservoir. Dawangtan Reservoir, a crucial water source for Nanning, plays a vital role in the city’s economic and social development. In recent years, comprehensive environmental regulations have partially restored the reservoir’s ecological environment, significantly improving water quality. However, despite these efforts, Dawangtan Reservoir, as a multi-functional reservoir, continues to face severe eutrophication due to over a decade of sewage discharge, surface cage culture, and agricultural non-point source pollution. Hence, from August 2021 to July 2022, a comprehensive study was conducted on Dawangtan Reservoir, a large multifunctional reservoir in Nanning City. In this study, data were collected on the abiotic environmental and biological factors of the reservoir, as well as the water quality of the wastewater discharge outlet of the exogenous industrial park. The water quality and nutrient status of the reservoir were evaluated based on the intermonthly variation in the water quality index and the comprehensive nutrient status index method. The mechanism of phytoplankton outbreaks in the reservoir was investigated using redundancy analysis. Additionally, the Chl-a content was used to characterize the presence of phytoplankton, and a prediction model of Chl-a concentration was established by the multiple linear regression, which was then tested for predictive accuracy.
2. Materials and Methods
2.1. Study Area Profile
Dawangtan Reservoir, located in Nanning City, the capital of Guangxi Autonomous Region in China, is part of the middle reaches of the Bachi River in the Xijiang River system of the Pearl River Basin. With a total storage capacity of 638 million cubic meters, comprising an effective storage capacity of 124 million cubic meters, a flood control storage capacity of 378 million cubic meters, and a dead storage capacity of 136 million cubic meters, Dawangtan Reservoir is a vast and multifaceted water body. Its normal water level rests at 104.40 m, contrasting with a dead water level of 100 m, encompassing a water surface area of 38 square kilometers at the normal level. Notably, it serves as Nanning City’s secondary drinking water source. The water quality of Dawangtan Reservoir has been consistently classified as Class III in recent years. Being a lake reservoir characterized by low water flow and limited self-purification capacity, its water quality is notably unstable. Between May and September 2019, phytoplankton outbreaks occurred three times in the vicinity of the dam head of the reservoir, and in March 2020, cyanobacteria outbreaks occurred in the waters near the dam head of the reservoir. Additionally, in April of the same year, a significant number of dead fish were observed in the Xinpo River of the reservoir due to anoxia. Consequently, Dawangtan Reservoir was selected for monitoring phytoplankton outbreak characteristic parameters in inland reservoirs and for studying water environment evolution. The source analysis results are indicative of inland reservoirs with relatively high water pollution levels in the reservoir area. Based on the findings of this study, important guiding significance can be derived for proposing bloom control measures. To achieve this, 8 monitoring sections were established to undertake a monthly sampling survey from August 2021 to July 2022 based on the morphological and functional characteristics of Dawangtan Reservoir. The distribution of the sampling points (1#-8#) is presented in Figure 1.
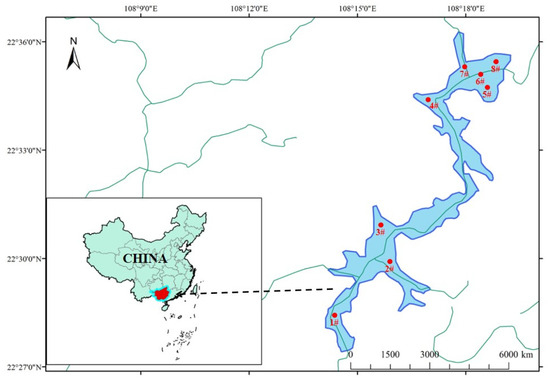
Figure 1.
Water quality monitoring section distribution of Dawangtan Reservoir.
2.2. Experimental Method
Lake ecosystems are complex and dynamic, with the continuous exchange of substances and energy with the external environment due to the nonlinear dynamic interactions of various environmental factors. Changes in environmental factors can lead to consequential changes in the trophic state and structure of the lake ecosystem [21]. To detect and quantify phytoplankton outbreaks in freshwater systems, it is common to measure the dynamic changes of physical, biological, and chemical parameters of water bodies. Therefore, in this study, we obtained water parameters in situ, including pH, water temperature (WT), and dissolved oxygen (DO), using a multi-parameter water quality analyzer (HI9829, Hanna, Italy). Transparency was measured with a Secchi disc (SD), and chlorophyll a (Chl-a) was determined with a chlorophyll a fluorescence detector (FluoroQuik, AMI, USA). Water samples were collected in 500 mL plastic bottles from three replications at each sampling site, which were rinsed with surface water before sampling. After sampling, all bottles were transferred to the laboratory, stored in a refrigerator, and analyzed as soon as possible. Total nitrogen (TN), total phosphorus (TP), BOD, and chemical oxygen demand (COD) were analyzed according to the Chinese national water environmental protection standard (GB11914-89, GB11893-89, GB11894-89, SL88-1994) [22]. TN was determined by alkaline potassium persulfate digestion and UV spectrophotometry at 120–124 °C. TP was determined by potassium persulfate (nitric acid–perchloric acid) digestion of unfiltered water samples followed by ammonium molybdate spectrophotometry. BOD was determined by titration. COD was determined by stoichiometric mass balance and consumption of potassium dichromate during reaction with water samples and suspended particles. According to the Chinese Water Quality Standard (GB 3838-2002) [23], water quality is classified from good to poor as Class I, Class II, Class III, Class IV, and Class V water, in that order.
The methods used to survey phytoplankton, zooplankton, and fish were carried out according to the Standard for the Investigation of Reservoir Fishery Resources (SL167-2014) [23], and the species composition, quantity, and biomass were measured.
2.3. Data Processing and Statistical Analysis
2.3.1. Trophic Level Index (TLI) Calculations
Eutrophication, a process of nutrient enrichment, is often used to characterize the state of aquatic ecosystems. The trophic status of a water body is commonly used to describe its nutrient status, with terms such as oligotrophic, mesotrophic, eutrophic, and hypertrophic. In this study, we used the comprehensive trophic status index method to evaluate the eutrophication status of Dawangtan Reservoir [24]. We determined the weights of other water quality parameters by using chlorophyll as the benchmark parameter. Finally, we obtained the comprehensive trophic status index by applying weighting Formula (1), which was as follows:
where TLI(j) is the composite index; Wj is the weight of the water quality parameter of j; TLI(j) is the composite index of j with the correlative weight Wj; m is the number of parameters involved in evaluation; and rij is the correlation coefficient between reference Chl-a and each parameter j (Chl-a: 1; TP: 0.84; TN: 0.82; SD: −0.83; CODMn: 0.83). The formula for calculating the nutrient status index of each water quality parameter is as follows:
where the unit of Chl-a is mg·m−3; the SD unit is m; and the units of TP and TN are mg·L−1. The eutrophication status was graded with continuous numbers from 0 to 100. The TLI ranges from 0 to 100, with high values representing high eutrophication levels. Trophic status is classified into five grades based on the TLI(Σ) scores: oligotropher (TLI(Σ) < 30), mesotropher (30 < TLI(Σ) < 50), light eutropher (50 < TLI(Σ) < 60), middle eutropher (60 < TL(Σ) < 70) and hyper eutropher (TLIΣ) > 70). In the same nutritional state, the higher the value, the more serious the degree of eutrophication.
2.3.2. Correlation Analysis
In this study, Canoco 5.0 was utilized to analyze the correlation between phytoplankton species information and environmental factors. Only species with a relative density of more than 1% and a frequency of more than 30% in all samples were included in the analysis. Additionally, multiple step-up regression analysis was performed using SPSS 20.0 to investigate the response of Chl-a concentration to environmental factors. The optimal regression equation was established, and the causal relationship between the two was analyzed.
3. Results
3.1. Temporal and Spatial Variations of Different Influencing Factors
3.1.1. Annual Variation Characteristics of Water Quality Conditions
Certain meteorological conditions can have a significant impact on eutrophication, such as increased monthly water temperature, being particularly conducive to phytoplankton growth [25]. As shown in Figure 2a, the water temperature in the reservoir varied significantly during the survey period, ranging from 13.9 to 34.0 °C. The average water temperatures in spring, summer, autumn, and winter were 24.5, 30.9, 26.6, and 18.0 °C, respectively. Higher water temperatures promote the conversion of organic matter to inorganic nutrients, which provides a favorable environment for phytoplankton blooms [26]. The SD in the reservoir fluctuated between 44.2 and 156.2 cm, with the minimum value occurring in July 2022 and the maximum value in April 2022 (Figure 2b). pH can affect the biological activity of microbial metabolites and, thus, impact the utilization of subsequent metabolites [27]. The pH varied between 7.2 and 9.0 during the survey period (Figure 2c), with alkaline water quality. This may be due to the high coverage of aquatic plants, which can consume CO2 through photosynthesis, leading to an increase in pH. Notably, the reservoir exhibited the highest pH and Chl-a concentration in July 2022 during the study period.
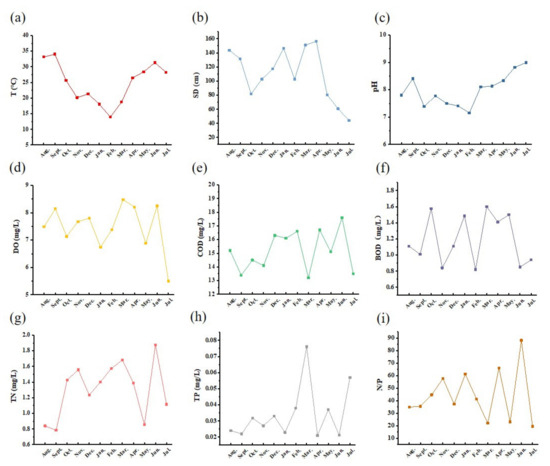
Figure 2.
Changes in water quality parameters of Dawangtan Reservoir from August 2021 to July 2022. (a) Water temperature (T), (b) Secchi disk (SD), (c) chemical oxygen demand (COD), (d) pH, (e) dissolved oxygen (DO), (f) biological oxygen demand (BOD), (g) total nitrogen (TN), (h) total phosphorus (TP), and (i) N/P.
Dissolved oxygen (DO) concentration is a critical indicator of the self-purifying capacity of a water body and plays an important role in maintaining the balance and health of the aquatic environment [28]. As illustrated in Figure 2d, DO concentrations in the Dawangtan Reservoir fluctuated between 5.5 and 8.5 mg·L−1 from August 2021 to July 2022, with a multi-year average of 8.0 mg·L−1, and met the Class II water standard (GB 3838-2002, Ministry of Environmental Protection of China, 2002) [22] for all periods except for July 2022, when it was at the Class III water standard. The levels of COD and BOD in the reservoir remained relatively stable (Figure 2d,e), with variations ranging from 13.2 to 17.6 mg·L−1 and from 0.82 to 1.6 mg·L−1, respectively, remaining within the better water quality standard.
TN and TP are important factors contributing to eutrophication in water bodies and limiting elements for eutrophication levels [29]. During the study period, TN fluctuated significantly from month to month, ranging from 0.7 to 1.9 mg·L−1, with an average TN of 1.3 mg·L−1 in Class IV. TP concentrations consistently remained in the range of <0.1 mg·L−1, in Class II. In addition, N and P ratios in watershed ecology reflect the total effect of phytoplankton growth. In this study, N/P ranged from 19.6 to 88.2, with ratios exceeding 16, indicating that phosphorus was the limiting nutrient in the study area.
3.1.2. Annual Variation of Zooplankton
The results of the zooplankton survey in Dawangtan Reservoir are presented in Figure 3a. During the survey, a total of 16 families and 23 genera (species) of zooplankton were identified in the reservoir, including 3 families and 4 genera (species) of protozoa, accounting for 17.4%; 6 families and 9 genera (species) of rotifers, 39.1%; 4 families and 6 genera (species) of branchiopods, 26.1%; and 3 families and 4 genera (species) of copepods, 17.4% (Figure 3a and Table S1). In terms of biomass, copepods, branchiopods, rotifers, and protozoa contributed from highest to lowest, respectively. Zooplankton biomass was most abundant during summer and autumn, with the lowest values occurring during winter when the temperatures were at their lowest. This trend is generally consistent with the seasonal variation of zooplankton in most reservoirs [30], as reported by Yin et al. [31], who found that zooplankton abundance in reservoirs gradually increased from spring to autumn, reaching a peak in summer and autumn, and decreased significantly after winter.
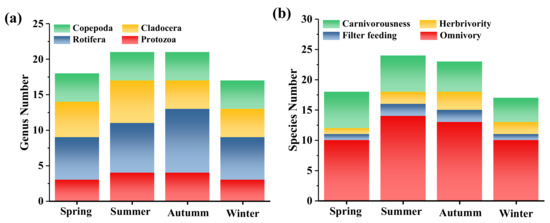
Figure 3.
Seasonal variation of (a) zooplankton and (b) fish species composition.
3.1.3. Annual Variation Characteristics of Fish Stocks
Based on the theory of lake food webs, it is well known that fish play a critical role in the distribution of phytoplankton [32]. Similar to studies of organisms on land, the presence of fish as top predators in the water can affect plant diversity by removing zooplankton herbivores [33]. Thus, this study investigated the distribution characteristics of fishes in Dawangtan Reservoir. The results of the fish survey in Dawangtan Reservoir are shown in Figure 3b and Table S3. Distinguishing fish by feeding type, the yearly survey data showed the highest number of omnivorous fish (68.95% of the total), followed by carnivorous fish (21.03%) and phytophagous fish (8.42%), and the least abundant species was filter-feeding fish (1.60%) (Figure 3b, Table S2). Fish biomass and species were most abundant in summer, with omnivorous and carnivorous species being the most dominant, accounting for 77.8% and 25%, respectively. In comparison, the fish species in autumn were similar to those in summer, but the combined percentage of herbivorous and piscivorous fish that contributed to phytoplankton removal was 21.6%, higher than the 16.6% in summer, which had a positive effect on preventing water blooms.
3.2. Chl-a Concentration Prediction
To improve the precision of the real biomass estimates in each sample, this study explored two different measurements of phytoplankton biomass, namely, Chl-a concentration and directly observed phytoplankton biomass. As depicted in Figure 4, the Chl-a concentrations remained relatively stable, fluctuating between 3 and 10 μg/L until May 2022. However, a significant fluctuation occurred from June 2022 onwards. Compared to May 2022, Chl-a concentrations rose sharply from 4.6 μg/L to 15.1 μg/L, representing an increase of more than 228%. Furthermore, the Chl-a concentrations continued to increase throughout the monitoring period, reaching a maximum of 27 μg/L in July 2022. The average Chl-a concentration for the entire period was only 3.6 μg/L.
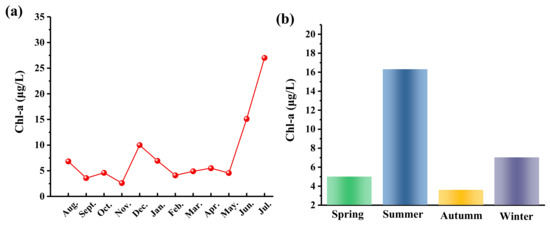
Figure 4.
(a) Monthly and (b) quarterly changes of Chl-a concentration in Dawangtan Reservoir from August 2021 to July 2022.
To investigate the relationship between Chl-a and water environmental factors in Dawangtan Reservoir, a Pearson correlation analysis was performed for Chl-a and nine environmental factors using SPSS 22.0, and the results are shown in Table S4 and Figure 5. Chl-a concentration was significantly correlated with pH, DO, and transparency. Specifically, pH was significantly positively correlated with Chl-a, with a correlation coefficient of 0.625. The alkaline environment of the Dawangtan Reservoir was favorable for the uptake of CO2 by phytoplankton for photosynthesis, thereby promoting their growth. DO was significantly negatively correlated with Chl-a, with a correlation coefficient of −0.594, which may be attributed to a decrease in dissolved oxygen in the water column during spring and summer when the water temperature rises, leading to the rapid blooming of phytoplankton and other plankton. The correlation coefficient for transparency was 0.614, indicating that the concentration of Chl-a increased with increasing water clarity, possibly due to the lower content of suspended and colloidal matter in the water with high transparency, reducing light scattering and increasing light transmission, thus providing sufficient light for photosynthesis.
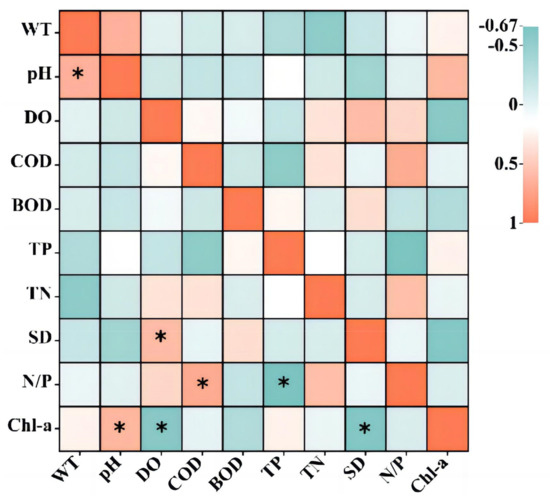
Figure 5.
Correlation between Chl-a and environmental factors (Significance levels: *, p ≤ 0.05).
The results of the multiple regression analysis between phytoplankton density and environmental factors are presented in Table 1. The selected environmental factors in the optimal regression equation are pH, SD, DO, and BOD. The Chl-a content, calculated using the regression equation, was compared with the measured value, as shown in Figure 6. The linear equation between the calculated value and the measured value is as follows: Chl-a = −2.939 + 5.901 (pH) − 0.08(SD) − 4.078(DO) − 3.942(BOD) (R2 = 0.681). These results indicate that the measured value was in close agreement with the calculated value, and the Chl-a content obtained from the regression equation was deemed acceptable.

Table 1.
Multiple regression analysis of Chl-a and environmental factors in Dawangtan Reservoir.
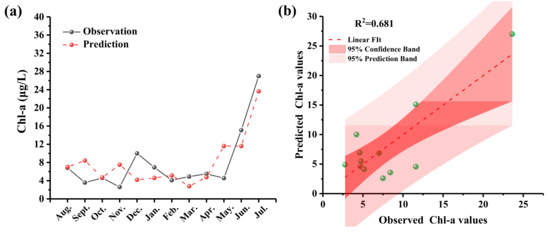
Figure 6.
(a) Comparison of observed and predicted values and (b) correlation between the observed and regression-model-predicted Chl-a values.
4. Discussion
4.1. Evaluation of Eutrophication in Water and Analysis of Driving Factors of Phytoplankton Outbreak
The comprehensive nutrient status index method was used to evaluate the eutrophic status of the water bodies within the year-round range of Dawangtan Reservoir, and the water quality was primarily in a mesotrophic state throughout the year, as shown in Figure 7a. The study area exhibited varying degrees of eutrophication in different seasons, with TLI fluctuations ranging from 29.2 to 56.5. In August 2021, the state of the reservoir was oligotrophic. From September 2021 to May 2022, the water body was in a relatively stable state at mesotrophic levels (30 < TSI < 50), but by June, when temperatures were relatively high, the water body approached eutrophic levels and rose sharply to light eutrophic levels (50 < TSI < 60) in July 2022, with a TLI as high as 56.5.
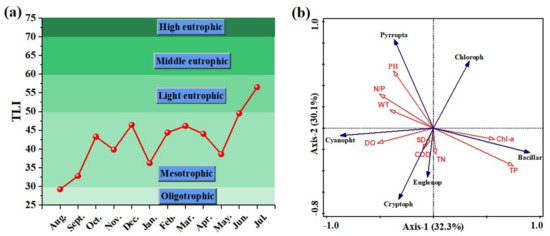
Figure 7.
(a) Changes in TLI of Dawangtan Reservoir from August 2021 to July 2022 and (b) correlation plot of the redundancy analysis on the relationship between environmental factors and phytoplankton density.
To investigate the relationship between different phytoplankton densities and the Carlson Integrated Trophic State Index TLI, we applied redundancy analysis. Our analysis indicated that the TLI showed a significant positive correlation with Bacillariophyta and Chlorophyta species and a significant negative correlation with Pyrroptata (Figure S1). The environmental factors were further subjected to RDA analysis with the phytoplankton biomass indicator, and the results are shown in Figure 7b. In the phytoplankton species–environmental factors RDA ordination plot, the first and second axis eigenvalues were 0.323 and 0.301, respectively, and the amount of phytoplankton biomass explained by the two axes was 62.4%. It can be seen that TP, pH, DO, and Chl-a were the main factors influencing the phytoplankton community structure by observing the length of the arrows of the environmental factors in the sequence diagram. TP was positively correlated with Chl-a and Bacillariophyta. Increasing the phosphorus source and Chl-a contributed to the growth of Bacillariophyta. Rao et al. [34] found that the abundance of Bacillariophyta was positively correlated with TP at low and moderate temperatures, but negatively correlated with TP at high temperatures. pH was positively correlated with Pyrroptata, meaning that Pyrroptata (Peridinium sp.) preferred to grow in high pH environments. However, the angle of arrows in the direction of DO and TP was greater than 90° (Figure 7b), indicating that the dissolved oxygen or TP concentration in the water is too high, which is not conducive to the growth of chlorophyte biomass. Tian et al. [35] found that DO negatively affected the cell density of Cryptophyta, Pyrrophyta, and Euglenophyta, the taxa composition of Pyrrophyta in autumn. Wang et al. [36] used redundancy analysis to explore the relationship between the phytoplankton community and environmental variables in landscape water bodies and found that Cyclotella meneghiniana was positively correlated with salinity and negatively correlated with TP. Notably, Cryptophyta were less affected by nutrients and generally considered to be one of the most tolerant phytoplankton groups, able to dominate the community when conditions are not suitable for other groups to grow [37].
4.2. Driving Mechanisms of Phytoplankton Outbreaks
After analyzing the data, this study found that Dawangtan Reservoir’s water quality deteriorated and was in a eutrophic state during the study period. The causes of the phytoplankton outbreak have been identified and a driving mechanism for the outbreak has been proposed (Figure 8). This outbreak occurred mainly in June and July with a higher water temperature. The causes of the phytoplankton outbreak can be divided into the input of exogenous pollutants and changes in internal environmental factors. The input of exogenous polluted water into the Dawangtan Reservoir is mainly rainwater and sewage from the nearby industrial park; therefore, this study was conducted to investigate the water quality of external pollution sources, and the results are shown in Figure 9. Before April 2022, the water quality of the stormwater outlets in the industrial park was relatively stable, with water quality indicators remaining between Class IV and V water, and the exceedances of water quality indicators such as BOD, TN, and TP were typical. However, after April 2022, COD, DO, sulphate, and other exceedance indicators were added, and the extent of exceedance was 1–2 orders of magnitude, which is worse than Class V water. As a result, the water quality of the reservoir deteriorated sharply after May 2022, with a sudden increase in pH, a decrease in dissolved oxygen, an increase in the potassium permanganate index, a sudden increase in chlorophyll, and a sudden decrease in transparency.
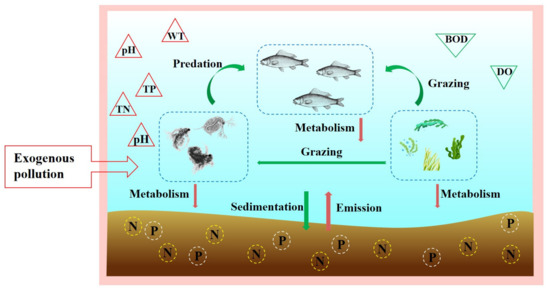
Figure 8.
The driving mechanism of phytoplankton explosion in Dawangtan Reservoir.
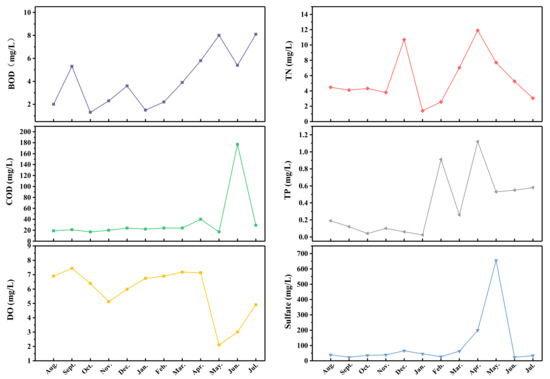
Figure 9.
Change in drainage water quality in industrial park.
Furthermore, during phytoplankton outbreaks, the increase in water temperature (Figure 2) leads to the conversion of organic nutrients in the substrate to an inorganic state that can be better utilized by phytoplankton, providing a material basis for phytoplankton blooms [38]. At the same time, pH can directly affect the photosynthesis and growth rate of phytoplankton by altering the acid–base balance or changing the composition of phytoplankton species [39]. The water quality of Dawangtan Reservoir was weakly alkaline, and the alkaline environment was favorable for phytoplankton to capture CO2 for photosynthesis. Due to the accumulation of exogenous pollution discharges and the release of large amounts of nutrients from endogenous sources, the concentration of nutrients in the reservoir increases dramatically and the material conditions for phytoplankton growth are met, triggering explosive growth.
In addition to the abiotic control of phytoplankton structure and composition, other biotic factors in the ecosystem, such as the interaction between fish and zooplankton and phytoplankton, can have a significant impact on water quality and phytoplankton biomass [40,41]. Changes in fish populations can affect phytoplankton communities by altering the dynamics of food webs and the physical and chemical properties of the aquatic environment [42,43]. Decreasing fish biomass may decrease phytoplankton biomass by increasing zooplankton and reducing nutrient availability. However, omnivorous fish, common in tropical systems, can contribute to reducing phytoplankton biomass due to their consumption habits. Therefore, a decrease in their abundance may lead to an increase in phytoplankton biomass [44]. In general, as zooplankton are more advanced than phytoplankton, phytoplankton are a nutrient source for zooplankton. In eutrophic lakes, the seasonal average zooplankton biomass is largely consistent with the increase in phytoplankton biomass, so the eutrophication level of the water body can be indirectly reflected by observing the zooplankton biomass [45].
5. Conclusions
In this study, we investigated the eutrophication status of Dawangtan Reservoir in Nanning City, and explored the mechanisms of phytoplankton outbreaks. Our results can be summarized as follows: (1) The worst water quality was observed in July 2022, with low water clarity, high pH, low DO levels, and a mildly eutrophic state, as indicated by the Carlson Integrated Trophic State Index. Exogenous pollution was identified as an important factor contributing to water quality deterioration during the study period. (2) Aquatic biota, including fish, zooplankton, and phytoplankton, were strongly related to the physical, chemical, and biological conditions of their environment, and can be used as biological indicators of freshwater ecosystem health. An increase in the proportion of predatory fish had a positive effect on controlling phytoplankton outbreaks, and the biomass of zooplankton was positively related to the biomass of phytoplankton. (3) Changes in physical and chemical parameters were found to influence the risk of phytoplankton blooms, with the main influencing factors varying for different phytoplankton species. Our results showed that TP, pH, DO, and Chl-a were the main factors influencing the structure of the phytoplankton community. TP and Chl-a were positively correlated with Bacillariophyta phytoplankton density; pH was significantly positively correlated with Pyrroptata; and Chlorophyta was negatively correlated with DO and TP. (4) We analyzed the deterioration in the water quality and eutrophication in the Dawangtan Reservoir during the study period and identified the driving mechanisms of the phytoplankton outbreaks. Furthermore, we developed a multiple linear regression equation to predict Chl-a concentration, which was validated by comparing the predicted values with the measured values (R2 = 0.681).
In summary, our findings shed light on the eutrophication status of Dawangtan Reservoir, and the role of physical, chemical, and biological factors in driving phytoplankton outbreaks. The use of aquatic biota as biological indicators and the development of a multiple linear regression equation for Chl-a concentration prediction can provide valuable insights for the management and conservation of freshwater ecosystems.
Supplementary Materials
The following supporting information can be downloaded at: https://www.mdpi.com/article/10.3390/w16121752/s1, Figure S1: Correlation plot of the redundancy analysis on the relationship between TLI and phytoplankton density; Table S1: Catalogue and seasonal distribution of zooplankton in reservoirs; Table S2: Composition of fish species in sampled catches of Dawangtan Reservoir in each season; Table S3: Seasonal variation of catches in Dawangtan Reservoir; Table S4: Correlation between Chl-a and environmental factors.
Author Contributions
Writing—review and editing, validation, funding acquisition, R.L.; conceptualization, supervision, methodology, G.Z.; writing—original draft preparation, data curation, K.X.; investigation, X.H. (Xianyu Huang), Z.L. and H.W.; visualization, X.H. (Xusheng Huang); formal analysis, Y.P. and L.L. All authors have read and agreed to the published version of the manuscript.
Funding
This study was supported by the National Natural Science Foundation of China (No. 52079033 and 52279060).
Data Availability Statement
The original contributions presented in the study are included in the article/Supplementary Materials, further inquiries can be directed to the corresponding author/s.
Conflicts of Interest
The authors declare no conflicts of interest.
References
- Brigitte, V.L.; Céline, C. Modelling eutrophication in lake ecosystems: A review. Sci. Total Environ. 2019, 651, 2985–3001. [Google Scholar]
- Sun, C.; Wang, S.; Wang, H.; Hu, X.; Yang, F.; Tang, M.; Zhang, M.; Zhong, J. Internal nitrogen and phosphorus loading in a seasonally stratified reservoir: Implications for eutrophication management of deep-water ecosystems. J. Environ. Manag. 2022, 319, 115681. [Google Scholar] [CrossRef]
- Carey, C.C.; Ibelings, B.W.; Hoffmann, E.P.; Hamilton, D.P.; Brookes, J.D. Eco-physiological adaptations that favour freshwater cyanobacteria in a changing climate. Water Res. 2012, 46, 1394–1407. [Google Scholar] [CrossRef] [PubMed]
- Zhao, F.; Zhan, X.; Xu, H.; Zhu, G.; Zou, W.; Zhu, M.; Kang, L.; Guo, Y.; Zhao, X.; Wang, Z. New insights into eutrophication management: Importance of temperature and water residence time. J. Environ. Sci. 2022, 111, 229–239. [Google Scholar] [CrossRef] [PubMed]
- Wen, S.; Wang, H.; Wu, T.; Yang, J.; Jiang, X.; Zhong, J. Vertical profiles of phosphorus fractions in the sediment in a chain of reservoirs in North China: Implications for pollution source, bioavailability, and eutrophication. Sci. Total Environ. 2020, 704, 135318. [Google Scholar] [CrossRef]
- Janssen, A.B.; Droppers, B.; Kong, X.; Teurlincx, S.; Tong, Y.; Kroeze, C. Characterizing 19 thousand Chinese lakes, ponds and reservoirs by morphometric, climate and sediment characteristics. Water Res. 2021, 202, 117427. [Google Scholar] [CrossRef]
- Tang, C.; He, C.; Li, Y.; Acharya, K. Diverse responses of hydrodynamics, nutrients and algal biomass to water diversion in a eutrophic shallow lake. J. Hydrol. 2021, 593, 125933. [Google Scholar] [CrossRef]
- Tong, Y.; Xu, X.; Qi, M.; Sun, J.; Zhang, Y.; Zhang, W.; Wang, M.; Wang, X.; Zhang, Y. Lake warming intensifies the seasonal pattern of internal nutrient cycling in the eutrophic lake and potential impacts on algal blooms. Water Res. 2021, 188, 116570. [Google Scholar]
- Kim, K.B.; Jung, M.K.; Tsang, Y.F.; Kwon, H.H. Stochastic modeling of chlorophyll-a for probabilistic assessment and monitoring of algae blooms in the Lower Nakdong River, South Korea. J. Hazard. Mater. 2020, 400, 123066. [Google Scholar] [CrossRef]
- Han, Y.; Aziz, T.N.; Del Giudice, D.; Hall, N.S.; Obenour, D.R. Exploring nutrient and light limitation of algal production in a shallow turbid reservoir. Environ. Pollut. 2021, 269, 116210. [Google Scholar] [CrossRef]
- Vörös, L.; Padisak, J. Phytoplankton biomass and chlorophyll-a in some shallow lakes in Central Europe. Hydrobiologia 1991, 215, 111–119. [Google Scholar] [CrossRef]
- He, Y.; Wang, X.; Xu, F. How reliable is chlorophyll-a as algae proxy in lake environments? New insights from the perspective of n-alkanes. Sci. Total Environ. 2022, 836, 155700. [Google Scholar] [CrossRef] [PubMed]
- Kim, H.G.; Hong, S.; Chon, T.S.; Joo, G.J. Spatial patterning of chlorophyll a and water-quality measurements for determining environmental thresholds for local eutrophication in the Nakdong River basin. Environ. Pollut. 2021, 268, 115701. [Google Scholar] [CrossRef] [PubMed]
- Guo, J.; Zhang, C.; Zheng, G.; Xue, J.; Zhang, L. The establishment of season-specific eutrophication assessment standards for a water-supply reservoir located in Northeast China based on chlorophyll-a levels. Ecol. Indic. 2018, 85, 11–20. [Google Scholar] [CrossRef]
- Yu, Z.; Yang, K.; Luo, Y.; Shang, C. Spatial-temporal process simulation and prediction of chlorophyll-a concentration in Dianchi Lake based on wavelet analysis and long-short term memory network. J. Hydrol. 2020, 582, 124488. [Google Scholar] [CrossRef]
- Wang, L.; Zhang, T.; Wang, X.; Jin, X.; Xu, J.; Yu, J.; Zhang, H.; Zhao, Z. An approach of improved Multivariate Timing-Random Deep Belief Net modelling for algal bloom prediction. Biosyst. Eng. 2019, 177, 130–138. [Google Scholar] [CrossRef]
- Huo, S.; Xi, B.; Su, J.; Zan, F.; Chen, Q.; Ji, D.; Ma, C. Determining reference conditions for TN, TP, SD and Chl-a in eastern plain ecoregion lakes, China. J. Environ. Sci. 2013, 25, 1001–1006. [Google Scholar] [CrossRef] [PubMed]
- Mamun, M.; Kim, J.J.; Alam, M.A.; An, K.G. Prediction of algal chlorophyll-a and water clarity in monsoon-region reservoir using machine learning approaches. Water 2019, 12, 30. [Google Scholar] [CrossRef]
- Zhang, W.; Li, J.; Liu, T.; Leng, S.; Yang, L.; Peng, H.; Jiang, S.; Zhou, W.; Leng, L.; Li, H. Machine learning prediction and optimization of bio-oil production from hydrothermal liquefaction of algae. Bioresour. Technol. 2021, 342, 126011. [Google Scholar] [CrossRef]
- Franklin, J.B.; Sathish, T.; Vinithkumar, N.V.; Kirubagaran, R. A novel approach to predict chlorophyll-a in coastal-marine ecosystems using multiple linear regression and principal component scores. Mar. Pollut. Bull. 2020, 152, 110902. [Google Scholar] [CrossRef]
- Du, H.; Chen, Z.; Mao, G.; Chen, L.; Crittenden, J.; Li, R.Y.M.; Chai, L. Evaluation of eutrophication in freshwater lakes: A new non-equilibrium statistical approach. Ecol. Indic. 2019, 102, 686–692. [Google Scholar] [CrossRef]
- Standard Method for the Examination of Water and Wastewater Editorial Board; Environmental Science Press of China: Beijing, China, 2002.
- Standards for the Investigation of Reservoir Fishery Resources; Water Conservancy Industry Standards; Chinese Ministry of Water Resources: Beijing, China, 2014.
- Liu, H.; He, B.; Zhou, Y.; Kutser, T.; Toming, K.; Feng, Q.; Yang, X.; Fu, C.; Yang, F.; Li, W. Trophic state assessment of optically diverse lakes using Sentinel-3-derived trophic level index. Int. J. Appl. Earth Obs. Geoinf. 2022, 114, 103026. [Google Scholar] [CrossRef]
- Nalley, J.O.; O’Donnell, D.R.; Litchman, E. Temperature effects on growth rates and fatty acid content in freshwater algae and cyanobacteria. Algal Res. 2018, 35, 500–507. [Google Scholar] [CrossRef]
- Jankowiak, J.; Hattenrath Lehmann, T.; Kramer, B.J.; Ladds, M.; Gobler, C.J. Deciphering the effects of nitrogen, phosphorus, and temperature on cyanobacterial bloom intensification, diversity, and toxicity in western Lake Erie. Limnol. Oceanogr. 2019, 64, 1347–1370. [Google Scholar] [CrossRef]
- Alprol, A.E.; Heneash, A.M.M.; Soliman, A.M.; Ashour, M.; Alsanie, W.F.; Gaber, A.; Mansour, A.T. Assessment of water quality, eutrophication, and zooplankton community in Lake Burullus, Egypt. Diversity 2021, 13, 268. [Google Scholar] [CrossRef]
- He, B.; Dai, M.; Zhai, W.; Guo, X.; Wang, L. Hypoxia in the upper reaches of the Pearl River Estuary and its maintenance mechanisms: A synthesis based on multiple year observations during 2000–2008. Mar. Chem. 2014, 167, 13–24. [Google Scholar] [CrossRef]
- Qin, B.; Zhou, J.; Elser, J.J.; Gardner, W.S.; Deng, J.; Brookes, J.D. Water depth underpins the relative roles and fates of nitrogen and phosphorus in lakes. Environ. Sci. Technol. 2020, 54, 3191–3198. [Google Scholar] [CrossRef] [PubMed]
- Li, X.; Huang, J.; Filker, S.; Stoeck, T.; Bi, Y.; Yu, Y.; Song, W. Spatio-temporal patterns of zooplankton in a main-stem dam affected tributary: A case study in the Xiangxi River of the Three Gorges Reservoir, China. Sci. China Life Sci. 2019, 62, 1058–1069. [Google Scholar] [CrossRef] [PubMed]
- Yin, J.; Xia, J.; Xia, Z.; Cai, W.; Liu, Z.; Xu, K.; Wang, Y.; Zhang, R.; Dong, X. Temporal variation and spatial distribution in the water environment helps explain seasonal dynamics of zooplankton in river-type reservoir. Sustainability 2022, 14, 13719. [Google Scholar] [CrossRef]
- Lazzaro, X.; Bouvy, M.; Ribeiro-Filho, R.A.; Oliviera, V.S.; Sales, L.T.; Vasconcelos, A.R.; Mata, M.R. Do fish regulate phytoplankton in shallow eutrophic Northeast Brazilian reservoirs? Freshw. Biol. 2003, 48, 649–668. [Google Scholar] [CrossRef]
- Moss, B.; Mckee, D.; Atkinson, D.; Collings, S.; Eaton, J.; Gill, A.; Harvey, I.; Hatton, K.; Heyes, T.; Wilson, D. How important is climate? Effects of warming, nutrient addition and fish on phytoplankton in shallow lake microcosms. J. Appl. Ecol. 2003, 40, 782–792. [Google Scholar] [CrossRef]
- Rao, K.; Zhang, X.; Yi, X.; Li, Z.; Wang, P.; Huang, G.; Guo, X. Interactive effects of environmental factors on phytoplankton communities and benthic nutrient interactions in a shallow lake and adjoining rivers in China. Sci. Total Environ. 2018, 619, 1661–1672. [Google Scholar] [CrossRef] [PubMed]
- Tian, Y.; Jiang, Y.; Liu, Q.; Xu, D.; Liu, Y.; Song, J. The impacts of local and regional factors on the phytoplankton community dynamics in a temperate river, northern China. Ecol. Indic. 2021, 123, 107352. [Google Scholar] [CrossRef]
- Wang, N.; Xiong, J.; Wang, X.C.; Zhang, Y.; Liu, H.; Zhou, B.; Pan, P.; Liu, Y.; Ding, F. Relationship between phytoplankton community and environmental factors in landscape water with high salinity in a coastal city of China. Environ. Sci. Pollut. Res. 2018, 25, 28460–28470. [Google Scholar] [CrossRef] [PubMed]
- Tolotti, M.; Thies, H.; Nickus, U.; Psenner, R. Temperature modulated effects of nutrients on phytoplankton changes in a mountain lake. Phytoplankton Responses Hum. Impacts Differ. Scales 2012, 698, 61–75. [Google Scholar]
- Lürling, M.; Mello, M.M.; Oosterhout, V.F.; Domis, L.D.S.; Marinho, M.M. Response of natural cyanobacteria and algae assemblages to a nutrient pulse and elevated temperature. Front. Microbiol. 2018, 9, 1851. [Google Scholar] [CrossRef]
- Raven, J.A.; Gobler, C.J.; Hansen, P.J. Dynamic CO2 and pH levels in coastal, estuarine, and inland waters: Theoretical and observed effects on harmful algal blooms. Harmful Algae 2020, 91, 101594. [Google Scholar] [CrossRef] [PubMed]
- Ger, K.A.; Urrutia-Cordero, P.; Frost, P.C.; Hansson, L.A.; Sarnelle, O.; Wilson, A.E.; Lürling, M. The interaction between cyanobacteria and zooplankton in a more eutrophic world. Harmful Algae 2016, 54, 128–144. [Google Scholar] [CrossRef]
- Hixon, M.A.; Brostoff, W.N. Succession and herbivory: Effects of differential fish grazing on Hawaiian coral-reef algae. Ecol. Monogr. 1996, 66, 67–90. [Google Scholar] [CrossRef]
- McIntosh, A.R.; Townsend, C.R. Interactions between fish, grazing invertebrates and algae in a New Zealand stream: A trophic cascade mediated by fish-induced changes to grazer behaviour? Oecologia 1996, 108, 174–181. [Google Scholar] [CrossRef]
- Kelly, P.T.; González, M.J.; Renwick, W.H.; Vanni, M.J. Increased light availability and nutrient cycling by fish provide resilience against reversing eutrophication in an agriculturally impacted reservoir. Limnol. Oceanogr. 2018, 63, 2647–2660. [Google Scholar] [CrossRef]
- Mayer, T. Interactions of fish, algae, and abiotic factors in a shallow, tropical pond. Hydrobiologia 2020, 847, 4145–4160. [Google Scholar] [CrossRef]
- Yuan, L.L.; Pollard, A.I. Changes in the relationship between zooplankton and phytoplankton biomasses across a eutrophication gradient. Limnol. Oceanogr. 2018, 63, 2493–2507. [Google Scholar] [CrossRef] [PubMed]
Disclaimer/Publisher’s Note: The statements, opinions and data contained in all publications are solely those of the individual author(s) and contributor(s) and not of MDPI and/or the editor(s). MDPI and/or the editor(s) disclaim responsibility for any injury to people or property resulting from any ideas, methods, instructions or products referred to in the content. |
© 2024 by the authors. Licensee MDPI, Basel, Switzerland. This article is an open access article distributed under the terms and conditions of the Creative Commons Attribution (CC BY) license (https://creativecommons.org/licenses/by/4.0/).