Article

Analysis of Water Temperature Variations in the Yangtze River’s Upper and Middle Reaches in the Context of Cascade Hydropower Development

1
Key Laboratory of Health Intelligent Perception and Ecological Restoration of River and Lake, Ministry of Education, Hubei University of Technology, Wuhan 430068, China
2
Innovation Demonstration Base of Ecological Environment Geotechnical and Ecological Restoration of Rivers and Lakes, Hubei University of Technology, Wuhan 430068, China
3
Hubei Key Laboratory of Ecological Restoration of River-Lakes and Algal Utilization, Hubei University of Technology, Wuhan 430068, China
4
Ecohydrology Research Group, Department of Earth and Environmental Sciences, University of Waterloo, 200 University Avenue West, Waterloo, ON N2L 3G1, Canada
5
State Key Laboratory of Water Resources and Hydropower Engineering Science, Wuhan University, Wuhan 430072, China
*
Author to whom correspondence should be addressed.
Water 2024, 16(12), 1669; https://doi.org/10.3390/w16121669
Submission received: 9 May 2024 / Revised: 6 June 2024 / Accepted: 8 June 2024 / Published: 12 June 2024

Abstract

:
The establishment and operation of cascade reservoirs in the mainstream of the upper and middle reaches of the Yangtze River have changed the river’s thermal regimes. This study analyzed the correlation between water temperature and its influencing factors and employed various evaluation indexes—including T (the temperature-increasing index, °C/100 km), I E C (the extreme fluctuation index), I B D (the baseline deviation index), and I P O (the phase offset time index). The aim was to uncover the variation characteristics and influencing factors of water temperature and quantify the impact of cascade reservoir construction on annual and seasonal water temperature rhythms. Our findings show that the construction and operation of cascade reservoirs weaken the synchronization of water temperature and air temperature downstream. The construction and operation of cascade reservoirs in the middle and lower reaches of the Jinsha River led to obvious homogenization, baseline deviation, and lagging effects on water temperature downstream, which intensified with the increase in storage capacity. These effects were more pronounced in colder months compared to warmer months. Additionally, the influence of tributaries and water–air heat exchange on these effects is alleviated to different degrees. These results are significant for assessing river ecological health in the context of cascade hydropower development.

Graphical Abstract

1. Introduction

River water temperature plays an essential role in aquatic ecosystems, influencing the geobiochemical cycling in river systems [1,2,3,4]. The variations in water temperature impact a range of geobiochemical processes, including food web structures [5], algal blooms [6], and the reproductive cycles of fish and bacteria [7,8,9]. The global rise in river water temperature, driven by climate change and intensified human activities, poses a growing threat to the stability of freshwater ecosystems [10]. Therefore, understanding the characteristics and ecological responses of water temperature changes is considerable for maintaining the health of these ecosystems [11]. River thermal regimes are shaped by a complex interplay of meteorological, geomorphological, and hydrological factors [12,13,14]. While climate is a key driver, local hydrology and watershed characteristics add layers of complexity [15,16,17]. Recently, in response to the increasing energy demand, significant new initiatives are currently underway in the field of hydropower development [18]. Many aspects of the disruption of river thermal regimes have received some attention, which mainly focus on the analysis of vertical water temperature within the reservoir region and downstream water temperature [19,20,21].
Reservoirs provide critical functions such as flood control, power generation, water supply, and navigation, and also disturb river ecosystems [22,23]. The most direct effect of reservoir construction is the alteration in natural river hydrology, including reduced flow rate, increased water depth, and disrupted river connectivity [24,25]. These changes lead to the homogenization of flow rates and water depths, thus modifying the spatial and temporal patterns of water temperature [26,27,28]. Reservoirs create a thermal stratification based on their dispatching, operation mode, hydrology, and meteorological conditions, resulting in layered, transitional, or mixed water temperature structures [29,30]. Dams directly change downstream thermal regimes by releasing water with temperatures significantly different from those in natural river states [31], which in turn creates lagging, homogenization, and isothermalization effects on water temperatures [32,33]. Under the watershed ladder development mode, the study of the variation in the water temperature of a single reservoir is insufficient. Relative to a single reservoir, cascade reservoirs may have cumulative effects on downstream impacts [34,35]. Therefore, the thermal regimes of cascade reservoirs may exhibit variations compared to those observed in a single reservoir, and their impact can be more complex [36].
The Yangtze River Basin is rich in water and hydroelectric resources, accounting for roughly 47% of China’s total potential capacity of technically exploitable hydropower, and large-scale cascade hydropower development has been carried out in recent years [37]. Thirteen reservoirs have been constructed in the mainstream of the upper and middle reaches of the Yangtze River (UMYR) by 2022, providing power coverage for economically developed regions such as East China, Central China, and South China. However, cascade reservoirs negatively affect river ecosystems by altering hydrological regimes and river connectivity [38,39,40]. Previous research has explored the impact of cascade reservoirs on the river’s hydrothermal conditions, specifically focusing on the Yangtze River’s upper and middle reaches [41,42,43]. This study, however, introduces water temperature evaluation indexes that are simpler and require less data, facilitating easier computation. These indexes enable a more straightforward and direct quantification of the influence of cascade reservoirs on the thermal regimes of rivers.
This research utilizes measured water temperature data from before and after the construction of cascade reservoirs in the mainstream of the Yangtze River’s upper and middle reaches (from Zhidamen to Hankou). This study focuses on investigating the patterns of water temperature changes along the river’s course and the characteristics of its periodic variations. A comprehensive set of indexes quantifies the impact of these reservoirs on water temperature, both annually and seasonally, aiding in the development of river ecological health assessments and the ecological management of cascade reservoirs. This study’s novel contributions include the following: (1) evaluating water temperature changes in the mainstream of the UMYR at different scales using a comprehensive set of indicators; (2) analyzing the influencing factors of water temperature changes in the UMYR from the perspective of river basin; and (3) quantifying the influence characteristics of cascade reservoir impoundment operation on downstream water temperature.

2. Methods

2.1. Study Area and Data Collection

Our study focuses on the upper and middle Yangtze River Basin, including the mainstream reaches of the Jinsha River and Yangtze River (25°27′ to 33°02′ N latitude, 97°13′ to 114°17′ E longitude, covering approximately 3953 km), and 21 controlling hydrological stations were selected from the Zhidamen (ZDM) hydrological station to the Hankou (HK) hydrological station (Figure 1). As of 2022, there are 13 hydropower stations operating in the region. The details about each dam are shown in Table 1. The measured data sources for this study include daily water temperature and flow, which are retrieved from the “Annual Hydrological Report of the People’s Republic of China (Volume VI: Hydrological Data of the Changjiang River Basin, Books 1 to 5)”. Additionally, daily meteorological data are acquired from the National Meteorological Information Center (NMIC) of the China Meteorological Administration (CMA), which are available online at http://data.cma.cn/, accessed on 1 January 2021.
According to the construction procedures of reservoirs in the mainstream of the UMYR, we divided the study periods into three stages: 2009–2010 (the first period), 2013–2015 (the second period), and 2018–2020 (the third period). At the same time, each year was classified based on its flow characteristics into wet, normal, and dry years (Table 2). In the first period, only the TGD and the GZB had been constructed within the study area, with no major hydropower projects on the Jinsha River. Hence, the water temperature rhythm observed during this initial period serves as a baseline in our analysis, facilitating a comparison with subsequent periods marked by the presence of cascade reservoirs. To investigate the impact trends of the construction and operation of these cascade reservoirs on the water temperature, we selected the two study periods of 2013–2015 and 2018–2020 for comparative analysis. Furthermore, to investigate the temporal variations in water temperature characteristics in different seasons, we further classified our results into cold and warm seasons based on the climate conditions of the basin. In this study area, the cold season is from January to April and November to December, while the warm season is from May to October.
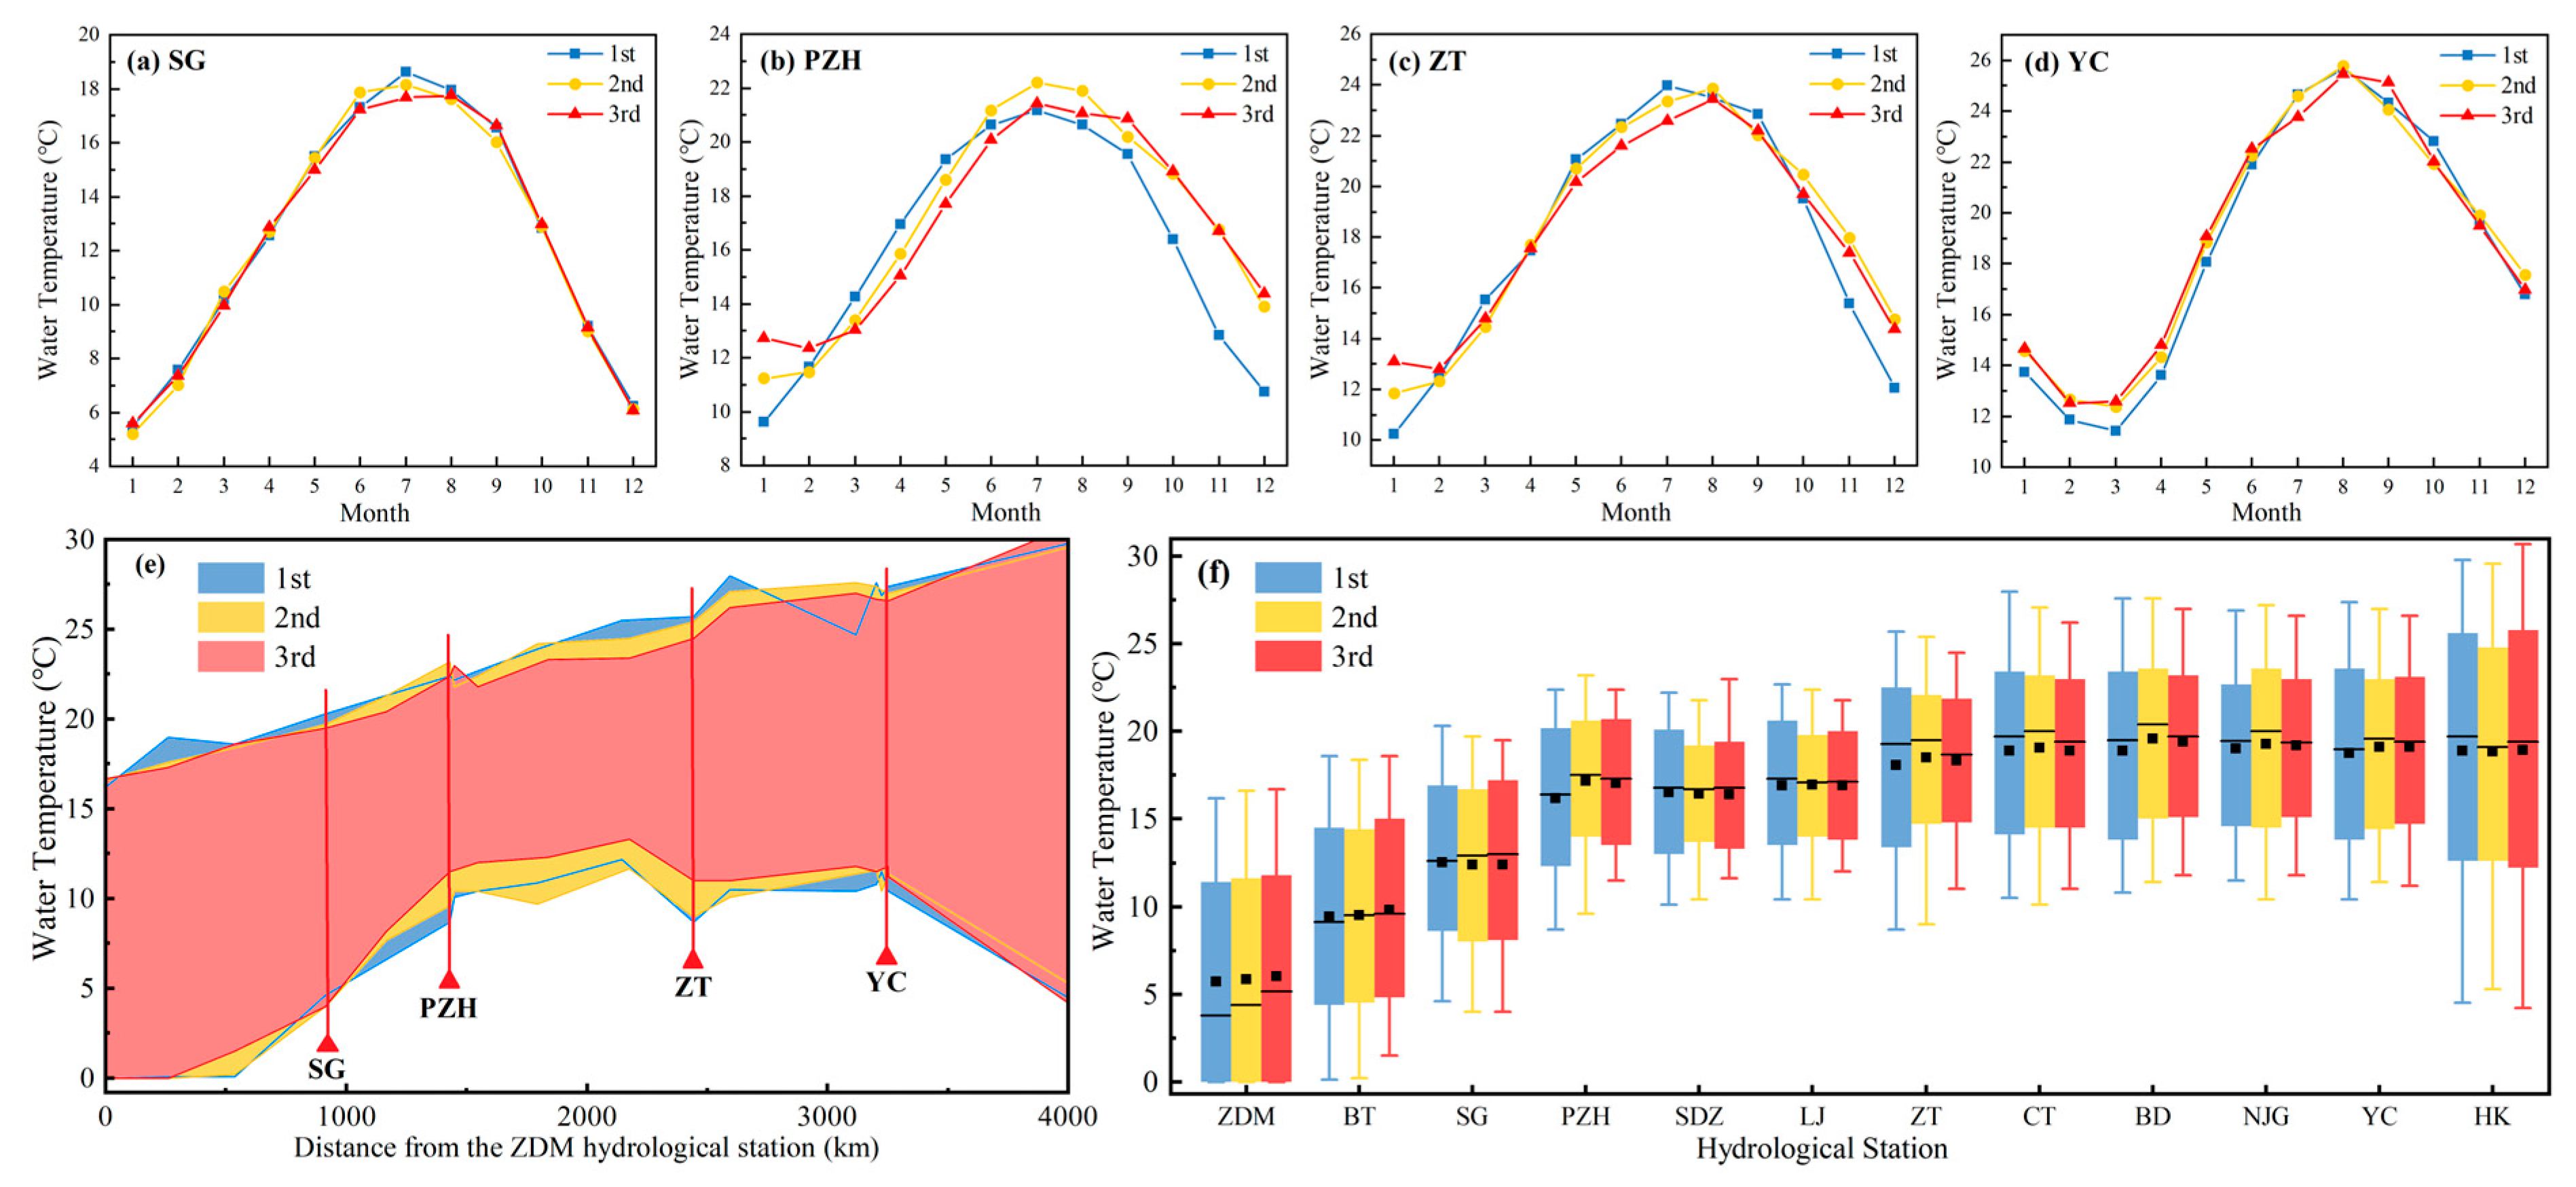
The spatial and temporal distributions of water temperature in the UMYR in the three periods are shown in Figure 2. The monthly mean water temperature profiles at the SG station demonstrate consistency, showing no significant phase shifts or extreme value changes. In contrast, the monthly mean water temperature data from the PZH site exhibit an evident phase shift. The water temperature in the second period is significantly higher than that in the first period, in which the highest monthly mean water temperature increases by 1.04 °C, while the lowest monthly mean water temperature rises by 1.62 °C. Furthermore, during the third period, the annual variation in water temperature significantly decreases compared the previous periods, with the lowest monthly mean water temperature still increasing by 1.5 °C compared to that in the second period. There is a delayed occurrence of extreme water temperature values, characterized by “stagnant cold” and “stagnant warm”. Compared with the first period, the monthly average water temperature curve of the ZT hydrological station also exhibits a distinct phase shift in both the second and third periods, showing that the extreme value here is delayed by nearly a month. Furthermore, there is an increase of 1.60 °C and 2.53 °C in the minimum values of the curve during these respective periods. Additionally, the YC hydrological station did not exhibit significant phase shifts in the monthly mean water temperature curve during each period, but the minimal value increased by 0.95 °C and 1.09 °C, respectively. Figure 2e,f illustrate a “Ribbon” effect in the water temperature between the SG and YC stations during the second period compared to the first period. This effect indicates a reduced range of intra-year water temperature fluctuations, becoming more pronounced in subsequent periods.
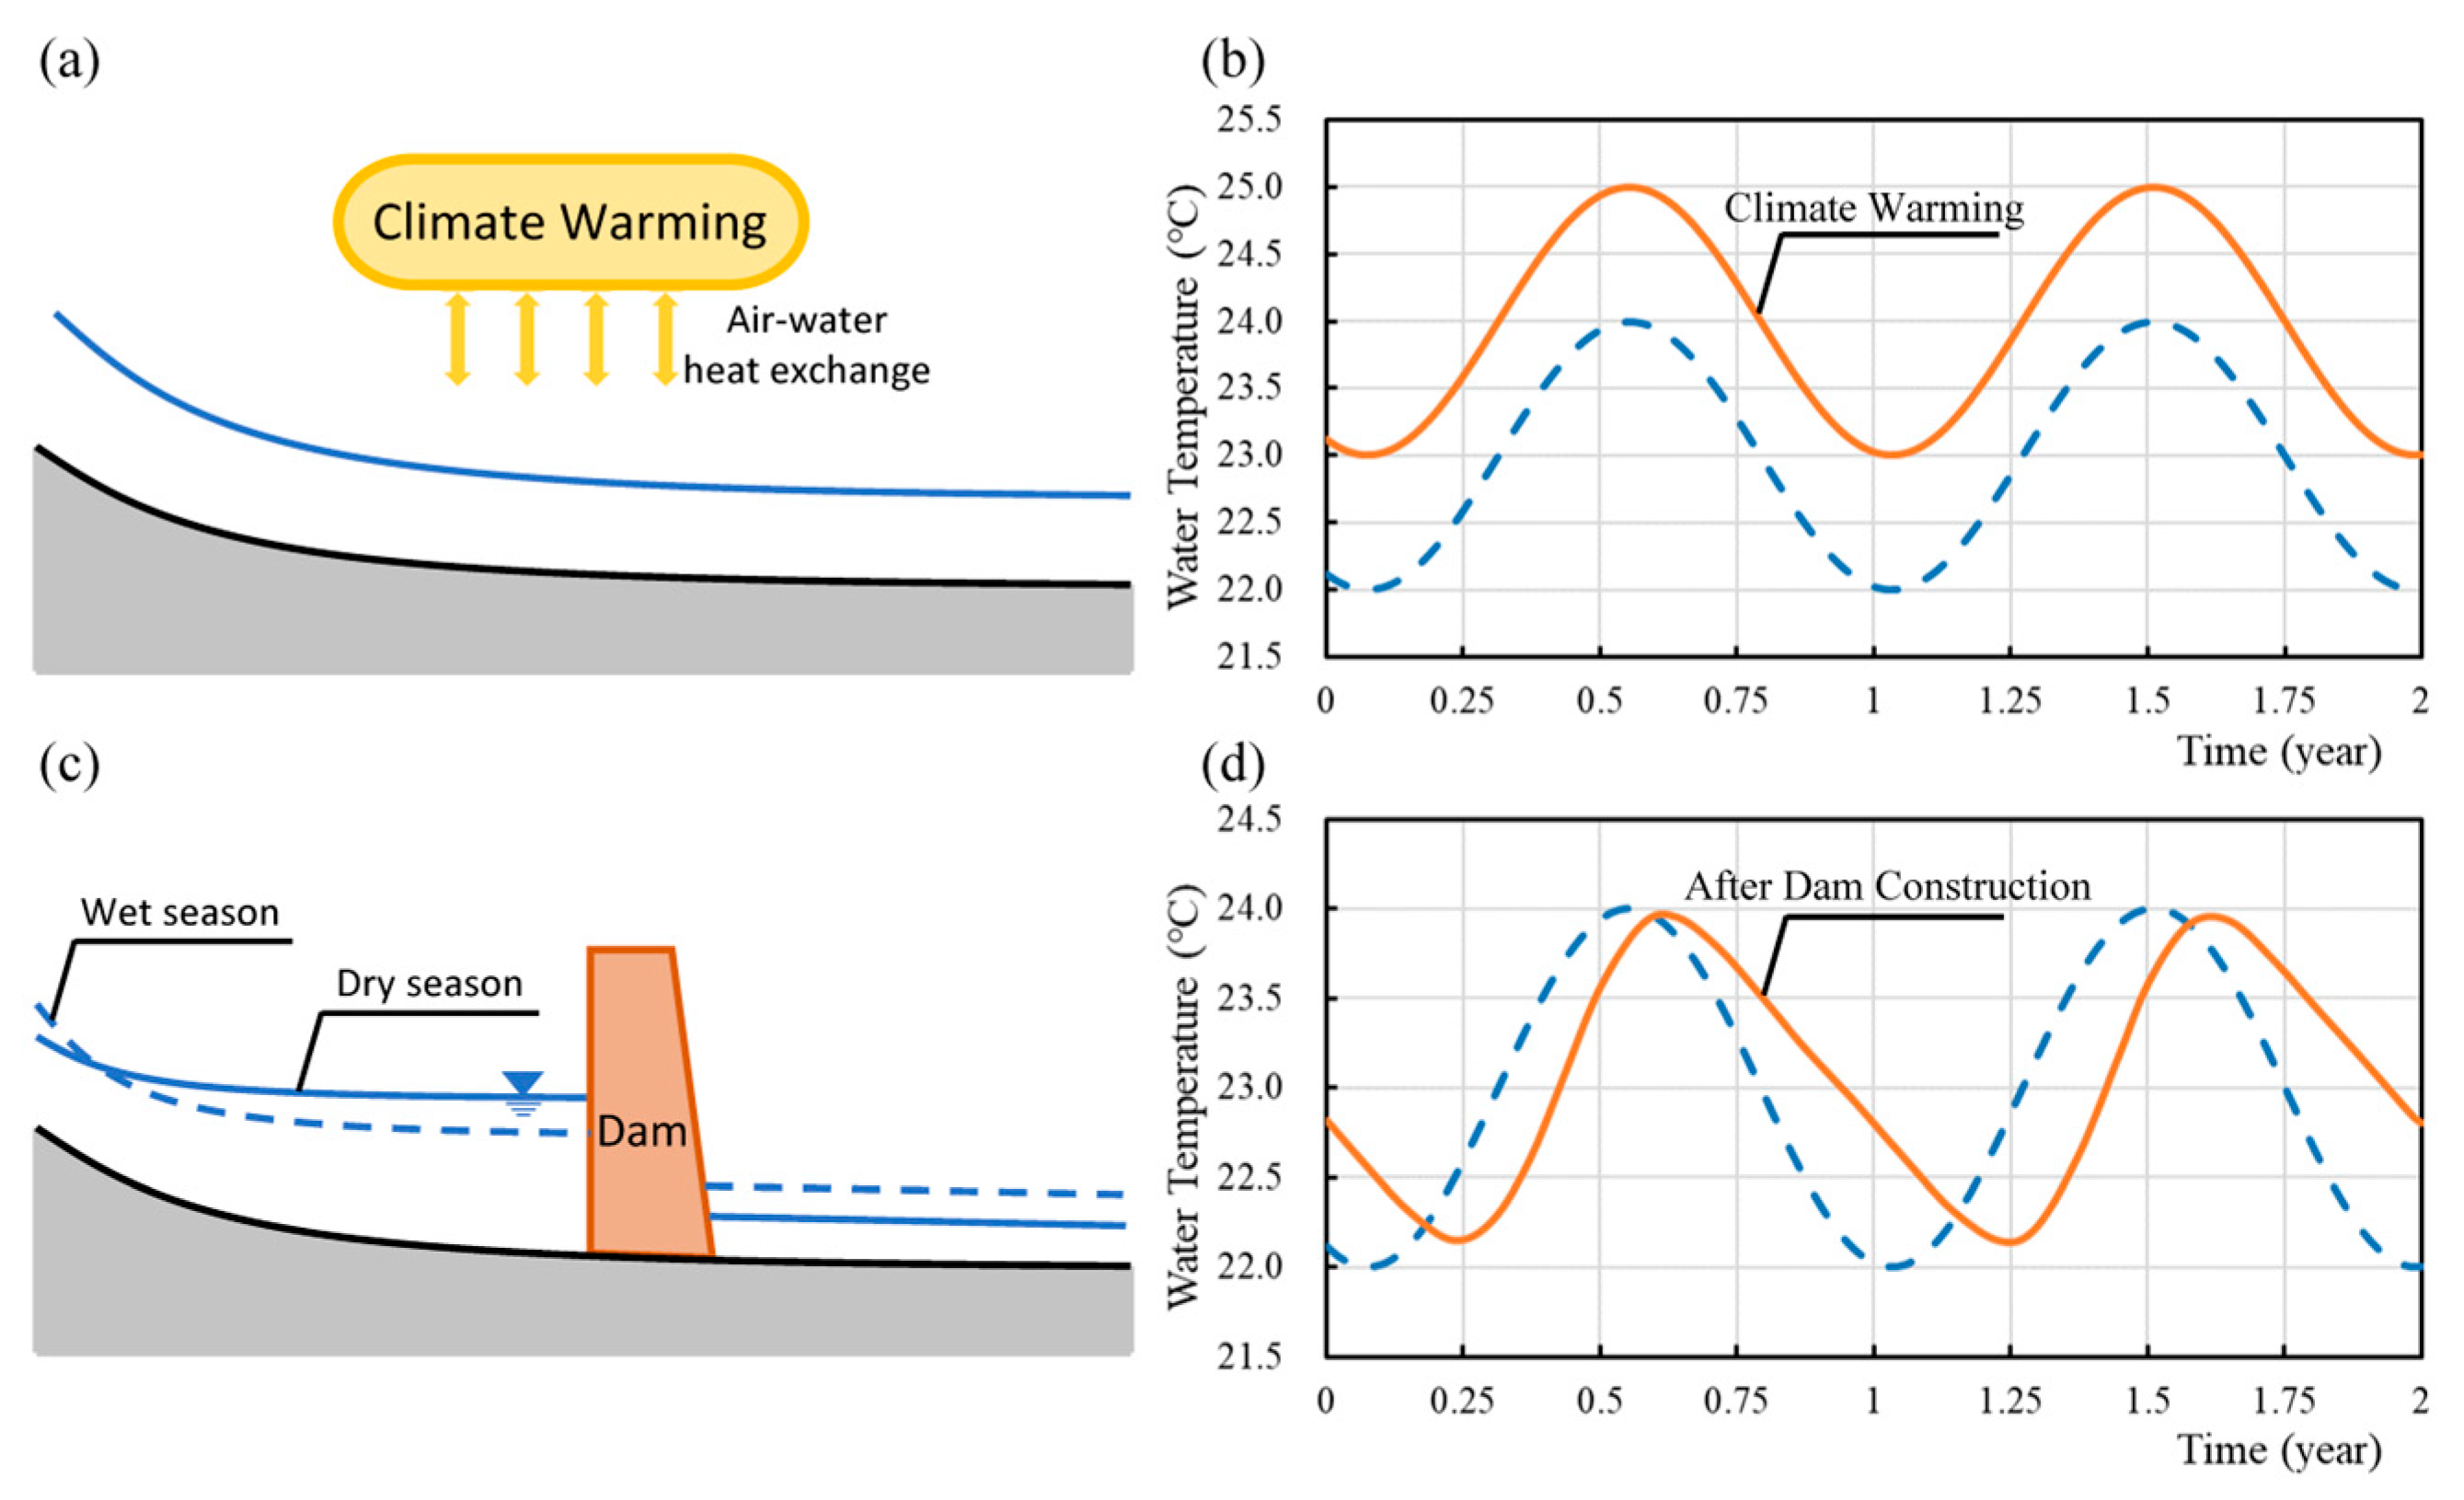
Figure 3 presents a schematic diagram illustrating the changes in water temperature fluctuation curves, attributable either to climate warming or reservoir construction. Figure 3a,b depict how the water temperature in natural rivers follows a sinusoidal pattern influenced by water–air heat exchange and seasonal climate change [44,45], with an overall increase due to global warming [46,47]. Figure 3c,d demonstrate how reservoir regulation modifies the river’s flow and consequently its seasonal water temperature fluctuation pattern [48,49]. Although the Yangtze River Basin has experienced rising temperatures in recent years, the water temperature in its upper and middle reaches does not exhibit a consistent warming trend in line with air temperature [50,51]. This indicates that the “Ribbon” effect observed in the river’s water temperature is not predominantly temperature-driven. This paper posits that the construction and operation of cascade reservoirs in these river sections have significantly altered the water temperature rhythm and heat distribution. Understanding the causes of these changes and analyzing their extent and nature are crucial.

2.2. Methodology

This study aims to investigate the impact of establishment and operation of cascade reservoirs on the water temperature rhythm in the mainstream of the UMYR. To achieve this, we implemented Pearson correlation analysis, the temperature-increasing index ( T ), the extreme fluctuation index ( I E C ), the baseline deviation index ( I B D ), and the phase offset time index ( I P O ) [52,53,54]. Recognizing that natural surface water temperatures typically follow an annual cycle with symmetric warming and cooling phases due to seasonal meteorological changes, we employed sinusoidal functions—specifically cosine and sine—to model these variations [45,55]. Our study utilized these functions to fit the seasonal water temperature data collected from the UMYR. The efficacy of our models is confirmed in Supplementary Table S1, where the Coefficient of Determination ( R 2 ) for all fits exceeds 0.95, demonstrating the sinusoidal function’s precision in representing the rhythmic patterns of water temperature fluctuations. This suggests that water temperature’s intra-annual variation process can be considered as a simple harmonic wave, characterized by its phase and amplitude. In this study, we take the water temperature rhythm of the first period as a reference to evaluate the fluctuation effects of water temperature. Utilizing T , I E C , I B D , and I P O , we conduct a comparative analysis of the characteristics of water temperature rhythm changes in the river pre- and post-reservoir disturbance. This approach allows for a quantitative analysis of the effects arising from the construction and operation of cascade reservoirs.

2.2.1. Pearson Correlation Analysis

In this study, Pearson correlation analysis was employed to investigate the main influencing factors of spatial and temporal changes in water temperature in the mainstream of the UMYR. Previous studies indicate that anthropogenic activities, such as reservoir construction, have considerable effects on the natural air–water temperature synchronization. The weakening of the natural air–water temperature synchrony implies a diminished impact of air temperature on water temperature [56]. Therefore, the Pearson correlation coefficient between the water temperature and the meteorology can be used to characterize the synchronization of the natural air–water temperature and thus reveal the influence of anthropogenic activities on water temperature. Furthermore, changes in river flow are another contributing factor to water temperature variations [57,58]. Previous research by Xiong et al. has demonstrated a significant correlation between river flow and water temperature downstream of the TGD [59]. Building on this, our study conducts Pearson correlation analysis between flow and water temperature at various hydrological stations along the UMYR.

2.2.2. The Temperature-Increasing Index

T reflects the variation pattern of water temperature from upstream to downstream and serves as a fundamental basis for understanding and analyzing the spatial characteristics of river water temperatures. The calculation formula is as follows:
T = 100 T u p T d o w n / L
where T is the temperature-increasing index, °C/100 km; T u p and T d o w n represent the annual average water temperatures at two points from upstream to downstream, respectively, °C; L is the distance between the two points, km.

2.2.3. The Extreme Fluctuation Index

I E C represents the ratio of the variation in river water temperature after dam construction to the variation in natural water temperature before dam construction. If the value of I E C is less than 1, it indicates a reduction in the extremity of water temperature fluctuations after impoundment compared to before impoundment, suggesting a homogenization effect on river water temperature following dam construction. The calculation formula is as follows:
I E C = T m a x , c T m i n , c / T m a x , n T m i n , n
where I E C is the extreme fluctuation index; T m a x , c and T m i n , c represent the annual maximum and minimum river water temperatures after impoundment, °C; T m a x , n and T m i n , n represent the annual maximum and minimum values of natural water temperature before impoundment, °C.
Based on Equation (2), the seasonal extreme fluctuation index ( I E C s ) is obtained with the following expression:
I E C s = T m a x , c s T m i n , c s / T m a x , n s T m i n , n s
where I E C s is the seasonal extreme fluctuation index; T m a x , c s and T m i n , c s represent the seasonal maximum and minimum water temperatures of the river after impoundment during cold or warm seasons, °C; T m a x , n s and T m i n , n s represent the seasonal maximum and minimum water temperatures before impoundment during cold or warm seasons, °C.

2.2.4. The Baseline Deviation Indicator

I B D represents the relative value of the deviation between the river water temperature after the dam construction and the natural water temperature before the dam construction, ranging from 0 to 1. The higher the value of the I B D , the greater the disparity between the fluctuation curve of river water temperature after impoundment and that before impoundment, which reflects a more pronounced combined effect of the natural factors and the regulation of the reservoir on the river water temperature. The formula is as follows:
I B D = i = 1 12 T i , c T i , n 2 / i = 1 12 T i , n T ¯ 2
where I B D is the baseline deviation index; T ¯ is the annual mean water temperature before impoundment, °C; T i , c is the monthly mean water temperature after impoundment, °C; T i , n is the monthly mean water temperature before impoundment, °C; and i refers to month ( i = 1, 2, 3, …, 12).
By replacing the numerator of Equation (4) to the sum of squared differences in monthly mean water temperature before and after impoundment during the cold (warm) season (six months), the expression of the seasonal baseline deviation index ( I B D s ) can be obtained. The sum of the I B D s of the cold season and the warm season is equal to the I B D . The formula is as follows:
I B D s = i s = 1 6 T i s , c s T i s , n s 2 / i = 1 12 T i , n T ¯ 2
where I B D s is the seasonal baseline deviation index; T i s , c s is the monthly mean water temperature after impoundment during cold or warm seasons, °C; T i s , n s is the monthly mean water temperature before impoundment during cold or warm seasons, °C; i s refers to the month within the cold or warm seasons.

2.2.5. The Phase Offset Time Index

I P O represents the phase difference in river water temperature before and after reservoir impoundment. The calculation principle of I P O is based on vector analysis and the concept of precipitation concentration period, which was proposed by Zhang and Qian to analyze the annual distribution characteristics of precipitation and its interannual variations [60]. Vector analysis has been widely used to study the annual distribution patterns of runoff and river water temperature [52,61,62]. In this study, we regard the daily water temperature as a vector, in which the daily water temperature amount is viewed as the length of the vector, and the corresponding day is taken as the direction of the water temperature vector. The annual distribution of water temperature of each year during the study period is considered as a cycle (360°), and then, one day corresponds to 0.986° (360°/365). The daily water temperature is decomposed into the horizontal and vertical components, respectively, and the former is expressed as the sine value and the latter as the cosine value of the daily water temperature along the respective angle of the day. In this way, the water temperature vector module for each day of the year is, respectively, added up to two synthetic components in horizontal and vertical directions. The water temperature concentration period is defined as the tangent of the ratio of the synthetic component in horizontal to the synthetic component in vertical, which can objectively reflect the time when the center of gravity of the annual water temperature concentration occurs. Based on one day corresponding to 0.986°, the calculated tangent angle can be converted into the number of days. After calculating the water temperature concentration period for each year in the three periods, we averaged the water temperature concentration periods of the years included in each period. The difference between the concentration period of the river water temperature after the construction of the reservoir and the concentration period of the natural river reference water temperature can reflect the phase shift value of the water temperature. The calculation formula is as follows:
I P O = D c D n
D c = tan 1 ( i = 1 365 T i , c sin θ i , c / i = 1 365 T i , c cos θ i , c )
D n = tan 1 ( i = 1 365 T i , n sin θ i , n / i = 1 365 T i , n cos θ i , n )
where I P O is the phase offset time index, days; D n and D c represent the water temperature concentration periods before and after impoundment, days; T i , n and T i , c represent the water temperature on day number i before and after impoundment, °C; θ i , n and θ i , c represent the vector angle of the water temperature on day number i before and after impoundment ( θ i , n ( θ i , c ) = 0.986°, 1.973°,…, 360°).
Based on Equations (6)–(8), the cold season phase offset time index ( I P O , c o l d ) and the warm season phase offset time index ( I P O , w a r m ) are obtained with the following expressions:
I P O s = D c s D n s
D c s = tan 1 ( i = 1 m T i , c s sin θ i , c s / i = 1 m T i , c s cos θ i , c s )
D n s = tan 1 ( i = 1 m T i , n s sin θ i , n s / i = 1 m T i , n s cos θ i , n s )
where I P O s is the seasonal phase offset index, days; D n s and D c s represent the concentration periods of river water temperature before and after impoundment during cold or warm seasons, respectively, days; T i , n s and T i , c s represent the water temperatures on day number i of the current quarter before and after impoundment, °C; m is the number of days within cold or warm seasons, days; θ i , n s and θ i , c s represent the angle of the water temperature vectors on day number i of cold or warm seasons before and after impoundment ( θ i , n s ( θ i , c s ) = 360°/ m , 720°/ m ,…, 360°).

3. Results

3.1. Influencing Factors of Water Temperature in the Mainstream of the Upper and Middle Reaches of the Yangtze River

The Pearson correlation analysis results between water temperature and air temperature, as well as water temperature and discharge at various hydrological stations along the UMYR, are presented in Table 3. The analysis reveals a significant linear correlation between water temperature and air temperature across the entire river section under study, with significance levels at p < 0.01. Notably, most correlation coefficients between water temperature and air temperature exceeded 0.850, indicating a strong positive relationship. From a temporal perspective, the Pearson correlation coefficients between water temperature and air temperature exhibit a notable decreasing trend over time at the PZH, SDZ, and LJ hydrological stations. However, no significant variations are observed over time at other hydrological stations. From a spatial perspective, the Pearson correlation coefficients between water temperature and air temperature at hydrological stations downstream of dams were significantly lower than those without dam influence. For instance, the Pearson correlation coefficients at the NJG hydrological station and the YC hydrological station, located downstream of the TGR, fluctuated around 0.750, whereas the Pearson correlation coefficients at the CT hydrological station and the HK hydrological station, situated farther away from the TGR, could exceed 0.900. The ZDM hydrology station experiences ice phenomena in January, February, and December, during which the water temperature is maintained at 0 °C. Consequently, the Pearson correlation coefficient between water temperature and air temperature at this station is comparatively lower than that observed at the downstream BT and SG hydrology stations.
The correlation between water temperature and discharge at each hydrological station in the study area also passed the significance test of p < 0.01. However, the correlation coefficients were generally lower than those between water and air temperatures except for the PZH and SDZ hydrology stations in the third period. From a temporal perspective, in the upper reaches of the Jinsha River, the ZDM, BT, and SG hydrological stations were not affected by the regulated discharge of cascade reservoirs. The correlation coefficient between water temperature and discharge initially decreased and then increased during the three periods. However, at the PZH hydrology station located in the middle reaches of the Jinsha River where and water temperatures were regulated by cascade reservoirs, there was a continuous increase in correlation coefficient between water temperature and discharge during the three periods. The correlation coefficient between water temperature and discharge of the SDZ hydrology station increased significantly in the third period, but was lower than that of the PZH hydrology station, which may be related to the complicated hydrology caused by the regulation of water flow by cascade reservoirs in the middle reaches of the Jinsha River and the confluence of the Yalong River.

3.2. The Temperature-Increasing Index

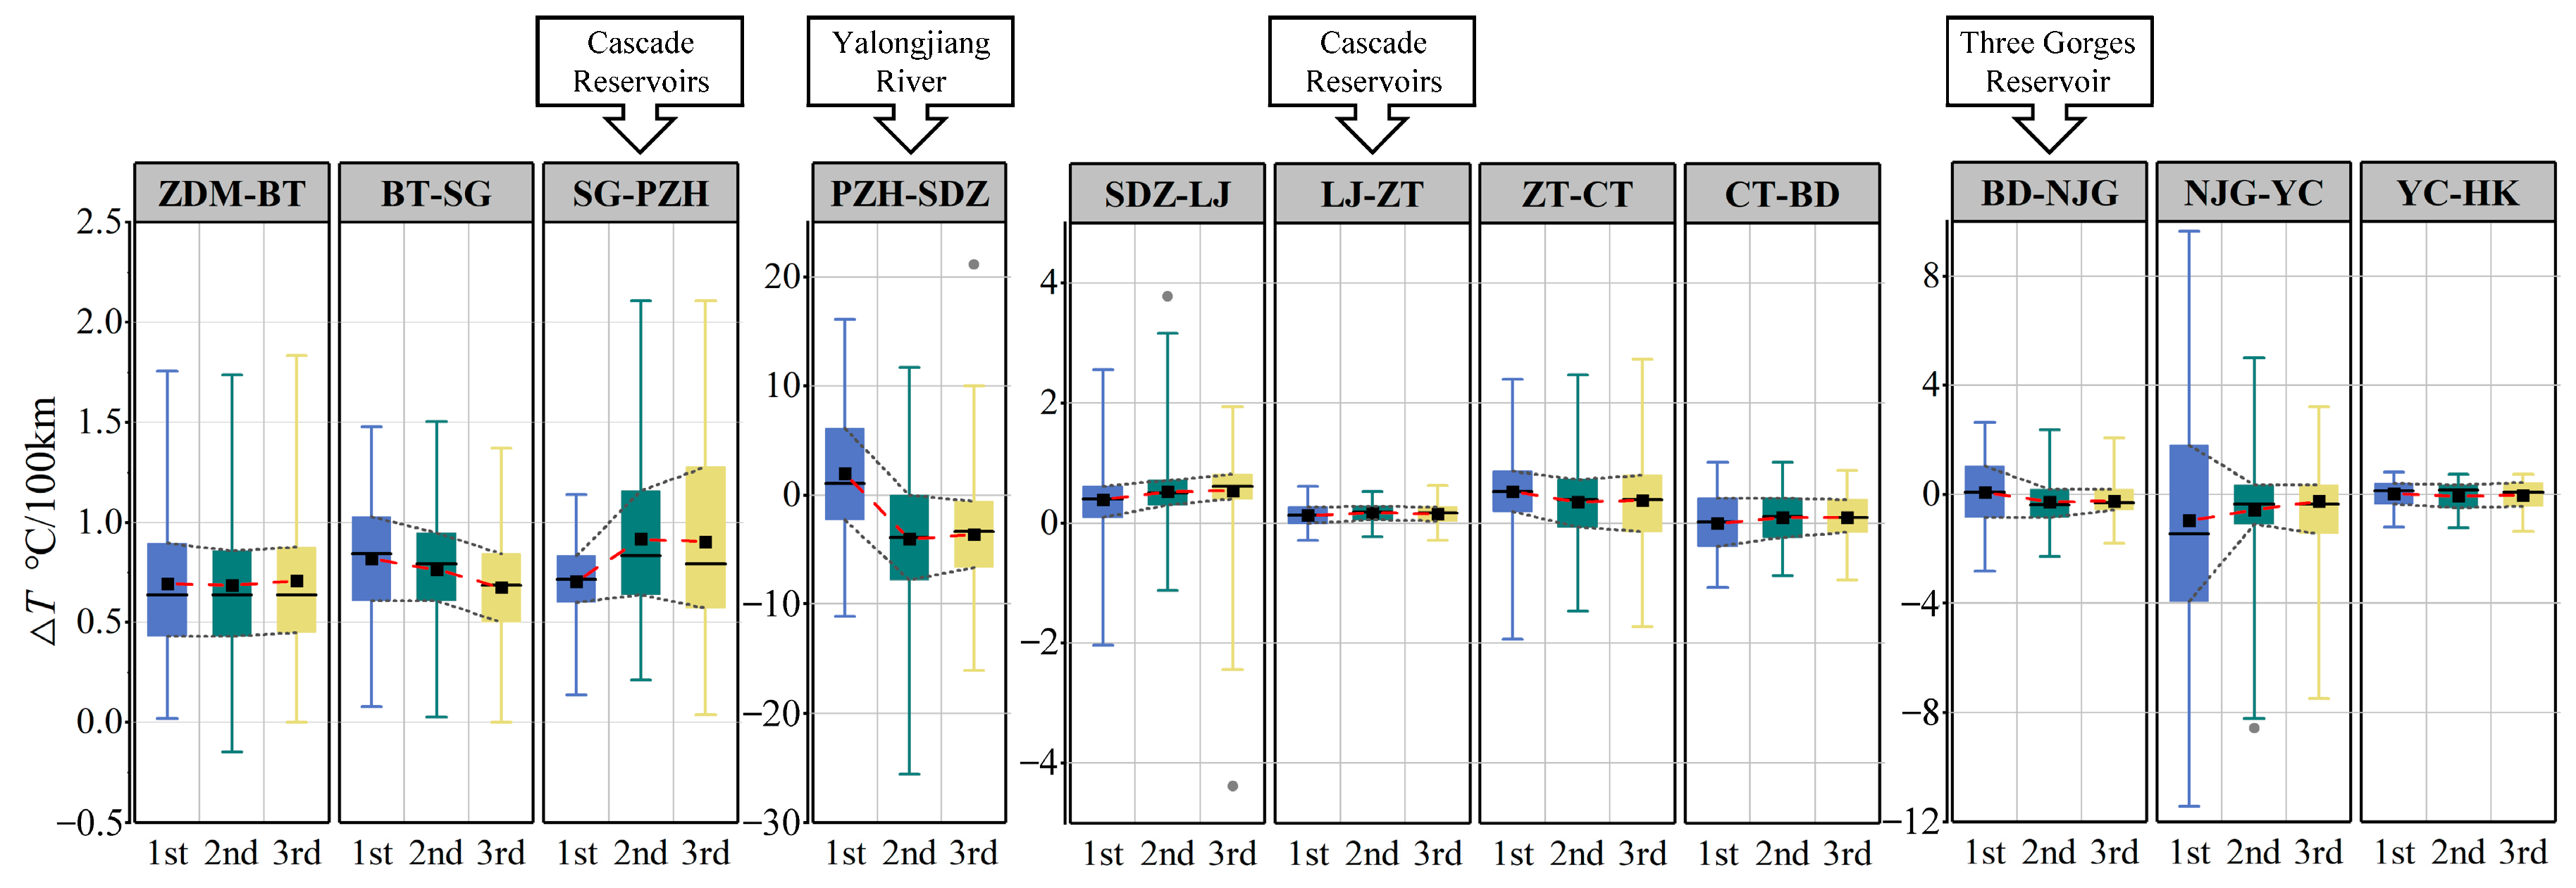
The T was calculated using the daily water temperatures from the mainstream of the UMYR (Figure 4). From a spatial perspective, the water temperature in the upper and middle reaches of the Jinsha River primarily exhibits a longitudinal warming trend, while both cooling and warming trends are observed longitudinally in the water temperature along the lower reaches of the Jinsha River and the middle reaches of the Yangtze River. For example, from the ZDM hydrological station to the BT hydrological station and the BT hydrological station to the SG hydrological station, the warming trend in the longitudinal direction was evident, with a distribution range of 0.43~0.89 °C/100 km and 0.50~1.02 °C/100 km, respectively. However, the section from the ZT hydrological station to the CT hydrological station exhibited a cooling phenomenon in the longitudinal direction, with a T distribution range of −0.13~0.87 °C/100 km. Meanwhile, the construction and operation of cascade reservoirs or tributary confluences significantly affect the distribution patterns of the T . In the section from the SG hydrological station to the PZH hydrological station, there was a prominent increase in the main distribution range of the T , ranging from 0.60~0.83 °C/100 km in the first period to 0.57~1.28 °C/100 km in the third period. The section from the PZH hydrological station to the SDZ hydrological station experienced a substantial increase in the range of fluctuation in the T , with a minimum of −25.56 °C/100 km and a maximum of 16.11 °C/100 km under the influence of the Yalong River confluence. After the construction of the middle reaches of the Jinsha River cascade reservoirs, there was a significant reduction in the median values of the T from 1.11 °C/100 km to −3.89 °C/100 km, indicating the inflow of the Yalong River gradually transitioned to the role of cooling the mainstream. Additionally, in the first period, the distribution of the T in the CT-BD, BD-NJG, and NJG-YC sections were −0.38~0.42 °C/100 km, −0.85~1.04 °C/100 km, and −3.93~1.79 °C/100 km, respectively, and showed an increasing trend longitudinally. This trend suggested that the operations of the TGR and GZB intensified water temperature fluctuations downstream compared to the upper reaches. The T of the BD to NJG section decreased from −0.85~1.04 °C/100 km in the first period to −0.57~0.19 °C/100 km in the third period. Similarly, the T of the NJG to YC section decreased from −3.93~1.79 °C/100 km in the first period to −1.43~0.36 °C/100 km in the third period, indicating that the water temperature difference between the upper and lower reaches of the TGD and GZB gradually decreased in time, which was related to the operation mode of the TGD and GZB.

3.3. The Extreme Fluctuation Index

Taking the first period as the base value, the I E C was calculated and plotted in the heat map (Figure 5a). The I E C for the ZDM, GT, BT, and SG hydrological stations ranged from 1.03 to 0.87, indicating relatively stable water temperature extremes. However, at the PZH hydrological station, the I E C decreased by 21.3% in 2015 and continued to decline annually, reaching 0.69 in the third period, which indicated that the construction and operation of reservoirs in the middle reaches of the Jinsha River had progressively led to the increasing homogeneity of downstream water temperature over the years. Similarly, the I E C of the ZT hydrological station had been decreasing annually due to the impoundment of the XLD reservoir and the XJB reservoir. The influence of the Yalong River inflow resulted in an initial decrease and subsequent increase in the I E C at the SDZ hydrological station, indicating that tributary confluences can also modify the water temperature fluctuation patterns in the mainstream. Upstream changes in water temperature rhythm are transmitted downstream, as evidenced by a 20% and 30% reduction in the I E C at the LJ and HT hydrological stations, respectively, in 2015, which indicated that the distribution range of water temperature extremes also showed significant contraction. With atmospheric interaction, the water temperature gradually returns to the near-natural state. The increase in the I E C from the ZT to BD hydrological stations suggest that the homogenizing effect of the downstream Jinsha River cascade reservoirs on water temperature was gradually weakening along the river. Figure 5b,c illustrate that the homogenization effect is generally more pronounced during the cold season than in the warm season. Compared with the PZH hydrology station, the I E C of the SDZ hydrology station increased by 0.03~0.60 in the warm season, while that of the cold season was −0.08~0.18. It can be seen that the inflow of Yalong River in the warm season had a stronger weakening effect on the homogenization of water temperature of the mainstream. On the contrary, compared with the ZT hydrology station, the I E C of the CT hydrology station increased by 0.17~0.36 in the cold season, while it was −0.08~0.12 in the warm season. It can be seen that the homogenization effect of water temperature in the ZT-CT section in the cold season was weakened to a higher degree under the effect of the heat exchange process at the air–water interface and the inflow of the Jialing River. The I E C s of the CT hydrology station in the warm season was 0.68~0.74, and there was still an obvious homogenization effect of water temperature.

3.4. The Baseline Deviation Index

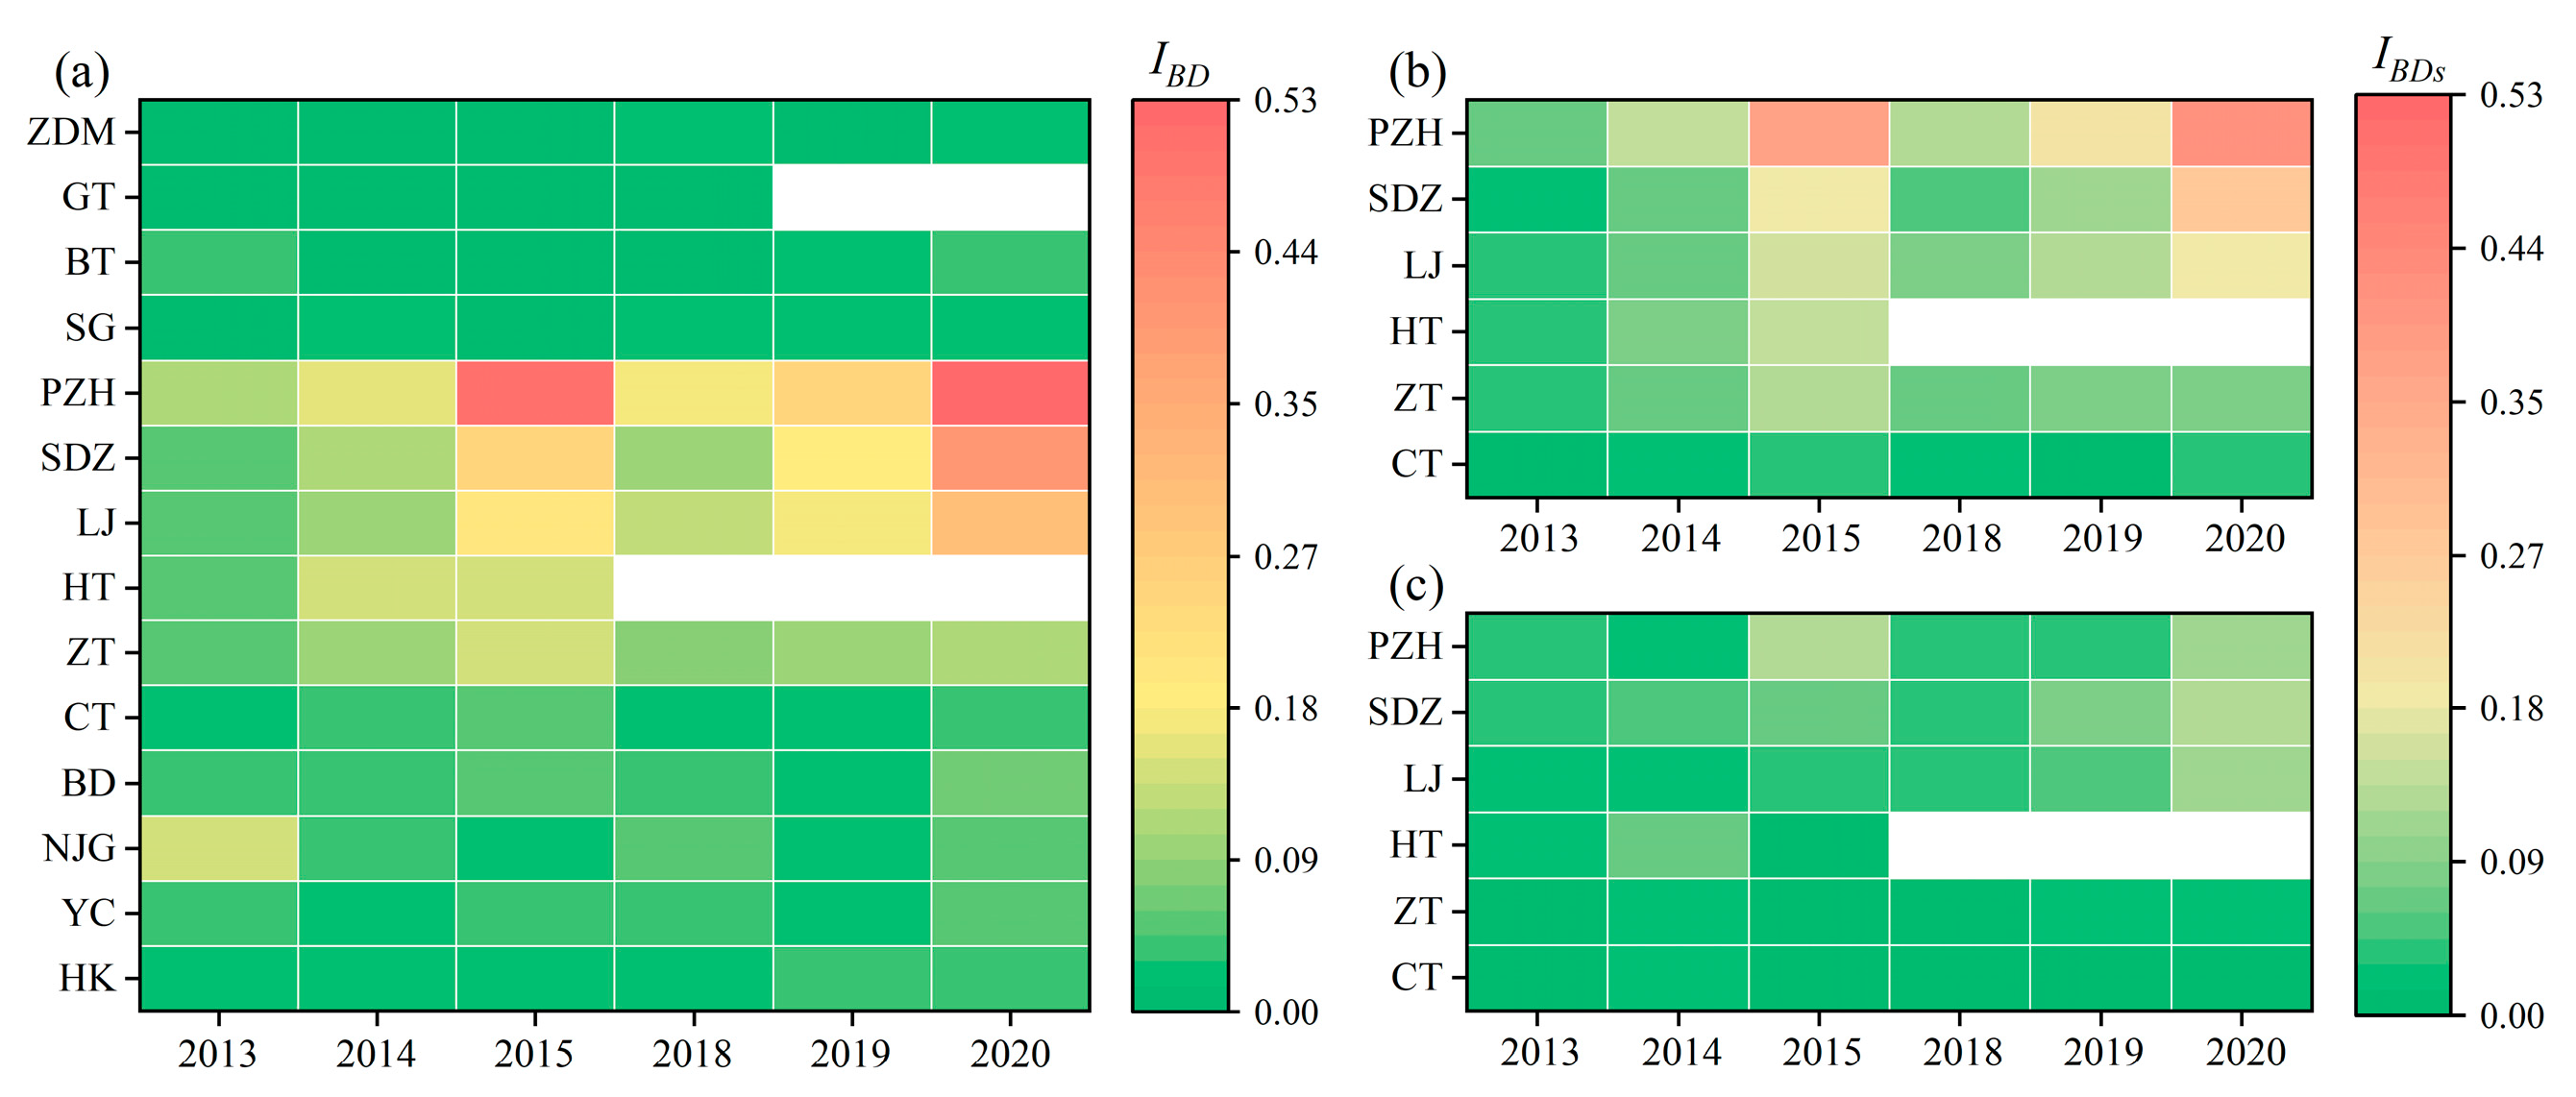
Taking the first period as the base value, the I B D was computed and visually represented on a heat map (Figure 6a). The I B D of ZDM, GT, BT, and SG hydrological stations varied from 0.003 to 0.038, indicating a slight alteration in the water temperature rhythm compared to the baseline. Conversely, the I B D of the PZH hydrological station ranged from 0.103 to 0.528, signifying a consistent upward trend. Notably, in 2015 and 2018, the I B D surpassed 0.500, indicating a significant transformation in the water temperature rhythm at the PZH hydrological station. Under the influence of the changes in upstream water temperature rhythm, the I B D in the lower reaches of the Jinsha River was one order of magnitude higher than that in the middle and upper reaches and exhibited interannual variations consistent with those observed at the PZH hydrological station. From a spatial perspective, the I B D along the PZH to the CT section demonstrated a decreasing trend along the river, and the water temperature rhythm at the CT hydrological station progressively recovered to a state similar to that of the first period, with values fluctuating between 0.020 and 0.051. From the perspective of time, the I B D of each hydrologic station in the PZH to the CT section was related to the hydrological conditions of the river, and the results showed that the water temperature curve of the downstream of cascade reservoir had a more obvious deviation degree from the natural water temperature before dam construction under the condition of high discharge. The I B D along the BD to the HK section fluctuated around 0.040, indicating that the water temperature rhythm exhibited minor fluctuations in the TGD region and its downstream during these periods. The I B D s in the cold season of the PZH to the CT section accounted for 49–93% of I B D , indicating that the baseline deviation of water temperature in the mainstream of the Yangtze River primarily occurred in the cold season (Figure 6b,c). Furthermore, the seasonal variation pattern was similar to the annual scale, in which the cold season exhibited a pronounced consistency with the annual scale.

3.5. The Phase Offset Time Index

Taking the first period as the base period, the phase offset time indexes I P O 1 and I P O 2 in the second period and the third period were computed and presented in Table 4. The I P O at the upper reaches of the Jinsha River fluctuated around 0, and the water temperature fluctuation curve exhibited a slight lag or lead, primarily due to the interaction between the atmosphere and water temperature. However, following the construction of cascade reservoirs in the middle and lower Jinsha River, the I P O for the downstream of the reservoirs significantly increased, and the water temperature fluctuations displayed a water temperature lagging effect, which intensified over time. In contrast to the first period, the water temperature concentration period of the PZH hydrological station in the second and third periods shifted by 19.7 and 28.1 days, respectively. The annual phase shift index for hydrological stations downstream of the PZH hydrological station gradually decreased along the mainstream. The lagging effect of water temperature fluctuation weakened until the BD hydrological station, where the phase shift of the water temperature fluctuation curve resumed for approximately 2 days. In the section from NJG to HK, the I P O was negative and decreasing in the longitudinal direction, which meant that the phase of the water temperature fluctuation curve was shifting slightly forward with the degree of shift accumulating over time.
The seasonal phase offset time indexes for the second and third periods were calculated as shown in Figure 7. It was evident that the phase shift index of water temperature in the mainstream of the UMYR was notably greater during the cold season than in the warm season. For example, the phase shift index of the lower reaches of the Jinsha River in the cold season was 4.42~14.97 days higher than that in the warm season. Furthermore, the alteration pattern of seasonal phase offset at hydrological stations resembled that of the annual scale. For instance, the PZH hydrological station exhibited a substantial increase in the number of days of seasonal phase offset compared to the SG hydrological station, as the I P O 1 , c o l d and I P O 2 , c o l d were 23.00 days and 31.33 days, respectively. Moreover, the extent of phase offset diminished along the lower reaches of the Jinsha River.

4. Discussion

4.1. Factors Influencing Water Temperature Distribution in the Yangtze River’s Upper and Middle Reaches

The primary factors affecting water temperature in natural rivers include meteorological conditions, river flow, and topography [12]. Meteorological conditions play a crucial role in thermodynamic exchange at the water–air interface [63]. This study confirms that air temperature is a key determinant of water temperature, as evidenced by the Pearson correlation analysis between water temperature and air temperature in the mainstream of UMYR.
River flow, which directly impacts the river’s heat capacity, is another vital factor [64,65]. The Pearson correlation analysis conducted in this study reveals a positive association between water temperature and discharge in the mainstream of UMYR. As sources of flow and heat, tributaries also contribute significantly [66]. The tributaries like the Yalong River affect the thermal regime of the mainstream of UMYR. For example, the section between the PZH hydrological station and the SDZ hydrological station exhibited a significant increase in the range of T , ranging from −25.56 °C/100 km to 16.11 °C/100 km, as influenced by the confluence of the Yalong River.
Topography and geomorphology impact the meteorological and hydrological conditions of rivers, which in turn affect water temperature. In the Jinsha River basin, for example, the upper reaches are marked by high terrain and colder climate, while the middle reaches feature a dry-warm valley climate with higher temperatures [67,68], which explains that the value of T in the middle and upper reaches of the Jinsha River is consistently greater than 0 °C/100 km, indicating a longitudinal warming trend in water temperature.
Numerous reservoirs have been constructed or scheduled for rivers, with dam construction and impoundment having emerged as a primary driver for alterations in river thermal regimes [45,69]. During the second and third periods, cascade reservoirs in the middle reaches of the Jinsha River commenced their impoundment and operation. This led to notable changes in the water temperature rhythms at the PZH hydrological station, the first downstream control station of these reservoirs. According to this study, these changes, characterized by phase shifts in water temperature curves and a consistent increase in water temperature homogenization, underscore the significant role of cascade hydropower development in altering the thermal regime of the Jinsha River’s middle reaches [67,70]. Additionally, the correlation between water and air temperatures downstream of cascade reservoirs in the middle reaches of the Jinsha River weakened significantly post-construction, indicating the potential for cascade reservoirs to disrupt the downstream air–water temperature synchronization [32,56]. Studies have shown that the construction and operation of cascade reservoirs in the lower reaches of the Jinsha River significantly change the water temperature rhythm in the lower reaches [41]. In this study, conspicuous phase shifts and reductions in the extreme value distribution range in the annual water temperature distribution were evident at the ZT hydrological station, which once again affirmed the construction and operation of dams as a primary influencer of the river thermal regime.

4.2. Analysis of Spatial and Temporal Distributions of Water Temperature Evaluation Indexes

Natural river water temperature characteristics provide a reference for analyzing impacts post-dam construction [71]. In the upper Jinsha River, where human disturbance is minimal, indexes like I E C , I B D , and I P O showed slight fluctuations, suggesting minimal natural variation: the I E C remained within a range of approximately 1.00, the I B D remained below 0.040, and the I P O remained within four days, which suggest that the fluctuation in water temperature in the natural river caused by natural factors is slight, aligning with the calculation results of the Tangnaihe hydrological station in the upper reaches of the Yellow River in the natural condition [52].
Although hydropower cascade development in a river basin can harness its hydroelectric potential, the heat source effect of the reservoir can significantly alter the natural fluctuation in river water temperature, affecting the intra-annual and inter-annual water temperature distributions, and as more cascade reservoirs are constructed, their cumulative effect on the water temperature is evident [72]. For instance, in the Jinsha River’s middle reaches, after cascade reservoirs’ construction, all water temperature evaluation indexes downstream of the river changed significantly. From the annual water temperature evaluation indexes, with the establishment and operation of cascade reservoirs, the I E C of the PZH hydrology station decreased year by year from 0.78 in 2015 to 0.68 in 2020, the I B D increased year by year in the second and third periods, reaching 0.502 and 0.528 in 2015 and 2020, respectively, and the I P O in the second and third periods were 19.7 days and 28.1 days, respectively. These values determined that the establishment and operation of the reservoirs caused the downstream water temperature homogenization and lagging effect that have a cumulative impact over time [73,74,75]. On the seasonal scale, cascade reservoirs mainly store water in the cold season, leading to a longer water residence time, whereas in the warm season, the reservoirs have lower water levels, lower flow, and a shorter water residence time, resulting in the thermal regime downstream of the reservoirs being more significantly affected in the cold season [20,75]. For example, the mean value of I E C of each hydrological station in the lower reaches of Jinsha River in the cold season was about 0.15 lower than that in the warm season, the proportion of baseline deviation in the cold season was 49–93%, and the I P O in the cold season was 4.42–14.97 days higher than that in the warm season.
As the river is a continuum, the effect of reservoirs on river water temperature will be transmitted downstream with the water flow [71]. The hydrological stations downstream of the middle reaches of the Jinsha River cascade reservoirs all show different degrees of homogenization and lagging effects. As tributaries such as the Yalong River converge and water–air heat exchange occurs, the effect of the middle reaches of the Jinsha River cascade reservoirs on water temperature gradually diminishes along the river. For instance, the I B D of the SDZ hydrology station decreased by about 50% compared with that of PZH hydrology station, and the I P O of water temperature decreased by 4.1 days. Following the establishment of the XLD dam and XJB dam, the water temperature at the ZT hydrological station also experienced delay and homogenization. However, its degree of impact is significantly smaller than that observed at the Jinsha River upstream hydrological stations. After the natural river section of nearly 262 km from the XJB dam to the ZT hydrological station, the impacts of the water temperature caused by the combined operation of the XLD and XJB dams have significantly recovered. Furthermore, compared with the ZT hydrological station, the influence of the cascade reservoirs on water temperature was further alleviated after passing through nearly 151 kms of the natural river section from the ZT hydrological station to the CT hydrological station again, gradually restoring the natural state water temperature regulation [41].

5. Conclusions

This study quantified the influence of cascade reservoir construction and operation on river thermal regime and systematically analyzed the influencing factors of river thermal regime change in the middle and upper reaches of the Yangtze River. The main findings of this paper are as follows:
  • The construction and operation of cascade reservoirs in the middle and upper reaches of the Yangtze River have weakened the synchronization of water temperature and air temperature in the lower reaches. For instance, with an increase in the number of dams and their extended operation time of cascade reservoirs in the middle reaches of Jinsha River, there was a decline in the Pearson correlation coefficient between water temperature and air temperature at the PZH hydrology station from 0.850 in the first period to 0.823 in the second period, further decreasing to 0.723 in the third period, indicating a significant weakening of synchronization between water temperature and air temperature.
  • The construction and operation of cascade reservoirs in the middle and upper reaches of the Yangtze River have significantly altered the distribution law of river water temperature. The T of the BD to NJG section decreased from −0.85~1.04 °C/100 km in the first period to −0.57~0.19 °C/100 km in the third period. The T of the NJG to YC section decreased from −3.93~1.79 °C/100 km in the first period to −1.43~0.36 °C/100 km in the third period. The operation of the TGD and GZB gradually reduced the difference in water temperature between the upper and lower reaches.
  • The construction and operation of cascade reservoirs in the mainstream of the upper and middle reaches of the Yangtze River caused homogenization and lagging effect of water temperature in the lower reaches, and there was a cumulative effect, which can be quantified by the I E C , I B D and I P O . For example, the I E C of the PZH hydrology station decreased year by year from 0.78 in 2015 to 0.68 in 2020, and the I B D increased year by year in the second and third periods, reaching 0.502 and 0.528 in 2015 and 2020, respectively. The I P O were 19.7 days in the second period and 28.1 days in the third period, respectively. These results indicated that cascade reservoir construction in the middle reaches of the Jinsha River had a cumulative effect on the water temperature in the lower reaches.
  • The homogenization and lagging effect of water temperature in the middle and upper reaches of the Yangtze River were more significant in the cold season than in the warm season. In the lower reaches of the Jinsha River, the mean value of I E C s in the cold season was about 0.15 lower than that in the warm season, the degree of baseline deviation in the cold season accounted for 49~93%, and the I P O , c l o d were 4.42~14.97 days higher than the I P O , w a r m .
  • The inflow of tributaries has a significant impact on the water temperature of the middle and upper reaches of the Yangtze River. After the Yalong River was refluxing, the T of the PZH to SDZ section ranged from −25.56 to 16.11 °C/100 km, and the fluctuation in water temperature was significantly greater than that of other sections. The I B D of the SDZ hydrology station decreased by about 50% compared with that of the PZH hydrology station, and the I P O decreased by 4.1 days. At the same time, the decreasing effect of the Yalong River on the homogenization of water temperature of the mainstream was stronger in the warm season.
  • The process of water–air heat exchange can mitigate the impact of cascading reservoirs on the thermal regime of the river in the middle and upper reaches of the Yangtze River. According to the calculation results of I E C , I B D , and I P O , the homogenization and lagging effects of water temperature in the PZH to HT section and the ZT to BD section were weakened along the way. This suggests that natural heat exchange mechanisms play a critical role in lessening the alterations imposed by reservoirs on the river’s temperature dynamics.

Supplementary Materials

The following supporting information can be downloaded at: https://www.mdpi.com/article/10.3390/w16121669/s1, Table S1: The sinusoidal fitting results for water temperature at hydrological stations in the middle and upper reaches of the Yangtze River.

Author Contributions

Conceptualization, Z.W. and J.M.; methodology, Z.W., J.M. and Y.X.; investigation, Z.T., J.Z., R.X. and H.W.; resources, J.M. and D.L.; writing—original draft preparation, Z.W.; writing—review and editing, J.M., S.Y., Y.X. and D.L.; visualization, Z.W., Z.T., J.Z., R.X. and H.W.; supervision, Z.W. and J.M. All authors have read and agreed to the published version of the manuscript.

Funding

This work was supported by the National Natural Science Foundation of China (grant nos. U2040220 and 52179065), the Open Project Funding of Key Laboratory of Intelligent Health Perception and Ecological Restoration of Rivers and Lakes, Ministry of Education, Hubei University of Technology (HGKFZ01), the Innovation Demonstration Base of Ecological Environment Geotechnical and Ecological Restoration of Rivers and Lakes (2020EJB004), and the Major Science and Technology Program of The Ministry of Water Resources (SKS-2022077).

Data Availability Statement

The data presented in this study are available on request from the corresponding author.

Conflicts of Interest

The authors declare no conflicts of interest.

References

  1. Webb, B.W.; Walling, D.E. Temporal Variability in the Impact of River Regulation on Thermal Regime and Some Biological Implications. Freshw. Biol. 1993, 29, 167–182. [Google Scholar] [CrossRef]
  2. Sahoo, G.B.; Schladow, S.G.; Reuter, J.E. Forecasting Stream Water Temperature Using Regression Analysis, Artificial Neural Network, and Chaotic Non-Linear Dynamic Models. J. Hydrol. 2009, 378, 325–342. [Google Scholar] [CrossRef]
  3. Zhu, S.; Nyarko, E.K.; Hadzima-Nyarko, M. Modelling Daily Water Temperature from Air Temperature for the Missouri River. PeerJ 2018, 6, e4894. [Google Scholar] [CrossRef] [PubMed]
  4. Maavara, T.; Chen, Q.; Van Meter, K.; Brown, L.E.; Zhang, J.; Ni, J.; Zarfl, C. River Dam Impacts on Biogeochemical Cycling. Nat. Rev. Earth Environ. 2020, 1, 103–116. [Google Scholar] [CrossRef]
  5. Zhao, C.S.; Yang, Y.; Yang, S.T.; Xiang, H.; Wang, F.; Chen, X.; Zhang, H.M.; Yu, Q. Impact of Spatial Variations in Water Quality and Hydrological Factors on the Food-Web Structure in Urban Aquatic Environments. Water Res. 2019, 153, 121–133. [Google Scholar] [CrossRef] [PubMed]
  6. Wang, J.; Li, C.; Xu, Y.; Li, S.; Du, J.; Han, Y.; Hu, H. Identifying Major Contributors to Algal Blooms in Lake Dianchi by Analyzing River-Lake Water Quality Correlations in the Watershed. J. Clean. Prod. 2021, 315, 128144. [Google Scholar] [CrossRef]
  7. Wang, Y.; Zhang, N.; Wang, D.; Wu, J. Impacts of Cascade Reservoirs on Yangtze River Water Temperature: Assessment and Ecological Implications. J. Hydrol. 2020, 590, 125240. [Google Scholar] [CrossRef]
  8. Guo, J.; Zheng, Y.; Teng, J.; Wang, X.; Song, J. Characteristics of Spatial Distribution for Microbial Ecology inside and Outside Source Water Reservoir. J. Clean. Prod. 2021, 311, 127697. [Google Scholar] [CrossRef]
  9. Cai, X.; Yao, L.; Hu, Y.; Wang, S.; Wang, Z.; Dahlgren, R. Water Temperature and Organic Carbon Control Spatio-temporal Dynamics of Particle-attached and Free-living Bacterial Communities in a Hypereutrophic Urban River Network. Freshw. Biol. 2023, 68, 1627–1645. [Google Scholar] [CrossRef]
  10. Liu, S.; Xie, Z.; Liu, B.; Wang, Y.; Gao, J.; Zeng, Y.; Xie, J.; Xie, Z.; Jia, B.; Qin, P.; et al. Global River Water Warming Due to Climate Change and Anthropogenic Heat Emission. Glob. Planet. Chang. 2020, 193, 103289. [Google Scholar] [CrossRef]
  11. Soomro, S.; Shi, X.; Guo, J.; Ke, S.; Hu, C.; Asad, M.; Jalbani, S.; Zwain, H.M.; Khan, P.; Boota, M.W. Are Global Influences of Cascade Dams Affecting River Water Temperature and Fish Ecology? Appl. Water Sci. 2023, 13, 106. [Google Scholar] [CrossRef]
  12. Caissie, D. The Thermal Regime of Rivers: A Review. Freshw. Biol. 2006, 51, 1389–1406. [Google Scholar] [CrossRef]
  13. Hannah, D.M.; Garner, G. River Water Temperature in the United Kingdom Changes over the 20th Century and Possible Changes over the 21st Century. Prog. Phys. Geogr. 2015, 39, 68–92. [Google Scholar] [CrossRef]
  14. Zhu, S.; Piotrowski, A.P. River/Stream Water Temperature Forecasting Using Artificial Intelligence Models: A Systematic Review. Acta Geophys. 2020, 68, 1433–1442. [Google Scholar] [CrossRef]
  15. Isaak, D.J.; Wollrab, S.; Horan, D.; Chandler, G. Climate Change Effects on Stream and River Temperatures across the Northwest U.S. from 1980-2009 and Implications for Salmonid Fishes. Clim. Chang. 2012, 113, 499–524. [Google Scholar] [CrossRef]
  16. Chang, H.; Psaris, M. Local Landscape Predictors of Maximum Stream Temperature and Thermal Sensitivity in the Columbia River Basin, USA. Sci. Total Environ. 2013, 461–462, 587–600. [Google Scholar] [CrossRef] [PubMed]
  17. van Vliet, M.T.H.; Franssen, W.H.P.; Yearsley, J.R.; Ludwig, F.; Haddeland, I.; Lettenmaier, D.P.; Kabat, P. Global River Discharge and Water Temperature under Climate Change. Glob. Environ. Chang. 2013, 23, 450–464. [Google Scholar] [CrossRef]
  18. Zarfl, C.; Lumsdon, A.E.; Berlekamp, J.; Tydecks, L.; Tockner, K. A Global Boom in Hydropower Dam Construction. Aquat. Sci 2015, 77, 161–170. [Google Scholar] [CrossRef]
  19. Daniels, M.E.; Danner, E.M. The Drivers of River Temperatures Below a Large Dam. Water Resour. Res. 2020, 56, e2019WR026751. [Google Scholar] [CrossRef]
  20. Guo, W.; Yang, H.; Ma, Y.; Hong, F.; Wang, H. Multi-Scale Impact of Climate Change and Cascade Reservoirs on Hydrothermal Regime Alteration in Regulated Rivers. J. Hydrol. Reg. Stud. 2022, 44, 101220. [Google Scholar] [CrossRef]
  21. Vishwakarma, D.K.; Ali, R.; Bhat, S.A.; Elbeltagi, A.; Kushwaha, N.L.; Kumar, R.; Rajput, J.; Heddam, S.; Kuriqi, A. Pre- and Post-Dam River Water Temperature Alteration Prediction Using Advanced Machine Learning Models. Environ. Sci. Pollut. Res. 2022, 29, 83321–83346. [Google Scholar] [CrossRef]
  22. Best, J. Anthropogenic Stresses on the World’s Big Rivers. Nat. Geosci. 2019, 12, 7–21. [Google Scholar] [CrossRef]
  23. Wu, H.; Wu, H.; Jin, C.; Jijun, X.; Zeng, G.; Lianhai, S.; Liu, Q.; Qiang, L.; Liu, Q.; Zhengjie, Y.; et al. Effects of Dam Construction on Biodiversity: A Review. J. Clean. Prod. 2019, 221, 480–489. [Google Scholar] [CrossRef]
  24. Grill, G.; Lehner, B.; Thieme, M.; Geenen, B.; Tickner, D.; Antonelli, F.; Babu, S.; Borrelli, P.; Cheng, L.; Crochetiere, H.; et al. Mapping the World’s Free-Flowing Rivers. Nature 2019, 569, 215–221. [Google Scholar] [CrossRef] [PubMed]
  25. Zhang, J.; Huang, T.; Chen, L.; Zhu, D.Z.; Zhu, L.; Feng, L.; Liu, X. Impact of the Three Gorges Reservoir on the Hydrologic Regime of the River-Lake System in the Middle Yangtze River. J. Clean. Prod. 2020, 258, 121004. [Google Scholar] [CrossRef]
  26. Chen, J.; Finlayson, B.L.; Wei, T.; Sun, Q.; Webber, M.; Li, M.; Chen, Z. Changes in Monthly Flows in the Yangtze River, China—With Special Reference to the Three Gorges Dam. J. Hydrol. 2016, 536, 293–301. [Google Scholar] [CrossRef]
  27. Zhang, X.; Yang, H.; Zhang, W.; Fenicia, F.; Peng, H.; Xu, G. Hydrologic Impacts of Cascading Reservoirs in the Middle and Lower Hanjiang River Basin under Climate Variability and Land Use Change. J. Hydrol. Reg. Stud. 2022, 44, 101253. [Google Scholar] [CrossRef]
  28. Luo, Z.; Zhang, S.; Liu, H.; Wang, L.; Wang, S.; Wang, L. Assessment of Multiple Dam- and Sluice-Induced Alterations in Hydrologic Regime and Ecological Flow. J. Hydrol. 2023, 617, 128960. [Google Scholar] [CrossRef]
  29. Wang, S.; Wang, S.; Wang, S.; Qian, X.; Han, B.-P.; Luo, L.; Luo, L.-C.; Hamilton, D.P. Effects of Local Climate and Hydrological Conditions on the Thermal Regime of a Reservoir at Tropic of Cancer, in Southern China. Water Res. 2012, 46, 2591–2604. [Google Scholar] [CrossRef]
  30. Winton, R.S.; Calamita, E.; Wehrli, B. Reviews and Syntheses: Dams, Water Quality and Tropical Reservoir Stratification. Biogeosciences 2019, 16, 1657–1671. [Google Scholar] [CrossRef]
  31. Olden, J.D.; Naiman, R.J. Incorporating Thermal Regimes into Environmental Flows Assessments: Modifying Dam Operations to Restore Freshwater Ecosystem Integrity. Freshw. Biol. 2010, 55, 86–107. [Google Scholar] [CrossRef]
  32. Kędra, M.; Wiejaczka, Ł. Disturbance of Water-Air Temperature Synchronisation by Dam Reservoirs. Water Environ. J. 2016, 30, 31–39. [Google Scholar] [CrossRef]
  33. Long, L.; Ji, D.; Liu, D.; Yang, Z.; Lorke, A. Effect of Cascading Reservoirs on the Flow Variation and Thermal Regime in the Lower Reaches of the Jinsha River. Water 2019, 11, 1008. [Google Scholar] [CrossRef]
  34. Ouyang, W.; Hao, F.; Song, K.; Zhang, X. Cascade Dam-Induced Hydrological Disturbance and Environmental Impact in the Upper Stream of the Yellow River. Water Resour. Manag. 2011, 25, 913–927. [Google Scholar] [CrossRef]
  35. Wang, B.; Zhang, H.; Liang, X.; Li, X.; Wang, F. Cumulative Effects of Cascade Dams on River Water Cycle: Evidence from Hydrogen and Oxygen Isotopes. J. Hydrol. 2019, 568, 604–610. [Google Scholar] [CrossRef]
  36. Zhang, P.; Cai, Y.; Xie, Y.; Yi, Y.; Yang, W.; Li, Z. Effects of a Cascade Reservoir System on Runoff and Sediment Yields in a River Basin of Southwestern China. Ecol. Eng. 2022, 179, 106616. [Google Scholar] [CrossRef]
  37. Chu, P.; Liu, P.; Pan, H. Prospects of Hydropower Industry in the Yangtze River Basin: China’s Green Energy Choice. Renew. Energ. 2019, 131, 1168–1185. [Google Scholar] [CrossRef]
  38. Singh, V.P.; Wang, Y.; Xia, Z.; Wang, D. A Transitional Region Concept for Assessing the Effects of Reservoirs on River Habitats: A Case of Yangtze River, China. Ecohydrology 2012, 5, 28–35. [Google Scholar] [CrossRef]
  39. Zhang, J.; Li, S.; Dong, R.; Jiang, C.; Ni, M. Influences of Land Use Metrics at Multi-Spatial Scales on Seasonal Water Quality: A Case Study of River Systems in the Three Gorges Reservoir Area, China. J. Clean. Prod. 2019, 206, 76–85. [Google Scholar] [CrossRef]
  40. Xu, T.; Chang, F.; He, X.; Yang, Q.; Ma, W. Influence of Cascade Hydropower Development on Water Quality in the Middle Jinsha River on the Upper Reach of the Yangtze River. Water 2022, 14, 1943. [Google Scholar] [CrossRef]
  41. He, T.; Deng, Y.; Tuo, Y.; Yang, Y.; Naisheng, L. Impact of the Dam Construction on the Downstream Thermal Conditions of the Yangtze River. Int. J. Environ. Res. Public Health 2020, 17, 2973. [Google Scholar] [CrossRef] [PubMed]
  42. Tao, Y.; Wang, Y.; Bruce, R.; Wang, D.; Wang, D.Y.; Ni, L.; Wu, J. Quantifying the Impacts of the Three Gorges Reservoir on Water Temperature in the Middle Reach of the Yangtze River. J. Hydrol. 2020, 582, 124476. [Google Scholar] [CrossRef]
  43. Xu, P.; Li, F.; Wang, Y.; Qiu, J.; Singh, V.P.; Zhang, C. Quantitative Assessment of Climatic and Reservoir-Induced Effects on River Water Temperature Using Bayesian Network-Based Approach. Water 2022, 14, 1200. [Google Scholar] [CrossRef]
  44. Toffolon, M.; Piccolroaz, S. A Hybrid Model for River Water Temperature as a Function of Air Temperature and Discharge. Environ. Res. Lett. 2015, 10, 114011. [Google Scholar] [CrossRef]
  45. Sun, J.; Lin, J.; Zhang, X.; Xiao, Z.; Lin, B.; Xu, H. Dam-Influenced Seasonally Varying Water Temperature in the Three Gorges Reservoir. River Res. Appl. 2021, 37, 579–590. [Google Scholar] [CrossRef]
  46. Kaushal, S.S.; Likens, G.E.; Jaworski, N.A.; Pace, M.L.; Sides, A.M.; Seekell, D.; Belt, K.T.; Secor, D.H.; Wingate, R.L. Rising Stream and River Temperatures in the United States. Front. Ecol. Environ. 2010, 8, 461–466. [Google Scholar] [CrossRef]
  47. Niedrist, G.H. Substantial Warming of Central European Mountain Rivers under Climate Change. Reg. Environ. Chang. 2023, 23, 43. [Google Scholar] [CrossRef] [PubMed]
  48. Maheu, A.; St-Hilaire, A.; Caissie, D.; El-Jabi, N.; Bourque, G.; Boisclair, D. A Regional Analysis of the Impact of Dams on Water Temperature in Medium-Size Rivers in Eastern Canada. Can. J. Fish. Aquat. Sci. 2016, 73, 1885–1897. [Google Scholar] [CrossRef]
  49. Zaidel, P.A.; Roy, A.H.; Houle, K.M.; Lambert, B.; Letcher, B.H.; Nislow, K.H.; Smith, C. Impacts of Small Dams on Stream Temperature. Ecol. Indic. 2021, 120, 106878. [Google Scholar] [CrossRef]
  50. Cheng, G.; Liu, Y.; Chen, Y.; Gao, W. Spatiotemporal Variation and Hotspots of Climate Change in the Yangtze River Watershed during 1958–2017. J. Geogr. Sci. 2022, 32, 141–155. [Google Scholar] [CrossRef]
  51. Yang, R.; Xing, B. Spatio-Temporal Variability in Hydroclimate over the Upper Yangtze River Basin, China. Atmosphere 2022, 13, 317. [Google Scholar] [CrossRef]
  52. Song, C.; Zhou, X.; Tang, W. Evaluation Indicators for Assessing the Influence of Reservoirs on Downstream Water Temperature. Adv. Water Sci. 2012, 23, 419–426. (In Chinese) [Google Scholar] [CrossRef]
  53. Qiu, S.; Xu, Y.; Xu, Y.; Zhao, X.; Long, L.; Ji, D.; Yang, Z. Spatio-Temporal Variations Characteristics and Differences of Water Temperature in Upper and Middle Reaches of Lancang-Nujiang River. Resour. Environ. Yangtze Basin 2022, 31, 2186–2196. (In Chinese) [Google Scholar]
  54. Wang, Y.; Qiu, R.; Tao, Y.; Wu, J. Influence of the Impoundment of the Three Gorges Reservoir on Hydrothermal Conditions for Fish Habitat in the Yangtze River. Environ. Sci. Pollut. Res. 2023, 30, 10995–11011. [Google Scholar] [CrossRef]
  55. Cole, J.C.; Kelly, O.M.; Maloney, K.O.; Schmid, M.; McKenna, J.E. Developing and Testing Temperature Models for Regulated Systems: A Case Study on the Upper Delaware River. J. Hydrol. 2014, 519, 588–598. [Google Scholar] [CrossRef]
  56. Kędra, M.; Wiejaczka, Ł. Climatic and Dam-Induced Impacts on River Water Temperature: Assessment and Management Implications. Sci. Total Environ. 2017, 626, 1474–1483. [Google Scholar] [CrossRef]
  57. Ficklin, D.L.; Barnhart, B.L.; Knouft, J.H.; Knouft, J.; Stewart, I.T.; Maurer, E.P.; Letsinger, S.L.; Whittaker, G. Climate Change and Stream Temperature Projections in the Columbia River Basin: Habitat Implications of Spatial Variation in Hydrologic Drivers. Hydrol. Earth Syst. Sci. 2014, 18, 4897–4912. [Google Scholar] [CrossRef]
  58. Liu, D.; Xu, Y.; Guo, S.; Xiong, L.; Liu, P.; Zhao, Q. Stream Temperature Response to Climate Change and Water Diversion Activities. Stoch. Environ. Res. Risk Assess. 2018, 32, 1397–1413. [Google Scholar] [CrossRef]
  59. Xiong, Y.; Yin, J.; Paw, U.K.T.; Zhao, S.; Qiu, G.; Liu, Z. How the Three Gorges Dam Affects the Hydrological Cycle in the Mid-Lower Yangtze River: A Perspective Based on Decadal Water Temperature Changes. Environ. Res. Lett. 2020, 15, 014002. [Google Scholar] [CrossRef]
  60. Zhang, L.; Qian, Y. Annual Distribution Features of Precipitation in China and Their Interannual Variations. Acta Meteorol. Sin. 2003, 17, 146–163. [Google Scholar]
  61. Liu, X.; Li, J.; Su, Q.; Wang, C.; Li, X. Interannual Runoff Distribution Based on Degree and Time of Concentration for Rivers. Sci. Geogr. Sin. 2007, 27, 791–795. (In Chinese) [Google Scholar]
  62. Babaousmail, H.; Ayugi, B.O.; Onyutha, C.; Kebacho, L.L.; Ojara, M.; Ongoma, V. Analysis of Changes in Rainfall Concentration over East Africa. Atmosphere 2023, 14, 1679. [Google Scholar] [CrossRef]
  63. Hette-Tronquart, N.; Roussel, J.-M.; Dumont, B.; Archaimbault, V.; Pont, D.; Oberdorff, T.; Belliard, J. Variability of Water Temperature May Influence Food-Chain Length in Temperate Streams. Hydrobiologia 2013, 718, 159–172. [Google Scholar] [CrossRef]
  64. Pekarova, P.; Halmova, D.; Miklanek, P.; Onderka, M.; Pekar, J.; Skoda, P. Is the Water Temperature of the Danube River at Bratislava, Slovakia, Rising? J. Hydrometeorol. 2008, 9, 1115–1122. [Google Scholar] [CrossRef]
  65. van Vliet, M.T.H.; Ludwig, F.; Zwolsman, J.J.G.; Weedon, G.P.; Kabat, P. Global River Temperatures and Sensitivity to Atmospheric Warming and Changes in River Flow. Water Resour. Res. 2011, 47, W02544. [Google Scholar] [CrossRef]
  66. Lorenzo-González, M.A.; Quílez, D.; Isidoro, D. Factors Controlling the Changes in Surface Water Temperature in the Ebro River Basin. J. Hydrol. Reg. Stud. 2023, 47, 101379. [Google Scholar] [CrossRef]
  67. Wang, D.C.; Zhang, X.; Huang, Y.; Wang, X.; Zhang, W.; Cao, Z.J.; Xin, Y.; Qu, M. Comparative Study on Temperature Response of Hydropower Development in the Dry-Hot Valley. GeoHealth 2021, 5, e2021GH000438. [Google Scholar] [CrossRef]
  68. Wang, L.; Cao, H.; Li, Y.; Feng, B.; Qiu, H.; Zhang, H. Attribution Analysis of Runoff in the Upper Reaches of Jinsha River, China. Water 2022, 14, 2768. [Google Scholar] [CrossRef]
  69. Wang, Y.; Tao, Y.; Qiu, R.; Wang, D.; Wu, J. A Framework for Assessing River Thermal Regime Alteration: A Case Study of the Hanjiang River. J. Hydrol. 2022, 610, 127798. [Google Scholar] [CrossRef]
  70. Sun, R.; He, X.; Sun, L.; Sun, T.; Zhong, R.; Duan, X.; Chen, L. Impacts of Watershed Hydropower Development on Social-Ecological Systems in Hot-Dry Valleys. Acta Ecol. Sin. 2023, 43, 5639–5647. [Google Scholar]
  71. Xu, Y.; Guo, X.; Dan, Y.; Yang, Z.; Ma, J.; Liu, D.; Xu, Y. Impact of Cascade Reservoirs on Continuity of River Water Temperature: A Temperature Trend Hypothesis in River. Hydrol. Process. 2021, 35, 1–13. [Google Scholar] [CrossRef]
  72. Ji, D.; Long, L.; Xu, H.; Liu, D.; Song, L. Advances in Study on Cumulative Effects of Construction of Cascaded Reservoirs on Water Environment. Adv. Sci. Technol. Water Resour. 2017, 37, 7–14. (In Chinese) [Google Scholar] [CrossRef]
  73. Prats, J.; Val, R.; Armengol, J.; Dolz, J. Temporal Variability in the Thermal Regime of the Lower Ebro River (Spain) and Alteration Due to Anthropogenic Factors. J. Hydrol. 2010, 387, 105–118. [Google Scholar] [CrossRef]
  74. Long, L.; Xu, H.; Ji, D.; Cui, Y.; Liu, D.; Song, L. Characteristic of the Water Temperature Lag in Three Gorges Reservoir and Its Effect on the Water Temperature Structure of Tributaries. Environ. Earth Sci. 2016, 75, 1459. [Google Scholar] [CrossRef]
  75. Xiao, Z.; Sun, J.; Yuan, B.; Lin, B.; Zhang, X. Roles of Dam and Climate Change in Thermal Regime Alteration of a Large River. Environ. Res. Lett. 2022, 17, 094016. [Google Scholar] [CrossRef]
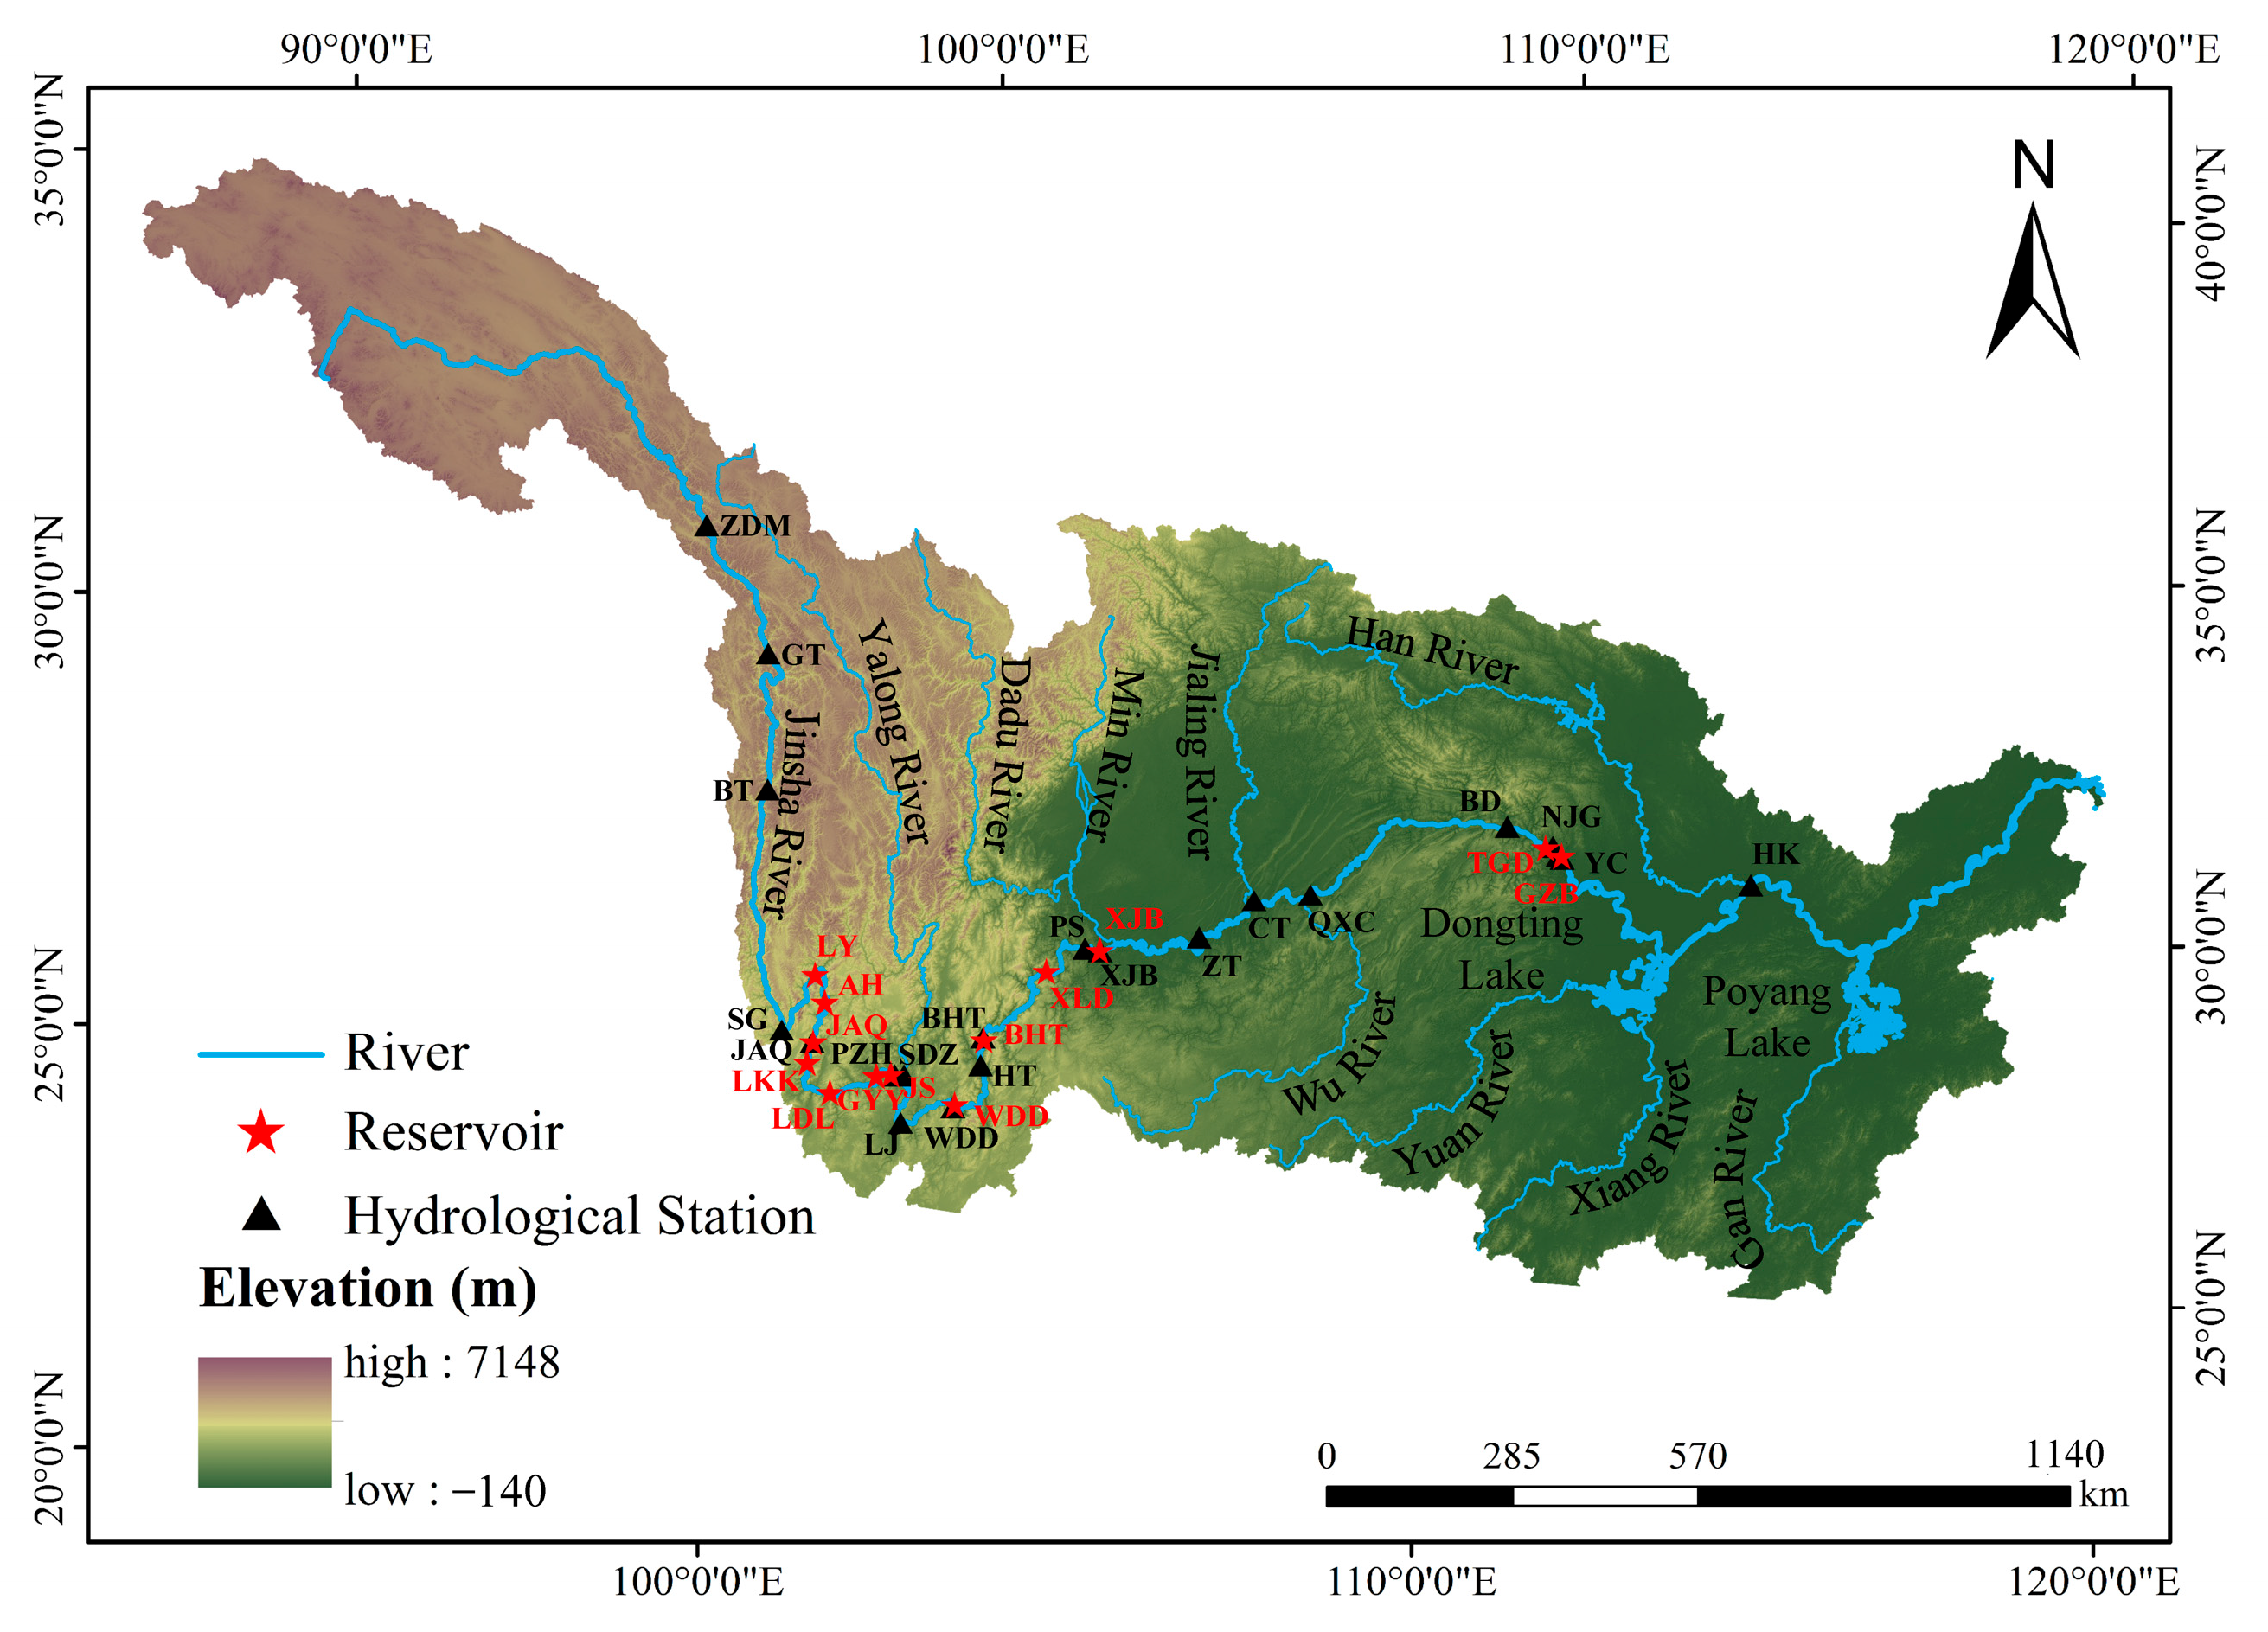
Figure 1. Map of the study area. The major dams and hydrological stations along the mainstream are shown. The abbreviated names of hydrological stations in the figure are ZDM—Zhidamen; GT—Gangtuo; BT—Batang; SG—Shigu; JAQ—Jinanqiao; PZH—Panzhihua; SDZ—Sanduizi; LJ—Longjie; WDD—Wudongde; HT—Huatan; BHT—Baihetan; PS—Pingshan; XJB—Xiangjiaba; ZT—Zhutuo; CT—Cuntan; QXC—Qingxichang; BD—Badong; NJG—Nanjinguan; YC—Yichang; and HK—Hankou.
Water 16 01669 g001
Figure 2. The spatiotemporal distribution of water temperature in the mainstream of the UMYR across various periods. Plots (ad) display the monthly average water temperature over three distinct periods at different hydrological stations, each located at varying distances from the ZDM hydrological station: (a) SG station, approximately 914 km away; (b) PZH station, about 1431 km away; (c) ZT station, around 2444 km distant; and (d) YC station, approximately 3252 km distant. Plot (e) represents the closed surface created by connecting the maximum and minimum water temperatures for each period at these hydrological stations. Plot (f) is a box-and-whisker plot showing water temperature variations in the three periods along the mainstream of the UMYR. The boxes depict the interquartile range (25th–75th percentiles), the black line within a box indicates the median, and the black square dots represent the mean values.
Water 16 01669 g002
Figure 3. Schematic map of the distorted sinusoidal varying temperature due to climate warming (a,b) or reservoir construction (c,d).
Water 16 01669 g003
Figure 4. The box and whisker plot of the temperature-increasing index along the mainstream of the UMYR (upper-axis scale labels indicate the starting and ending hydrographic stations for which the temperature-increasing indexes are calculated, the boxes show the interquartile range (25th–75th percentiles), and the black line through a box is the median, whereas black dots are mean values, and gray dots are outlier values).
Water 16 01669 g004
Figure 5. The heat map of the extreme fluctuation indexes of hydrological stations in the mainstream of the UMYR (plot (a) is the annual extreme fluctuation index, plot (b) is the cold season extreme fluctuation index, and plot (c) is the warm season extreme fluctuation index).
Water 16 01669 g005
Figure 6. The heat map of the baseline deviation indexes of hydrological stations in the mainstream of the UMYR (plot (a) is the annual baseline deviation index, plot (b) is the cold season baseline deviation index, and plot (c) is the warm season baseline deviation index).
Water 16 01669 g006
Figure 7. The seasonal phase offset time indexes of hydrological stations in the mainstream of the UMYR.
Water 16 01669 g007
Table 1. Comprehensive characteristics of reservoirs along the mainstream of the UMYR.
ReservoirsAbbreviationNormal Water Level
(m a.s.l.)
Dead Water Level
(m a.s.l.)
Total Storage Capacity (108 m3)Regulating Storage Capacity (108 m3)Regulation PerformanceOperation Year
LiyuanLY161816058.051.73week2014
AhaiAH150414928.822.38day2011
JinanqiaoJAQ141813988.473.46week2010
LongkaikouLKK129812905.581.13day2012
LudilaLDL1223121617.183.76day2013
GuanyinyanGYY1134112220.725.5week2014
JinshaJS102210201.080.112day2020
WudongdeWDD97594574.0824.4year2020
BaihetanBHT825765206.27104.35year2021
XiluoduXLD600540126.764.6season2013
XiangjiabaXJB38037051.639season2012
Three Gorges DamTGD175155393221year2003
GezhoubaGZB66637.110.86——1981
Table 2. Three dam construction periods in the mainstream of the UMYR.
PeriodYearHydrological ConditionDams
1st2009dryJAQ, TGD, GZB
2010wet
2nd2013dryLY, AH, JAQ, LKK, LDL, GYY, XLD, XJB, TGD, GZB
2014normal
2015wet
3rd2018dryLY, AH, JAQ, LKK, LDL, GYY, JS, WDD, XLD, XJB, TGD, GZB
2019normal
2020wet
Table 3. Pearson correlation analysis of water temperature with air temperature and discharge (all the stations pass the correlation test of p < 0.01).
Water Temperature and Air Temperature
PeriodZDMBTSGPZHSDZLJ
1st0.8760.9460.8950.8500.9100.892
2nd0.8730.9310.8900.8270.8160.848
3rd0.8830.9410.9120.7230.6770.791
PeriodZTCTBDNJGYCHK
1st0.9390.9300.8090.7600.7840.915
2nd0.9230.9210.7790.7450.7750.919
3rd0.9280.9230.8230.7810.7820.941
Water Temperature and Discharge
PeriodZDMBTSGPZHSDZLJ
1st0.7000.7600.7360.6270.598——
2nd0.5440.6590.6390.6540.594——
3rd0.6950.7420.7130.7860.707——
PeriodZTCTBDNJGYCHK
1st0.7000.702————0.7560.808
2nd0.7070.713————0.7350.828
3rd0.7200.684————0.7200.739
Table 4. The phase offset time indexes of hydrological stations in the mainstream of the UMYR.
I P O (days)ZDMGTBTSGPZHSDZLJ
I P O 1 −0.3−1.0−0.3−1.819.715.614.2
I P O 2 1.0−3.32.71.028.124.623.4
I P O (days)HTZTCTBDNJGYCHK
I P O 1 11.49.64.81.9−0.3−1.9−1.5
I P O 2 ——9.73.4−1.7−4.3−2.6−4.4
Disclaimer/Publisher’s Note: The statements, opinions and data contained in all publications are solely those of the individual author(s) and contributor(s) and not of MDPI and/or the editor(s). MDPI and/or the editor(s) disclaim responsibility for any injury to people or property resulting from any ideas, methods, instructions or products referred to in the content.