Abstract
This paper assessed and evaluated the river and groundwater quality of five major catchments in the Mzimvubu to Tsitsikamma Water Management Area (WMA7). The river assessment and evaluation considered the present state maximum, minimum and mean seasonal values of physiochemical parameters (EC, NO3 + NO2, Cl, pH, NH4-N, PO4-P and Mg). The study was able to successfully make use of statistical analysis and a water quality index in order to explain seven-year trends and the present state of all five catchments within the study area. The statistical analysis results showed that water quality parameters such as PO4, NH4 and NO3 + NO2 were not complying with the South African Water Quality Guidelines (SAWQG) limits, suggesting that the study area was impacted by anthropogenic activities such as agriculture, sewage works, etc. The application of WQI showed that the Gamtoos catchment was in a good water quality state (49.71) while the other four catchments were in a poor to very poor state, according to the WQI classification. Based on the groundwater quality assessment, the physicochemical parameters (NH4, EC, Ca, NO3 + NO2, pH, Na, Cl, Mg, F, K, SO4 and CaCO3) were selected and the main parameters of concern were EC (salinity), NO3 + NO2 and SO4. However, groundwater assessment revealed that groundwater quality was chemically suitable for drinking purposes in most parts of the study area. Therefore, the study recommended resource-directed measures to improve surface and groundwater resource protection, especially in areas where surface and groundwater quality for other uses remains a challenge. Further, strong water resource compliance monitoring and enforcement to control water resource pollution sources is critical.
1. Introduction
Water is life to human societies, and critically important to food production, economic development and ecosystem functioning [1,2,3]. Halder and Islam [1] reported that cities in the world are facing water shortages and more than 40% of the food supply grown under irrigation is water-dependent. Water plays a significant role in sustainable development and poverty reduction [4]. Globally, water resource exploitation has increased and threatened prospects for socio-economic development, political stability and ecosystem integrity [5]. Given the need for sustainable water management worldwide, practical and reliable water quality assessment for sustainable water resource use is important [6,7].
Water quality issues have become a global challenge in both developed and developing nations, undermining the potential for economic growth and the physical and environmental health of billions of people [3,8]. For many years, the world’s primary focus has been on water quantity, water use efficiency and allocation challenges; progressive water quality deterioration has created an unprecedented water crisis [1,8] Water quality is affected by both anthropogenic and natural sources, through point and non-point sources [9,10]. Studies by De Necker et al. [9], Mishra et al. [2], Rahman et al. [11] and Yotova et al. [10] reported that poor water quality conditions, due to natural and anthropogenic sources can be exacerbated by climatic conditions such as atmospheric precipitation and drought, which reduce flow, adding stress on water resources already affected by anthropogenic activities. Further, Mishra et al. [2] reported that the constraints on the quality of water and availability/quantity have the potential to threaten secured access to water resources by different water users. Moreover, approximately 1.2 billion people have reported that they live in areas where there is limited water supply to meet their water demand. The study [2] revealed that global groundwater use has increased by 50% due to its good quality and ease of access. Further, contamination of groundwater and surface water becomes a great threat to freshwater availability. Mishra et al. [2] noted that for developing nations to minimise the water crisis associated with poor water quality and quantity, understanding of poor water quality and quantity sources, trends and better management options is important.
In South Africa, Griffin et al. [12] reported that the country is faced with a number of water quality challenges such as eutrophication, acid mine drainage (AMD) and anthropogenic salinisation. Eutrophication is a consequence of nutrient enrichment that leads to changes in ecology, such as algal bloom [12,13]. Further, eutrophication has the potential to impact ecological systems, human health, agriculture and recreation. In South Africa, AMD is caused by coal and gold mining activities and is a major environmental problem because of its ability to persist after mines have closed [12]. The study revealed that AMD led to water quality issues in the rivers of Mpumalanga and Gauteng Provinces.
A recent study [14] reported that water quality in the Mzimvubu to Tsitsikamma Water Management Area (WMA7) is deteriorating daily due to water use taking place in some catchments. The report also found that some catchments of the study area have problems with siltation (turbidity), nutrients and ammonium. Agricultural use of chemical fertilizers and pesticides and the rapid growth of industrialisation in the country caused heavy and varied pollution in water resources leading to deterioration of water quality and depletion of aquatic biota [14]. The eastern part of the study area saw increased groundwater pollution and over-abstraction, which presented a serious water problem [15]. The study by Cobbing [16] revealed that groundwater levels and spring flow had dropped significantly as a result of overuse for irrigation in major Karst aquifers. It further revealed that high nitrate levels were observed in groundwater in several parts of the study area and could be due to anthropogenic activities such as agricultural waste, and industrial and domestic effluents. Ji et al. [7] reported that to effectively address water quality concerns, it is important to provide a critical assessment to evaluate water quality conditions and pollution sources. Therefore, in the absence of resource-directed measures (RDM), such as water resource classification and resource quality objectives (RQOs), it is necessary to conduct an evaluation and assessment of water resources, both surface and groundwater, to provide practical and accurate characterisation of the water quality status in the study area. In view of the above considerations, the central aim of this investigation was to assess and evaluate water quality changes over a seven-year period, for both surface and groundwater, in the Mzimvubu to Tsitsikamma Water Management Area (WMA7). The specific objectives were (1) to determine spatial and temporal variations of physicochemical properties of the WMA7 over a seven-year period, achieved by sourcing historical data from the Department of Water and Sanitation Water Management System (WMS), Hydstra and other research papers. The Hydstra monitoring sites provided a time series of water level data to the current study, whilst WMS monitoring sites provided a time series of water quality data. (2) To evaluate surface and groundwater overall water quality status of all five drainage regions. The evaluation process was realised through a water quality index, which presented levels of water quality in an understandable and useable format to the public. It was expected that the study outcomes could provide water quality status for all catchments within the WMA7, to guide water resource management and pollution control measures in the area.
2. Materials and Methods
2.1. Description of the Study Area and Selection of Sampling Sites
The WMA7 is situated mainly in the province of the Eastern Cape and some parts of the study area fall into the KwaZulu Natal, Western Cape Province and Northern Cape Province [14]. Further, the WMA7 is comprised of several catchments: Mzimvubu, Sundays, Great Kei, Keiskamma, Great Fish, Tsitsikamma, Swartkops, Bushmans, Algoa and Gamtoos. However, for the purpose of the current study, the following major drainage regions were considered: the Sundays, Great Fish, Great Kei, Gamtoos and Mbashe; the smaller drainage regions were not considered due to lack of data. The study area consists of over 300 quaternary catchments, covering a total catchment area of more than 124,730 km2 [14]. The study area’s topography is hilly to mountainous with plains and hills of the Groot Karoo, with the Drakensberg Mountains along the northeastern boundary of the study area. Further, the rivers are deeply incised in the coastal strip [14]. Figure 1 shows a locality map of the study area.
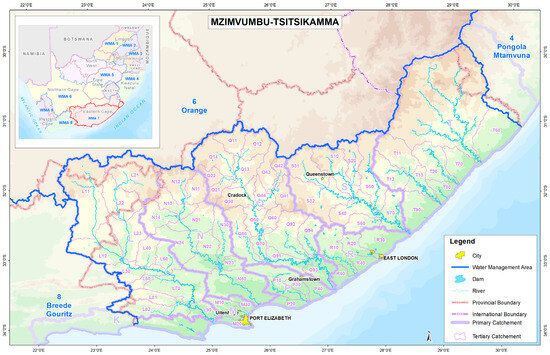
Figure 1.
The locality map of the Mzimvubu to Tsitsikamma WMA.
The climate of the Mzimvubu to Tsitsikamma WMA is variable due to topography of the area and proximity to the sea. The inland part of the study area experiences hotter climate conditions while the coastal parts enjoy both subtropical and Mediterranean climate conditions [15]. The study area experiences maximum temperatures (38 °C) in January (summer months) and minimum temperatures (−2 °C) usually occur in July (winter months) [17]. In some parts of the study area, summer temperatures regularly exceed 40 °C, while some parts experience occasional snowfalls in winter months, e.g., Amathole mountain range and Keiskamma to the Hogsback area [17]. The study area has a varied rainfall pattern throughout the year due to topographic zonation [17]. In the northern, northeastern, northwestern and central parts of the study area, rainfall generally occurs late in summer months with peak rainfall in December and January.
2.1.1. Regional Geology
The Department of Water and Sanitation [14] reported that the study area’s basement rocks consist mainly of quartzite, limestone and phyllite, which are unconformably overlain by the Cape Supergroup, the Table Mountain, Bokkeveld and Witteberg Groups of alternating quartzitic sandstone and shale. The Cape Supergroup is overlain by the Ecca, Beaufort, Stormberg and Drakensberg Groups. Further, the Uitenhage Group unconformably overlies older deposits of the Cape Supergroup in small rift basins, i.e., Algoa and Gamtoos Basins; and comprises poorly sorted conglomerate and subordinate sandstone, siltstone and mudstone. These rift basins formed mainly due to normal faulting during the break-up of Gondwana. Unconsolidated to semi-consolidated, palaeo-coastal calcareous sand and conglomerate deposits of the Algoa Group occur within the eastern portion of the Algoa Basin and the Bushman’s coastal plain. Table 1 shows the regional geological succession of the study area.

Table 1.
The regional geological succession of the Mzimvubu to Tsitsikamma WMA7.
2.1.2. Geohydrology
The Cape and Karoo Supergroups are the major aquifer systems in the study area. The Karoo Supergroup constitutes intergranular and fractured aquifer over large parts of the study area, associated with extrusive and intrusive igneous rocks [14]. The aquifer systems are mainly of a fractured type, where groundwater occurrence is a result of secondary deformation relating to faults, fissures, fractures, bedding planes and joints [14]. The study by Murray et al. [18] revealed that favourable geological conditions and drilling targets of the Karoo sediments are dolerite ring structures, thick alluvial deposits, dolerite dykes, dolerite sill margins (inclined sheets) and folded and faulted formations.
2.1.3. Land Uses
DWS [15] reported that irrigated lands within the study area occupy about 948 km2 in the Great Fish and Sunday Rivers using water from the Orange River, with the main crops such as vegetables, citrus and lucerne. Pineapple and chicory are found in the Albany Coast area. Further, the study by DWS [15] reported that afforestation occupies land of about 417 km2 in the Tsitsikamma area. There are few mining activities in the study area, consisting of a limestone quarry near Hankey, Steytlerville, Makhanda and Uitenhage. These mining operations have been reported to have caused concerns (to downstream water users) and negative impact on the ecology of the river. There are no major power stations in the study area, and major industries are situated in cities such as East London and Gqeberha [15].
2.1.4. Water Resources Infrastructure
In terms of water quantity, DWS [15] reported the largest transfer of water from the Gariep Dam (Upper Orange) into the study area (to the upper reaches of the Great Fish River). Large volume of water is used for irrigation within the Great Fish and Lower Little Fish Rivers catchments, with some domestic water used by the towns in the area. In the water transfer scheme into the Algoa System, the water is used for domestic purposes by urban and rural communities [15]. These water transfer schemes are essential for socio-economic development of communities in the Amathole and Algoa water systems. However, these transfers have effects on the water resource health [15].
2.2. Major Catchments and Associated Monitoring Points
The main catchments and associated rivers of the study area are shown in Table 2 for further detail.

Table 2.
Major catchments and associated rivers in the WMA7.
The study area has 2909 active surface water quality monitoring points (Figure 2). However, for the purpose of the current study, 37 monitoring sites were selected across all five catchments within WMA7. The selection of the sites was based on data availability, water use types and position of the monitoring site, whether the site is on the mainstem or not. These surface sampling sites were sourced from Water Monitoring System (WMS). Table 3 presents water quality monitoring sites, global positioning system (GPS) coordinates (latitude and longitude) and drainage region name of the study area.
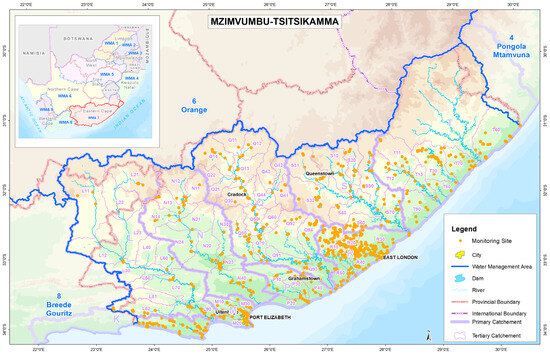
Figure 2.
The locality map of the Mzimvubu to Tsitsikamma WMA and associated water quality monitoring points.

Table 3.
Surface water monitoring points in the Mzimvubu to Tsitsikamma WMA.
As for groundwater, 877 water quality monitoring sites were identified and sourced from the WMS and Hydstra (Figure 3). Hydstra is a commercial hydrological information system for the storage, editing, retrieval, manipulation, and analysis of surface water, water quality, and groundwater time series data and related hydrological information in support of water resources management [19]. It is important to note that not all monitoring sites have long-term data as some sites have been discontinued but have historical data. A total of 248 sites were deemed active sites, and for the purpose of the current study, 30 monitoring sites were identified with long-term data availability. These monitoring sites provide time series data on water levels and water quality of the study area [20]. The groundwater monitoring sites for the Mzimvubu to Tsitsikamma WMA are presented in Table 4.
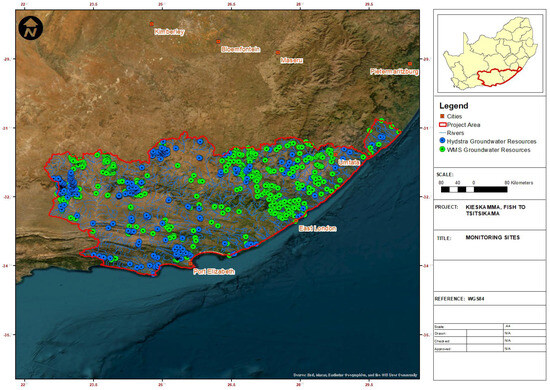
Figure 3.
Map showing groundwater monitoring sites in the study area [20].

Table 4.
Groundwater monitoring sites in the Mzimvubu to Tsitsikamma WMA.
2.3. Selection of Parameters and Data Collection
Quantitative methodology was used for the study. The study used both primary and secondary water quality data sourced from field assessment and national databases such as the WMS and Hydstra. Historical data from January 2015 to December 2022 were collected following standard surface water quality sampling procedure as indicated in the DWS water quality sampling manual for the aquatic environment [21]. Field investigations were conducted between February 2021 and November 2023 to cover both wet and dry seasons. Briefly, surface water samples were collected using pre-rinsed 500 mL bottles of polyethylene without the addition of any preservatives. Water samples were taken by holding bottle with hand near base and plunging the sample bottle, neck downward, below the water surface. Sample bottles were turned slightly upward, and mouth was directed toward the water current. The bottles were filled to the top with as little air as possible and sealed tightly [13]. Further, every sample bottle contained particulars such as the name of the person who collected sample, date and time of collection, and description of place where samples were taken. The samples were immediately preserved with mercuric chloride (HgCl2) to prevent uptake of any of the components (especially nutrients) by biological processes.
In terms of groundwater samples, collection technique used by Nzama et al. [19] was followed. Briefly, groundwater quality samples were collected from groundwater sites (boreholes) using a bailer after boreholes had been purged [19]. Multi-parameter probes were calibrated before taking field measurements such as temperature, pH and electrical conductivity. Other physiochemical samples were collected using sterile 250 mL polyethylene sampling bottles. Mercury chloride was added to each sampling bottle to preserve samples from contamination [19]. Further, samples were placed in cooler boxes filled with ice packs to maintain low temperatures, and sampling bailers were rinsed with de-ionised water. Both surface and groundwater samples were transported to the Resource Quality Information Services (RQIS) laboratory of the DWS, where they were stored under darkness at 4 °C until analysis [13].
Further, in Resource Quality Information Service (RQIS) section standard laboratory methods/techniques (such as Flammable Atomic Absorption Spectrophotometry (FAAS) and Inductively Coupled Plasma Optical Emission Spectrometry (ICP-OES)) were applied for chemical analyses. After all laboratory analyses were completed, the results were captured in the WMS national database [13]. The in-situ water quality variables such as pH, electrical conductivity, salinity, clarity, total dissolved solids, temperature and dissolved oxygen were measured in the study area. Mnyango et al. [13] reported that there is no specific rule for selecting water quality parameters to determine the condition of water resources. Moreover, it has been suggested that minimising parameter inputs can significantly save time, effort, and cost of evaluating impacts on the water resources, which translates into feasibly and economically viable process [13]. However, parameter selection for the current study was based on availability of data, water user types in the study area and environmental importance of a parameter. Table 5 shows the suite of physio-chemical parameters that have been identified for the purpose of this study.

Table 5.
Selected water quality parameters and the reasons for their selection.
Water quality variables such as heavy metals and organic compounds are expensive to analyse and are seldom measured, hence there was insufficient data to report on [20]. Further, heavy metals and most organic contaminants are associated with industrial and mining activities, neither of which is associated with the study area. However, pesticides used in agriculture could affect water quality, but such data are extremely scarce [20]. Due to inconsistent and irregular monitoring across catchments, microbiological parameters such as E. coli/faecal coliforms were not considered.
2.4. Data Analysis
2.4.1. Descriptive Statistical Analysis
Surface and groundwater water quality raw data were populated and analysed in a Microsoft Excel2016 spreadsheet using descriptive and time series statistical analysis. Data collected in different seasons (wet and dry) were compared to determine spatial and temporal variations of physicochemical properties of the WMA7 over a seven-year period. Due to climatic conditions in the study area, wet season is represented by February month while dry season is represented by June month during data analysis. The South African Water Quality Guidelines (SAWQG) and South African National Standard (SANS) 241 [22] were used as a benchmark. A descriptive statistical analysis provides summary information that quantitatively summarises variables from a dataset, while time series statistical analysis provides time series data and trend analysis [13].
This provided underlying causes of systematic patterns over time. Analysis output was in a table and graphic presentations to show temporal and spatial distribution of the selected parameters. Further, the process considered the maximum, minimum and the mean seasonal values of physiochemical parameters (EC, NO3 + NO2, Cl, pH, NH4-N, PO4-P and Mg). This was due to water quality sampling being irregular. Moreover, the current study adopted the class description of the water quality status and arithmetic expression as reported by Mnyango et al. [13].
2.4.2. Water Quality Index
Dunca [6] defined water quality index (WQI) as a tool that provides numeric expression that is used to evaluate the quality of water of a particular water resource. The advantage of WQI is that it is easily understood by water resource managers and the public [23]. Further, WQI is well received by many countries in the world because of its capabilities to evaluate overall water quality status by combining complex and technical water quality information into a single meaningful numerical value [23,24]. The application of WQI is a useful tool in assessing and evaluating the water’s suitability for various beneficial uses. Moreover, the tool is capable of allowing comparison of spatial and temporal water quality status between catchments [6,24]. The current study assessed overall water quality status of all five drainage basins, using WQI calculations over a seven-year period (2015–2022) in the study area.
Traditionally, the WQI tool follows four common steps, which are (1) parameter selection of interest in the study area, (2) sub-indices generation for each parameter, (3) assigning parameter weight value, depending on the parameter significance in the assessment, (4) aggregating final water quality index. To achieve evaluation of overall water quality status in the current study, the five-step process was followed to determine the WQI of the catchments in the study area. The first step was to allocate a weight (wi) to each selected water quality parameter. The weight ranged from 1 to 5, with 1 representing the least important and 5 representing the most important. A weight allocation was on parameter’s relative importance for aquatic ecosystems, recreation, domestic, industrial and agriculture as per the SAWQGs. The second step involves calculation of a weight for each selected water quality parameter, through the equation:
where (wi) represents weight while n represents total number of rated parameters [13]. The third step was to calculate and assign quality rating scale (qi) for each parameter by dividing the value of each parameter (Ci) by its respective water quality standard (Si). The results were presented in percentages using equation [13]:
The fourth step involved sub-index calculation (Sb) for each water quality parameter. The Sb is calculated using equation:
Sb = wi × qi
The last step (the 5th) involved determination of WQI for the study area using the equation:
The sub-indices were summed to give overall water quality of the study area. The allocation of final WQI values to classes or categories is known as classification or categorisation [23]. Further, this can be achieved by any of two sets of classification scales, i.e., increasing scale and decreasing scale. In both instances, these scales aim to express the water quality status of water resources by determining the degree of contamination [22]. In general, the WQI index values range between 0 and 100.
The WQI scores of less than 40 represented “no concern” regularly meeting standards set in the SAWQG and SANS 241 [22]. The WQI scores of between 40 and 80 indicated “marginal concern” and WQI scores of above 80 did not meet standards set out in guidelines and indicated “highest concern” [6]. Further, the WQI values were grouped into classes ranging from 1 to 5, subject to which scale the author employed, increasing or decreasing scale. Table 6 showcased the classification of water quality status using increasing scale [23].

Table 6.
Classification of water quality status [13].
3. Results and Discussion
3.1. Surface Water Quality Results
The available physiochemical parameters such as EC, NO3 + NO2, Cl, pH, NH4-N, PO4-P and Mg were presented in Table 7, Table 8, Table 9, Table 10 and Table 11. Further, the process considered the present state maximum, minimum and mean seasonal values of physiochemical parameters.

Table 7.
Summary statistics of the physicochemical parameters determined from the Gamtoos catchment.

Table 8.
Summary statistics of the physicochemical parameters determined from the Great Kei catchment.

Table 9.
Summary statistics of the physicochemical parameters determined from the Sundays catchment.

Table 10.
Summary statistics of the physicochemical parameters determined from the Mbashe catchment.

Table 11.
Summary statistics of the physicochemical parameters determined from the Great Fish catchment.
3.1.1. Gamtoos Catchment
The Gamtoos catchment water quality results showed that EC values ranged from 4.7 mS/m to 372 mS/m with a mean value of 122 mS/m (Table 6). The South African water quality range for EC in water for aquatic ecosystems use is 170 mS/m [25]. The European Union (EU) and World Health Organisation (WHO) also set protection limits of 250 mS/m for fisheries and aquatic life [26,27]. Therefore, the parameter does not pose serious risk but would make the water unsuitable for direct domestic use. EC is an indicator of salinity [28], it fluctuated significantly over the years in the study area. pH values ranged from a minimum of 4.5 to a maximum of 8.2 with a mean value of 7.1. According to Makanda et al. [28] pH is one of the water quality parameters used to determine the alkalinity (pH > 7), acidity (pH < 7) and neutrality (pH = 7) of water. Therefore, the results of the study showed neutral conditions in the Gamtoos catchment. This could be due to the reason that the catchment is characterised by protected areas such as Baviaanskloof Nature Reserve and Tsitsikamma National Park. Based on these guidelines, the pH value of the catchment would not adversely affect its use for recreational, aquatic ecosystems and domestic purposes. The CI values varied between 12 mg/L and 460 mg/L with a mean value of 327 mg/L which was beyond the target water quality range of 300 mg/L for domestic water supply [29]. The PO4 values ranged from 0.05 mg/L to 7.8 mg/L with a mean value of 0.8 mg/L, which was over the target water quality range of 0.025 mg/L. The malfunction of Hankey sewage works could be the source of the rise in PO4 in the study area. The maximum value of Mg was 135 mg/L which was over the target water quality range of 100 mg/L, while the mean value was within the target range. The NO3 + NO2 values ranged between a minimum value of 0.005 mg/L and a maximum value of 10.1 mg/L with a mean value of 0.7 mg/L. The presence of high nutrient values in the water resources could lead to the growth of unwanted plants such as blue-green algae. The blue-green algae could release toxic substances such as cyanotoxins into the water systems [30]. According to Fatoki et al. [30], cyanotoxins were reported to have caused the death of farm livestock.
3.1.2. Great Kei Catchment
Water quality assessment in the Great Kei catchment showed nutrient enrichment. The NO3 + NO2 values ranged from 0.005 mg/L to 4.7 mg/L with a mean value of 1.6 mg/L (Table 7). The maximum value of PO4 was 3.4 mg/L and the mean value of 0.8 mg/L. The mean values of these two nutrients exceeded their respective target water quality range. The presence of nutrients in the water systems could pose a problem for aquatic life, and recreational and domestic uses because of eutrophication. The South African Guideline for NO3 + NO2 in aquatic ecosystems is 1 mg/L, while aquatic ecosystems’ target range for PO4 is 0.025 mg/L. The values of EC and CI were recorded at maximum values of 256 mg/L and 390 mg/L, respectively. There was a steep rise of NH4-N, with a maximum value of 13.4 mg/L and a mean value of 2.8 mg/L. The high presence of NH4 and NO3 + NO2 could be an indication of agricultural contaminants in the study area. The WHO safe limit for NO3 for a lifetime is 10 mg/L as N [27]. The results of these parameters concurred with earlier findings by DWS [14] which identified NO3, NH4 and turbidity from agricultural activities as the main sources of pollution in the study area. pH of the catchment showed neutrality with 7.8, while Mg recorded a maximum value of 132 mg/L, which was beyond the target water quality range.
3.1.3. Sundays Catchment
Water quality results in Table 8 showed that EC was higher than the required target water quality range, as it ranged from 27.4 mg/L to 640 mg/L with a mean value of 239 mg/L. The Sundays catchment recorded a great spike of CI with a maximum value of 1649 mg/L and a mean value of 510 mg/L. Sources of the high value of Cl in the Sundays catchment could be from weathering of soils, intrusion of salty water from the ocean and contributions from wastewater. The PO4 value ranged from 0.05 mg/L to 3.5 mg/L with a mean of 0.2 mg/L. The NO3 + NO2 values ranged between 0.05 mg/L and 17.54 mg/L with a mean value of 1.1 mg/L. DWS [15] reported that the lower Sundays River was characterised by irrigation to the upper Sundays in the Darlington Dam [15]. In addition, the drainage region was also dominated by livestock grazing and limited forestry activities. The study area showed alkalinity conditions with a mean pH value of 8.5. The EU sets pH protection limits of 6 to 9 for fisheries and aquatic life [30].
3.1.4. Mbashe Catchment
Water quality results in the Mbashe catchment showed that EC and CI values were compliant with their respective target water quality ranges. The PO4 results ranged from 0.01 mg/L to 16.2 mg/L with a mean value of 0.79 mg/L, while the value of NO3 + NO2 ranged from 0.1 mg/L to 5.7 mg/L with a mean value of 1.6 mg/L. pH showed alkalinity conditions (7.8) in the study area. Therefore, there were neither major industries nor mining activities in the area that could cause extreme changes in the pH of the effluents and of the receiving river, therefore the results obtained for pH in this study were as expected. The catchment was characterised by subsistence and commercial farming.
3.1.5. Great Fish Catchment
Water quality results in the Great Fish catchment (Table 10) recorded maximum values of EC (446 mg/L) and CI (303 mg/L). Water quality data showed PO4 ranged from 0.05 mg/L to 4.2 mg/L with a mean value of 0.9 mg/L, while NO3 + NO2 values ranged from 0.03 mg/L to 29.3 mg/L with a mean value of 2.3 mg/L. DWS [15] reported that agriculture was of major importance to the catchment with citrus and vegetable crops being grown. There was a steep rise of NH4 with a maximum value of 57 mg/L and a mean value of 4.1 mg/L. The steep rise in NH4 values was attributed to problems associated with the Peddie sewage works and Seymous wastewater treatment works west of the residential area along the R67 to Whittlesea. These values were grossly exceeded in the water resource, and this disqualifies the water for direct domestic use.
3.2. Trends Analysis for Surface Water for All Five Catchments
Figure 4, Figure 5, Figure 6, Figure 7 and Figure 8 show the findings of the historical trend analysis of the physicochemical parameters for the WMA7. The trend analysis was presented per drainage region.
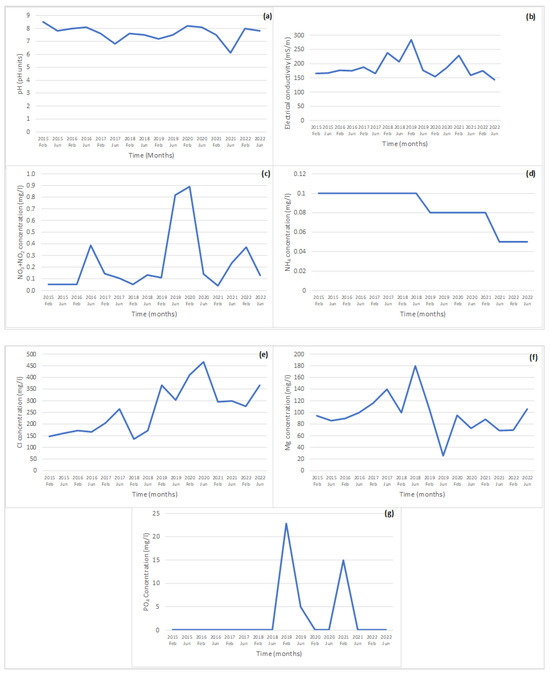
Figure 4.
Trends analysis of pH (a), EC (b), NO3 + NO2 (c), NH4 (d), CI (e), Mg (f) and PO4 (g) in the Gamtoos catchment.
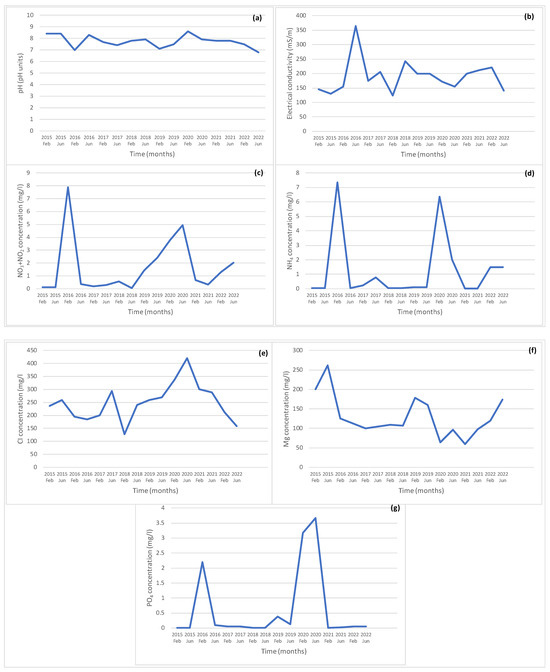
Figure 5.
Trends analysis of pH (a), EC (b), NO3 + NO2 (c), NH4 (d), CI (e), Mg (f) and PO4 (g) in the Great Kei catchment.
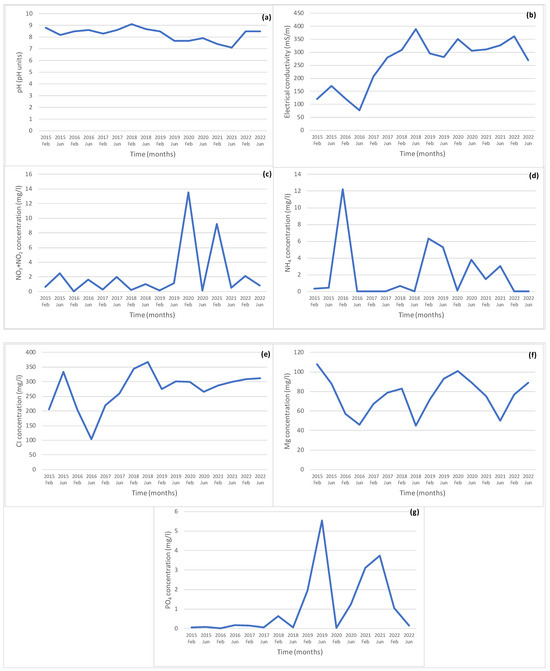
Figure 6.
Trends analysis of pH (a), EC (b), NO3 + NO2 (c), NH4 (d), CI (e), Mg (f) and PO4 (g) in the Sundays catchment.
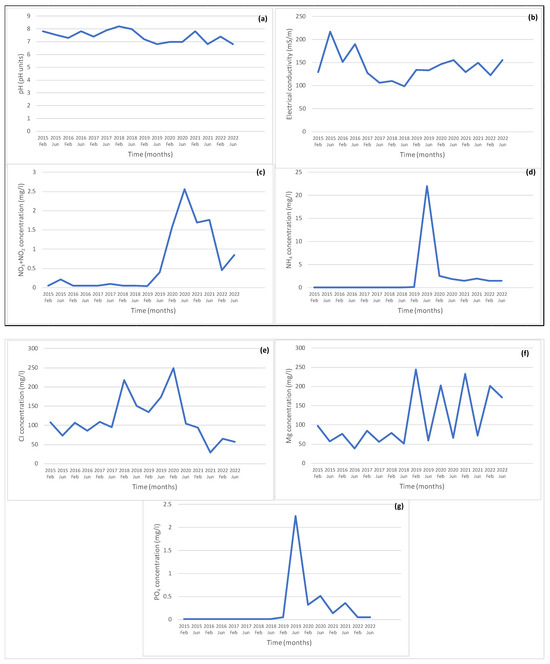
Figure 7.
Trends analysis of pH (a), EC (b), NO3 + NO2 (c), NH4 (d), CI (e), Mg (f) and PO4 (g) in the Mbashe catchment.
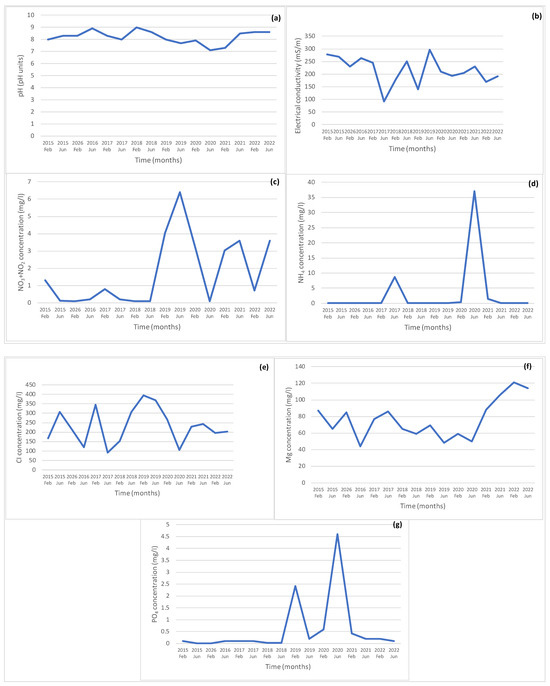
Figure 8.
Trends analysis of pH (a), EC (b), NO3 + NO2 (c), NH4 (d), CI (e), Mg (f) and PO4 (g) in the Great Fish catchment.
A trend analysis of water quality parameters from 2015 to 2022 in all five catchments was explored. The analysis was based on the two seasons (wet and dry). The study results showed that the pH condition was constant across all catchments. The results of the trend analysis for Mg, CI and EC showed seasonal variations across all five catchments. EC fluctuation indicated problems with water quality in the study area. The high value of CI concurred with previous studies that water quality impacts of the geological drivers have been observed, with high conductivity and salts in many catchments within the WMA7.
Figure 4 showed that the EC, Mg and CI readings were slightly above the allowable threshold whilst pH, NO3 + NO2 and NH3 were fair. Water quality measurements of PO4 reached harmful levels, indicating a serious deterioration in water resource quality. The deterioration of water quality could be attributed to prevalent agricultural activities in the Gamtoos catchment. Pesticides from agricultural activities could eventually drain into the system, explaining the poor quality of water in the catchment.
Water quality results in the Great Kei catchment showed that the EC and NO3 + NO2 readings were unstable and beyond standard limits in many sections of the catchment. Main activities such as irrigation, afforestation, sand mining and human settlements could be the main sources of poor water quality. The Kubusi River (which feeds into the Great Kei) passes near the town of Stutterheim. Spikes of PO4 and NH3 during the wet seasons of 2020 and 2021 could be due to flooding events that occurred in the area. DWS (15) reported that sand mining activities modified the landscape in the Queenstown and Stutterheim towns, due to vegetation removal, which led to exposed banks/bank erosion including eroded gullies.
In Figure 6, water quality results showed that NO3 + NO2, EC and NH3 were not compliant with the standard limits, especially during the wet season. The Sundays catchment is heavily surrounded by agricultural activities, and poor quality of water could be the result of effluent runoff from pesticides and/or other agricultural products. Downstream of the Coega River, there is a dense concentration of urban settlements and industrial areas that stretch from the town of Uitenhage to the City of Gqeberha. The study by DWS [31] revealed that the river quality became significantly poorer as rivers (Riet, Voel and Coega) approached the urban and industrial areas. More likely due to waste generated by industrial processes, urbanisation and the Addo wastewater treatment works return flows discharging into the rivers. The water quality parameters were indicative of chemical imbalances and poor quality of water within the parts of the Sundays catchment. The limestone quarry in the Uitenhage was reported to have caused large-scale sediment deposition within portions of the Chatty wetland originating from the land clearing and development within the systems’ catchment areas [31].
The Mbashe water quality is acceptable as shown in Figure 7, though NH3, NO3 + NO2 and PO4 readings showed spikes between 2019 and 2022. This could also be attributed to the heavy rains experienced in the study area. DWS (14) reported that the catchment is characterised by afforestation, limestone quarry activities and agricultural practices, but these practices appeared to be small and sparsely located. Further, a large number of small rural settlements are located alongside many of the rivers (Xora, Nqabara, Mngazi, Mtetu, Msikaba, Mtakatye and Qhorha) within the catchment, and rely on the water provided by these rivers. The study by Kafu and Mlaba [32] reported that quarrying activities in the Siera village have significantly affected the natural environment, such as altering the hydrographic network, losing plants and vegetation, deteriorating ecology and aesthetics, destroying natural habitat, impacting the surface water, etc.
In Figure 8, EC and NO3 + NO2 measurements were beyond the allowable threshold, especially between 2019 and 2022. Water quality results showed a spike in PO4 in 2020 and 2021, respectively. These water quality differences were results of land use activities such as agriculture, and urban and rural settlements. During the assessment of water quality, long stretches of cultivated land bordering the rivers that feed into the Great Fish catchment were identified.
In conclusion, the results of NO3 + NO2 showed significant differences in almost all catchments. Results of the current study gave evidence that water quality parameters such as PO4-P, NH4-N and NO3 + NO2 were not complying with the SAWQG limits, suggesting that the study area was impacted by anthropogenic activities such as agriculture, mining activities, human settlements and sewage works. The results of pH and EC suggested that mining activities are limited in the area. However, study results suggested strong intervention was required to address identified spikes of PO4-P, NH4-N and NO3 + NO2 in the study area. Strong water resource compliance monitoring and enforcement to control water resource pollution sources is critical. However, other water quality parameters did not show significant differences based on wet and dry seasons.
3.3. Overall Assessment of Water Quality Status
The overall assessment was calculated and analysed using Makanda et al. [27], Mnyango et al. [13] and Nzama et al. [18] techniques. Table 12, Table 13, Table 14, Table 15 and Table 16 show overall water quality results for all five catchments in the study area.

Table 12.
Water quality index calculated for the Gamtoos catchment.

Table 13.
Water quality index calculated for the Great Kei catchment.

Table 14.
Water quality index calculated for the Sundays catchment.

Table 15.
Water quality index calculated for the Mbashe catchment.

Table 16.
Water quality index calculated for the Great Fish catchment.
According to the WQI, the water quality status for all five drainage regions ranged from good to very poor water quality conditions. However, the water quality status for the Gamtoos catchment showed an improved result when compared with the other catchments, sitting at 49.71 indicating good water quality condition as per the WQI classification. As reported in the previous study [15], after the confluence of the Kouga and Baviaanskloof Rivers, the quality of water was categorised as good due to protected areas. The overall water quality assessment for the Great Fish catchment was calculated to be 79.08 indicating poor water according to water quality index classification. The water quality status for the Great Kei, Mbashe and Sundays catchments was calculated to be 93.92, 93.54 and 92.6, respectively. The status of these three catchments showed very poor water quality conditions, as per the WQI classification. The overall water quality status showed that the WMA7 is not ideal for users such as domestic, recreational and sensitive aquatic organisms. Therefore, water treatment is required before use.
3.4. Groundwater Quality Results
The physiochemical groundwater quality parameters (pH, EC, Ca, Mg, K, F, Cl, NO3 + NO2, SO4, CaCO3 and Na) were identified to assess groundwater quality in more detail in all five catchments within the WMA7. Median values of groundwater quality parameters were determined to characterise the dominant groundwater quality in the study area. The results for groundwater quality analysis were presented per catchment. The groundwater quality results are presented in Table 17, Table 18, Table 19, Table 20 and Table 21.

Table 17.
Median value of groundwater quality parameters in the Gamtoos catchment.

Table 18.
Median value of groundwater quality parameters in the Great Kei catchment.

Table 19.
Median value of groundwater quality parameters in the Sundays catchment.

Table 20.
Median value of groundwater quality parameters in the Mbashe catchment.

Table 21.
Median value of groundwater quality parameters in the Great Fish catchment.
After interrogation of WMS groundwater quality data, the overall groundwater quality of all five catchments within the WMA7 greatly varied.
3.4.1. Gamtoos Catchment
In the Gamtoos catchment, water quality assessment results showed CaCO3 was a problem across the catchment. The mean value of CaCO3 ranged from 243.85 mg/L to 421.13 mg/L in the identified stations within the catchment. This was likely due to geological types and/or land use practices. Groundwater monitoring sites L3324AB and L332AD recorded significantly higher values for EC, Cl and Na, which were beyond their respective standard limits. The mean values of EC were 307.20 mS/m at L3324AB and 427 mS/m at L332AD. The mean value of Cl was 634.34 mg/L at L3324AB and a value of 1115 mg/L at L332AD. The mean values of Na 351.61 mg/L and 530.64 mg/L were recorded at L3324AB and L332AD, respectively. The higher values of EC, Cl and Na at L3324AB and L332AD could be attributed to intense irrigation and citrus farming.
3.4.2. Great Kei Catchment
In the Great Kei catchment, water quality assessment results showed the value of CaCO3 was beyond the target water quality ranges in all groundwater stations. Non-compliance of CaCO3 was recorded at 257.96 mg/L (S19097), 332.71 mg/L (S19406), 283 mg/L (S19097), 312.77 mg/L (S19119) and 308.11 mg/L (S27007). The main land use activities at the stations are sand mining and vegetation removal. These activities expose riverbanks and land surface, which caused gullies during erosion. Station S7N0001 was the only monitoring station which complied (155 mg/L) with the target water quality range of 200 mg/L. The mean value of NO3 + NO2 showed non-compliance to the target water quality range, with 3.58 mg/L (S19406), 2.33 mg/L (S19097), 2.72 mg/L (S19119) and 4.45 mg/L (S7N0001). The recorded higher values of NO3 + NO2 at the stations could be due to farming and sewage work activities.
3.4.3. Sundays Catchment
In the Sundays catchment, water quality results showed a steep rise in EC mean value with 777 mS/m, at the ZQMKWD1 monitoring station, which was beyond the target water quality range of 170 mS/m. The presence of EC in a resource was an indication of poor water quality conditions. The majority of groundwater monitoring stations in the catchment had EC which was beyond the required limits. The high mean value of CaCO3 spreads across all monitoring stations in the catchment, exceeding the value target water quality range of 200 mg/L. The mean value of SO4 was high at the following monitoring stations: N2636 (265.01 mg/L), N3242 (362.53) and ZQMKWD1 (966.90) compared to the target water quality range of 250 mg/L. According to Makanda et al. [28], SO4 is an indicator of general mining impacts. Results for NO3 + NO2 value varied from 1.98 mg/L to 2.13 mg/L at the stations N2636 and ZQMADO1, respectively. This was likely due to intensive farming practices in the catchment. The water quality results of Na did not comply with the majority of monitoring stations within the study area, except at stations N3238 (127.08 mg/L) and N3243 (39.42 mg/L) which complied with the target water quality range of 200 mg/L.
3.4.4. Mbashe Catchment
In the Mbashe catchment, the monitoring station (EC/T90/209) recorded high values of CaCO3 (298.80 mg/L), Na (238.80 mg/L), CI (339.80 mg/L), NO3 + NO2 (1.11 mg/L). The mean value level of NO3 + NO2 was beyond the limit at monitoring stations at T9N0001 (15.10 mg/L) and ZQMLANI (2.49 mg/L), while the mean value of F was non-compliant at station TIN0001 with 3.58 mg/L.
3.4.5. Great Fish Catchment
The results of the water quality assessment in the Great Fish catchment showed a mean value of CaCO3 which exceeded the target water quality range of 200 mg/L, across the catchment. The mean value ranged from 272.89 mg/L to 480.70 mg/L across all stations. This was a clear indication of the influence of farming practices and geological types in the study area. The ZQMADK monitoring station was a water quality hot spot and the majority of parameters were beyond the target water quality ranges. The station recorded EC of 248 mg/L, Na of 361.70 mg/L, Cl of 495.81 mg/L, NO3 and NO2 of 3.59 mg/L and F of 1.59 mg/L. At the station, there is high sedimentation (highly turbid), farming, cattle trampling, and sewage works problems.
In conclusion, areas in the central (Great Fish catchment) and western parts (Gamtoos catchment) of the WMA7 reflected marginal to poor groundwater quality. The NO3 + NO2 value level was marginally high (2.12 mg/L) compared to the required limit of 1.00 mg/L. According to a study by DWS [33], EC spatial distribution in the catchment generally reflected lithological controls, favourable recharge and rainfall conditions. The study by DWS [33] noted that though some parts of the catchments in the WMA7 had poor groundwater quality, it was not always impacted by anthropogenic sources but happened naturally in aquifers, owing to interaction with rock and sediments. However, spatial distributions and quality results of NH4-N, SO4 and NO3 + NO2 proved to be generally evident that pollution sources were man-made. Therefore, groundwater treatment is recommended to render it suitable for sensitive water users.
3.4.6. Spatial Distribution of Groundwater Parameters
The spatial distribution of groundwater chemical parameters such as nitrate and nitrite, ammonia and sulphate in the study area is presented in Figure 9, Figure 10 and Figure 11, respectively.
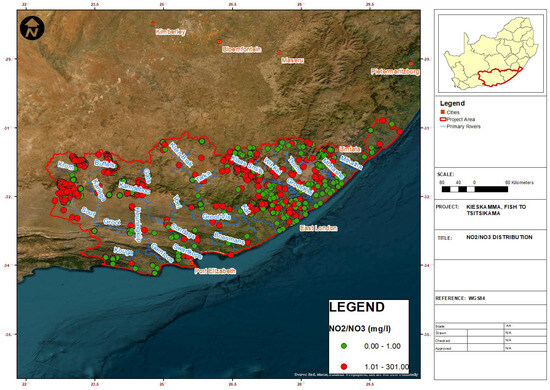
Figure 9.
Spatial distribution of nitrate and nitrite within the WMA7 [33].
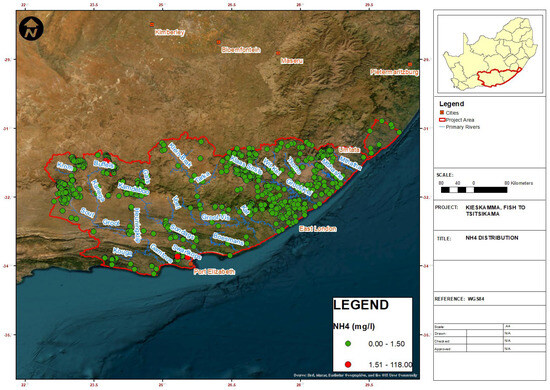
Figure 10.
Spatial distribution of ammonia within the WMA7 [33].
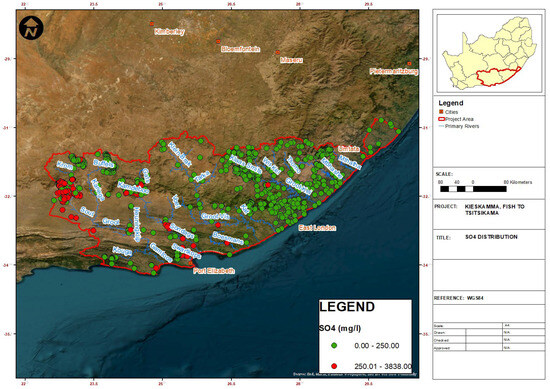
Figure 11.
Spatial distribution of sulphate within the WMA7 [33].
The DWS WMS database was interrogated to analyse groundwater quality data in the study area. The spatial distribution of nitrate and nitrite, ammonia and sulphate were assessed to determine potential anthropogenic impacts. Where external sources are impacting negatively on groundwater quality, increases in typical pollution indicators such as nitrate, ammonia and sulphate will generally be evident. The SAWQGs and SANS 241 [22] limits were used to distinguish between acceptable and elevated values, respectively. The results show that elevated nitrate and nitrite values are widespread in the study area, as indicated in Figure 9. This is likely due to the impact of farming practices in the WMA7. The land uses in the WMA7 include extensive subsistence and commercial agriculture, afforestation, irrigation, human settlements, limited mining activities, industries, etc. Groundwater recharge processes are modified during flooding events, causing leaching of salts, including nitrate. This could be the reason considering that the study area is prone to flooding events. Figure 10 shows that ammonia values are generally within the limits in the study area. Figure 11 shows that elevated sulphate values occur mainly in the western half of the study area. These elevated sulphates may potentially be due to external sources, namely agricultural practices or other surrounding land use activities. Groundwater quality in the western and central parts of the study area reflected marginal to poor groundwater quality. This could be due to lithology, limited groundwater recharge and rainfall conditions, which have a bearing on the quality of groundwater. These sections of the study area are associated with the Bokkeveld Group, Uitenhage Group and alluvium (particularly over the more arid western part of WMA7). Therefore, these sections of the study area have poor groundwater quality, owing to greater interaction with rock and sediments. Groundwater quality is not always impacted by anthropogenic sources but naturally occurs in aquifers. Based on the groundwater quality assessment, the main parameters of concern are EC (salinity), nitrate and nitrite and sulphate. Groundwater with elevated EC, nitrate and nitrite, and sulphate will require treatment prior to use.
4. Conclusions
The current study aimed to assess and evaluate water quality changes, for both surface and groundwater, in the Mzimvubu to Tsitsikamma Water Management Area (WMA7). The current study was able to successfully make use of statistical analysis and a water quality index in order to explain seven-year trends and the present state of all five catchments within the study area. The study results showed that, overall, water quality parameter values of NH4, pH, Na, Cl, Mg, F, K, SO4 and CaCO3 were within the water quality target range of the South African Water Quality Guidelines and SANS 241. However, the values of PO4, NO3 + NO2 and EC vary significantly due to possible sewage works, sand mining, farming and industrial activities in the study area. The application of WQI was explored to determine the overall water quality status of all five catchments within the WMA7. The overall assessment results of all five catchments in the WMA7 showed that the Gamtoos catchment was in a good water quality state while the other four catchments were in a poor to very poor state, according to the WQI classification. Based on the groundwater quality assessment, the main parameters of concern were EC (salinity), NO3 + NO2 and SO4. However, groundwater assessment revealed that groundwater quality was chemically suitable for drinking purposes in most parts of the study area. Similarly, the study [33] found that agricultural activities and wastewater treatment works were the main sources of EC and NO3 + NO2 in the Keiskamma River and in the impoundment downstream. The current study findings provided baseline information to assist the National Department of Water and Sanitation in the management of water resources and in making informed decisions regarding identified water quality hotspots, the authorisation of future water use and the magnitude of the impacts of developments. Therefore, the study recommended resource-directed measures to improve surface and groundwater resource protection, especially in areas where surface and groundwater quality for other uses remains a challenge. This will enable management authorities and researchers to focus on potential future threats that need to be addressed to prevent further water quality changes.
Author Contributions
L.H.M. was responsible for data collection, sorting of historical data, data analysis, and drafting the article. N.J. and D.O. were responsible for the review and editing of the article. N.J. is the academic supervisor of the corresponding author and D.O. is the academic co-supervisor. All authors have read and agreed to the published version of the manuscript.
Funding
This research was funded by the Department of Water and Sanitation (DWS), South Africa.
Data Availability Statement
Publicly available datasets were analyzed in this study. This data can be found here: [https://www.dws.gov.za/RDM/WRCS/kft.aspx] (accessed on 8 February 2024).
Acknowledgments
The authors gratefully acknowledge Regan Rose and James Ramapulane for the study area maps and the DWS RQIS for assistance with water quality data.
Conflicts of Interest
The authors declare no conflicts of interest.
References
- Halder, J.N.; Islam, M.N. Water Pollution and its Impact on the Human Health. J. Environ. Hum. 2015, 2, 36–46. [Google Scholar] [CrossRef]
- Mishra, B.K.; Kumar, P.; Saraswat, C.; Chakraborty, S.; Gautam, A. Water Security in a Changing Environment: Concept, Challenges and Solutions. Water 2021, 13, 490. [Google Scholar] [CrossRef]
- Uddin, G.; Nash, S.; Olbert, A.I. A Review of Water Quality Index Models and Their Use for Assessing Surface Water Quality. Ecol. Indic. 2021, 122, 107218. [Google Scholar]
- United Nation Water (UN Water). International Decade for Action “Water for Life” 2005–2015; UN-Water: New York, NY, USA, 2015. [Google Scholar]
- United Nations Development Programme (UNDP). Fighting Climate Change: Human Solidarity in a Divided World; United Nations Development Programme 1 UN Plaza: New York, NY, USA, 2007; ISBN 978-0-230-54704-9. [Google Scholar]
- Dunca, A.M. Water Pollution and Water Quality Assessment of Major Transboundary Rivers from Banat (Romania); Department of Geography, Faculty of Chemistry, Biology, Geography, West University of Timisoara: Timisoara, Romania, 2018; p. 9073763. [Google Scholar] [CrossRef]
- Ji, X.; Dahlgren, R.A.; Zhang, M. Comparison of Seven Water Quality Assessment Methods for the Characterization and Management of Highly Impaired River Systems. Environ. Monit. Assess. 2016, 188, 15. [Google Scholar] [CrossRef] [PubMed]
- Mateo-Sagasta, J.; Zadeh, S.M.; Turral, H. Water Pollution from Agriculture: A Global Review; Food and Agriculture Organization of the United Nations Rome: Rome, Italy, 2017. [Google Scholar]
- De Necker, L.; Neswiswi, T.; Greenfield, R.; Johan van Vuren, J.; Brendonck, L.; Wepener, V.; Smit, N. Long-Term Water Quality Patterns of a Flow Regulated Tropical Lowland River. Water 2019, 12, 37. [Google Scholar] [CrossRef]
- Yotova, G.; Varbanov, M.; Tcherkezova, E.; Stefan Tsakovski, S. Water Quality Assessment of a River Catchment by the Composite Water Quality Index and Self-Organizing Maps. Ecol. Indic. 2021, 120, 106872. Available online: www.elsevier.com/locate/ecolind (accessed on 17 May 2022). [CrossRef]
- Rahman, A.; Jahanara, I.; Jolly, Y.N. Assessment of physicochemical properties of water and their seasonal variation in an urban river in Bangladesh. Water Sci. Eng. 2021, 14, 139–148. [Google Scholar] [CrossRef]
- Griffin, N.J.; Palmer, C.G.; Scherman, P.A. Critical Analysis of Environmental Water Quality in South Africa: Historic and Current Trends; Unilever Centre for Environmental Water Quality, Institute for Water Research, Rhodes University: Grahamstown, South Africa, 2014. [Google Scholar]
- Mnyango, S.S.; Thwala, M.; Oberholster, P.J.; Truter, C.J. Using Multiple Indices for the Water Resource Management of a Monomictic Man-Made Dam in Southern Africa. Water 2022, 14, 3366. [Google Scholar] [CrossRef]
- Department of Water and Sanitation, South Africa. Determination of Water Resource Classes, Reserve and RQOs in the Keiskamma and Fish to Tsitsikamma Catchment: Inception Report; Report No: WEM/WMA7/00/CON/RDM/0121; Water Ecosystem Management: South Africa, Pretoria, 2021.
- Department of Water and Sanitation, South Africa. Determination of Water Resource Classes, Reserve and RQOs in the Keiskamma and Fish to Tsitsikamma Catchment: Status quo and Delineation of Integrated Units of Analysis Report; Report No: WEM/WMA7/00/CON/RDM/0322; Water Ecosystem Management: South Africa, Pretoria, 2022.
- Cobbing, J.E. An Updated Water Balance for the Grootfontein Aquifer near Mahikeng. Water SA 2018, 44, 54–64. [Google Scholar] [CrossRef]
- Mhangara, P. Land Use/Cover Change Modelling and Land Degradation Assessment in the Keiskamma Catchment Using Remote Sensing and GIS. Ph.D. Thesis, Faculty of Science, Nelson Mandela Metropolitan University, Gqeberha, South Africa, 2011. [Google Scholar]
- Murray, R.; Baker, K.; Ravenscroft, P.; Musekiwa, C.; Dennis, R. A Groundwater Planning Toolkit for the Main Karoo Basin: Identifying and Quantifying Groundwater Development Options Incorporating the Concept of Wellfield Yields and Aquifer Firm Yields; WRC Report No. 1763/1/11; Water Research Commission: Pretoria, South Africa, 2012. [Google Scholar]
- Nzama, S.M.; Kanyerere, T.O.B.; Mapoma, H.W.T. Using Groundwater Quality Index and Value Duration Curves for Classification and Protection of Groundwater Resources: Relevance of Groundwater Quality of Reserve Determination; Springer: Cham, Switzerland, 2021. [Google Scholar] [CrossRef]
- Department of Water and Sanitation, South Africa. Determination of Water Resource Classes, Reserve and RQOs in the Keiskamma and Fish to Tsitsikamma Catchment: Final Groundwater Report; Report No: WEM/WMA7/00/CON/RDM/1223; Water Ecosystem Management: South Africa, Pretoria, 2023.
- Department of Water Affairs and Forestry (DWAF). Water Quality Sampling Manual for the Aquatic Environment; Institute for Water Quality Studies (IWQS): Pretoria, South Africa, 1997. [Google Scholar]
- SANS 241-1; Drinking Water Specification. Integral Laboratories: Pretoria, South Africa, 2015.
- Lukhabi, D.K.; Mensah, P.K.; Asare, N.K.; Pulumuka-Kamanga, T.; Ouma, K.O. Adapted Water Quality Indices: Limitations and Potential forWater Quality Monitoring in Africa. Water 2023, 15, 1736. [Google Scholar] [CrossRef]
- Kumar, A.; Dua, A. Water quality index for assessment of water quality of river Ravi at Madhopur (India). Glob. J. Environ. Sci. 2009, 8. [Google Scholar] [CrossRef]
- DWAF. South African Water Quality Guidelines, Aquatic Ecosystems, 1st ed.; Department of Water Affairs & Forestry: Pretoria, South Africa, 1996; Volume 7.
- EU. European Union Drinking Water Regulation; Statutory Instruments No. 99; European Union: Dublin, Ireland, 2023. [Google Scholar]
- WHO. Guidelines for Drinking Water Quality; World Health Organization: Geneva, Switzerland, 1984. [Google Scholar]
- Makanda, K.; Nzama, S.; Kanyerere, T. Assessing Feasibility of Water Resource Protection Practice at Catchment Level: A Case of the Blesbokspruit River Catchment, South Africa. Water 2023, 15, 2394. [Google Scholar] [CrossRef]
- DWAF. South African Water Quality Guidelines, Domestic Uses, 2nd ed.; Department of Water Affairs & Forestry: Pretoria, South Africa, 1996; Volume 1.
- Fatoki, O.S.; Gogwana, P.; Ogunfowokan, A.O. Pollution Assessment in the Keiskamma River and in the Impoundment Downstream; Research and Development Office, University of Venda for Science and Technology: Thohoyandou, South Africa, 2003. [Google Scholar]
- Department of Water and Sanitation. Provision of General Modelling and Water Resource Evaluation Services for Allocable Water Quantification and to Support Integrated Water Resource Planning (Kouga, Baviaans, Gamtoos and Kromme Rivers)—Surface Water Quality Report; Mariswe (Pty) Ltd.: Pretoria, South Africa, 2023.
- Kafu, B.; Mlaba, S. Assessing the Impact of Quarrying as an Environmental Ethic Crisis: A Case Study of Limestone Mining in a Rural Community; University of Fort Hare, Faculty of Education: Alice, South Africa, 2024. [Google Scholar] [CrossRef]
- Department of Water and Sanitation, South Africa. Determination of Water Resource Classes, Reserve and RQOs in the Keiskamma and Fish to Tsitsikamma Catchment: Groundwater PES and Quantification of the Reserve Report; Report No: WEM/WMA7/00/CON/RDM/1122; Water Ecosystem Management: South Africa, Pretoria, 2023.
Disclaimer/Publisher’s Note: The statements, opinions and data contained in all publications are solely those of the individual author(s) and contributor(s) and not of MDPI and/or the editor(s). MDPI and/or the editor(s) disclaim responsibility for any injury to people or property resulting from any ideas, methods, instructions or products referred to in the content. |
© 2024 by the authors. Licensee MDPI, Basel, Switzerland. This article is an open access article distributed under the terms and conditions of the Creative Commons Attribution (CC BY) license (https://creativecommons.org/licenses/by/4.0/).