Article

Mechanism of Crude Oil Biodegradation in Bioreactors: A Model Approach

by
Carlos Costa
* and
Nicolás Millán
Chemical Engineering Department, Faculty of Chemical Sciences, University of Salamanca, Plaza de la Merced s/n, 37008 Salamanca, Spain
*
Author to whom correspondence should be addressed.
Water 2024, 16(12), 1653; https://doi.org/10.3390/w16121653
Submission received: 8 May 2024 / Revised: 3 June 2024 / Accepted: 7 June 2024 / Published: 10 June 2024
(This article belongs to the Special Issue Biological Treatment of Water Contaminants: A New Insight)

Abstract

:
Oil-degrading bacteria have the ability to degrade alkanes present in crude oil because of a special enzymatic system, the alkane hydroxylase complex (AlkH). The mechanism for the transport and degradation of alkanes present in crude oil remains unclear, especially related to the first step in hydrocarbons oxidation. In this work, we present a novel model of the crude oil biodegradation mechanism by considering the contact between the oil drop and the cell and calculating the mass transfer coefficients in three oleophilic bacteria (B. licheniformis, P. putida and P. glucanolyticus). The mass transfer coefficients are evaluated under critical time conditions, when the kinetics and mass transport are in balance, and the difference in the values obtained (kL α = 1.60 × 10⁻³, 5.25 × 10⁻⁴ and 6.19 × 10⁻⁴ m/d, respectively) shows the higher value of the mass transfer coefficient and higher biodegradation potential for B. licheniformis. Because the morphology of the cells has been analyzed by optical and electron microscopy, in the proposed model, the increase in the size of the cells in P. glucanolyticus compared to P. putida exhibits higher values of the mass transfer coefficients and this is attributed, as a novel statement, to a bigger window for alkanes transport (contact area) when the external area of the cell is bigger.

Graphical Abstract

1. Introduction

Oil-degrading bacteria are ubiquitous in nature, given that hydrocarbons are prevalent in marine environments; however, despite their prevalence, oil-degrading bacteria represent only a small fraction of the overall microbial community due to the huge extension of natural reservoirs and marine environments [1,2]. Oil-degrading bacteria (oleophilic) are characterized as possessing a particular enzymatic system, the alkane hydroxylase complex (AlkH) [3,4]. The monooxygenase system AlkH can be present in oleophilic bacteria in two versions: the rubredoxin-dependent enzyme, more frequently described and located in the inner face of the cell membrane, and the alkane hydroxylase containing cytochrome P450 monooxygenases, soluble in the cytoplasm [3,5,6,7,8,9].
In both cases, when hydrocarbons are going to be degraded by oleophilic bacteria, the molecules have to enter inside the cell, because the intracellular enzyme activity has been described to be higher than the extracellular activity [10]. This transport to the cell seems to occur after n-alkanes are oxidized in a first step to a terminal or subterminal alcohol via extracellular activity [11]. In this step, monooxygenases incorporate an oxygen atom from O2 into the hydrocarbon molecule to form the alcohol [12], which is introduced inside the cell and subsequently oxidized by terminal or subterminal oxidation [13]. Terminal oxidation has been described as the main pathway for n-alkanes oxidation [14,15], and the product formed, the primary alcohol (alkan-1-ol), is oxidized to a fatty acid and shortened to a two-carbon compound via Acetyl Co-A formation. This two-carbon compound is incorporated into the intermediary metabolism of the cell (β-oxidation pathway) [3,13,16]. In the di-terminal pathway (ω-oxidation), the dicarboxylic acid formed (di-terminal) is been processed by β-oxidation [17], and if subterminal oxidation occurs, the secondary alcohol formed (alkan-2-ol) is transformed into an acetyl-ester, hydrolyzed and finally converted into an alcohol and a fatty acid via acetate formation [12,13].
The enzymatic conversion of n-alkanes, considered to be the mandatory mechanism in oil-degrading bacteria, has been deeply described [3,4,16,18,19,20], but previous to enzymatic action, the mass transport of substrate to the cell has to be performed and this is not well understood and needs to be studied and elucidated. The bioavailability of hydrocarbons is one of the key factors for successful oil biodegradation, because of the very low solubility of n-alkanes in water. This inconvenience has been solved by oleophilic bacteria producing biosurfactants, which have been often described [21,22,23,24,25]. These biosurfactants, isolated and characterized mainly as rhamnolipid compounds [25,26,27], disperse the oil in water by the formation of small drops (emulsions), which favor the interaction between the microorganisms and the substrate because the diffusion limitation during the transport to the cell is overcome [28,29,30,31,32,33]. The “approximation” of the cell to the hydrocarbons present in crude oil before mass transport occurs can be understood because chemotaxis has recently been described in hydrocarbon-degrading bacteria [11]. Chemotaxis is the property of sense substrate concentration gradients and in turn moves toward or away from this gradient [34]. It has to be mentioned that it is actually not clear if hydrocarbons are transformed into metabolic intermediates prior to cellular uptake or not [11], which means if the enzymatic conversion specially relates to fatty acids, which are much more soluble in aqueous solution, it is intracellular or extracellular.
In accordance with the actual knowledge, the mechanism of crude oil degradation as a mixture of hydrocarbons by oil-degrading bacteria in aqueous bioreactors could be proposed by the mass transport of the hydrocarbons to the interior of the cell via AlkH enzymatic oxidation to alcohol and the subsequent terminal or subterminal oxidation for incorporation to the TCA cycle. In this sequenced mechanism, the mass transport of hydrocarbons to the cell has to be considered and quantified in order to understand and improve the mechanism applied to the ex situ bioremediation of crude oil spillages.
We propose a crude oil biodegradation mechanism in oil-degrading bacteria as a mass transport and kinetic process in which the substrate concentration gradient between the bulk oil and the adjacent cell is the driving force of transport. The oil concentration is considered to be the substrate concentration in the model as the sum of the concentration of hydrocarbons (TPH). The kinetic coefficients are determined in biodegradation assays for the different oleophilic organisms. In this proposed mechanism, the cell and oil drop sizes were measured in oil-degrading bacteria and the contact area of the cells–oil drops for mass transport is calculated and related to the size of the cells, which has been determined, in view of the mass transport parameters, to be an important factor for transport as a novelty in this article.

2. Materials and Methods

2.1. Oil-Degrading Microorganisms

Three oleophilic microorganisms were selected to be used in the bioreactors: Bacillus licheniformis CECT 20, Pseudomonas putida CECT 31060 and Paenibacillus glucanolyticus CECT 31029. P. putida and B. licheniformis have oil-degrading activity proven in previous experiments [30,35,36]. P. glucanolyticus has recently been cited as an oleophilic bacterium [37,38]. All these oleophilic bacteria has been isolated in our laboratory and deposited in the Spanish Type Culture Collection (CECT).

2.2. Culture Media

Mineral salt medium (MSM) was used for the biodegradation experiments in the bioreactors and the cultivation of oil-degrading bacteria on agar plates. The composition of this medium was 8.6 g/L NaHPO4·7H2O, 1.4 g/L KH2PO4, 3 g/L (NH4)2SO4, 0.6 g/L MgSO4·7H2O, 10 g/L NaCl, 0.01 g/L FeSO4·7H2O, 0.02 g/L CaCl2, and pH = 6.8.
Agar plates were prepared in MSM and 15 g/L pure agar, supplemented with 5 g/L peptone for the obtention of the biomass of pure cultures inoculated in the bioreactors.

2.3. Bioreactors

The biodegradation experiments in the bioreactors were developed in 500 mL thermostatically controlled reactors with magnetic stirring at 900 rpm during a period of 38 days for cultivation of the oleophilic strains and control. The experimental device was described in a previous article [35]. A total of 250 mL of MSM was introduced in each reactor and sterilized at 120 °C for 30 min. Colonies grown on peptone plates were collected 4–5 times by an inoculating loop and transferred to the sterilized bioreactors. Arab Light was introduced to an initial crude oil concentration in the reactors of 1% v/v (8.6 g/L, density 0.86 g/mL). This 1% oil/water ratio is the maximum recommended value for a stable dispersion of oil in water without coalescence of the oil drops [39]. A control experiment (without bacteria inoculum in the sterilized bioreactor) was also performed.
The bioreactor temperature was fixed in 30 °C, the optimal growth temperature for several Pseudomonas sp. and often selected for oil-degradation assays [15,19,25,40,41]. In the ex situ biodegradation of crude oil, the temperature has to normally be fixed in the range 25–35 °C, because of the optimal growth temperature of oil-degraders and volatility of low-molecular-weight hydrocarbons [22,23,42].
To evaluate the oleophilic bacterial growth, the optical density (OD) was measured in triplicate at 600 nm (UV-VIS Thermo Scientific Spectrophotometer Helios Gamma, Thermo Fisher Scientific, Waltham, MA, USA). The analysis frequency of the OD was fixed at 3–5 days. The value of the optical density was recorded after 10 min in the cell of the spectrophotometer to avoid interference from oil that was accumulated on the surface of the cell after this time. Next, 1.0 μm polystyrene microparticles were used for the calibration and calculation of the number of cells, in accordance with the method described by Beal et al. [43] (Sigma-Aldrich Chemie, St. Louis, MO, USA, 10% w/w aqueous suspension, density 1.05 g/cm3). Polystyrene microspheres were prepared in serial dilutions in MSM (triplicate), the same medium used in the bioreactors [44]. This method has recently been compared with colony-forming units (CFUs) and count-microscopy methods and validated for cells with dimensions comparable to the wavelength of light [44].

2.4. Microphotographs

Optical microscopy photographs were taken by a Leica DM 1000 Microscope (Leica Camera, Wetzlar, Germany) at 100× objective and 10× ocular (magnification 1000×) connected to a Medion computer (AMD A10-7800 Radeon R7 processor, Windows 10, Microsoft, Redmond, WA, USA) by transferring 10 μL of samples (bioreactor and pure cultures) to a slide. The diameter of the field of view was 178 μm (100×) for measuring the size of the cells. Software IC Capture 1.2 was used for collecting the pictures and IC Measure for the bacterial size measurements (10 measurements, expressed as mean ± SD).
Scanning electron microphotographs (SEMs) were obtained by a JSM-IT 500 Microscope (JEOL, Tokyo, Japan) at 20 Kv and the preparation of the samples was performed by fixation in polylysine with vapors of glutaraldehyde, dehydration and the critical point. The samples were metalized with 10 nm Au. The transversal axes of the cells were measured for bacilli-shaped bacteria by SEM (7 measurements, expressed as mean ± SD).

2.5. Crude Oil Analysis by GC-FID

An organic extractor (dichloromethane, DCM) was needed to analyze the crude oil from the aqueous solutions due to the low solubility of petroleum in water [15,41,42]. Aqueous samples (1 mL) were taken directly from the bioreactors and mixed with the organic extractor in the appropriate ratio (0.1 mL) for the correct amplification and detection of the signal by GC-FID. This ratio of 10:1 aqueous/organic phases was necessary for the detection of the individual n-alkanes signals. The GC-FID spectra were analyzed in two replicates to ensure reproducibility. The crude oil concentration was followed by TPHC7–C25, in accordance with the most predominant content of n-alkanes in Arab Light (95.8 % C7–C25) [35].
The Arab Light concentration was measured in duplicate using a GC-FID (Agilent 6890 N, Agilent Technologies, Santa Clara, CA, USA) with a capillary Wax column (BP20-SGE Analytical Science, 30 m × 0.25 mm × 0.25 μm, Fisher Scientific, Pittsburgh, PA, USA). Nitrogen was the carrier gas (flow rate 1.40 mL/min), and the FID detector was set at 260 °C with 40 mL/min H2 flow and 450 mL/min airflow. The GC oven temperature program was fixed in accordance with the literature for crude oil analysis [41,42]. The oven temperature program started at 50 °C for 2 min and then increased to 260 °C at 7 °C/min, and this temperature was subsequently maintained for 2 min (total analysis time 34 min). The sample volume used was 1.0 μL, and the syringe was washed 5 times with the analyte before analysis. In between different samples, the syringe was washed 5 times with dichloromethane (DCM). The analysis frequency of the TPHC7–C25 was initially fixed at 3–5 days.

3. Proposed Mechanism

3.1. Kinetics

The biodegradation kinetics of hydrocarbon-degrading bacteria in soil and aqueous solutions has recently been described by the first-order kinetics for Bacillus and Pseudomonas sp. [23,35,45,46]. The biodegradation rate can be expressed in these terms:
d S d t k i n e t i c s = k S
where S is the substrate concentration, t is the time and k the kinetic coefficient. Integrating the differential equation gives Equation (2) in the exponential form:
S = S o e k t
which describes the exponential decay of the substrate concentration (S) in time from the initial value (So). The biodegradation kinetics can be obtained by combining Equations (1) and (2):
d S d t k i n e t i c s = k S o e k t

3.2. Mass Transport

In view of the optical microphotographs taken in the bioreactor after the growth of oil-degrading bacteria (Figure 1), the crude oil drops are distributed in the whole aqueous solution and it is assumed that all the cells tend to adhere to the oil surface [32].
If the mass transport is considered for a unit volume of the bioreactor, the reaction rate is expressed as follows:
d S d t t r a n s p o r t = J s A c N
where the substrate concentration (oil, S) as a function of the time (t) is transferred by the mass flux (Js) to the cells, with α being the contact fraction of the projected area (Ac) and N the number of cells for a unit of reactor volume (m3). The group α Ac N expresses the total effective area for mass transfer (contact fraction of area x projected area of the cell x number of cells). The mass flux (Js) to the cell can be written as follows:
J s = k L S S c
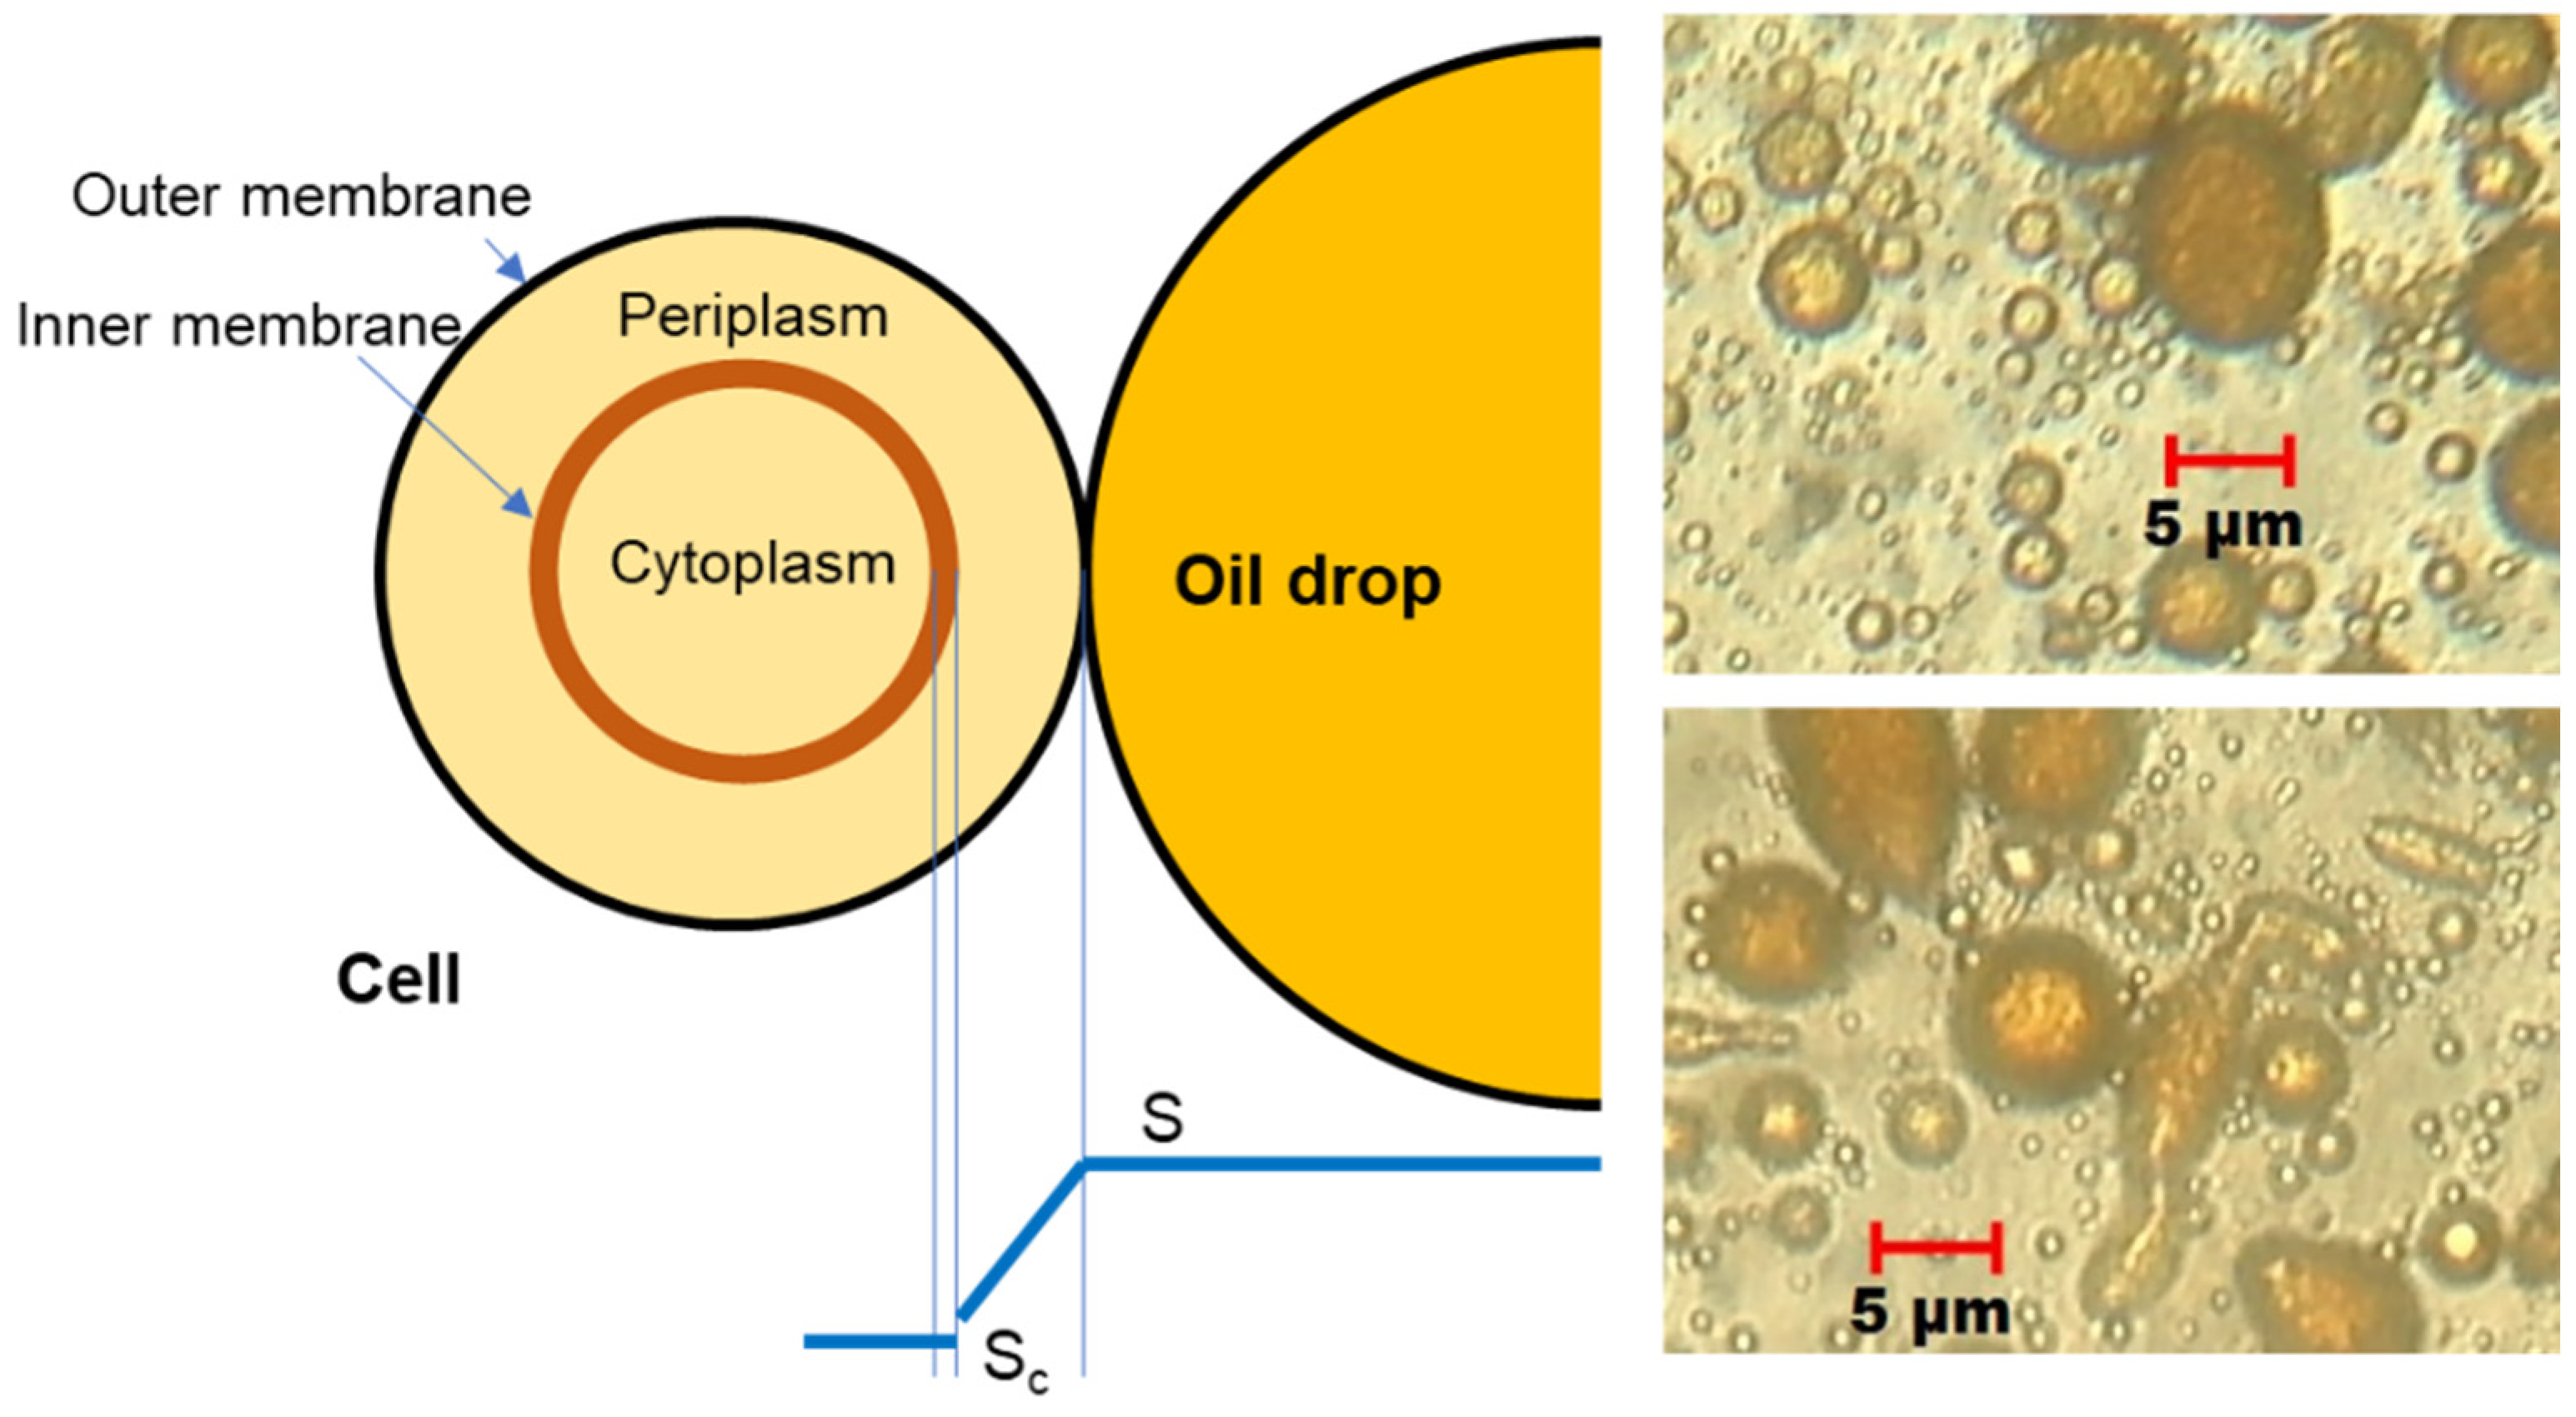
with kL being the permeability coefficient and (SSc) the gradient of the substrate between the bulk oil phase (S) and the outer side of the inner membrane of the cell (Sc), in accordance with Figure 2, for the proposed mass transfer model. In this model, it is assumed that there is no difference in the substrate concentration between the interior of the cell (inner membrane) and the outer side of the inner membrane [39], so the mass transfer resistance is focused between the outer and the inner membranes (Figure 2).
If Equation (5) is replaced in Equation (4):
d S d t t r a n s p o r t = k L S S c A c N
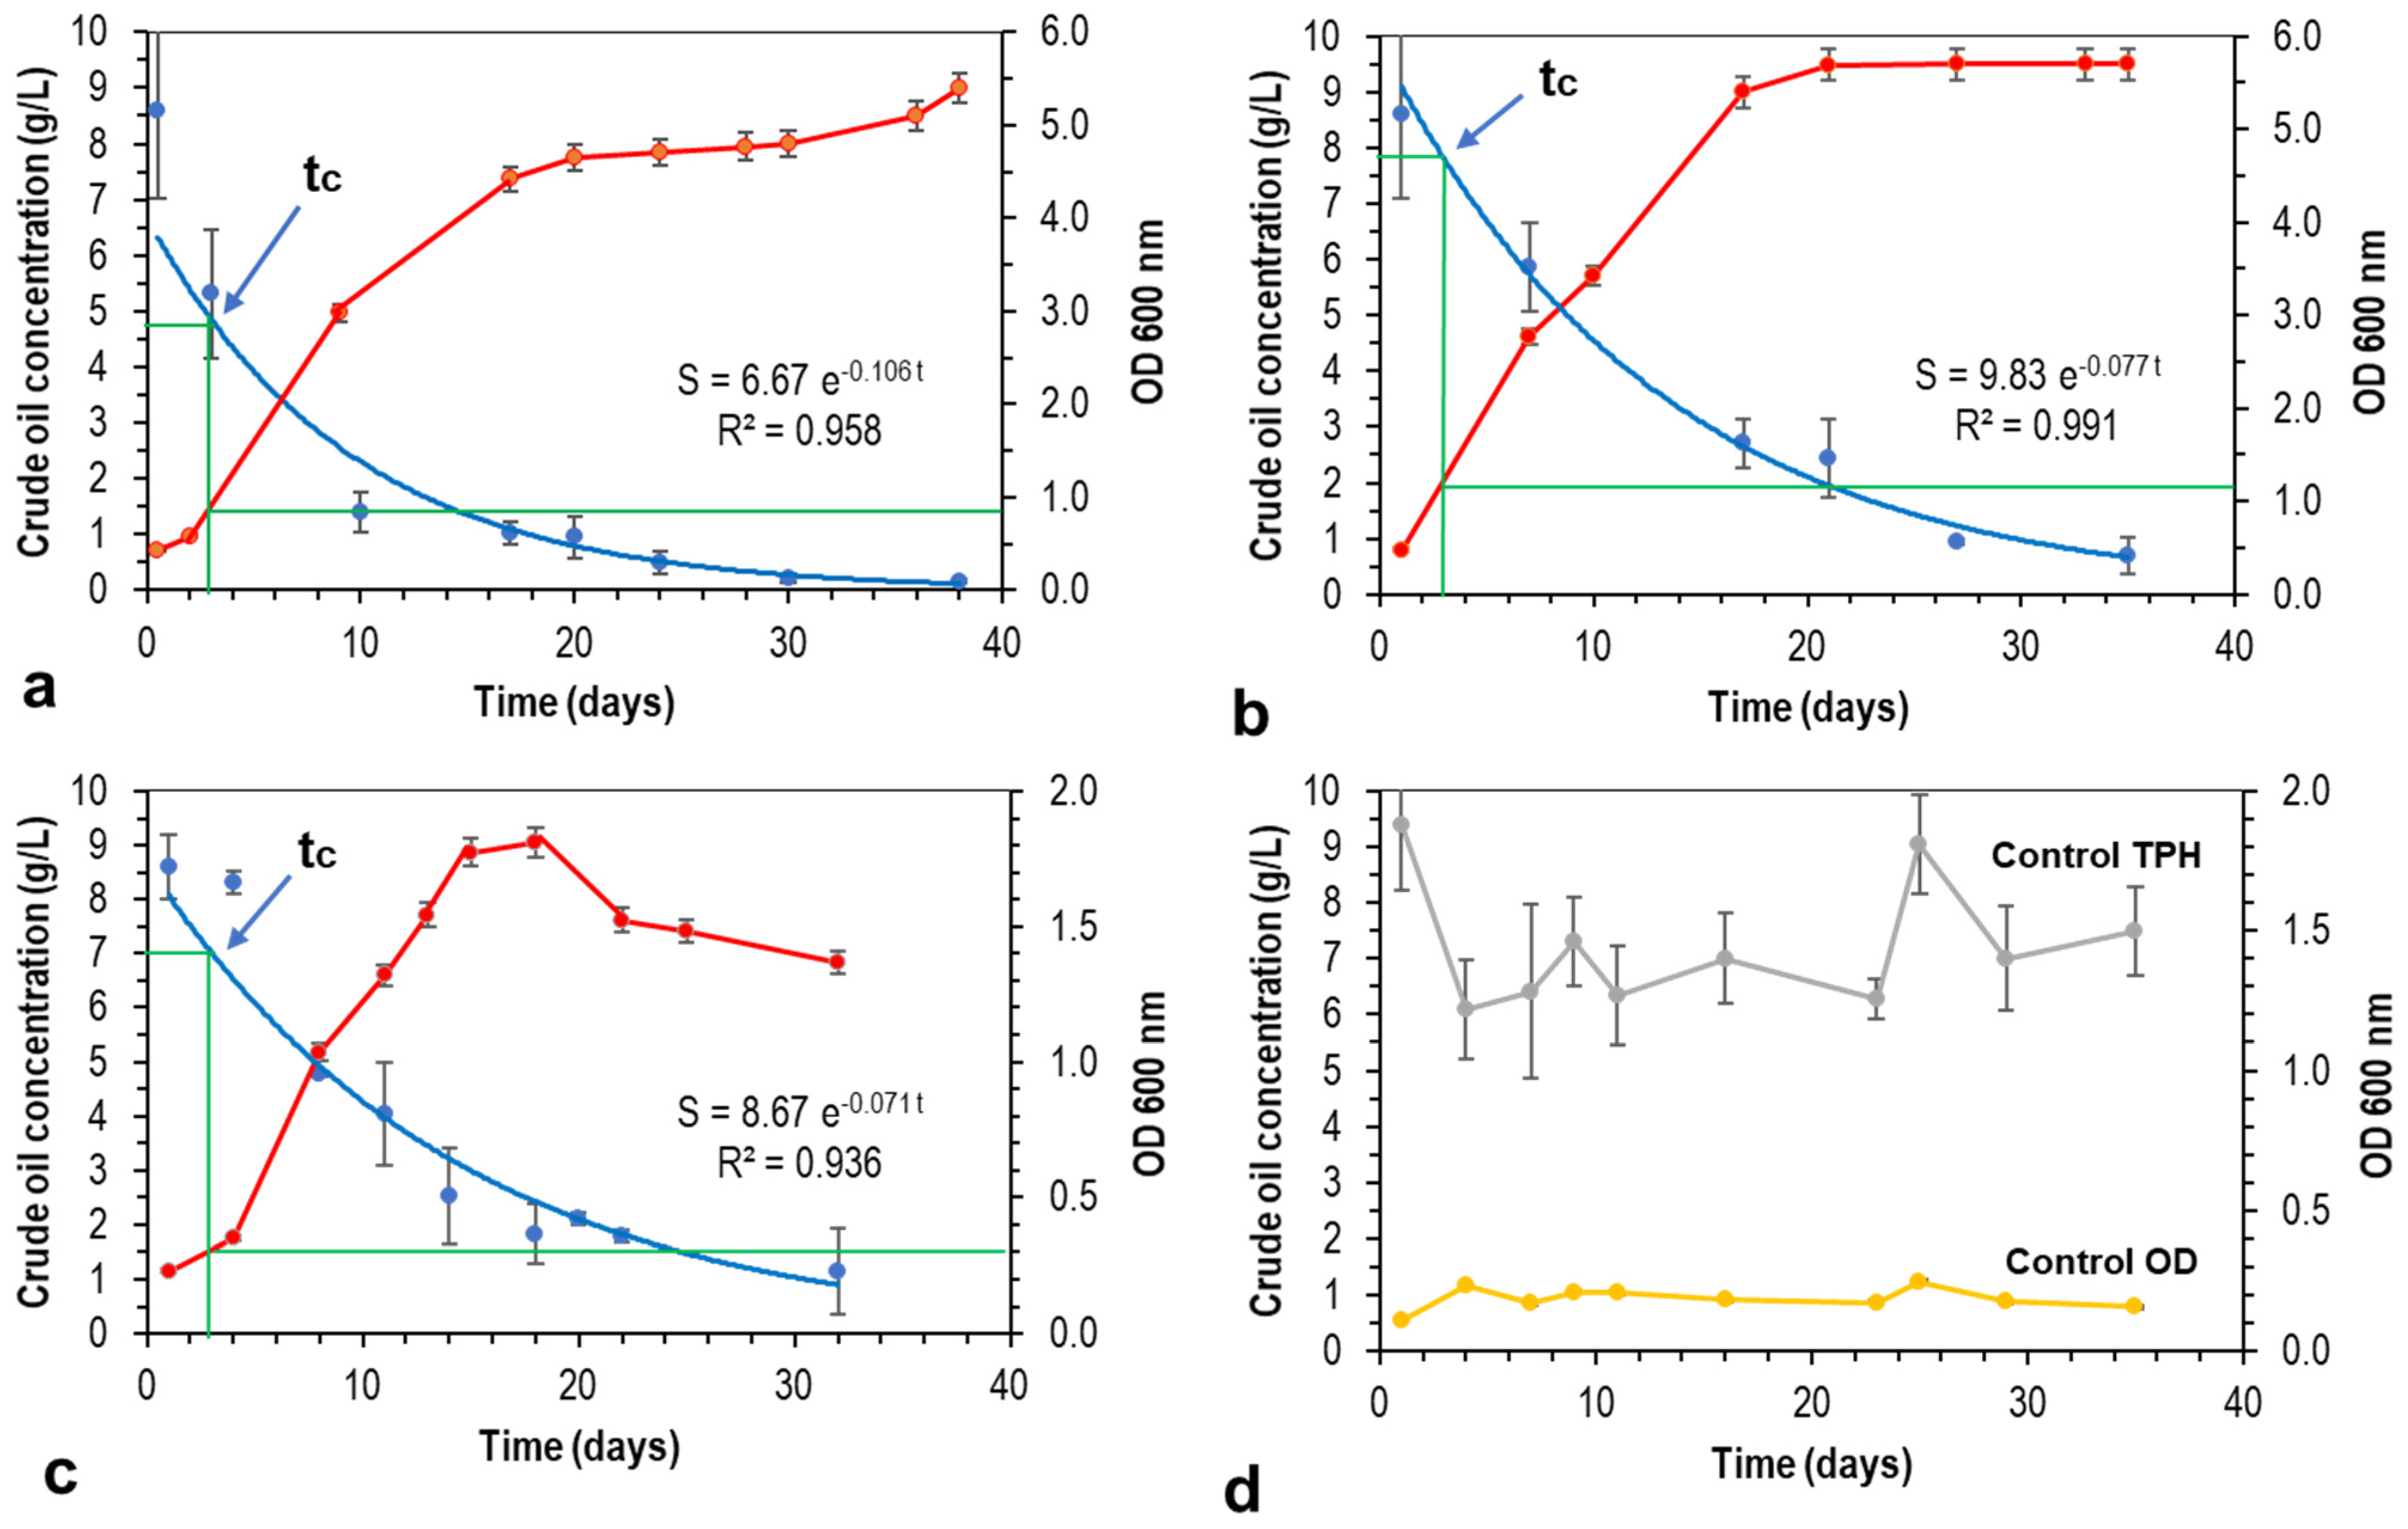
During the growth of oil-degrading bacteria, at the initial phase, the kinetics are mandatorily related to the substrate uptake (Equation (3)), but after the critical time (tc) is reached, the kinetic reaction rate exceeds the transport rate and mass transport becomes mandatory on substrate uptake.
This time (tc) is the theoretical point at which the kinetics and mass transport are in balance, so both equations can be equaled (Equations (3) and (6)) for the substrate concentration at the critical time (Stc):
d S d t k i n e t i c s = d S d t t r a n s p o r t ,     t = t c
k S t c e k t = k L S t c S c A c N
And finally, with this equality, kLα can be obtained:
k L = k S t c e k t S t c S c A c N
The permeability coefficient (kL) and the contact fraction of the area (α) cannot be measured directly, considering the interface between the surface of the cells and the oil drops to be an indefinable property. Equation (9) permits us to estimate these variables and the contact fraction of the area (α) can be considered to have an average value in the range 0 < α < 1 during the phase of the transport controlled growth.
Because the driving force of mass transport is the difference in the substrate concentration or gradient between the bulk oil and the adjacent cell, there would be no more mass transfer when the substrate concentration reached the concentration in the cell. In hydrocarbon-oxidizing microorganisms, hydrocarbon inclusions in the cell mass have been cited [39], which are thought to be an energy pool for maintenance. This remainder of the substrate concentration inside the cell due to hydrocarbon inclusions at the end of oil-degrading bacteria growth is considered to be in equilibrium with the substrate concentration of the cell surface, and this will be the point at which mass transfer will be stopped. With these arguments, the substrate concentration in the cell (Sc) can be estimated by the remaining substrate concentration analyzed at the end of the biodegradation experiment.

4. Results and Discussion

In Equation (9), for the calculation of the mass transfer parameters (permeability coefficient x fraction of contact area: (kL α), the critical time has to be fixed (Section 4.1) to calculate the substrate concentration (oil) at the critical time (Stc). In Section 4.2, the number of cells (N) is calculated by the method of the polystyrene microspheres, while Section 4.3 describes the projected area measurements (Ac), in accordance with the optical microscopy and SEM observations of the morphology of the oleophilic bacteria.
Section 4.4 describes the calculation of the mass transfer coefficients (kL α) for the three oil-degrading bacteria, and in Section 4.5, the guidelines for future research are expressed.

4.1. Critical Time

The critical time has been defined in Equation (7) as the theoretical point at which the kinetics and mass transport are in balance. There is not a protocol or method for the fixation of this time, especially in crude oil or hydrocarbons biodegradation. It is considered that this time is reached when a certain amount of substrate is degraded and biomass clearly enters the exponential growth phase [39]. We decided to fix this time at 3 days [32], the time at which after biosurfactants segregation by oleophilic bacteria, the substrate has been degraded and the biomass has doubled in ABS value (Figure 3). The critical time estimation fixes the value of the substrate concentration under the critical time conditions (Stc, Figure 3 and Table 1).

4.2. Number of Cells

In Equation (9), the number of cells in the bioreactor (N), as determined for a known OD value, can be analyzed by traditional methods like colony-forming units (CFUs) or measurements of cell count microscopy. Because the OD in bacterial cultures is based on light scatter rather than absorbance, the light is turned due to the presence of cells (turbidity) and the number of particles and their size represent the reason for the observed absorbance value. Recently, a new method for the calculation of the number of cells for a given OD value has been proposed and compared with the traditional methods [43,44]. This method is based on the simulation of the cell cultures by aqueous solutions of 1.0 μm polystyrene microparticles and the calibration of the OD for different concentrations of these suspensions of microparticles. A calibration relationship between the OD and the number of particles is needed to prove the Beer–Lambert law in the range of ABS in which the calculation of the number of cells will be performed.
In the simulation of cells by microsphere particles, the number of these particles (N) is calculated by considering the volume of a spheric particle and the volume of polystyrene, which are calculated by mass and density:
N = p o l y s t y r e n e   v o l u m e v o l u m e   o f   a   m i c r o s p h e r e
V o l u m e   o f   a   m i c r o s p h e r e = 1 6 π d 3
P o l y s t y r e n e   v o l u m e = W P
where W and P are the mass and density of polystyrene, respectively. Using Equations (11) and (12) in Equation (10), and if the mass is expressed in grams and the density in g/mL, Equation (13) can be used with the diameter of the microspheres (d) in μm.
N = 6 W π d 3 P 10 12
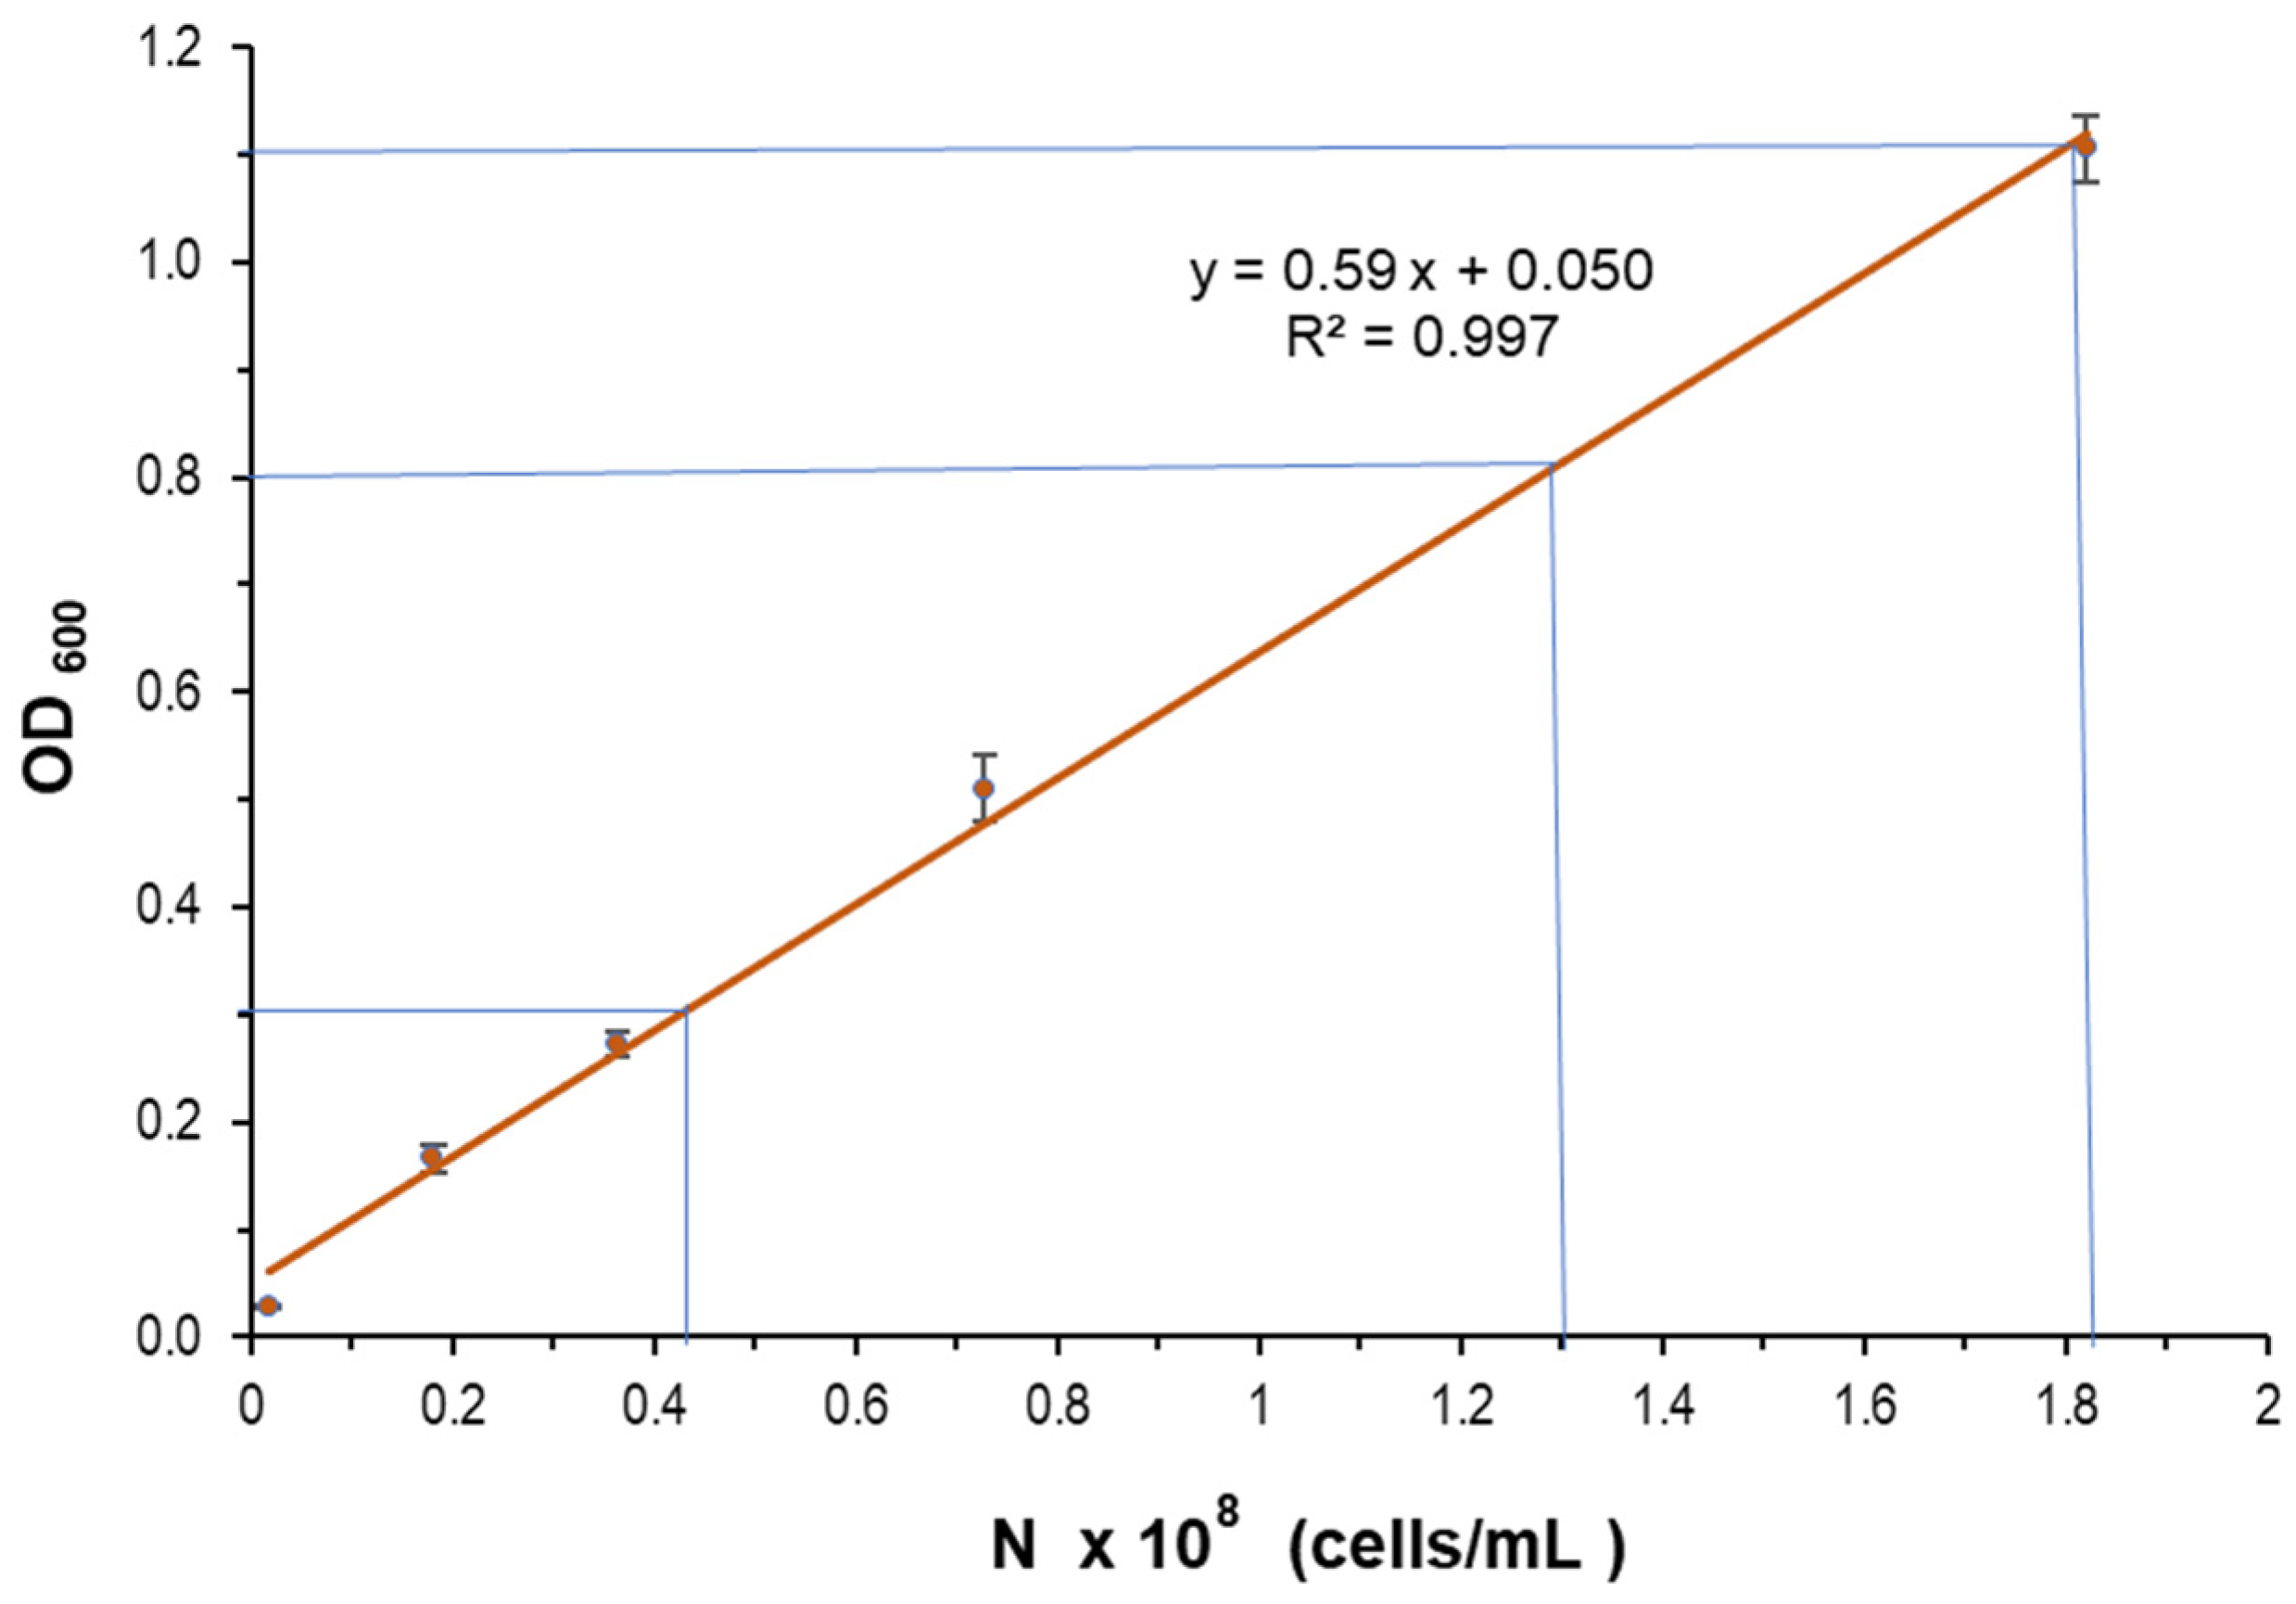
The number of cells (N) for different values of OD600nm was calculated with the calibration line recorded in Figure 4, in accordance with the method of serial dilution of polystyrene microspheres described by Beal et al. [43] and Stevenson et al. [44]. The restrictions of this method are related to the size of the bacteria, which has to be approximated to the size of the microspheres (1.0 μm), and the index of refraction of the solution used (MSM), which has to be the same as used in the bioreactors [44]. This method has been validated and recommended because of the highest precise calibration for a robust estimation of the bacterial cell count, when the size of the cells is in the order of the wavelength, for approximately 1.0 μm cells and OD600 nm [43]. The non-spherical shape of the scatterers (cells) has been cited to produce a deviation from the polystyrene microspheres calibration line, especially for high cell concentration and OD values, when the calibration line loses linearity [44]. In this work, the estimation of the number of cells following this method was always performed below OD600 = 1.1 (Table 2), that is, inside the linear range (Figure 4).

4.3. Projected Area of the Cells

The projected area of the cells (Table 2) can be calculated as a circular area for the measured diameter of the cell (Figure 5). P. putida, a coccus-shaped strain (Figure 6), has been considered a spherical bacteria in terms of its shape, and the bacilli-shaped bacteria B. licheniformis and P. glucanolyticus have been considered spheroids with longitudinal (long) and transversal (short) axes. In the case of these two strains, the projected area in Table 2 has been calculated using the average diameter in between the values of the two axes (long and short diameters, Figure 6).

4.4. Mass Transfer Coefficients

The critical time estimation (Figure 3) relates to the calculation of the mass transfer coefficients (kL α) in Equation (9), as recorded in Table 2, which are dependent on the kinetic and mass transfer parameters, in accordance with this equation. The values obtained are one order of magnitude lower than the values obtained for the biodegradation of an individual alkane by oleophilic bacteria (kL α = 4.8–10.8 × 10⁻³ m/d in [39]).
Because the mass transfer coefficients (kL α) are calculated for the critical time at which the kinetics and mass transfer are equaled, in Equation (9), the value obtained (Table 2) is especially dependent on the kinetic coefficient (k), oil concentration gradient (StcSc) and area of the cell (Ac). We can conclude that the highest mass transfer means the highest kinetics, or in other words, crude oil is degraded by the enzymatic system (kinetics) when it flows easily from the oil drop to the cell. The highest biodegradation kinetic coefficients are related to an easy mass transfer (B. licheniformis has the highest kinetic coefficient and highest kL α). This situation leads to the reduction in the oil concentration due to being degraded, and the gradient between the oil phase and the cell is reduced.
The size of the cells affects the mass transfer in two ways: the higher projected area (Ac) and the lower mass transfer coefficients (kL α), and this has to be understood because for big cells, the contact points between oil drops and cells are reduced in number, so the overall effective area for mass transfer is been reduced. On the other hand, big cells mean a lower number of individuals, a lower N value, which increases the value of kL α in Equation (9).
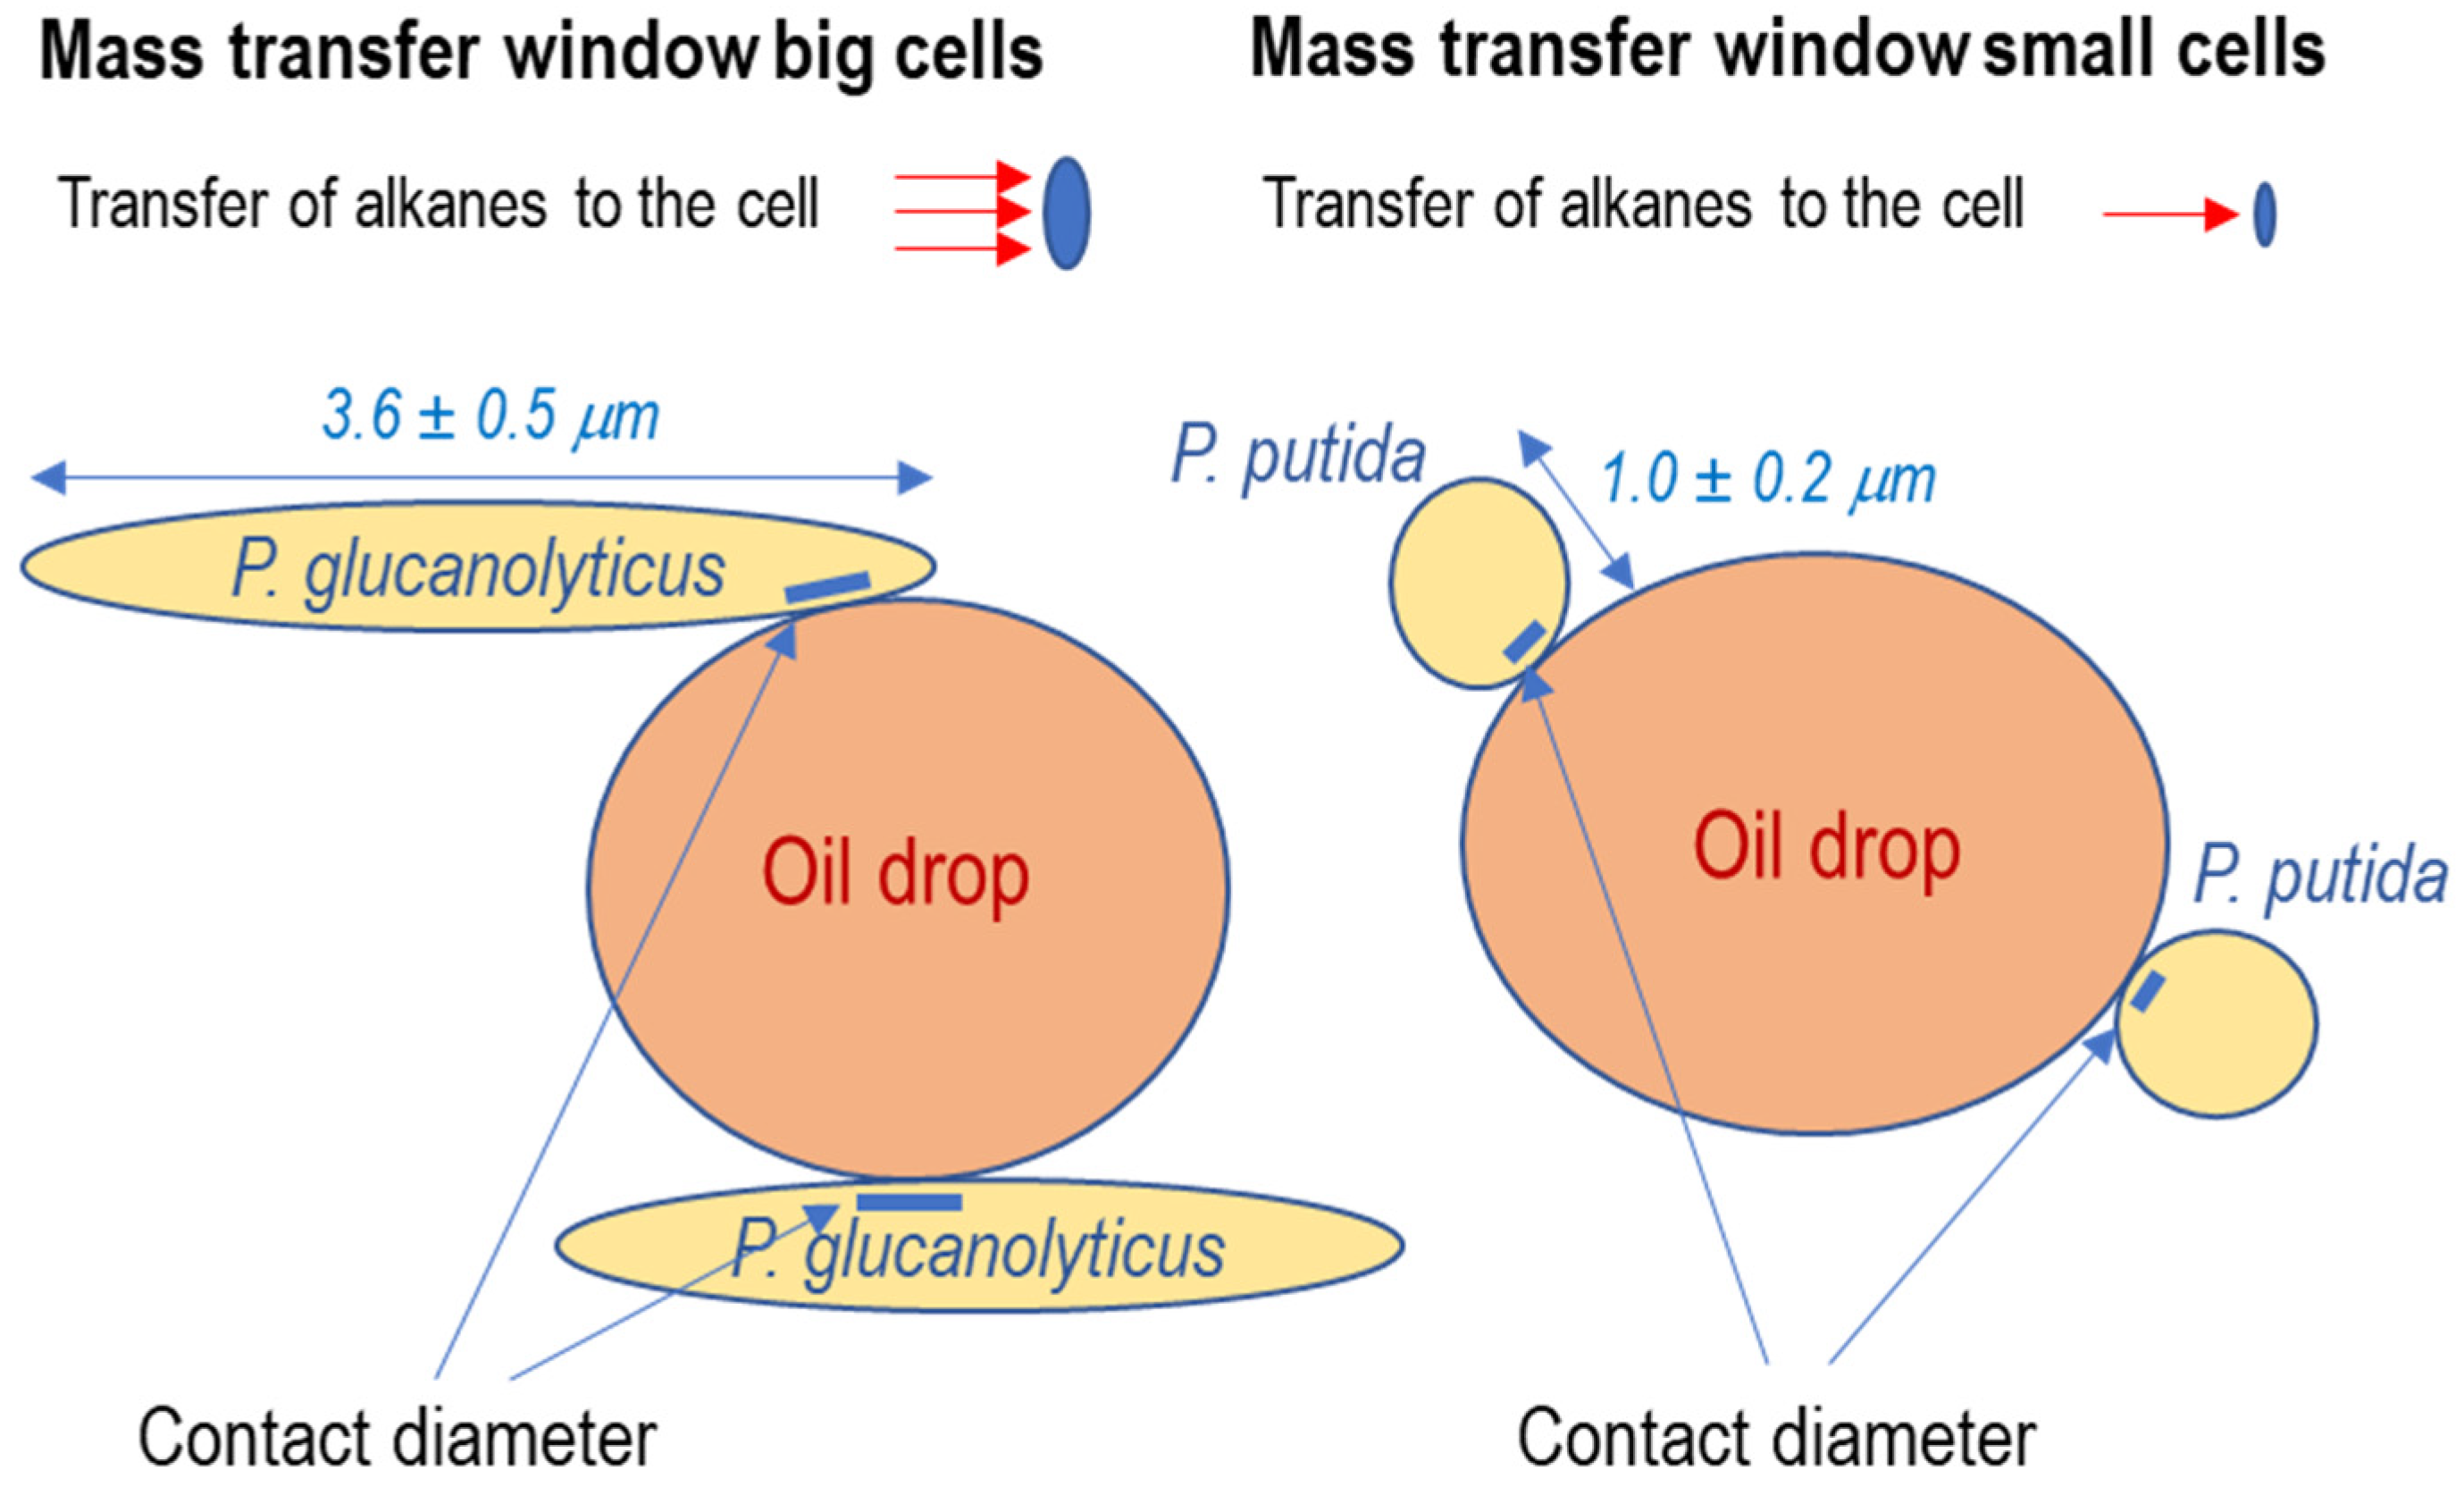
In P. glucanolyticus biodegradation of crude oil, these big bacilli-shaped cells (d = 3.6 μm) exhibit higher mass transfer coefficients in Table 2 compared to P. putida, a small coccus-shaped strain (d = 1.0 μm), and the difference in the mass transfer parameters (Equation (9)) between both strains is the number of cells, which is much lower for big cells (P. glucanolyticus, Table 2). But the question is how can it be understood that a bigger projected area increases the mass transfer coefficient, and at the same time, the number of cells is reduced? In other words, mass transfer could be better for a lower number of big cells. We attribute this fact, as reflected in Table 2 for a comparison of the mass transfer coefficients in the strains P. putida and P. glucanolyticus, to the increase in the effective area for mass transfer in big cells, because bigger spheroids in contact have a higher contact area, which generates a bigger window for alkanes transport (Figure 7).

4.5. Future Research

The mechanism proposed in this article is a novel approach for crude oil biodegradation by oleophilic bacteria, which is based on transport and kinetic considerations for individual hydrocarbon biodegradation [32,39]. At the moment, to follow the alkane concentrations inside the cell does not seem to be possible, but to search and prove the role of different oleophilic bacteria and to measure the kinetic coefficients and mass transport parameters could elucidate and support the statements we propose here, especially related to the size of the cell, which favors mass transport.
In the bioremediation of crude oil spills, a proper selection of the oleophilic strain attending to the oleotropic potential (kinetic coefficients and mass transport parameters) could be the key step in the successful removal of the pollutant. Deeper research is needed at a laboratory scale with different oil-degrading bacteria and measurements of the kinetic and mass transfer parameters related to the morphology of the cells.
Geometric considerations about the shape of the cells (spheres or ellipsoids) could be investigated and considered for a better understanding of the mass transport, especially at the border of the cell wall, at the limit between the oil drop and the cell. An interesting unexplored field can be opened in this direction.

5. Conclusions

Due to the insolubility of crude oil in water, the biodegradation by oleophilic bacteria has to be considered by contact between oil drops and cells. The mass transfer of alkanes present in crude oil is conducted from the oil drop to the cell due to the concentration gradient between the oil phase and the interior of the cell.
For the calculation of the mass transfer coefficients (kL α), the critical time, at which the kinetics and mass transfer are equaled, is fixed when the activity of the microorganisms in substrate removal and biomass growth starts. After measuring the cell dimensions and number of cells by simulation with polystyrene microspheres and studying the differences in three oleophilic bacteria, we can conclude that the mass transfer coefficients and kinetic coefficient have the same tendency (comparison between Bacillus licheniformis with Pseudomonas putida and Paenibacillus glucanolyticus). This assumption, which can sound obvious, has to be quantified and understood in the opposite direction: if mass transfer is favored, the biodegradation kinetics will be higher and also higher will be the observed kinetic coefficient.
With respect to the size of the cells, which is represented as the projected area (Ac) and the number of cells (N) in the denominator of Equation (9) for the mass transfer coefficients calculation, we observed, by comparison between P. putida and P. glucanolyticus, that bigger cells (less number) produce a higher value in terms of the mass transfer coefficients. The interpretation of this fact is related to the mass transport window formed by the oil–cell contact area, which increases with the size of the cells and favors the transport of alkanes to the cell for being degraded.

Author Contributions

Conceptualization and design of the study, supervision, project administration, funding, software, writing—original draft preparation, writing—review and editing, formal analysis and validation, C.C. Investigation and data curation, N.M. All authors have read and agreed to the published version of the manuscript.

Funding

This study was financed by the University of Salamanca, C1 Financial Program 2021, Project 18.KA.5N.

Data Availability Statement

All data used are reported in the manuscript.

Acknowledgments

We thank Alejandro Llanos from REPSOL SA for his assistance in providing the crude oil and physical properties. César Raposo from GC-MS Laboratory of Chemical Analysis (NUCLEUS) of the University of Salamanca is also acknowledged for the characterization and interpretation of the composition of Arab Light. We are grateful to Milena A. Vega for the assistance with the GC-FID calibration and analysis. Maria del Carmen Macián, José Miguel López and Amparo Ruvira from CECT, University of Valencia, are gratefully acknowledged for their assistance with the identification and deposit of the pure cultures of the oleophilic strains in the Spanish Type Culture Collection (CECT).

Conflicts of Interest

The authors declare no conflicts of interest.

Abbreviations

Acronyms
AlkHalkane hydroxylase
DCMdichloromethane
MSMmineral salt medium
TPHtotal petroleum hydrocarbons
Variables
Acprojected area of the cell (m2)
ddiameter of the cell (μm)
Jsmass flux (g/m2d)
kkinetic coefficient (d−1)
kLpermeability coefficient (m/d)
Nnumber of cells for a unit volume of the bioreactor (cell/m3)
Ppolystyrene microspheres density (g/mL)
rdegradation rate (g/Ld)
rTPHdegradation rate of TPH (g/Ld)
Ssubstrate concentration in the oil phase (g/L)
Stcsubstrate concentration in the oil phase at the critical time (g/L)
Scsubstrate concentration inside the cell (outer side of the inner membrane) (g/L)
Soinitial substrate concentration in the oil phase (g/L)
ttime (d)
tccritical time, at which the kinetics and mass transport are in balance (d)
Vbioreactor volume (m3)
Wpolystyrene microspheres mass (g)
Greek letters
αfraction of the contact area related to the projected area of the cell

References

  1. Atlas, R.M. Microbial degradation of petroleum hydrocarbons: An environmental perspective. Microbiol. Rev. 1981, 45, 180–209. [Google Scholar] [CrossRef] [PubMed]
  2. Atlas, R.M.; Hazen, T.C. Oil biodegradation and bioremediation: A tale of the two worst spills in U.S. history. Environ. Sci. Technol. 2011, 45, 6709–6715. [Google Scholar] [CrossRef] [PubMed]
  3. Abbasian, F.; Lockington, R.; Mallavarapu, M.; Naidu, R. A comprehensive review of aliphatic hydrocarbon biodegradation by bacteria. Appl. Biochem. Biotechnol. 2015, 176, 670–699. [Google Scholar] [CrossRef] [PubMed]
  4. Morikawa, M. Dioxygen activation responsible for oxidation of aliphatic and aromatic hydrocarbon compounds: Current state and variants. Appl. Microbiol. Biotechnol. 2010, 87, 1595–1603. [Google Scholar] [CrossRef]
  5. Urlacher, V.B.; Girhard, M. Cytochrome P450 monooxygenases: An update on perspectives for synthetic application. Trends Biotechnol. 2012, 30, 26–36. [Google Scholar] [CrossRef] [PubMed]
  6. Van Beilen, J.B.; Funhoff, E.G. Alkane hydroxylases involved in microbial alkane degradation. Appl. Microbiol. Biotechnol. 2007, 74, 13–21. [Google Scholar] [CrossRef] [PubMed]
  7. Al-Hawash, A.B.; Dragh, M.A.; Li, S.; Alhujaily, A.; Abbood, H.A.; Zhang, X.; Ma, F. Principles of microbial degradation of petroleum hydrocarbons in the environment. Egypt. J. Aquat. Res. 2018, 44, 71–76. [Google Scholar] [CrossRef]
  8. Gricman, Ł.; Vogel, C.; Pleiss, J. Conservation analysis of class-specific positions in cytochrome P450 monooxygenases: Functional and structural relevance. Proteins 2014, 82, 491–504. [Google Scholar] [CrossRef]
  9. Viggor, S.; Jöesaar, M.; Vedler, E.; Kiiker, R.; Pärnpuu, L.; Heinaru, A. Occurrence of diverse alkane hydroxylase alkB genes in indigenous oil-degrading bacteria of Baltic Sea surface water. Marine Pollut. Bull. 2015, 101, 507–516. [Google Scholar] [CrossRef]
  10. Xu, N.; Bao, M.; Sun, P.; Li, Y. Study on bioadsorption and biodegradation of petroleum hydrocarbons by a microbial consortium. Bioresour. Technol. 2013, 149, 22–30. [Google Scholar] [CrossRef]
  11. Meng, L.; Li, H.; Bao, M.; Sun, P. Metabolic pathway for a new strain Pseudomonas synxantha LSH-7’: From chemotaxis to uptake of n-hexadecane. Sci. Rep. 2017, 7, 39068. [Google Scholar] [CrossRef] [PubMed]
  12. Ladygina, N.; Dedyukhina, E.; Vainshtein, M. A review on microbial synthesis of hydrocarbons. Proc. Biochem. 2006, 41, 1001–1014. [Google Scholar] [CrossRef]
  13. Rojo, F. Degradation of alkanes by bacteria. Environ. Microbiol. 2009, 11, 2477–2490. [Google Scholar] [CrossRef]
  14. Sajna, K.V.; Sukumaran, R.K.; Gottumukkala, L.D.; Pandey, A. Crude oil biodegradation aided by biosurfactants from Pseudozyma sp. NII 08165 or its culture broth. Bioresour. Technol. 2015, 191, 133–139. [Google Scholar] [CrossRef]
  15. Zhang, Z.; Hou, Z.; Yang, C.; Ma, C.; Tao, F.; Xu, P. Degradation of n-alkanes and polycyclic aromatic hydrocarbons in petroleum by a newly isolated Pseudomonas aeruginosa DQ8. Bioresour. Technol. 2011, 102, 4111–4116. [Google Scholar] [CrossRef] [PubMed]
  16. Varjani, S.J. Microbial degradation of petroleum hydrocarbons. Bioresour. Technol. 2017, 223, 277–286. [Google Scholar] [CrossRef] [PubMed]
  17. Das, N.; Chandran, P. Microbial degradation of petroleum hydrocarbon contaminants: An overview. Biotechnol. Res. Int. 2011, 2011, 1–13. [Google Scholar] [CrossRef] [PubMed]
  18. Paisse, S.; Duran, R.; Coulon, F.; Goñi-Urriza, M. Are alkane hydroxylase genes (alkB) relevant to assess petroleum bioremediation processes in chronically polluted coastal sediments? Appl. Microbiol. Biotechnol. 2011, 92, 835–844. [Google Scholar] [CrossRef] [PubMed]
  19. Pi, Y.-R.; Bao, M.-T. Investigation of kinetics in bioaugmentation of crude oil via high-throughput sequencing: Enzymatic activities, bacterial community composition and functions. Pet. Sci. 2022, 19, 1905–1914. [Google Scholar] [CrossRef]
  20. Van Beilen, J.B.; Wubbolts, M.G.; Witholt, B. Genetics of alkane oxidation by Pseudomonas oleovorans. Biodegradation 1994, 5, 161–174. [Google Scholar] [CrossRef]
  21. Chandra, S.; Sharma, R.; Singh, K.; Sharma, A. Application of bioremediation technology in the environment contaminated with petroleum hydrocarbon. Ann. Microbiol. 2013, 63, 417–431. [Google Scholar] [CrossRef]
  22. Kumari, B.; Singh, S.N.; Singh, D.P. Characterization of two biosurfactant producing strains in crude oil degradation. Proc. Biochem. 2012, 47, 2463–2471. [Google Scholar] [CrossRef]
  23. Liu, Y.; Wan, Y.Y.; Wang, C.; Ma, Z.; Liu, X.; Li, S. Biodegradation of n-alkanes in crude oil by three identified bacterial strains. Fuel 2020, 275, 117897. [Google Scholar] [CrossRef]
  24. Ron, E.Z.; Rosenberg, E. Enhanced bioremediation of oil spills in the sea. Curr. Opin. Biotechnol. 2014, 27, 191–194. [Google Scholar] [CrossRef]
  25. Xia, M.; Fu, D.; Chakraborty, R.; Singh, R.P.; Terry, N. Enhanced crude oil depletion by constructed bacterial consortium comprising bioemulsifier producer and petroleum hydrocarbon degraders. Bioresour. Technol. 2019, 282, 456–463. [Google Scholar] [CrossRef]
  26. Varjani, S.J.; Upasani, V.N. Carbon spectrum utilization by an indigenous strain of Pseudomonas aeruginosa NCIM 5514: Production, characterization and surface active properties of biosurfactant. Bioresour. Technol. 2016, 221, 510–516. [Google Scholar] [CrossRef] [PubMed]
  27. Zhao, F.; Zhou, J.-D.; Ma, F.; Shi, R.-J.; Han, S.-Q.; Zhang, J.; Zhang, Y. Simultaneous inhibition of sulfate-reducing bacteria, removal of H2S and production of rhamnolipid by recombinant Pseudomonas stutzeri Rhl: Applications for microbial enhanced oil recovery. Bioresour. Technol. 2016, 207, 24–30. [Google Scholar] [CrossRef]
  28. Abdullah, S.R.S.; Al-Baldawi, I.A.; Almansoory, A.F.; Purwanti, I.F.; Al-Sbani, N.H.; Sharuddin, S.S.N. Plant-assisted remediation of hydrocarbons in water and soil: Application, mechanisms, challenges and opportunities. Chemosphere 2020, 247, 125932. [Google Scholar] [CrossRef] [PubMed]
  29. Cerqueira, V.S.; Hollenbach, E.B.; Maboni, F.; Vainstein, M.; Camargo, F.; Do-Carmo, R.P.M.; Bento, F.M. Biodegradation potential of oily sludge by pure and mixed bacterial cultures. Bioresour. Technol. 2011, 102, 11003–11010. [Google Scholar] [CrossRef]
  30. Kavitha, V.; Mandal, A.B.; Gnanamani, A. Microbial biosurfactant mediated removal and/or solubilization of crude oil contamination from soil and aqueous phase: An approach with Bacillus licheniformis MTCC 5514. Int. Biodeterior. Biodegrad. 2014, 94, 24–30. [Google Scholar] [CrossRef]
  31. Nievas, M.L.; Commendatore, M.G.; Esteves, J.L.; Bucalá, V. Biodegradation pattern of hydrocarbons from a fuel oil-type complex residue by an emulsifier-producing microbial consortium. J. Hazard. Mat. 2008, 154, 96–104. [Google Scholar] [CrossRef] [PubMed]
  32. Shi, K.; Xue, J.; Xiao, X.; Qiao, Y.; Wu, Y.; Gao, Y. Mechanism of Degrading Petroleum Hydrocarbons by Compound Marine Petroleum-Degrading Bacteria: Surface Adsorption, Cell Uptake, and Biodegradation. Energy Fuels 2019, 33, 11373–11379. [Google Scholar] [CrossRef]
  33. Wang, X.B.; Chi, C.Q.; Nie, Y.; Tang, Y.Q.; Tan, Y.; Wu, G.; Wu, X.L. Degradation of petroleum hydrocarbons (C6–C40) and crude oil by a novel Dietzia strain. Bioresour. Technol. 2011, 102, 7755–7761. [Google Scholar] [CrossRef] [PubMed]
  34. Arora, P.K.; Bae, H. Biotransformation and chemotaxis of 4-chloro-2-nitrophenol by Pseudomonas sp. JHN. Microbial Cell Factories 2014, 13, 110. [Google Scholar] [CrossRef] [PubMed]
  35. Costa, C.; Santos, A.; Vega, M.A. Kinetics of Arab Light crude oil degradation by Pseudomonas and Bacillus strains. Water 2022, 14, 3802. [Google Scholar] [CrossRef]
  36. Yudono, B.; Said, M.; Sabaruddin; Napoleon, A.; Fanani, Z. Kinetics Approach of Biodegradation of Petroleum Contaminated Soil by using Indigenous Isolated Bacteria. J. Trop. Soils 2011, 16, 33–38. [Google Scholar] [CrossRef]
  37. Roy, A.S.; Baruah, R.; Borah, M.; Singh, A.K.; Deka Boruah, H.P.; Saikia, N.; Deka, M.; Dutta, N.; Bora, T.C. Bioremediation potential of native hydrocarbon degrading bacterial strains in crude oil contaminated soil under microcosm study. Int. Biodeter. Biodegr. 2014, 94, 79–89. [Google Scholar] [CrossRef]
  38. Varjani, S.J.; Rana, D.P.; Jain, A.K.; Bateja, S.; Upasani, V.N. Synergistic ex-situ biodegradation of crude oil by halotolerant bacterial consortium of indigenous strains isolated from on shore sites of Gujarat, India. Int. Biodeter. Biodegr. 2015, 103, 116–124. [Google Scholar] [CrossRef]
  39. Choi, D.H.; Hori, K.; Tanji, Y.; Unno, H. Microbial degradation kinetics of solid alkane dissolved in nondegradable oil phase. Biochem. Eng. J. 1999, 3, 71–78. [Google Scholar] [CrossRef]
  40. Xu, X.; Liu, W.; Tian, S.; Wang, W.; Qi, Q.; Jiang, P.; Gao, X.; Li, H.; Yu, H. Petroleum hydrocarbon-degrading bacteria for the remediation of oil pollution under aerobic conditions: A perspective analysis. Front. Microbiol. 2015, 9, 2885. [Google Scholar] [CrossRef]
  41. Zheng, M.; Wang, W.; Hayes, M.; Nydell, A.; Tarr, M.A.; Van Bael, S.A.; Papadopoulos, K. Degradation of Macondo 252 oil by endophytic Pseudomonas putida. J. Environ. Chem. Eng. 2018, 6, 643–648. [Google Scholar] [CrossRef]
  42. Chettri, B.; Mukherjee, A.; Langpoklakpam, J.S.; Chattopadhyay, D.; Singh, A.K. Kinetics of nutrient enhanced crude oil degradation by Pseudomonas aeruginosa AKS1 and Bacillus sp. AKS2 isolated from Guwahati refinery, India. Environ. Pollut. 2016, 216, 548–558. [Google Scholar] [CrossRef]
  43. Beal, J.; Farny, N.G.; Haddock-Angelli, T.; Selvarajah, V.; Baldwin, G.S.; Buckley-Taylor, R.; Gershater, M.; Kiga, D.; Marken, J.; Sanchania, V.; et al. Robust estimation of bacterial cell count from optical density. Commun. Biol. 2020, 3, 512. [Google Scholar] [CrossRef] [PubMed]
  44. Stevenson, K.; McVey, A.F.; Clark, I.B.N.; Swain, P.S.; Pilizota, T. General calibration of microbial growth in microplate readers. Sci. Rep. 2016, 6, 38828. [Google Scholar] [CrossRef] [PubMed]
  45. Hajieghrari, M.; Hejazi, P. Enhanced biodegradation of n-Hexadecane in solid-phase of soil by employing immobilized Pseudomonas aeruginosa on size-optimized coconut fibers. J. Hazard. Mat. 2020, 389, 122134. [Google Scholar] [CrossRef]
  46. Sharma, S.; Pandey., L.M. Biodegradation kinetics of binary mixture of hexadecane and phenanthrene by the bacterial microconsortium. Bioresour. Technol. 2022, 358, 127408. [Google Scholar] [CrossRef]
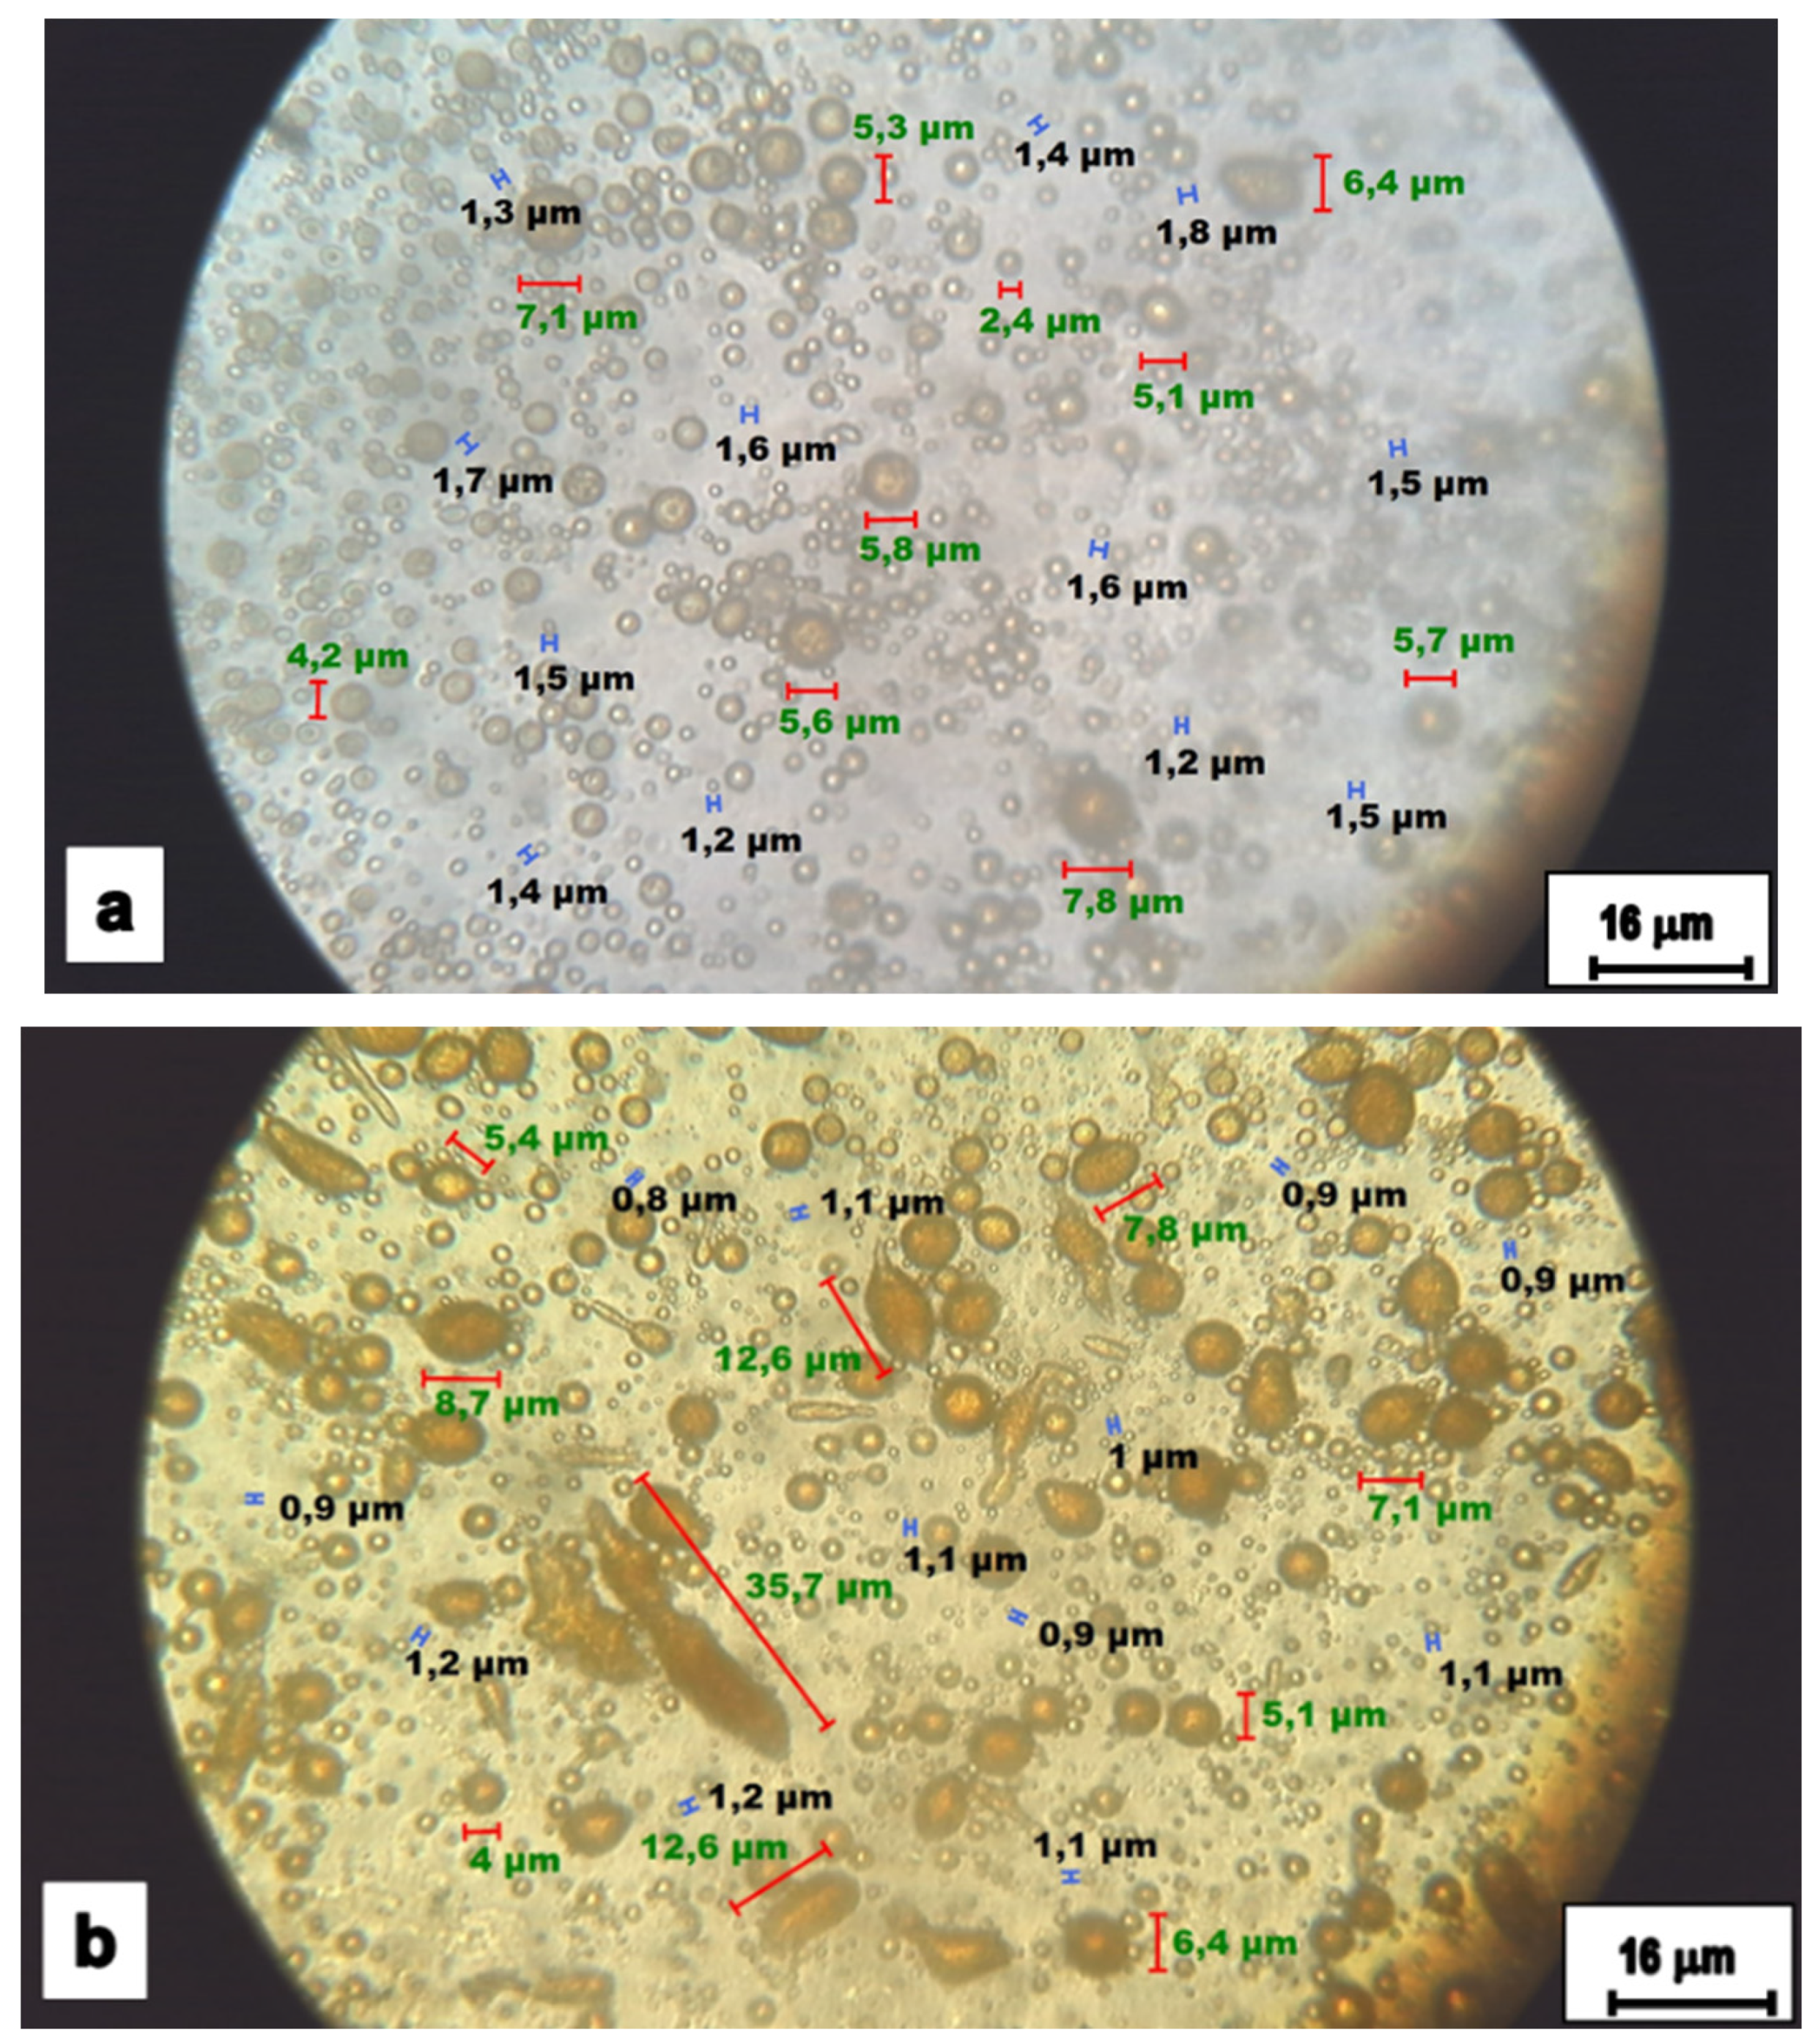
Figure 1. Optical microphotographs (Leica DM 1000) taken at 100× of the bioreactor samples after the growth of two cultures of oil-degrading bacteria (15 days of cultivation at 30 °C and 900 rpm). (a) Bacillus licheniformis CECT 20 and (b) Pseudomonas putida CECT 31060. Blue bars represent bacteria measured in size (B. licheniformis 1.2–1.8 μm and P. putida 0.8–1.2 μm) and red bars represent the size of the biggest oil drops (2.4–35.7 μm).
Water 16 01653 g001
Figure 2. Schematic figure of a bacterial cell and an oil drop, showing the substrate concentration gradient between the oil phase (S) and the cell (Sc) and the contact area of the cell for mass transport (based on Choi et al. [39]). In the right part of the figure, amplified microphotographs from the bioreactor (Figure 1b, P. putida) show how the cells tend to adhere to oil drops.
Water 16 01653 g002
Figure 3. Kinetics of oil degraders in the bioreactors (blue lines TPHC7–C25 and red lines OD600) and critical time estimation for the obtention of crude oil concentration under critical time conditions (Stc, Table 1): (a) B. licheniformis, (b) P. putida, (c) P. glucanolyticus and (d) control experiment for TPHC7–C25 and OD600. Error bars are SDs for samples analyzed in duplicate (crude oil concentration, TPHC7–C25) and triplicate (OD600). Green straight lines reflect the fixation of the critical time at 3 days of incubation and the values obtained for Stc (left axis) and OD600nm (right axis).
Water 16 01653 g003
Figure 4. Calibration of polystyrene microspheres (1.0 μm, 10% solid content and density 1.05 g/mL, Sigma-Aldrich) for the calculation of the number of cells (N) in accordance with the method described by Beal et al. [43] and Stevenson et al. [44] and Equation (13). Error bars represent SDs for three independent measurements.
Water 16 01653 g004
Figure 5. Cell size measured by optical microscopy at 100x in suspensions of pure cultures of oil-degrading bacteria (10 measurements, mean ± SD): (a) B. licheniformis: 1.5 ± 0.3 μm, (b) P. putida: 1.0 ± 0.2 μm and (c) P. glucanolyticus: 3.6 ± 0.5 μm.
Water 16 01653 g005
Figure 6. SEM microphotographs of the polystyrene 1.0 μm microspheres (a) and suspensions of pure cultures of oleophilic bacteria (bd). P. putida (b) is a coccus-shaped bacterium. The transversal axes of the cells (short diameter) were measured for the bacilli-shaped bacteria (7 measurements, mean ± SD): (c) B. licheniformis: 0.39 ± 0.04 μm, and (d) P. glucanolyticus: 0.40 ± 0.06 μm.
Water 16 01653 g006
Figure 7. Schematic representation of big cells (P. glucanolyticus) and small cells (P. putida) in contact with crude oil. The contact area (diameter) has been visualized as a function of the external area of the cell and the contact window for mass transfer is plotted in the upper part of the figure.
Water 16 01653 g007
Table 1. Kinetic parameters obtained from the biodegradation profiles of oleophilic bacteria (Figure 3). Kinetic coefficient (k), oil concentration for critical time (Stc) and residual oil concentration (Sc). The residual oil concentration (Sc) is assumed to be equal to the concentration inside the cell.
Oil-Degraderk (d−1)Stc (g/L)Sc (g/L)
B. licheniformis0.1064.70.2
P. putida0.0777.80.7
P. glucanolyticus0.0717.01.1
Table 2. Geometric parameters of the cells obtained from the microscopic measurements (Figure 4 and Figure 5) and mass transfer coefficients. Diameter of the cells (d), projected area of the cell (Ac), number of cells (N) and the group permeability coefficient x fraction of contact area (kL α) calculated by Equation (9).
Oil-Degraderd (μm) *Ac × 10−12 (m2) **N × 1014 (cells/m3)kL α (m/d)
B. licheniformis1.5 ± 0.3 (0.4)0.71 ± 0.091.30 (ABS600 = 0.8)1.60 × 10⁻³
P. putida1.0 ± 0.20.77 ± 0.041.83 (ABS600 = 1.1)5.25 × 10⁻⁴
P. glucanolyticus3.6 ± 0.5 (0.4)3.14 ± 0.250.43 (ABS600 = 0.3)6.19 × 10⁻⁴
Note(s): * the number in brackets is the short diameter of the cell (Figure 6). ** πd2/4, diameter of the cell (d) in Figure 5.
Disclaimer/Publisher’s Note: The statements, opinions and data contained in all publications are solely those of the individual author(s) and contributor(s) and not of MDPI and/or the editor(s). MDPI and/or the editor(s) disclaim responsibility for any injury to people or property resulting from any ideas, methods, instructions or products referred to in the content.