Abstract
Tea is an important economic crop worldwide, especially in Asian countries. However, tea cultivation requires substantial fertilizer use and may become a nutrient pollution source and affect water quality. This study presented two objectives: one was to estimate the pollution export coefficients of tea farms, and the other was to assess the performance of bioretention cells in terms of tea farm pollution control. This study employed a tea farm pollutant transport model (TPTM) and a watershed pollutant transport model (WPTM) to link watershed management goals and the tea farm control strategy. Field data collected for Jingualiao Creek in the Feitsui Reservoir watershed in Taipei, Taiwan, were analyzed. The resulting export coefficients for total phosphorus (TP), NH3-N, suspended solids (SS), and chemical oxygen demand (COD) were 2.55, 4.22, 768.39, and 145.71 kg/ha-y, respectively. Bioretention cells, which are low-impact development (LID) facilities and structural best management practices (BMPs), were installed and tested for their ability to reduce nonpoint source pollution. The field investigation and modeling results showed that 1 m2 of bioretention cells could reduce TP, NH3-N, SS, and COD by 18.6, 20.9, 5545.5, and 881.4 g/y, respectively. According to the WPTM results, 540 m2 of bioretention cells could achieve an 85% water quality attainment goal, and 715 m2 could reach 90% water quality attainment. Four tea farms covering 1.43 ha require 30.0 m2 of bioretention cells to achieve an 85% goal and 33.5 m2 to 90% goal. The export coefficients of tea nonpoint pollution sources presented in this study can serve as a valuable tool for estimating potential exported nutrients, and the field test results of bioretention cells are helpful information for policymakers in formulating effective watershed management measures.
1. Introduction
Population growth and economic development in or near rural areas have led to agricultural activities becoming significant contributors to water pollution, which can hinder regional economic development and challenge sustainable environmental management [1,2,3,4]. Although advancements in water pollution control strategies and technologies have resulted in the successful control and management of point source pollution, nonpoint source pollution remains a significant problem affecting our water environments [5,6]. Agricultural nonpoint source pollution is typically a widespread, decentralized, and stochastic phenomenon [7,8], and is thus challenging to address. Excessive application of fertilizers to increase agricultural yields has led to the accumulation of pollutants such as ammonia nitrogen, total phosphorus, and suspended solid particles on farmlands. When intense rainfall or other extreme weather events occur, many such pollutants can be washed from the land surface into rivers, lakes, and other water bodies, thereby posing a major threat to domestic water safety if not properly managed [9,10,11,12].
Tea (Camellia sinensis L.) is a valuable agricultural crop in Asia [13,14]. Taiwan, located in East Asia on the northwest side of the Pacific, has a subtropical climate characterized by high temperatures and abundant rainfall throughout the year. Demand for tea has increased recently owing to its widely recognized health benefits. The increase in demand has drawn attention to the environmental impact of pollution from tea farms [15,16]. Tea cultivation requires the use of a substantial amount of fertilizer [17,18] to meet yield and quality requirements. For example, the nitrogen fertilizer applied in a typical Japanese tea farm is 1000–2500 kg N per hectare per year [19] and the average N fertilizer applied in a Chinese tea farm is typically 533 kg N/ha-y, but could be up to 1200 kg N/ha-y [20]. Excessive fertilizer use, along with low plant utilization rates, can result in increased residual pollution in the soil and runoff [19,20].
A quantitative analysis of agricultural nonpoint source pollutant loads is an essential foundation for formulating rural watershed environmental management measures [21]. Because of the high variability of nonpoint source pollution, simulation modeling is widely employed [21,22]. Numerical models simulate the physical processes of pollutant generation, transport, transformation, and export under various given climate, environmental, and management scenarios. Commonly used models include the Storm Water Management Model (SWMM), Soil & Water Assessment Tool, and Hydrological Simulation Program–FORTRAN (HSPF) [23,24,25]. However, the effective application of these models in specific local settings requires extensive local data for parameter calibration and validation. By contrast, empirical models effectively simplify the complex processes of pollutant transport and transformation and are thus extensively used [26,27]. A classic example is the export coefficient model (ECM) developed by Johnes [28]. In this model, export coefficients represent the load of pollutants transmitted from a unit quantity of a pollution source. In the ECM, the exportation of nonpoint source pollutants is determined by using data on land use, pollutant types, atmospheric deposition, and rainfalls [28,29,30].
With the advantage of ease of use of ECM, many researchers have studied improving the original ECM to be more suitable for local applications. For example, Endreny and Wood [31] enhanced the ECM by incorporating the effects of runoff and vegetation into the model. Wu et al. [22] considered the impact of soil erosion. Furthermore, Lian et al. [32] combined the ECM with nitrogen transport models. Wang, Chen, and Shen [27] used export coefficients to establish the relationships between ECM and factors such as rainfall, slope, soil, and land use, thus yielding a dynamic ECM. Guo et al. [33] also adjusted the ECM by considering factors such as hydrology, water quality, rainfall, atmospheric deposition, livestock breeding, land use, and terrain. However, there has been no ECM specifically established for tea farms. Tea is an important economic crop and tea gardens are usually located in hills and upstream areas of rivers and reservoirs. In Taiwan, tea is extensively cultivated, and some tea plantations are located in water conservation areas. Therefore, assessing the effect of nonpoint source pollution from tea farms on watershed environments is crucial, and the tea ECM would be a useful tool for quantifying its potential pollution.
The Feitsui Reservoir supplies high-quality drinking water to more than six million people in Taipei City and New Taipei City. Pinglin is a city district in the Feitsui Reservoir watershed. It is surrounded by mountains and often enveloped in mist, creating an optimal environment for tea tree growth; thus, it is recognized as a “tea village”. More than 80% of domestic sewage in the reservoir’s watershed is collected and treated in wastewater treatment plants. Agricultural nonpoint source pollution, particularly from tea farms, largely remains uncontrolled and is a critical concern in this watershed [12]. In order to reduce nonpoint source pollution, bioretention cells have been applied at tea farms in the Feitsui Reservoir watershed [34,35,36,37]. Bioretention cells can capture surface runoff, and pollutants in the runoff are then reduced through various processes such as filtration, biological transformation, adsorption, and plant uptake, thus achieving water purification [38,39,40]. Although the control measure was applied and it was proved to effectively reduce pollution from the test farms, how they would work collectively for the entire watershed remains unknown. It is therefore very important to find out, for example, how many bioretention cells would be needed for water quality improvement at the watershed scale.
Therefore, the objective of this study was to establish the ECM as a useful quantitative tool to assess the nonpoint source pollution from tea farms and to develop a tea farm pollutant transport model (TPTM) and a watershed pollutant transport model (WPTM) to integrate the different scaled data for comparing management strategies. A tea farm with bioretention cells was studied to collect field data needed for validating the tea farm model. Meanwhile, a watershed model was validated with data collected at existing monitoring stations. By calculating the pollution export coefficients and evaluating the effectiveness of bioretention cells, the present study could determine the appropriate number and size of bioretention cells required for the effective management of both the watershed and tea farms. Therefore, the results of this study can be used by policymakers as a reference for decision-making when formulating non-point source pollution control in tea gardens or affected watersheds.
2. Materials and Methods
2.1. Study Flow Chart
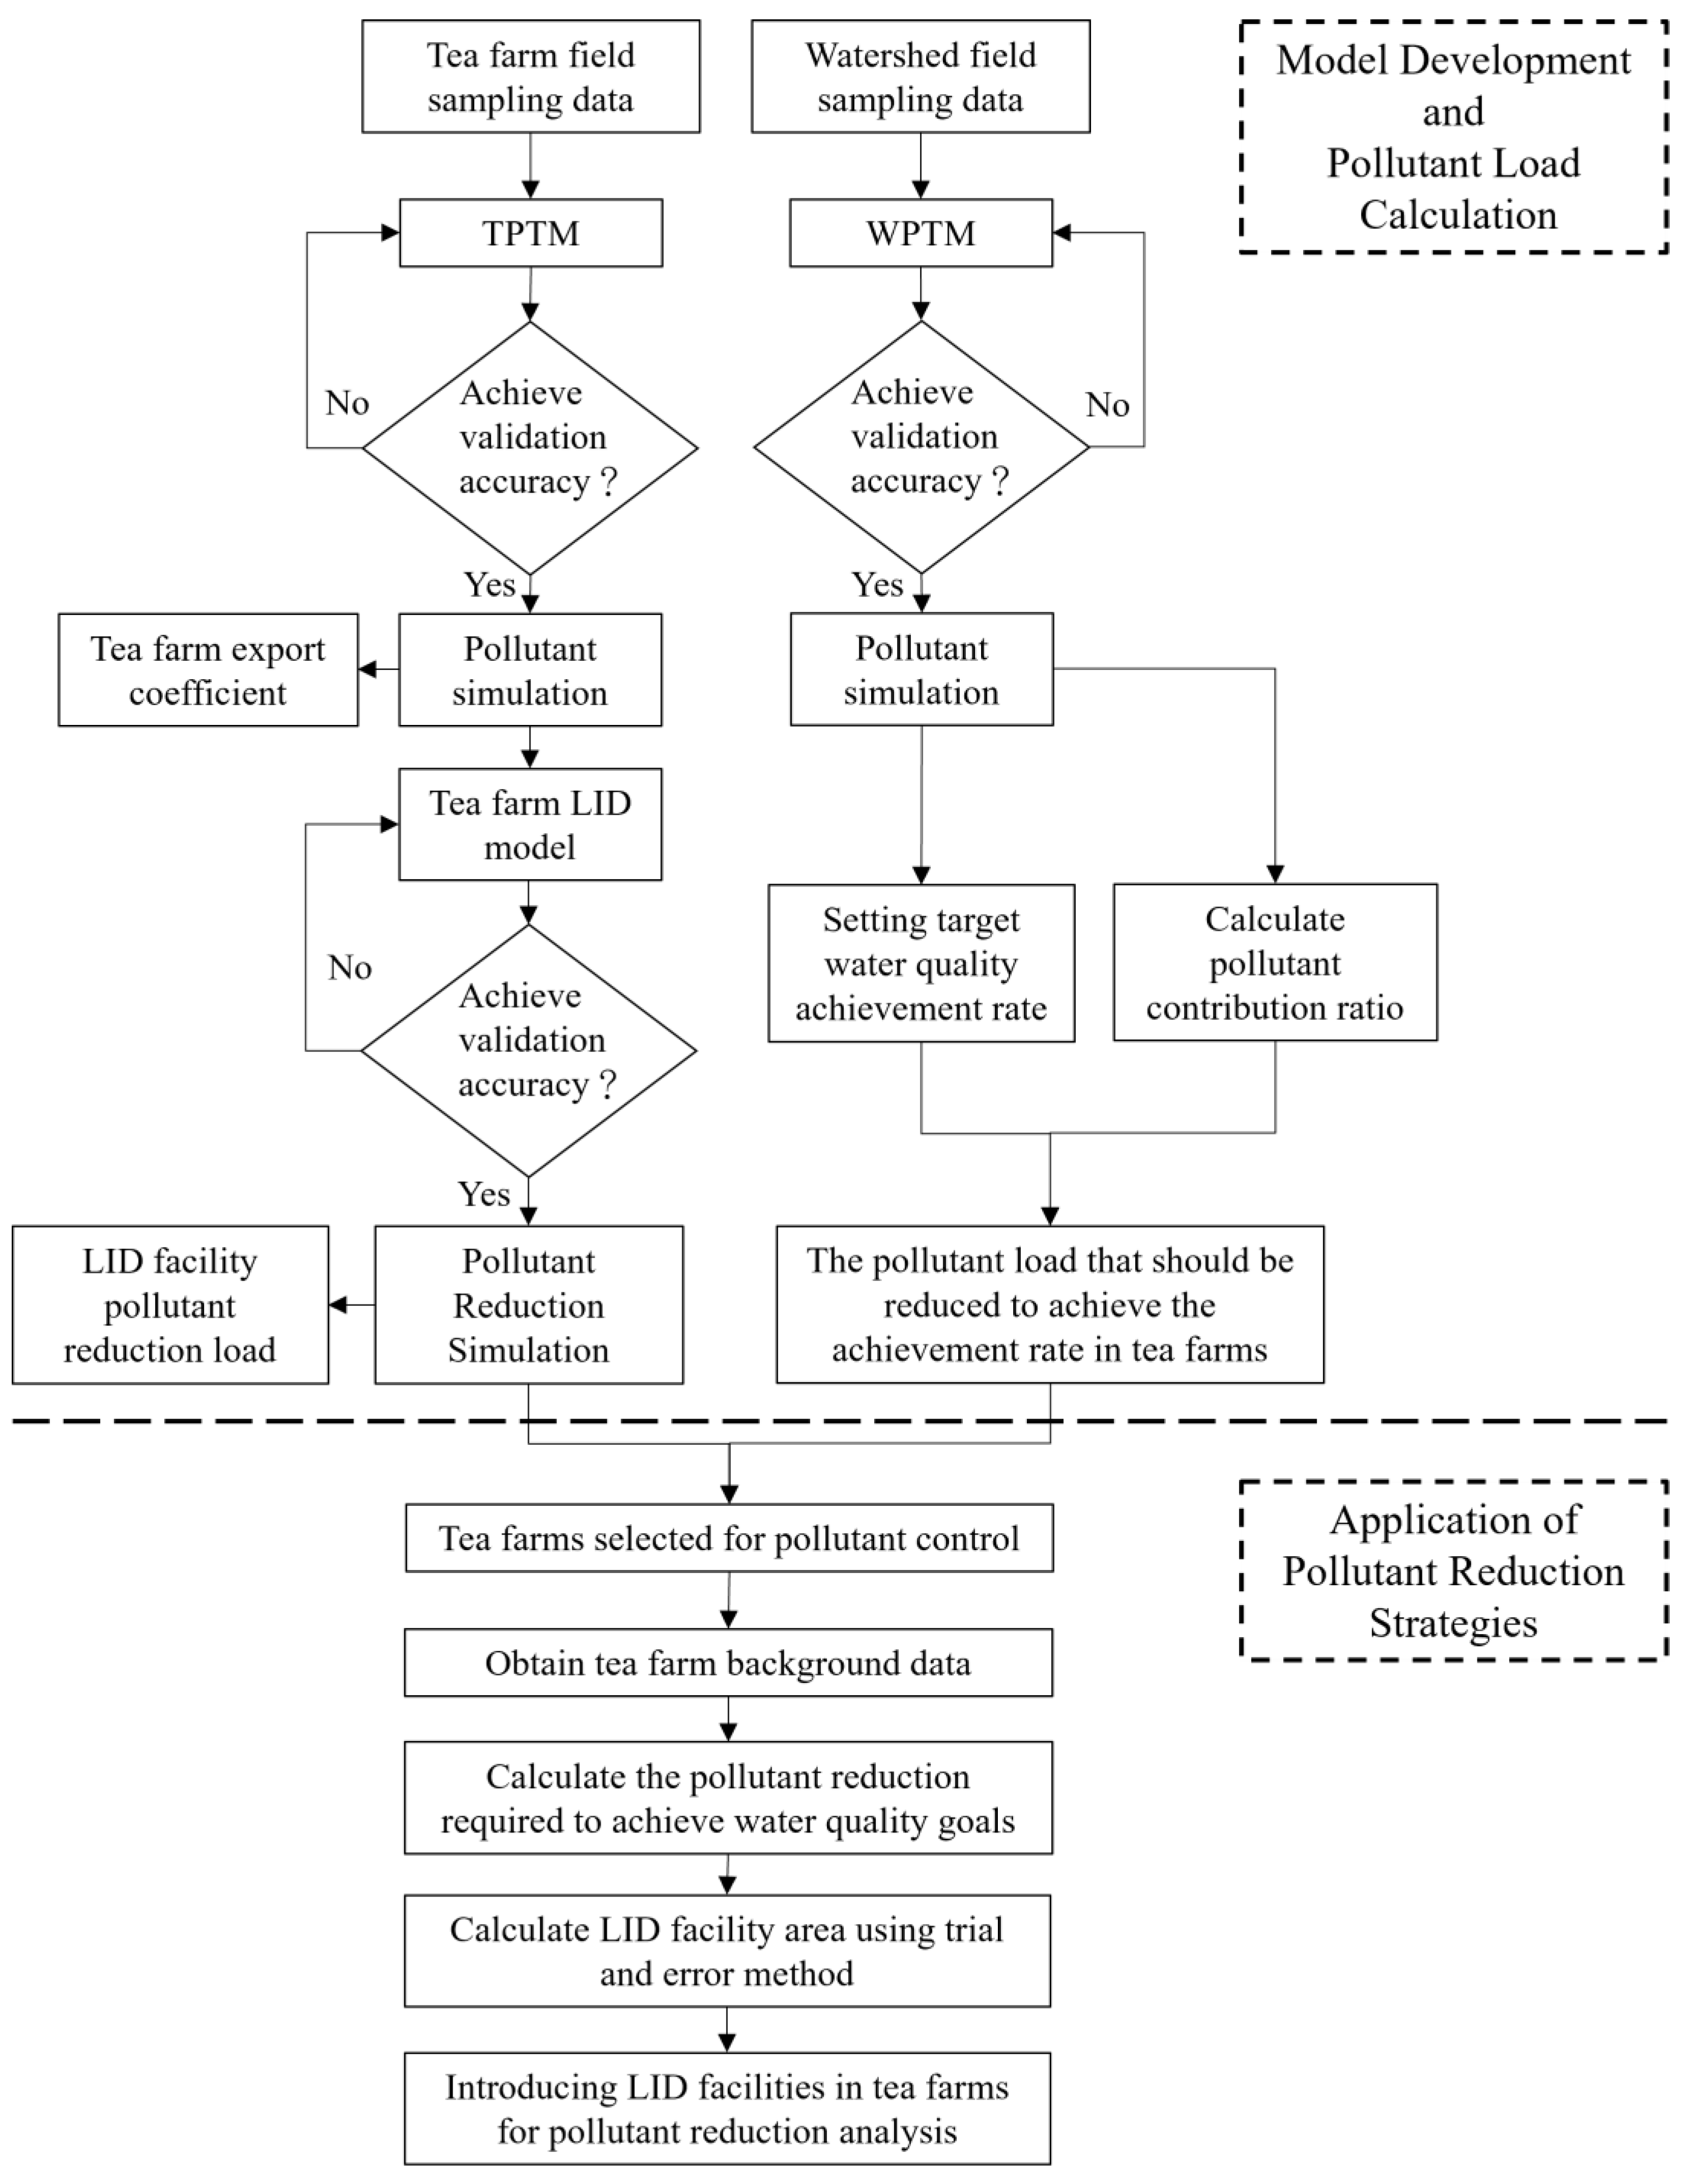
This study flow involved two stages: model development and pollutant load calculation, as well as the comparison of pollution reduction strategies. The first stage is to establish models and calculate pollutant loads. Two models were constructed using SWMM: the TPTM and WPTM. The TPTM is a site-scale model used to assess pollutant export coefficients based on field investigation data. The TPTM was enhanced by integrating a bioretention cell module to determine the pollution reduction ability contributed by a unit bioretention cell. The WTPM is the watershed scale model. It helps to decide the management goals, such as the required water quality standard or the water quality attainment rate. The second stage involved the application of pollutant reduction strategies. The quantitative results obtained from the WPTM and TPTM were used in a watershed case study and a tea farm case. Figure 1 illustrates a flowchart of the research process.
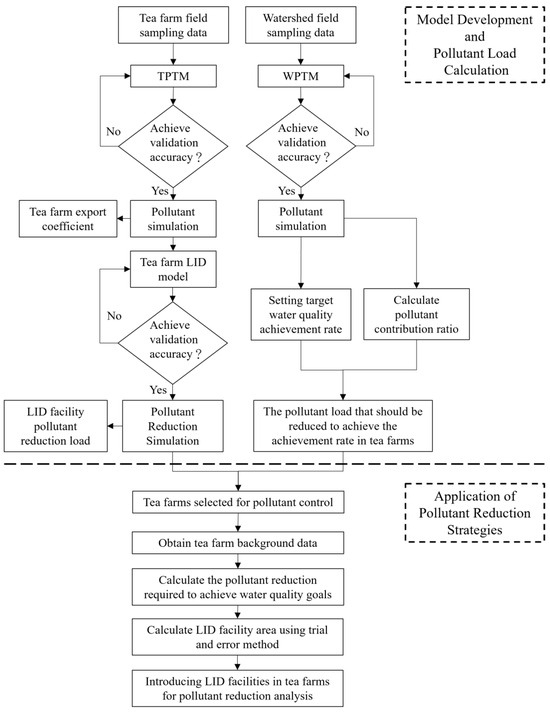
Figure 1.
Flowchart of the research process. The first phase involved model development and pollution load determination, in which the pollution export coefficients and bioretention reduction coefficients were obtained. The second phase involved determining the required area of bioretention cells for the watershed and tea farms to achieve water quality goals.
2.2. Case Study: Jingualiao Watershed
The watershed case study was conducted in the Jingualiao watershed, a sub-watershed within the Feitsui Reservoir catchment. The Feitsui Reservoir is located in northern Taiwan and serves as a primary drinking water source for approximately six million residents of Taipei City and New Taipei City. The area of the Feitsui reservoir watershed is 303 km2, and the reservoir has a total capacity of more than 400 million m3. The region experiences an average annual rainfall of 3500 mm, and the majority of this rainfall occurs from May to October, which is largely due to typhoons during the summer months.
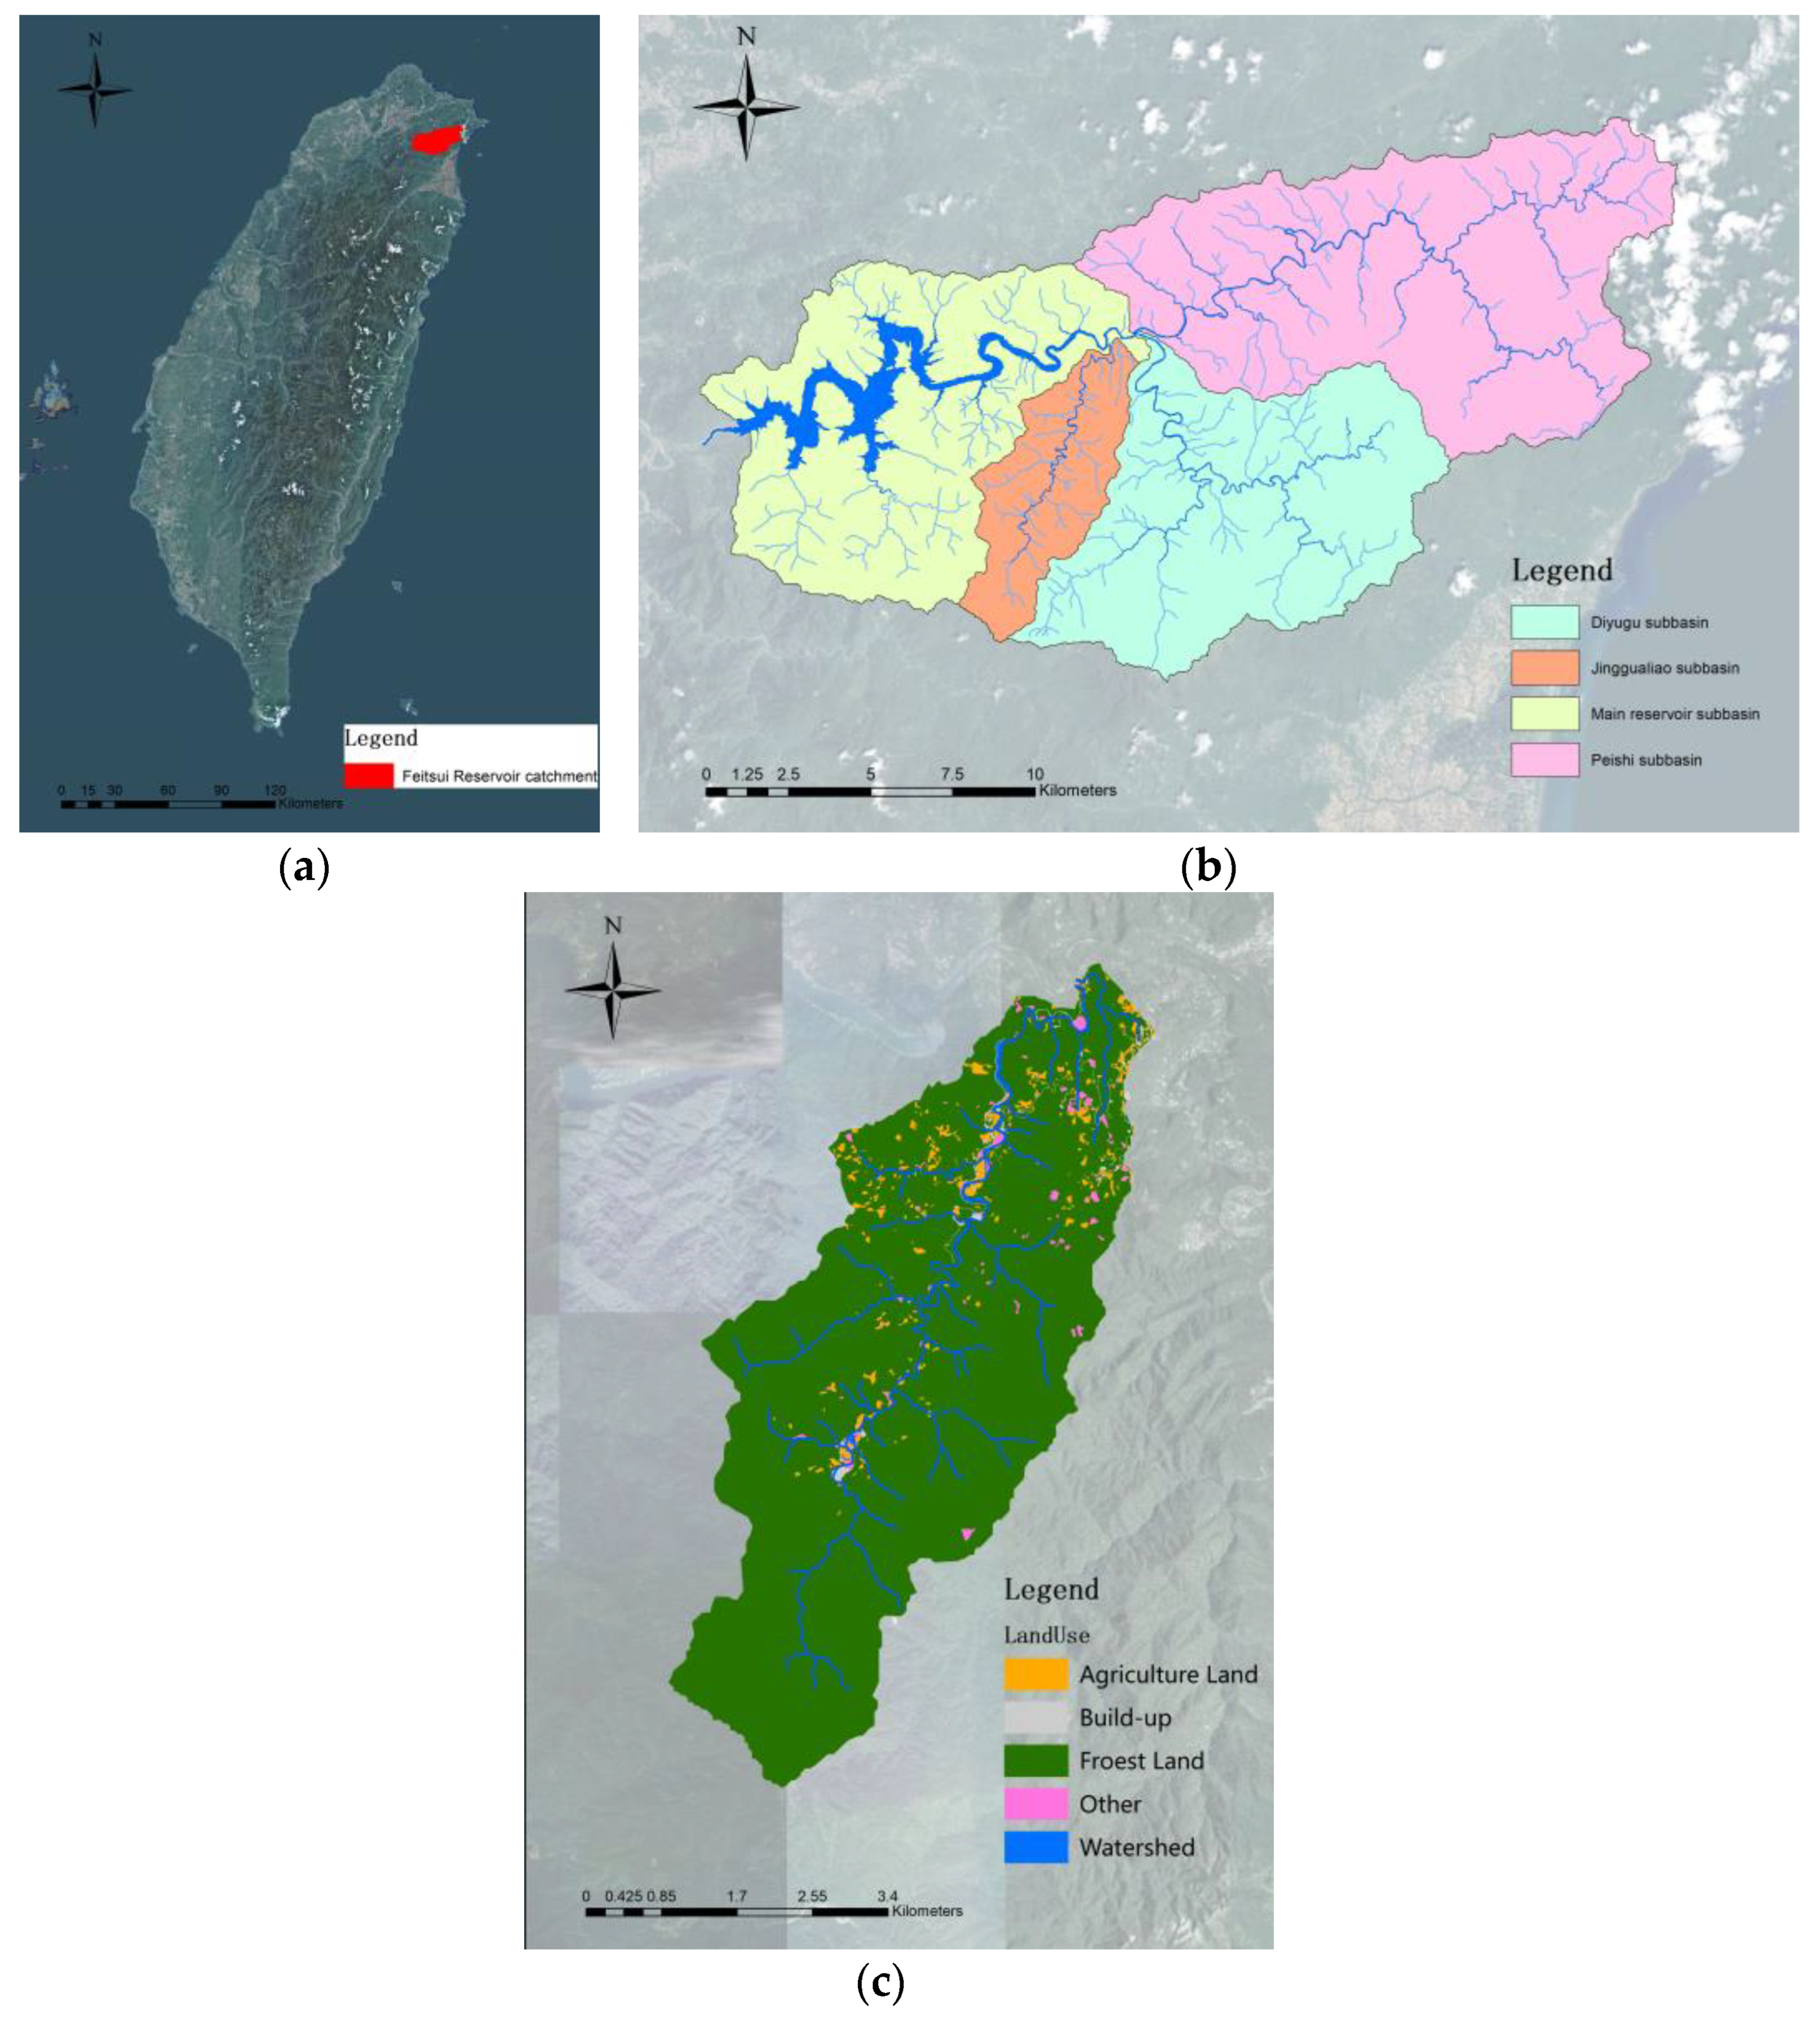
Because this reservoir provides drinking water, under existing regulations the watershed is free of large industrial or commercial buildings, and most of the point source pollution has been adequately managed. However, nonpoint source pollution from agriculture, particularly from tea farms, has emerged as a major potential pollution source. The reservoir receives inflow from three main rivers: the Jingualiao River, Daiyujue River, and Beishi River. The water quality of Jingualiao River is not as good as the other two and is considered the critical area to be controlled. The total area of the Jingualiao watershed is 2423.35 ha, with forests constituting 96.4%, tea farms (agricultural land) constituting 1.4%, built-up land constituting 0.5%, water bodies constituting 0.9%, and other types constituting 0.8% of the area (Figure 2).
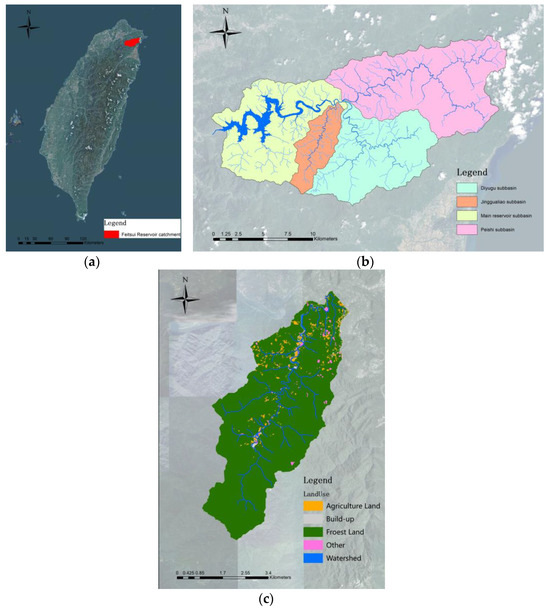
Figure 2.
(a) Location of Feitsui Reservoir, (b) sub-watershed of Feitsui Reservoir, and (c) land use of Jingualiao watershed, which was the case watershed in this study.
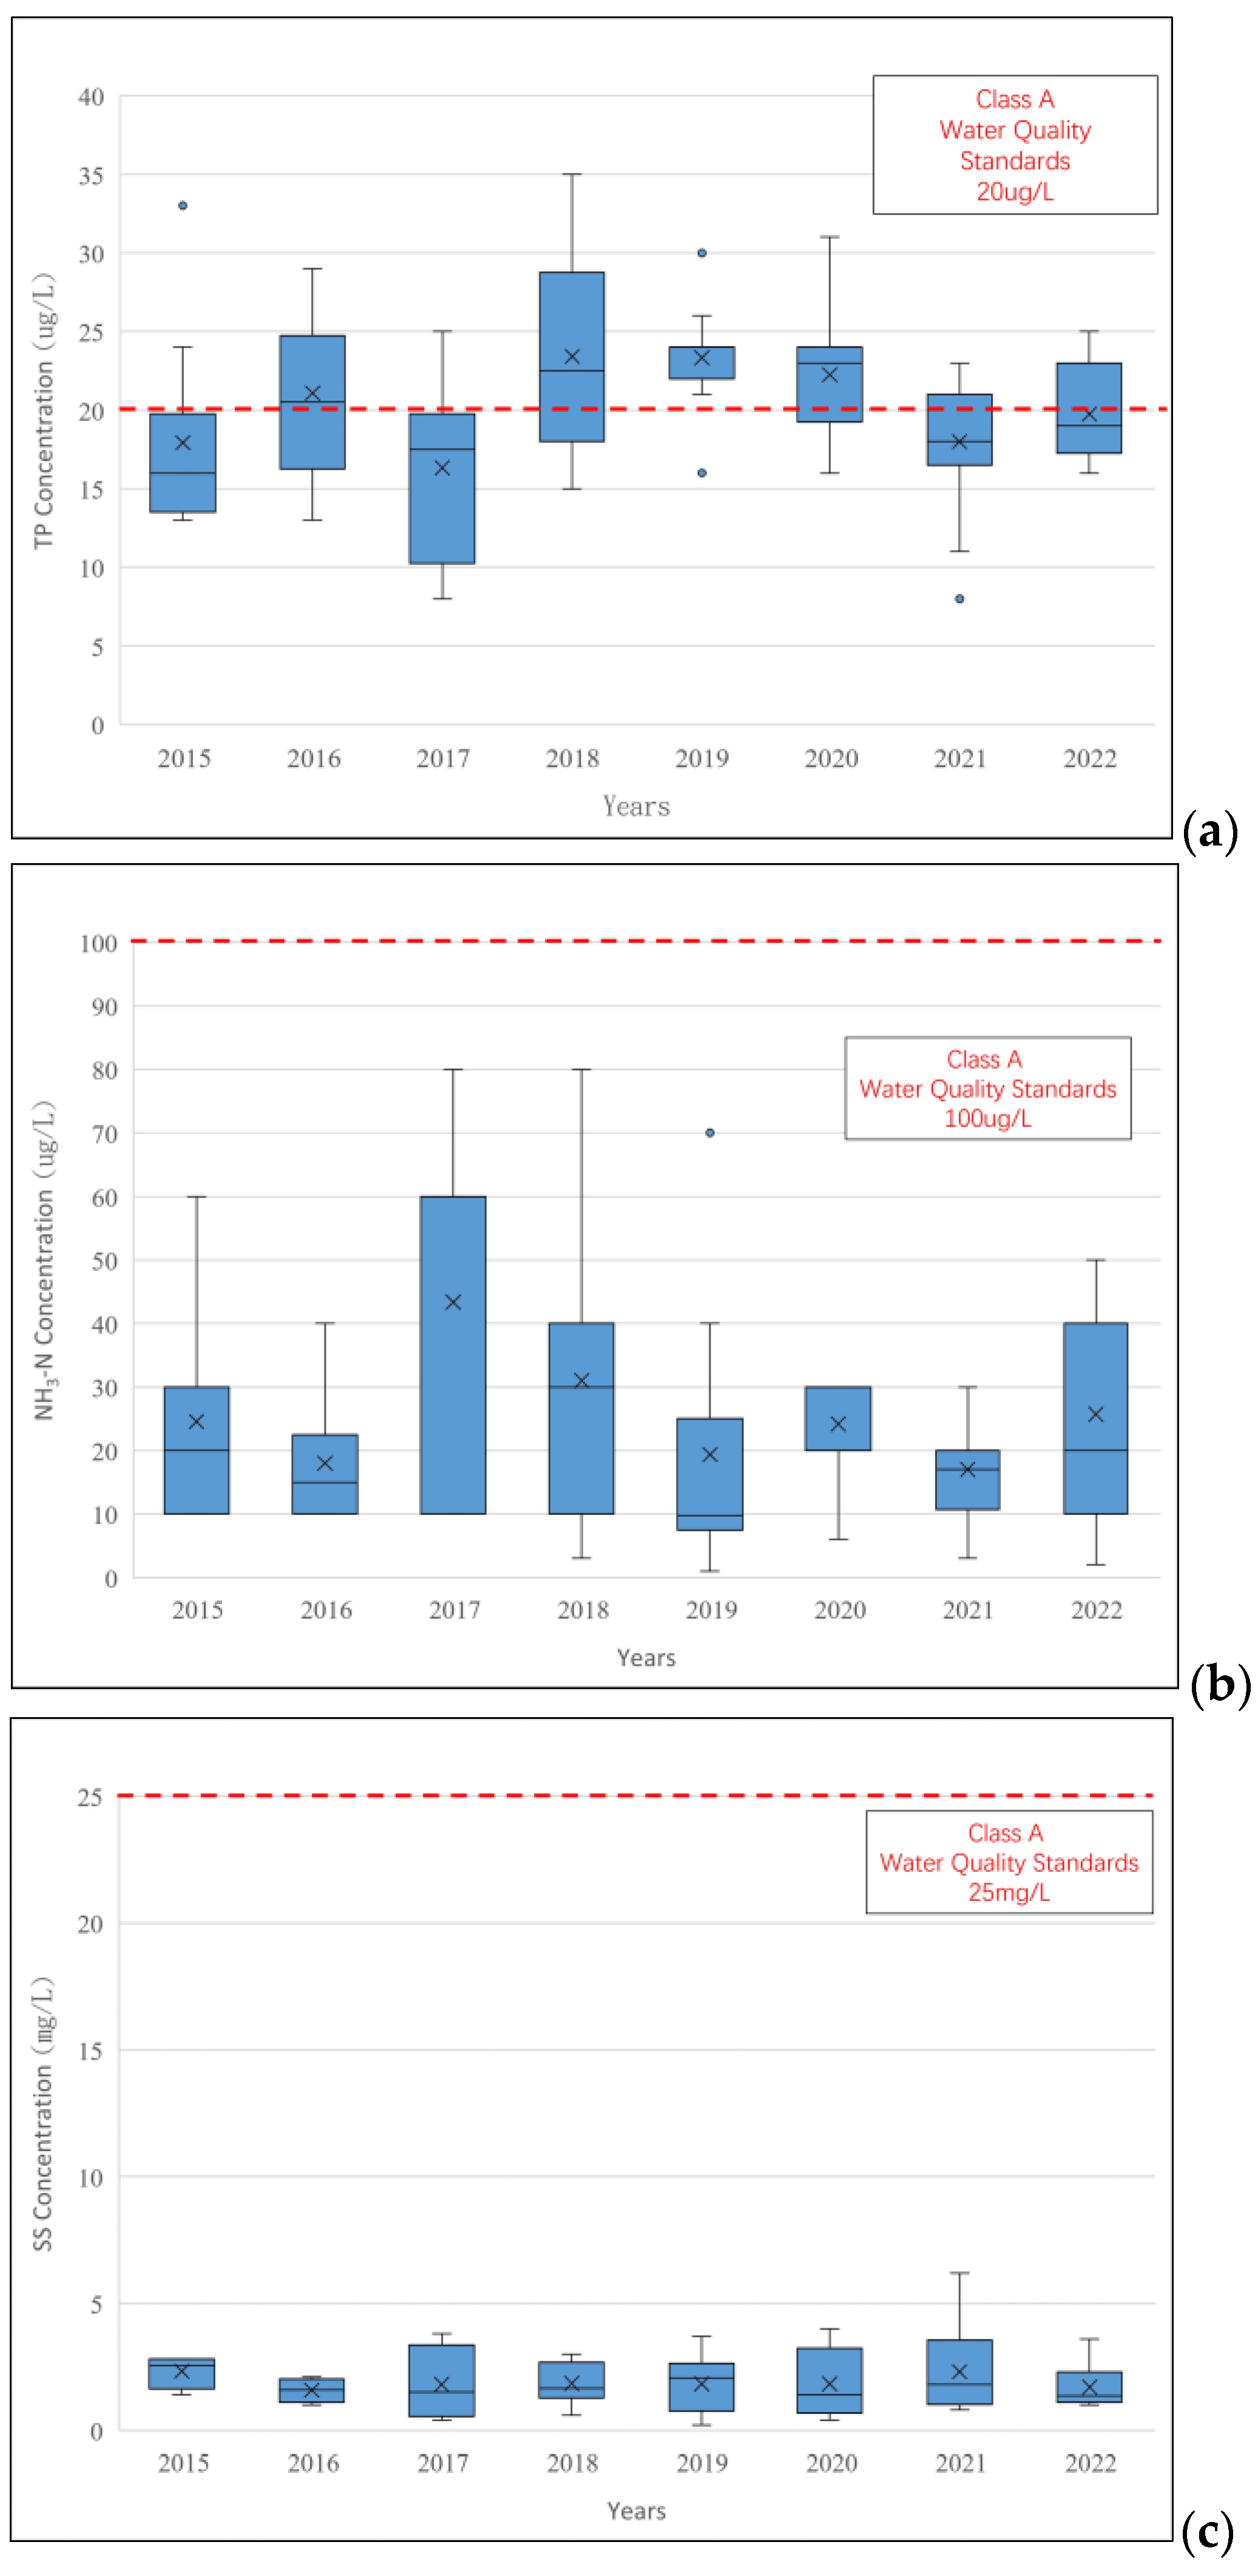
The water quality of the Jingualiao River is shown in Figure 3. The water quality and discharge of the rivers are monitored by the reservoir management agency (Taipei Feitsui Reservoir Administration). There is a flow gauge downstream of the Jinguliao River and the water quality was sampled and analyzed monthly. The data was accessed from the public monitoring data. This river is the water supply river and is classified as a Class A river. Most water quality is better than the standard requirement except for TP concentrations. The concentrations of TP occasionally exceeded water quality standards (20 μg/L), so the water quality attainment rates for TP were consistently below 80%. The concentrations of NH3-N are lower than the Class A water body standard (100 μg/L), and SS were below 5 mg/L, which is lower than the standard (25 mg/L). Therefore, this study targeted TP as the primary pollutant, and the management target is to increase the TP water quality attainment rates to 85% and 90%.
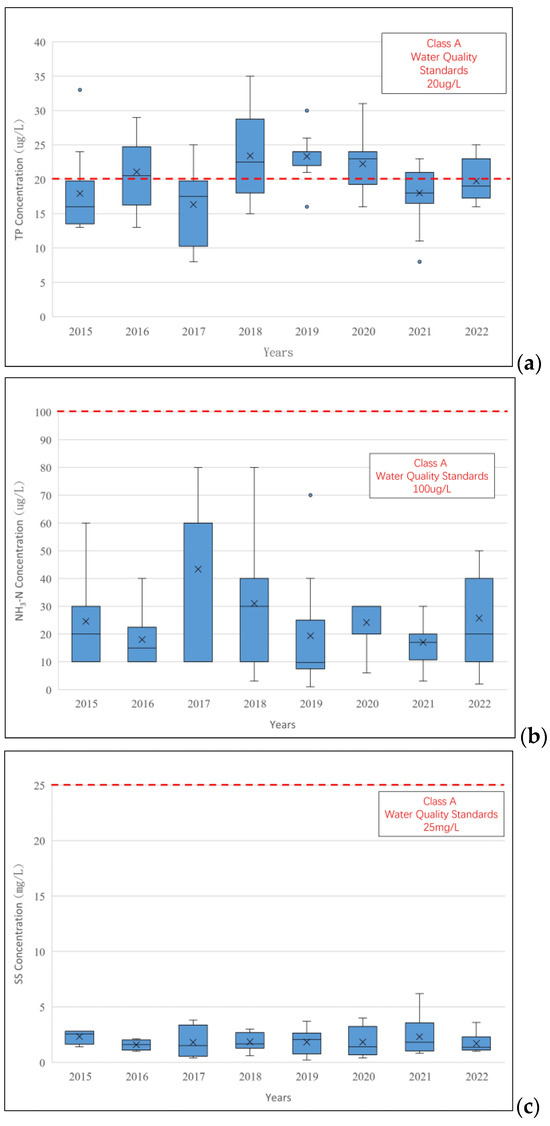
Figure 3.
Concentration of pollutants in Jingualiao River. (a) TP, (b) NH3-N, and (c) SS.
2.3. Case Study: Tea Farm
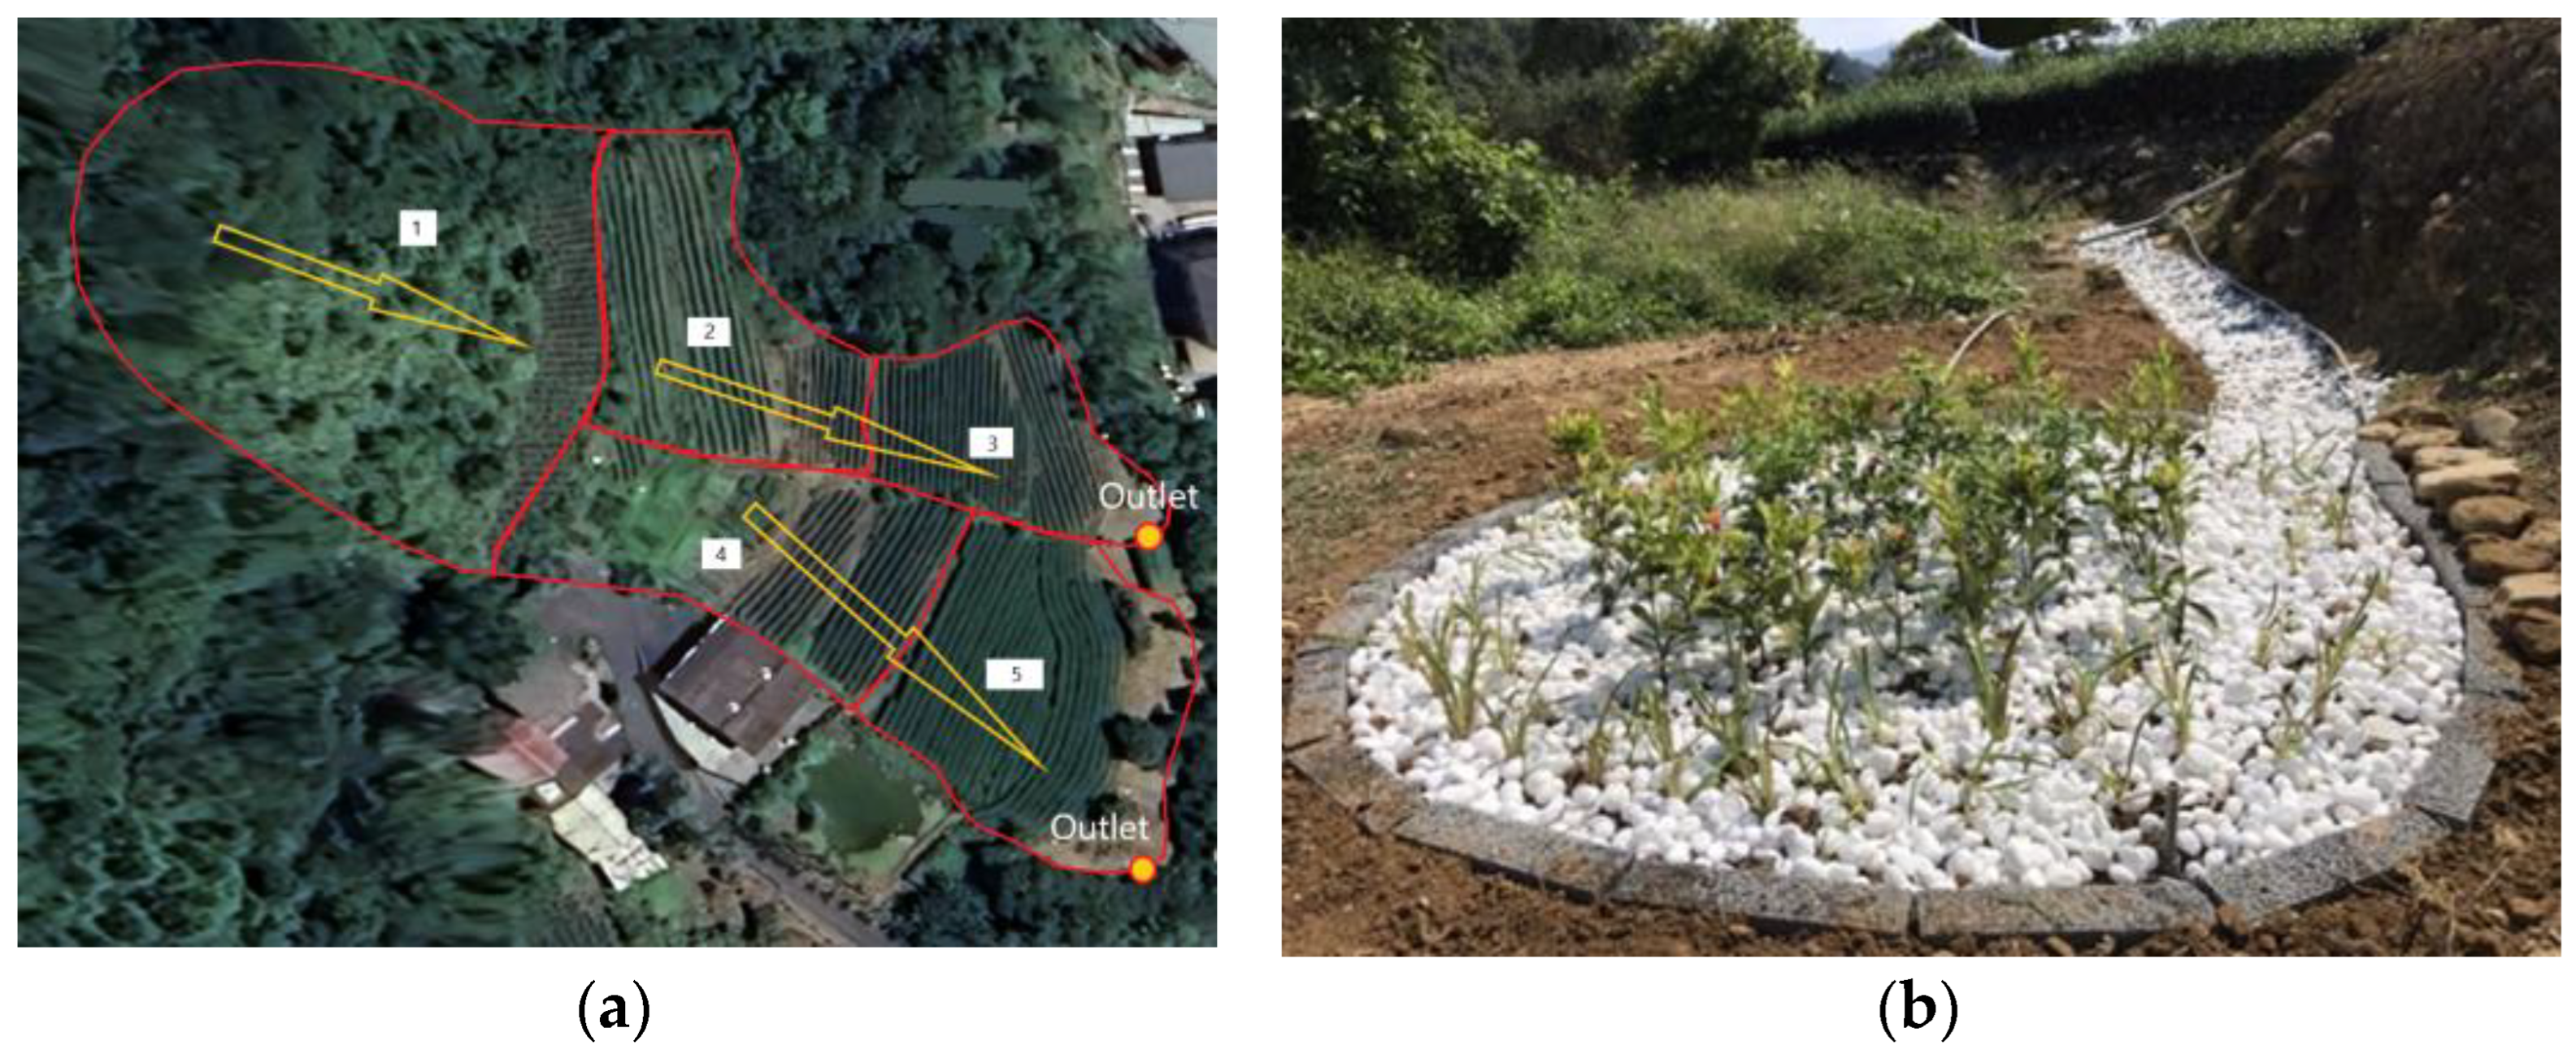
A case study was conducted on a tea farm in the Jingualiao segment (Figure 4). The farm area was 0.766 ha, and it was divided into five drainage areas. The basic information for each drainage area is presented in Table 1. There are two outlets of this tea farm, but only one outlet was set up for bioretention cell and monitoring. Therefore, data from half of this tea farm is used to establish the model. For the tea farm model, the tea farm area was 0.476 ha, which corresponded to the drainage areas 1, 2, and 3. The tea farm area was considered a closed system with no external water flowing into the sampling site.
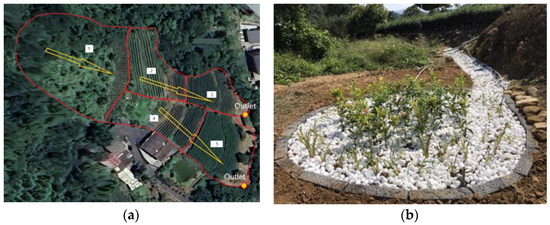
Figure 4.
The studied tea farm (a) the surface flow direction and (b) the bioretention cell. Arrows indicate the direction of water flow, and numbers represent the sub-drainage areas of this tea farm.

Table 1.
Basic information for each drainage area in the tea farm.
One bioretention cell, namely BR-JS7-019, located downstream of the tea farm (Figure 4b), was used as the sampling site. It occupies an area of 4 m2 and was installed in 2020. The inlet of the cell has a water level sensor (Audix Corporation, Taipei, Taiwan), and the outlet has a flow meter (FlowMaster Technology Co., Ltd., New Taipei City, Taiwan), enabling recording of the actual flow entering the bioretention cell. The flow can be recorded by the onsite sensor meters, but the water needs to be sampled manually on rainy days. To assess the reduction in pollutants from the tea farm, the inlet water was sampled to represent the tea farm runoff, and the outlet of the facility, which was set at the bottom of the cell, was sampled to determine the pollution reduction performance of bioretention cells. According to the weather forecast report, the field crew prepared the sampling stuff and waited for the rain. If the rains are too small, there is no runoff. If the storm is too large, it is hard to sample in the mountain area because of safety concerns. In this case, the total rainfall larger than 25 mm would generate runoff. The sampling interval is every 30 min. The sampling number depends on the duration of the rainfall event and the runoff volume; therefore, the number of samples in each event is different, and it is usually 3 samples. After sampling, each water sample was analyzed, and in this study, the average water quality was used. The field crew successfully collected 9 events on this site and used them to validate the SWMM model parameters. The water quality analysis followed the methods specified by the Taiwan Environmental Protection Agency (Table 2), and the associated methods were listed in Table 2. The background of tea farms, such as tea species, soil, fertilizers, and operations, are similar in the studied area. The built bioretention cells followed the same design, including the dimensions and materials, and only the area is different at different sites. Therefore, the performance of this site could represent the general tea farms and bioretention facilities.

Table 2.
Water quality sampling parameters.
2.4. ECM and SWMM
2.4.1. ECM for Nonpoint Source Pollution
The earlier versions of the pollution export coefficient models (ECM) were aimed at simplifying the relationship between land-use classifications and watershed pollutant export loads in order to estimate the total pollutant load in a watershed. The earlier versions of the ECM were pioneered by Beaulac and Reckhow [41] and Dillon and Kirchner [42]. The equation of the classic ECM is expressed as follows:
where represents the total pollutant load (kg/y), represents different land-use categories or types of pollutants, represents the export coefficient for the ith type of pollutant (kg/ha-y), represents the area of the ith type of land use (ha), represents the input amount for the ith type of pollutant (kg/y), and presents the pollutant input from rainfall (kg/y).
This study developed an enhanced ECM for the Feitsui Reservoir watershed by combining the original ECM with the SWMM and considering the following factors: rainfall-runoff, land use, soil infiltration, types of pollutants, pollutant accumulation, and rainfall washout on the tea farm, as well as the effect of LID facilities on pollutant reduction on the team farm. This study neglected pollutant input from rainfall (p). For the establishment of the model, the parameters , and were incorporated into the SWMM, which was calibrated using real watershed monitoring data and on-site tea farm sampling data.
2.4.2. SWMM
The SWMM is a dynamic simulation model used for modeling runoff transport phenomena within a watershed during single or long-term hydrological events [43]. In this study, the SWMM was employed for simulation. This model was selected primarily because of its ability to simulate both hydrological processes and water quality pollutants within a catchment area. Additionally, the SWMM includes a built-in LID module, which enables the simulation of various LID types [43,44]. In this study, the bioretention cell module was used.
For hydrological computations, the SWMM uses atmospheric data input by the user, such as rainfall, evaporation, and temperature data. The model employs a nonlinear reservoir module to simulate inflow after accounting for evaporation and infiltration. When a catchment’s storage capacity exceeds the maximum ponding depth, the excess water becomes surface runoff [43]. In the SWMM, water quality is calculated through a two-stage approach: the first stage involves calculating dry weather accumulation, and the second stage involves calculating rainfall wash-off [43]. This approach is based on the typical characteristics of nonpoint source pollution, where pollutants accumulate on the ground during dry weather and are subsequently washed into water bodies by rainfall. Therefore, the SWMM uses two separate functions: a built-up function and a wash-off function. The decay coefficient represents the change in pollutants in the water body. Different functions are used to evaluate accumulation and wash-off mechanisms, and the parameters of these functions must be determined through model verification. In this study, a power function was used to evaluate pollutant accumulation and an exponential function was used to evaluate rainfall wash-off.
In this study, the official monitoring data of flow and water quality in Jingualiao River were used to validate the watershed-scale SWMM (TPTM), and the tea farm field site data were as used to develop site-scale SWMM (WPTM).
2.4.3. Statistical Indicators of Model Performance
Model verification can be achieved through the use of statistical indicators to compare modeled values against measured values [45]. In this study, the coefficient of determination (R2) was used to verify the hydrological parameters. According to the suggestion of Moriasi et al. [45] and Kourtis et al. [46], R2 must be greater than 0.6 to prove that the verification results are satisfactory, and the mean absolute percentage error (MAPE) must be less than 50% to verify the water quality parameters.
3. Results and Discussion
3.1. ECM for Tea Farm and the Performance of Bioretention Cells (TPTM)
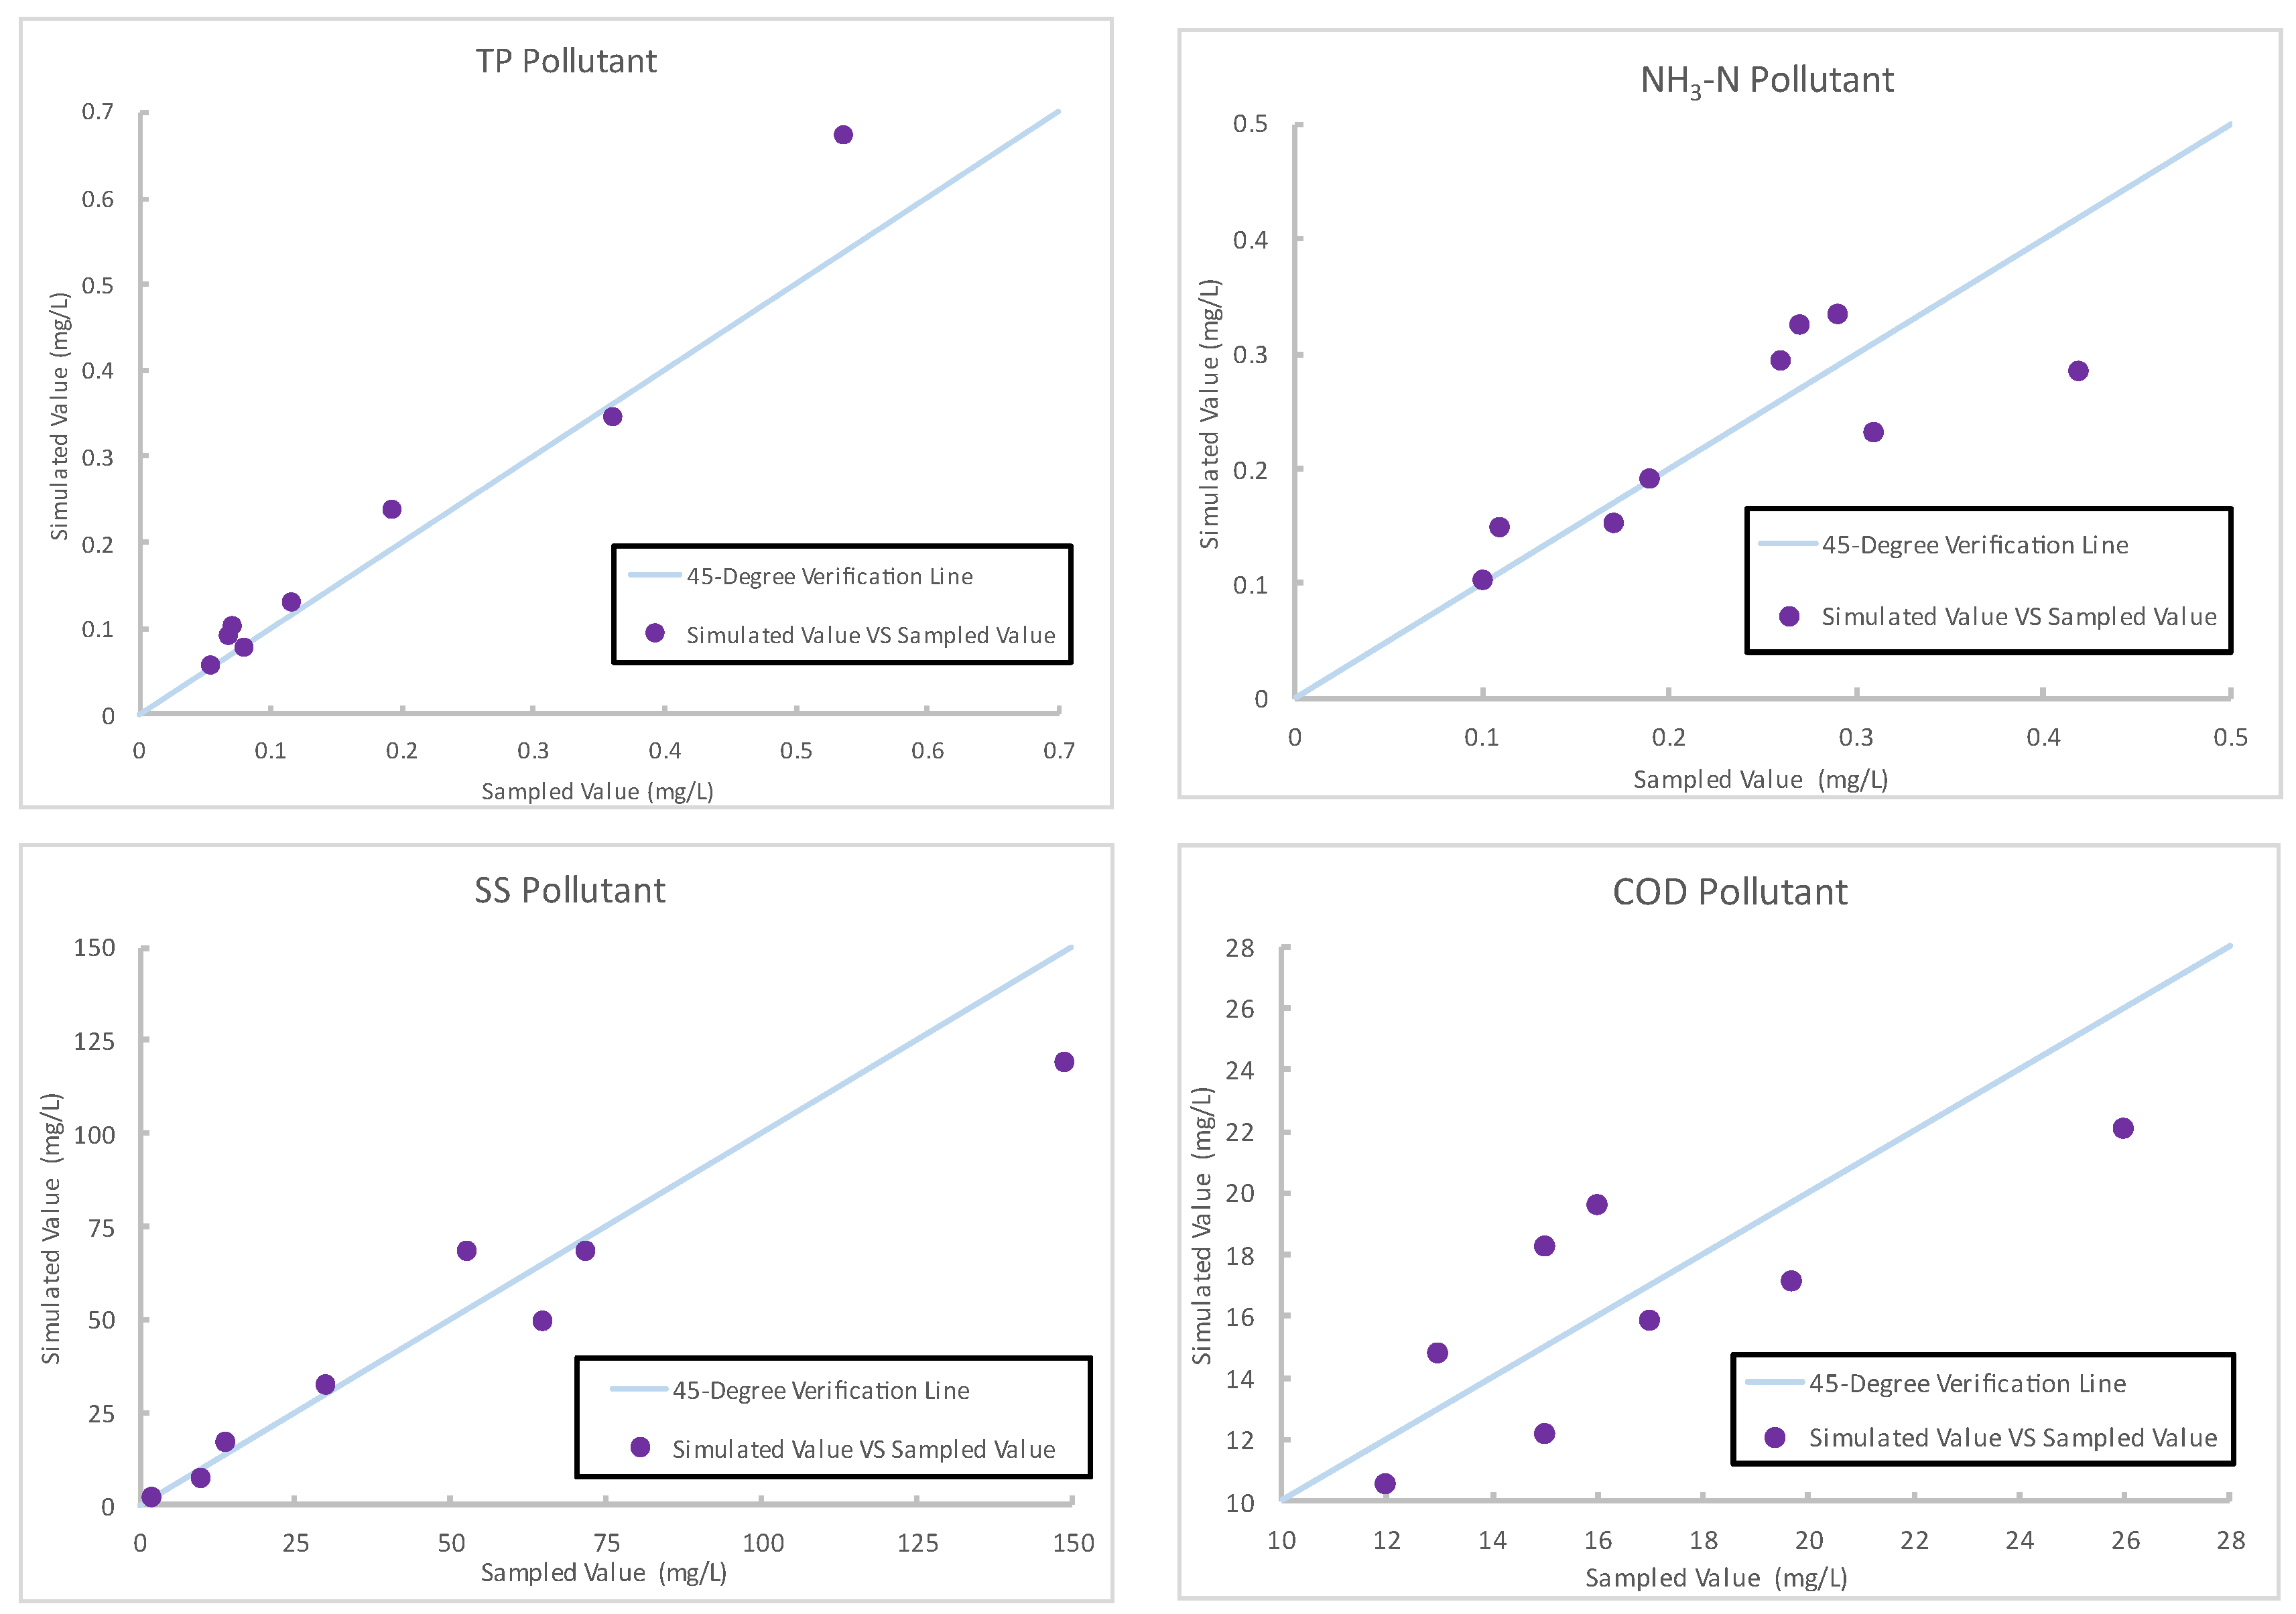
The performance of the TPTM in simulating runoff conditions on the tea farm was verified by the data from 9 rainfall events between 2021 and 2022. Although discrepancies existed between the simulated and measured values of daily runoff volume on different dates, the R2 value was calculated to be 0.9. This indicates that the model effectively represented the actual runoff conditions on the farm. The flow simulation results are presented in Table 3. The water quality performance was verified for four pollutants, TP, NH3-N, SS, and COD, and the inlet samples representing the runoff water quality from tea farms were used. The verification results revealed robust model performance in estimating TP, NH3-N, SS, and COD, with the average MAPE values being 17.9%, 17.1%, 17.3%, and 15.6%, respectively. The simulation results are displayed in Figure 5.

Table 3.
Verification results.
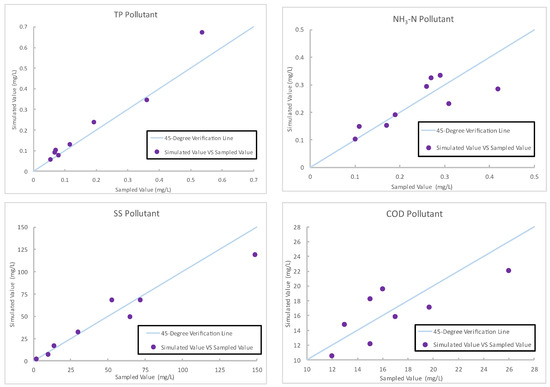
Figure 5.
Verification results for pollutants on tea farms.
Given the demonstrated reliability of the model, this study used it to calculate pollutant export coefficients for the tea farm with annual rainfall data, and the results are presented in Table 4. This study determined that the export coefficient for TP on the tea farm was 2.55 kg/ha-y. This coefficient is consistent with previously reported export coefficients for TP on agricultural land, which generally ranged from 0.9 to 6.83 kg/ha-y [22,47,48,49]. However, this coefficient is higher than forest land, which ranges from 0.1 to 0.34 [21,22,47,49]. This difference can be attributed to the fertilization practices in tea farms, which artificially increase the amount of TP entering the soil. The present study also determined that the export coefficient for NH3-N on the tea farm was 4.22 kg/ha-y. This coefficient is lower than that reported by Duan et al. [50], who observed an NH3-N export coefficient of 9.1 kg/ha-y for agricultural land with fertile black soil. This difference may be due to the growth of tea’s need for nitrogen, and the utilization of nitrogen fertilizers in teas is intensive, causing less export than other agricultural lands. This coefficient is higher than NH3-N on forest land, which ranges from 0.16 to 0.98 kg/ha-y [50,51].

Table 4.
Pollutant export coefficient for tea farm.
In addition to nutrients, this study determined that the export coefficient for SS on the tea farm was 768.39 kg/ha-y. Reza et al. [48] found an SS export coefficient of 5611 kg/ha-y for agricultural fields with steep slopes. It showed that the tea farm did not export many SS compared to other agricultural lands, such as vegetables or crops. The export coefficient for COD on the tea farm was 145.71 kg/ha-y. This coefficient is consistent with that reported by Wen et al. [52], who determined a COD export coefficient of 150 kg/ha-y for agricultural land. However, this coefficient is different from the study [50], which were 10.5 and 16.1 kg/ha-y for agricultural and forest lands, respectively. These differences may be related to the soil type and the use of fertilizers. It is usually introducing various organic substances into the soil to meet the specific requirements of crops and influence COD export coefficients.
While inlet water represented the runoff water quality from tea farms, the outlet samples were used to verify the effectiveness of LID facilities (i.e., the BR-JS7-019 cell). The studied bioretention cell includes plants, a soil growth layer, a filtration layer, and an underdrain pipe. When the runoff is directed into the facility, the pollutants can be used by plants [53], filtered by soils and gravels, reduce runoff volume, and then reduce pollution concentration and loads in outflow [54]. In the study, the reduction rate of SS, COD, TP, and NH3-N provided by bioretention cells was 59.7%, 56.0%, 42.4%, and 37.8%, respectively. This performance was similar to the previous studies. For example, Jiang et al. [55] concluded that the field bioretention cell reduced 51.79% of SS, 39.8% of COD, 56.99% of TP, and 59.73% of NH3-N. Lucke and Nichols [56] evaluated five 10-year-old bioretention cells and received high SS and TP reduction to 80.97% and 74.09%, respectively, and a relatively low NH3-N reduction of 29.43%.
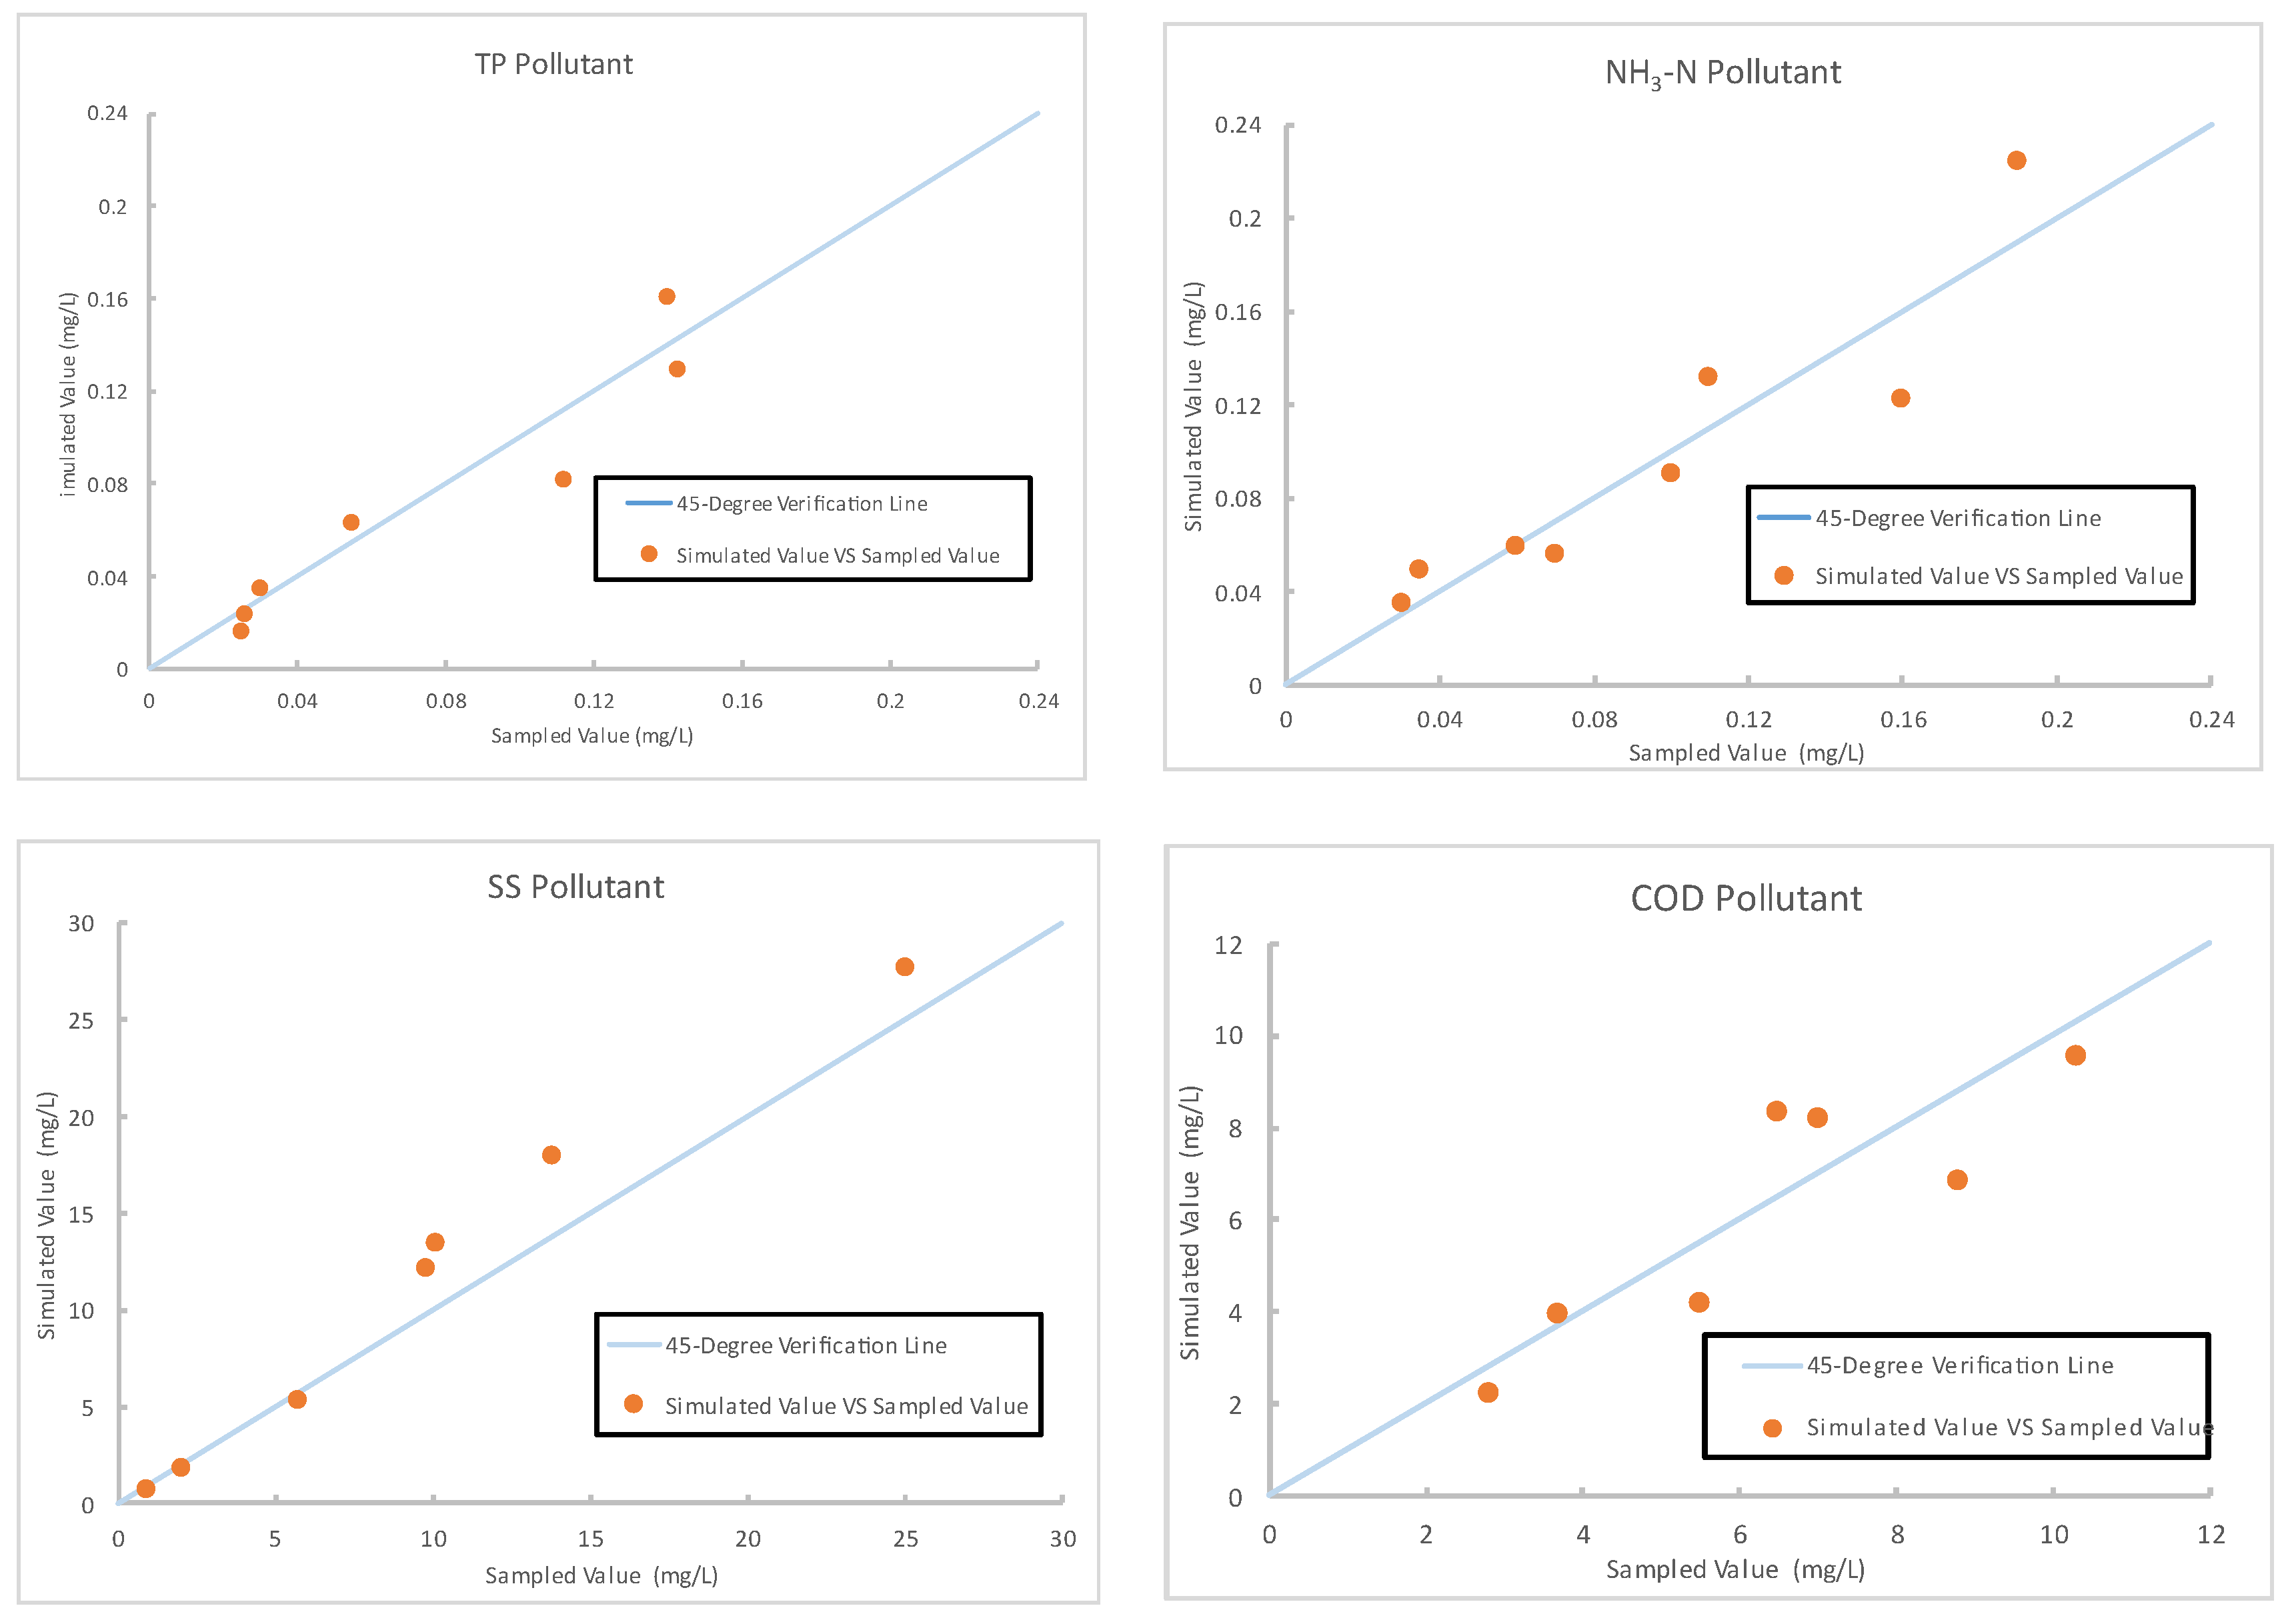
The verification results of bioretention cell simulation are illustrated in Figure 6. The verification results revealed robust model performance in estimating the effectiveness of the BR-JS7-019 cell in reducing TP, NH3-N, SS, and COD in the water on the tea farm, with the average MAPE values being 18.1%, 18.8%, 19.0%, and 18.1%, respectively. While simulating annual performance by the validated model, the reduction ability of the bioretention cell can be determined. The results are presented in Table 5. A unit (1 m2) bioretention cell can reduce 18.6 g of TP, 20.9 g of NH3-N, 5545.5 g of SS, and 881.4 g of COD per year. The reduction loads were used instead of concentration because the concentration is influenced by runoff volume, and the unit load reduction coefficients are particularly important in reservoir management to control the accumulative pollution loads.
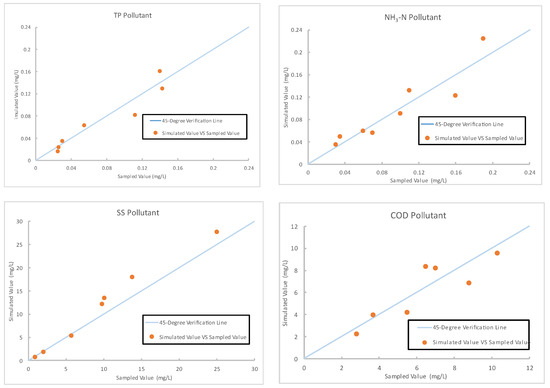
Figure 6.
Verification results regarding tea farm pollutant reduction by bioretention cells.

Table 5.
Amount of pollutant load that can be reduced by setting up bioretetion cells.
3.2. Simulation of Watershed Model (WPTM) and the Design of Watershed Management Goals
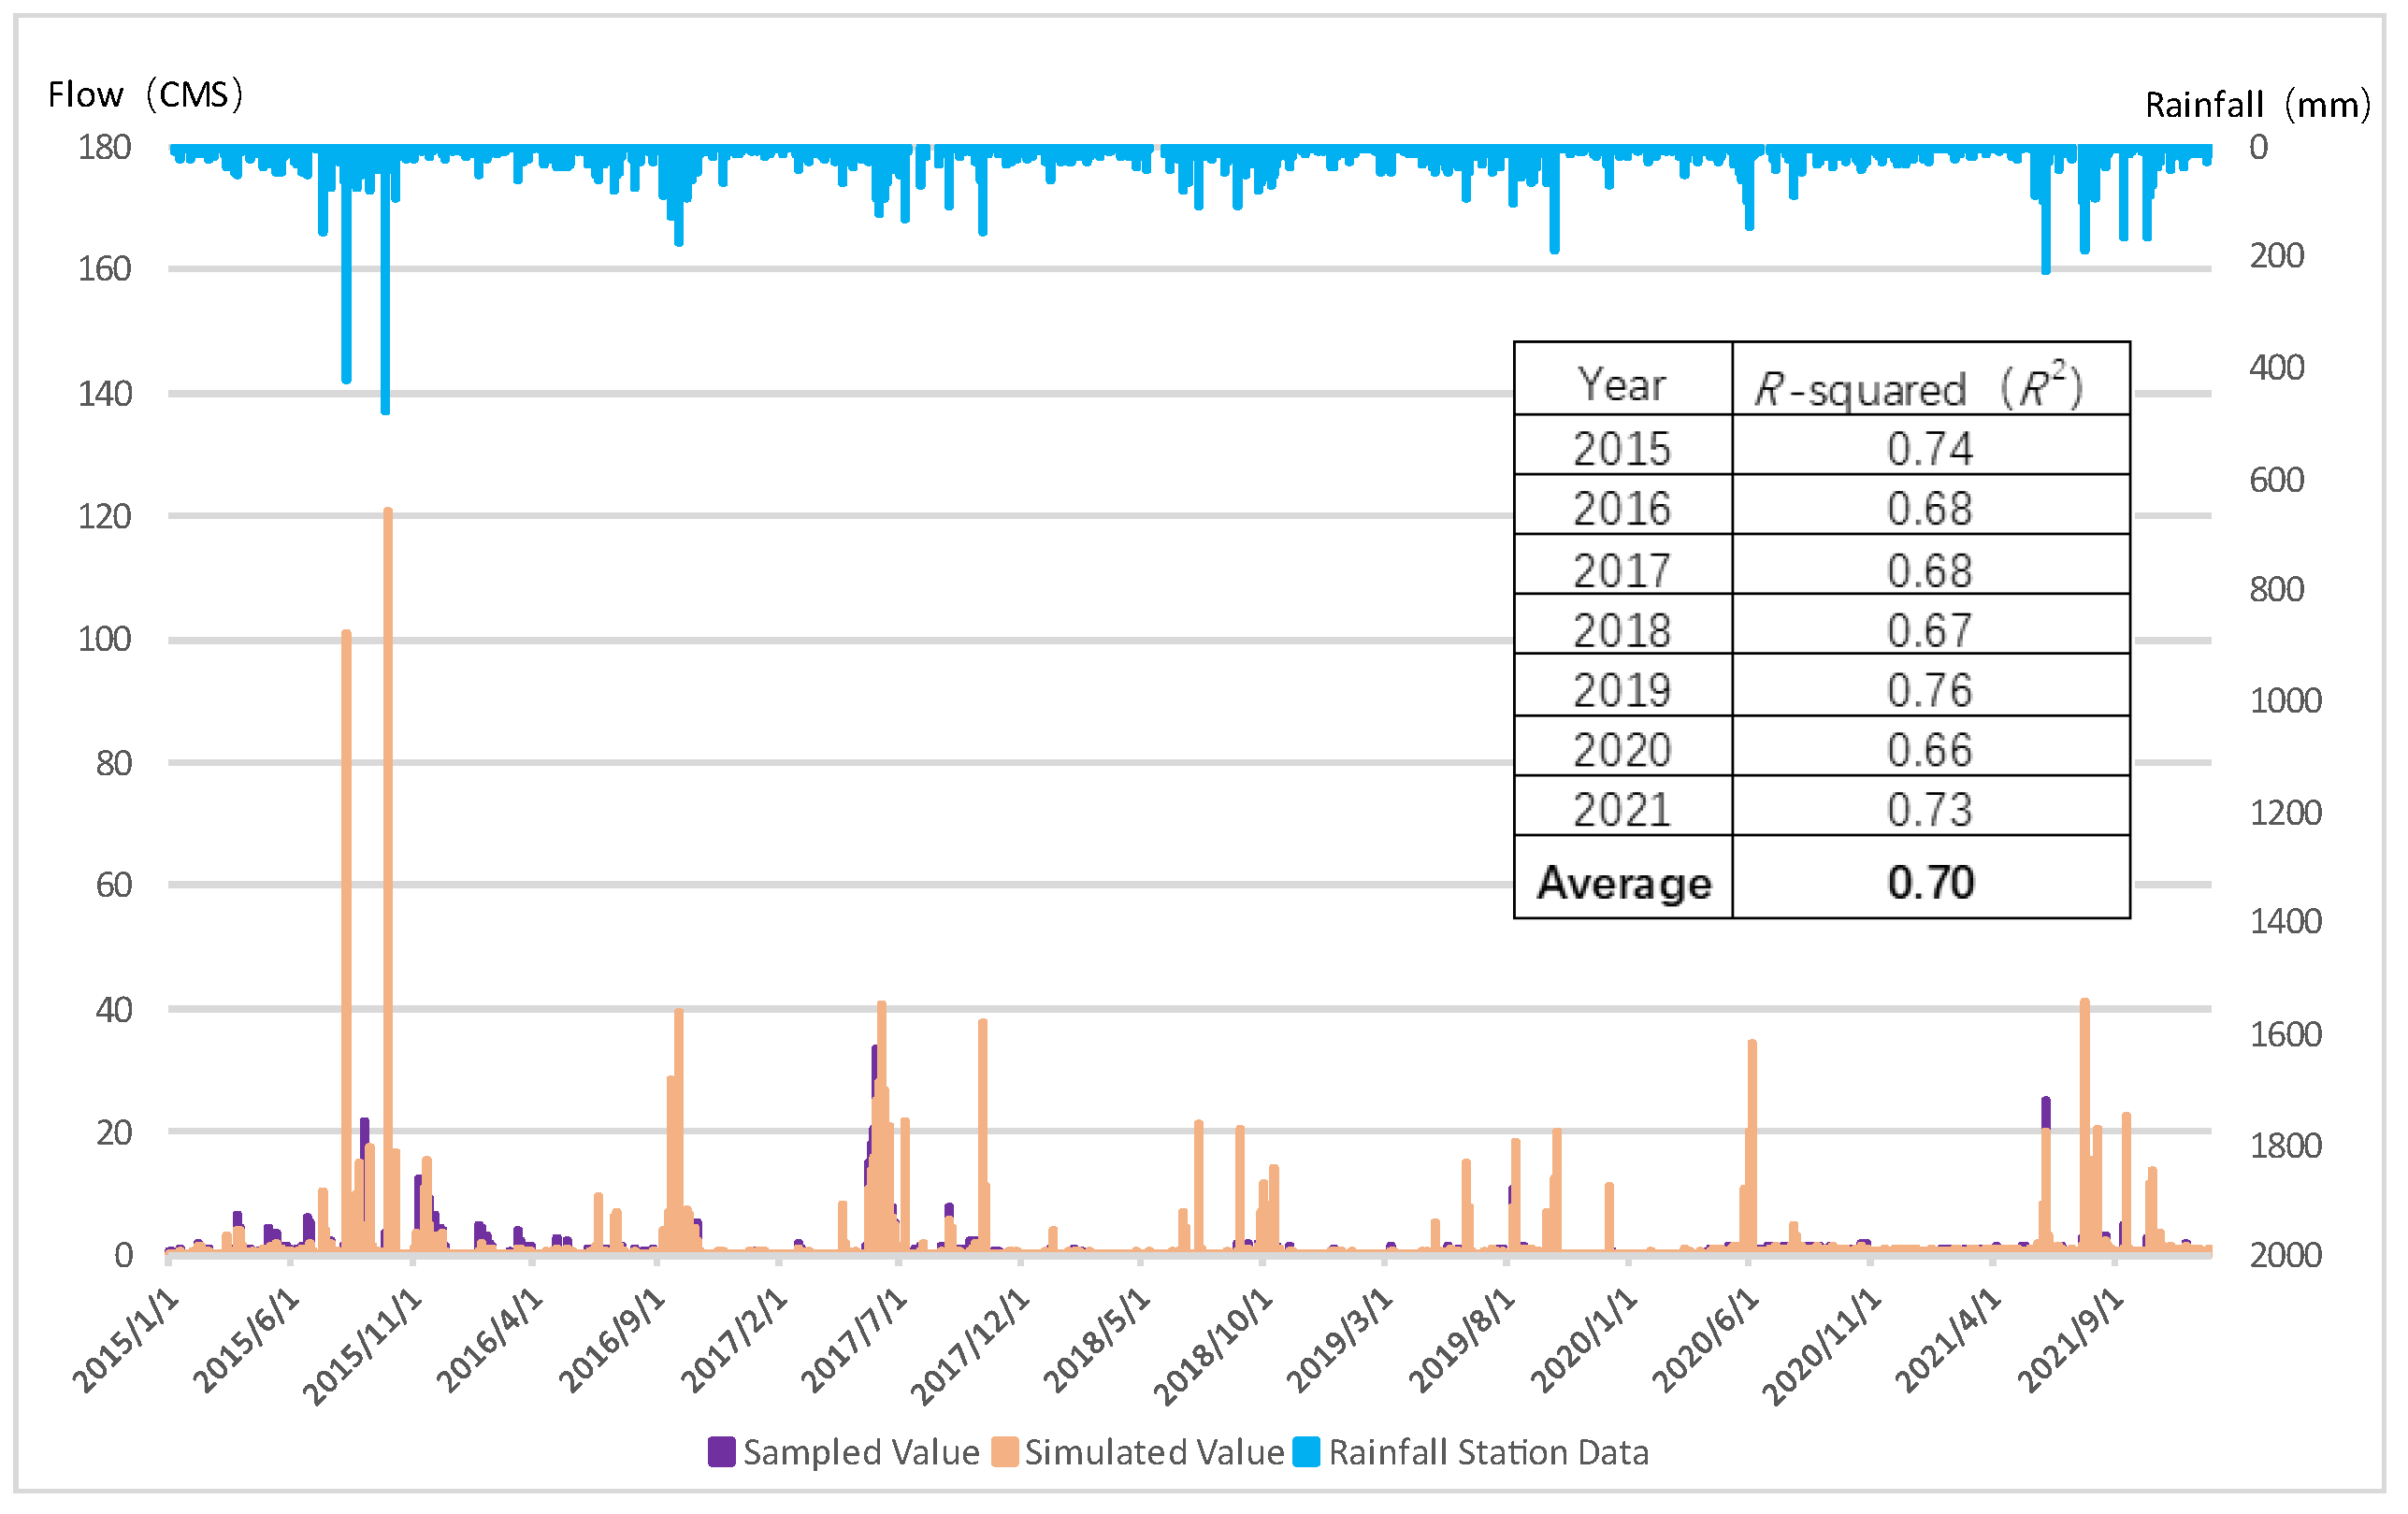
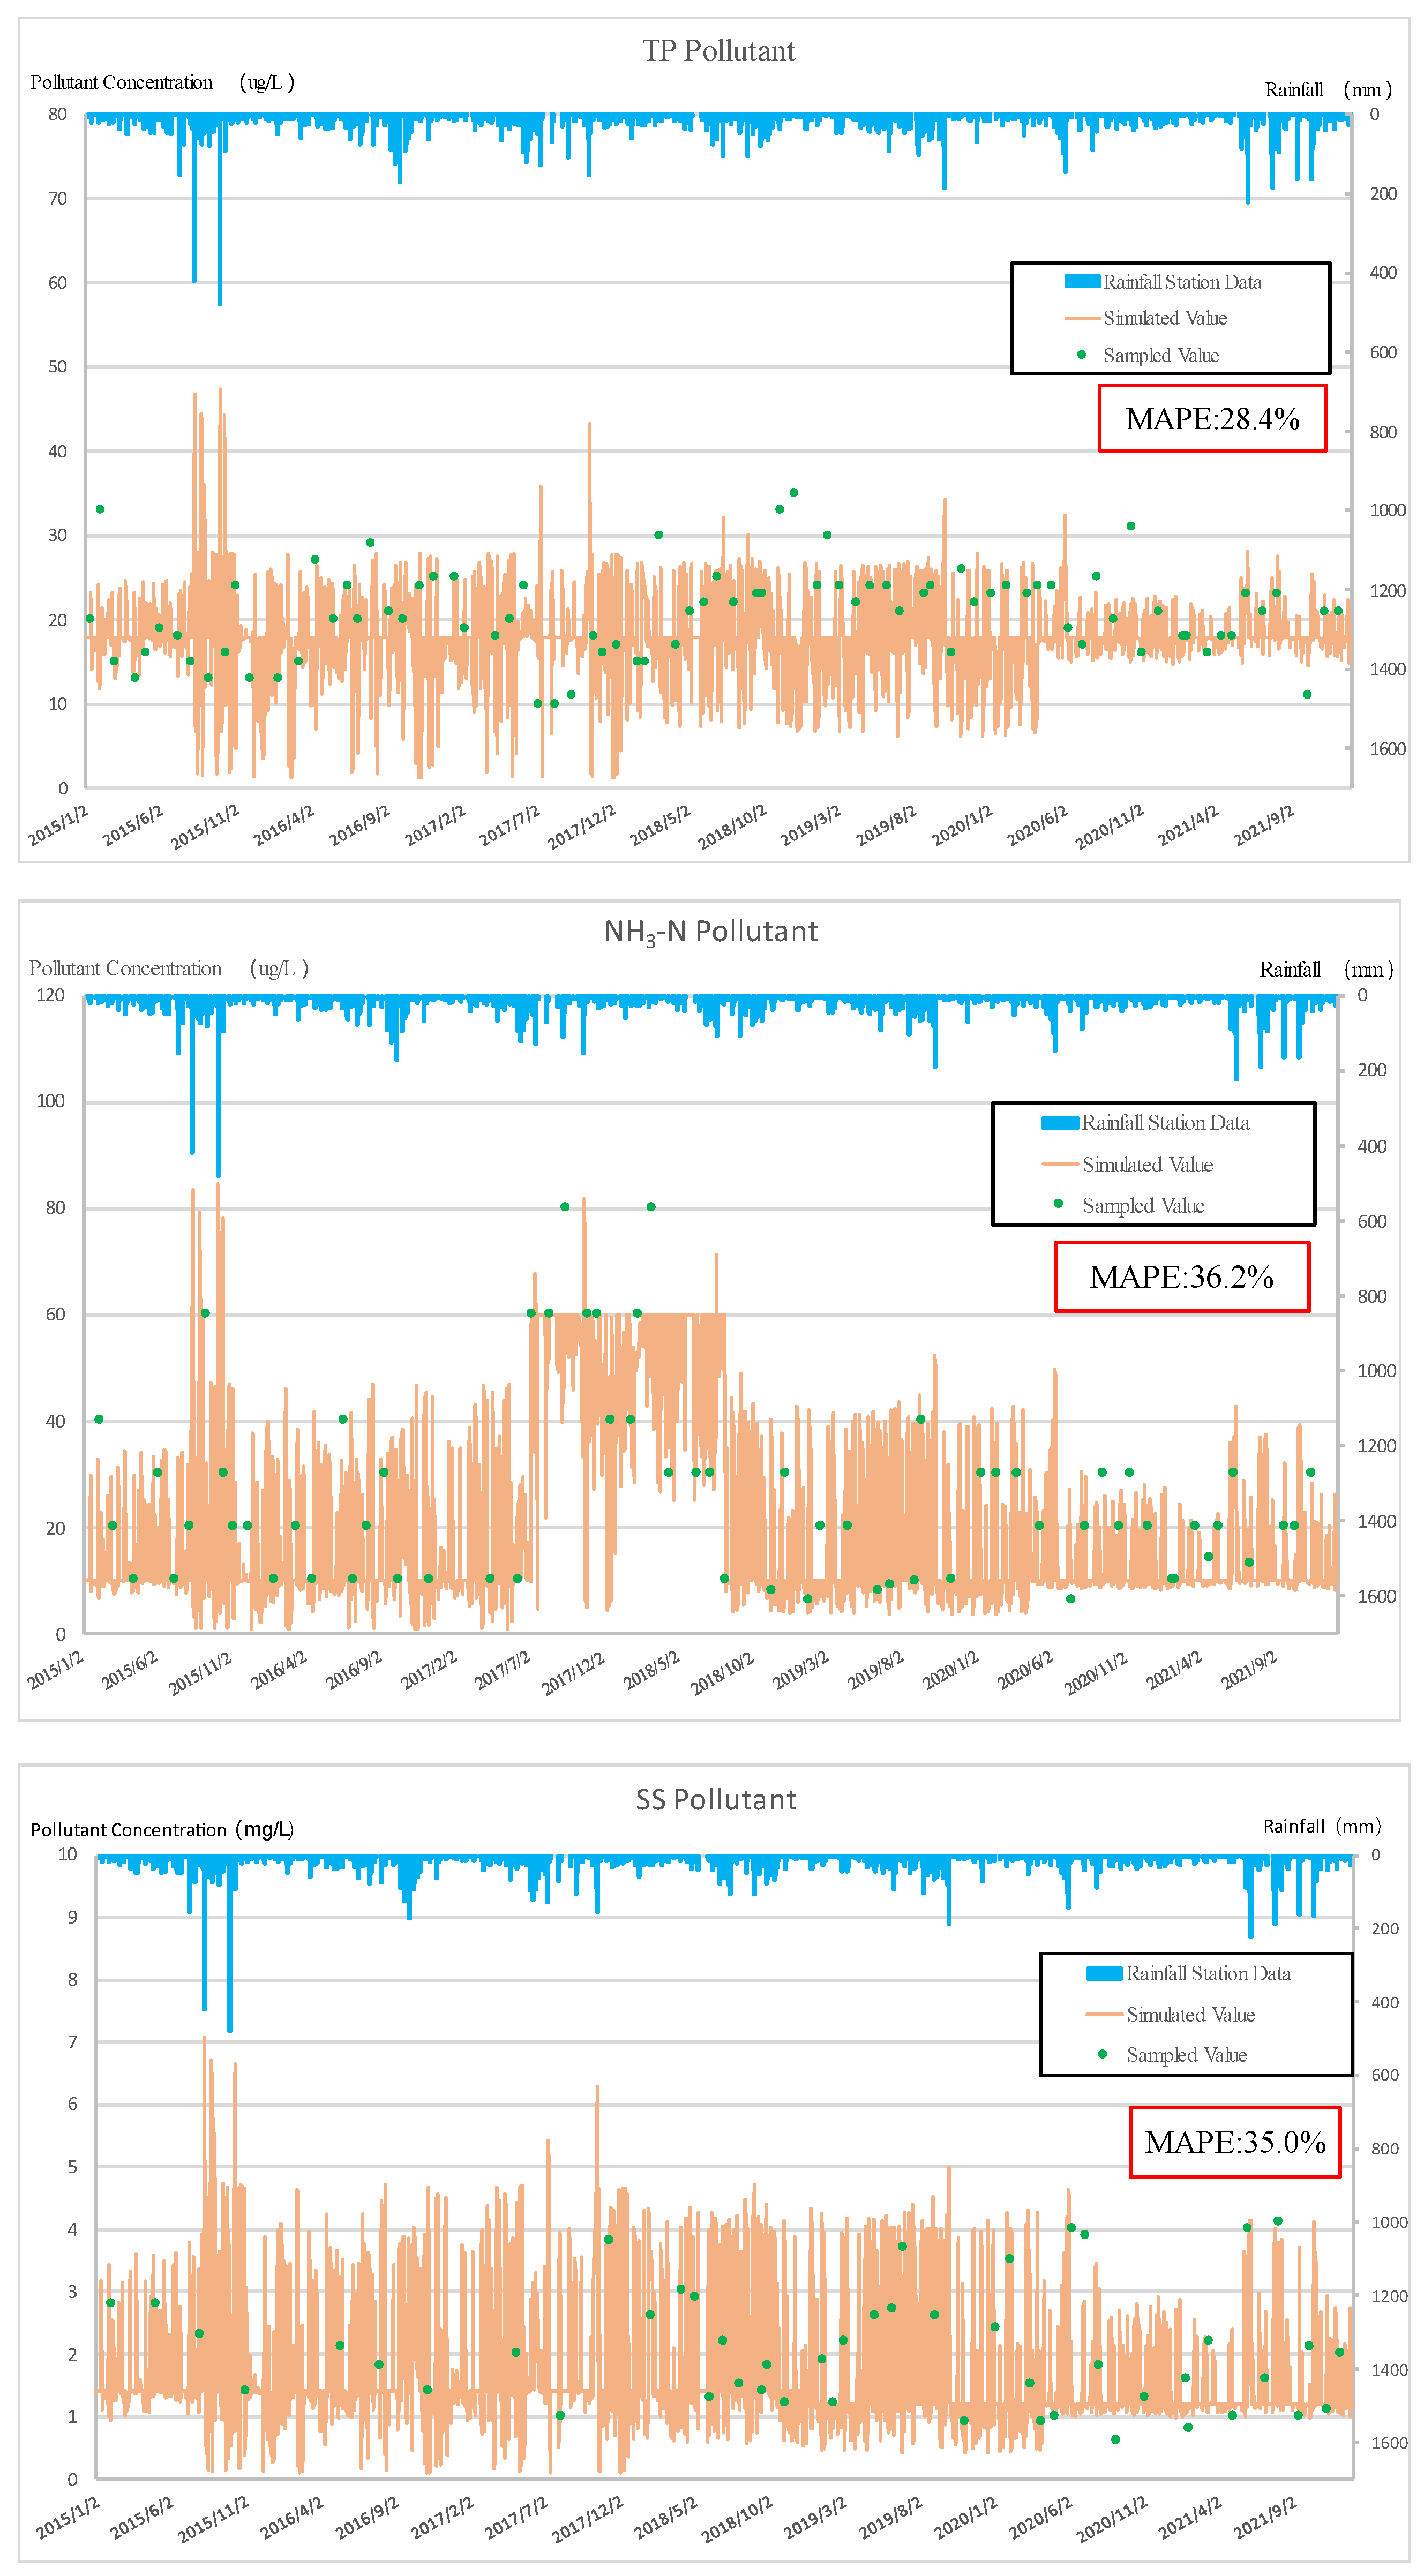
The WPTM is a watershed scale model that assists in determining watershed management goals and strategies. The flow and water quality simulation of the WPTM were verified by monitoring data from 2015 to 2021. The flow verification results are shown in Figure 7, and the R2 for the 7-year simulation was from 0.66 to 0.76 with an average value of 0.7. The water quality simulation results are displayed in Figure 8. The MAPE values for TP, NH3-N, and SS were 28.4%, 36.2%, and 35.0%, respectively.
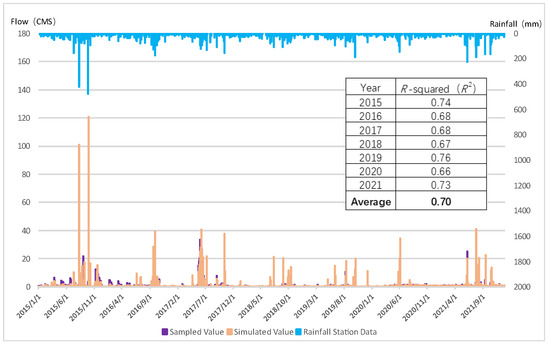
Figure 7.
Flow verification results for Jingualiao River.
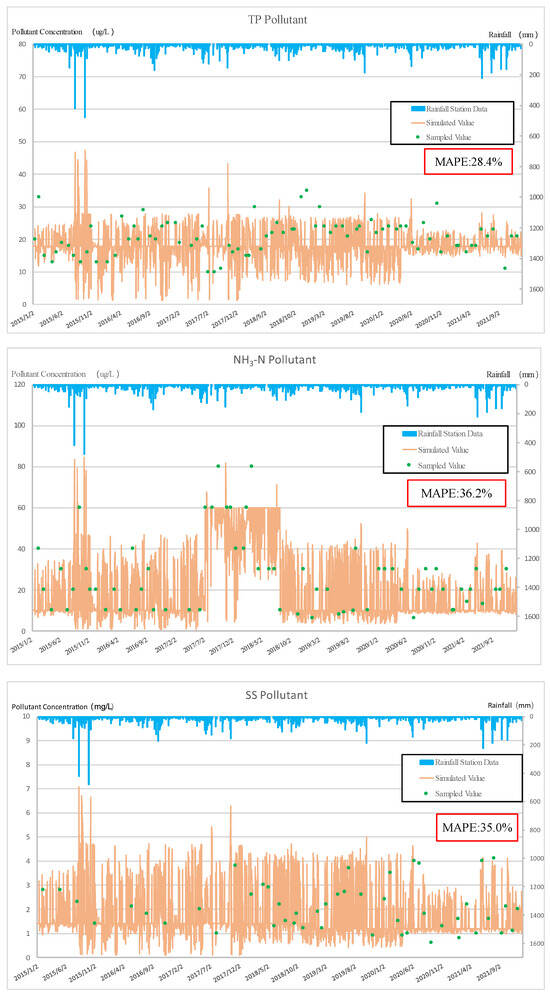
Figure 8.
Water quality verification results for Jingualiao River.
With the validated TPTM and WPTM, the watershed management goals and strategy can be determined. In this study, TP was selected as the target pollutant. In Jingualiao River, the water quality of TP concentration is sometimes exceeding the standard requirement of 20 μg/L. Water quality attainment rates were used as the goal indicator, and the rate was calculated by dividing the number of monitoring events in which the TP concentration was below 20 μg/L (Class A water body standard) by the total number of monitoring events; therefore, 100% water quality attainment rate means all sampled water is lower than TP 20 μg/L. Table 6 shows the current water quality attainment rate in 2015–2021, and the average was 77.39%. This means that around 25% of the TP concentration does not match the required standard. Therefore, increasing the rate is the management goal, and 85% and 90% were suggested as short-term and long-term goals. Because of the validated WTPM obtained, 34.85 kg/y and 43.75 kg/y TP should be reduced in order to achieve the two goals.

Table 6.
Water quality attainment rates in the Jingualiao watershed.
In the Jingualiao River watershed, the results of the WPTM model showed that the average TP load is 700.4 kg/y, and 130.0 kg/y is contributed from tea farms. If all the reduced TP (34.85 kg/y and 43.75 kg/y) is assigned to tea farms, the tea farms should cut 27% and 34% of TP export. Here, it assumed that a 50% sharing ratio was assigned to tea farms. Therefore, the tea farms should cut 13% and 17% of TP export, which means that each hectare tea farm should reduce 0.369 kg/y TP and 0.417 kg/y TP for 85% and 90% goals, respectively. Under the management goals, a total of 540 m2 and 715 m2 bioretention cells are required. Table 7 summarizes the results. The two validated models link the watershed management goals to practical strategy. In the Jingualiao watershed, if the water quality attainment rate is expected to increase to 85% (now 77%), setting 540 m2 of bioretention cells to tea farms is suggested in the short term and 715 m2 for the long-term goal. This could serve as a general policy under the assumption that the studied tea farm could represent the general performance of tea farms in this watershed. Under different watersheds or climates, the suggested bioretention cell area is unsuitable. The value presented in Table 7 is only suggested for the case watershed. However, the other cases could develop their own TPTM, and WPTM followed the process.

Table 7.
Achieving water quality goals for tea farms requires reducing pollutant load and implementing LID facilities.
3.3. Application for Single Tea Farm Pollution Control
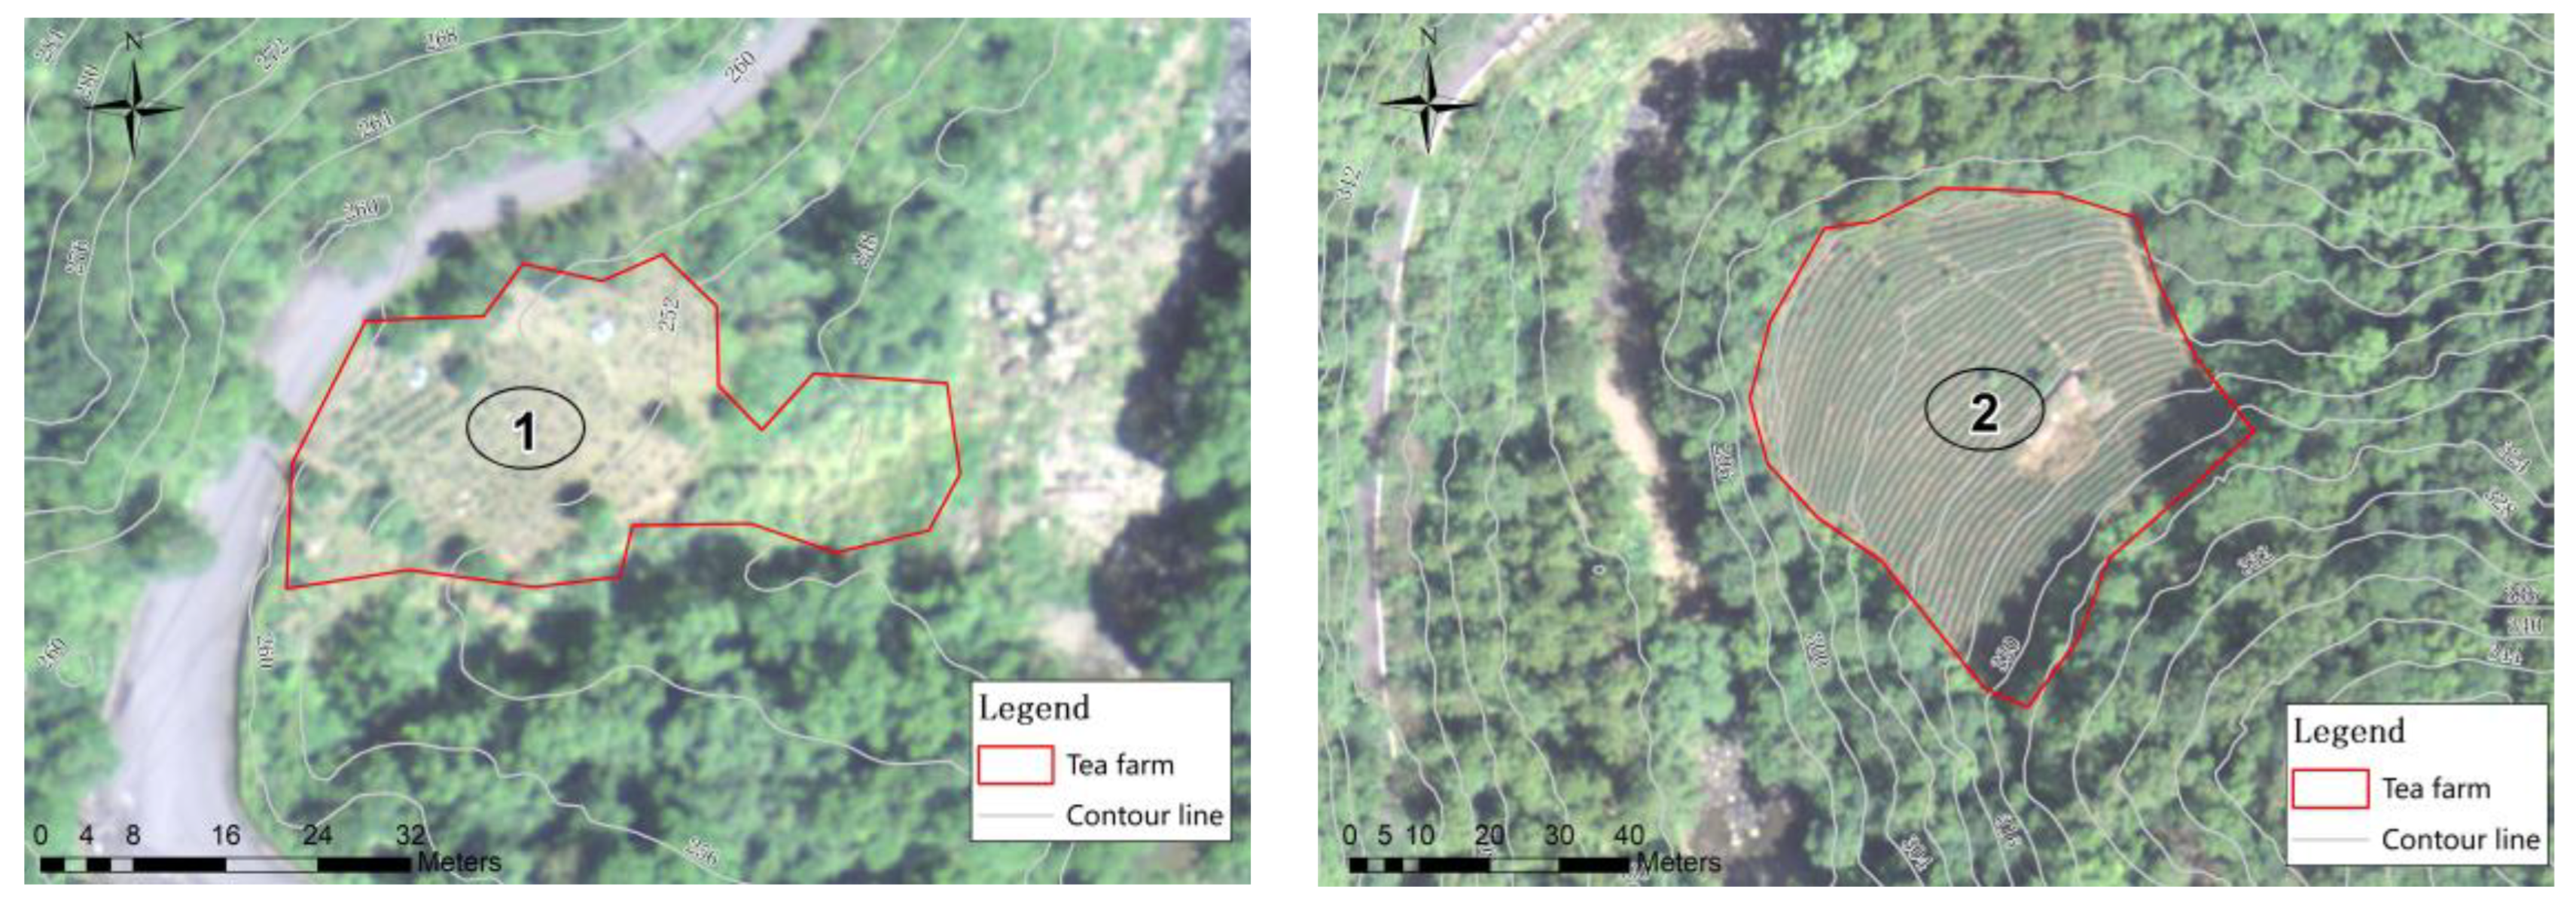
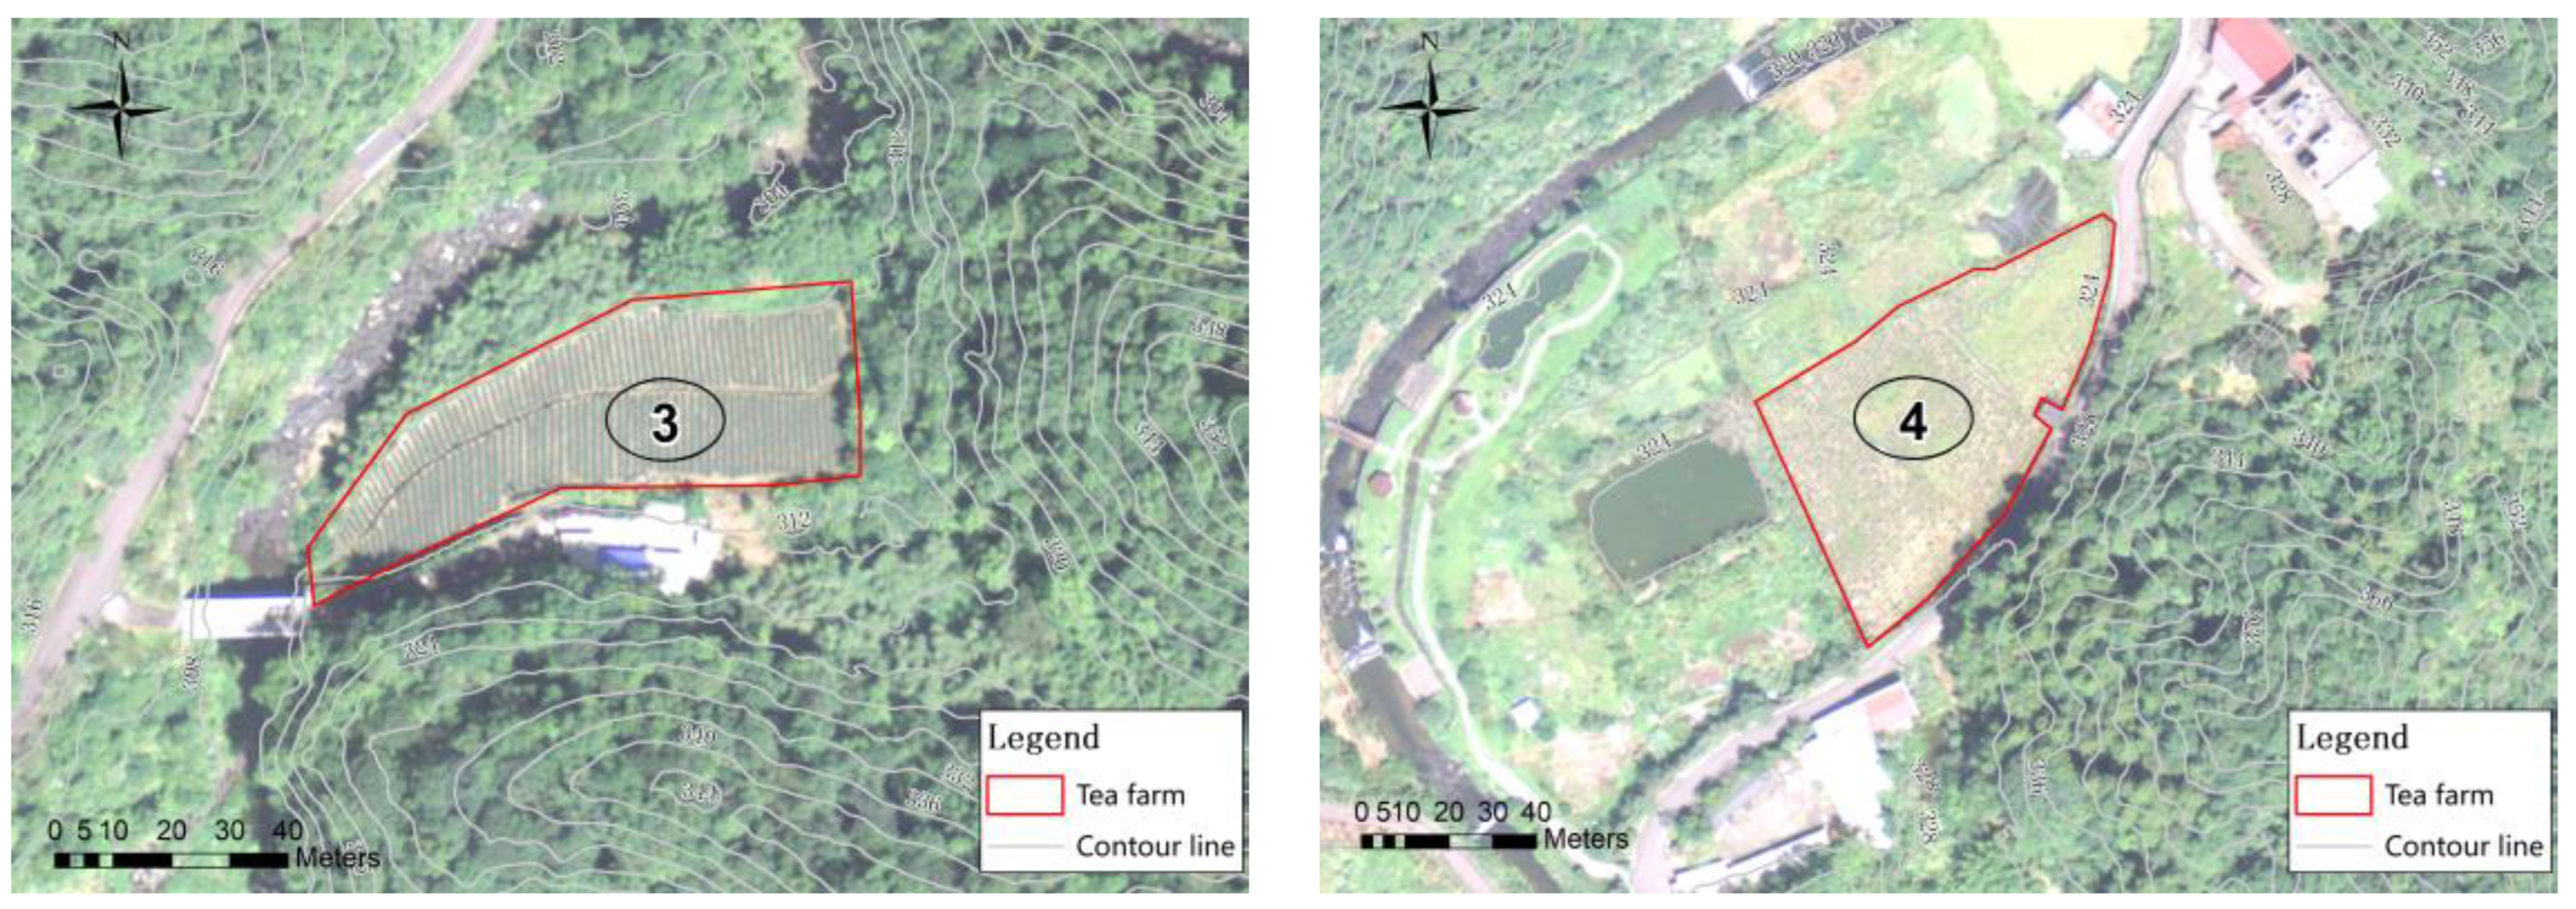
The total areas of bioretention cells were determined for the watershed, and it can also determine the required bioretention area for each single tea farm. Four tea farms in this watershed were demonstrated for the example. The GIS and satellite imagery were used to analyze geographic data such as slope and area for each farm. The validated TPTM was applied to simulate runoff, water quality, and pollutant loads. The photos of the four tea farms are shown in Figure 9.
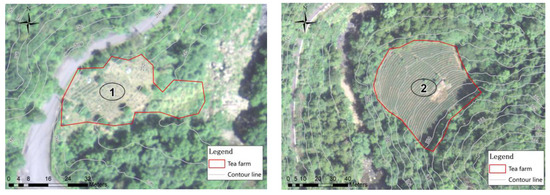
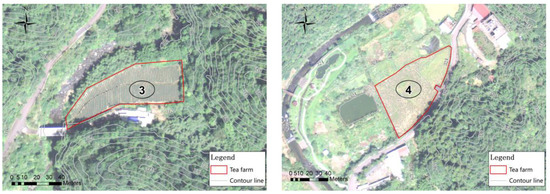
Figure 9.
Contour map and real images of four tea farms.
It has already been determined that each hectare tea farm should reduce 0.369 kg/y TP and 0.417 kg/y TP for 85% and 90% goals, respectively. Therefore, the case tea farms had their required TP reduction loads. While applying the validated TPTM for each tea farm, the required area of bioretention cells to achieve the management goals can be determined through a process of trial and error, in which different areas were set and see which area resulted in the goal. The results of the case of tea farms are summarized in Table 8. The results revealed that for the four tea farms to achieve the short-term goal, a total of 30.0 m2 of bioretention cells would be required. To achieve the long-term goal of a 90% attainment rate, a total of 33.5 m2 of bioretention cells would be necessary. When the required reduction loads are allocated to each tea farm, they could build the bioretention cells, such as Table 8 shows, or they can reduce fertilizer quantity.

Table 8.
Information on tea farms and required pollutant reduction amounts for water quality goals.
4. Conclusions
In Taiwan, tea is a popular economic crop and is usually planted in the upstream areas of a watershed. Its high fertilizer uses could become a potential nonpoint source of pollution, but the specific evaluation of tea farm pollution is few. In this study, the exportation pollution from tea farms was evaluated. The export coefficient of tea farms is 2.55 kg/ha-y of TP and 4.22 kg/ha-y of NH3-N. The results showed that the pollution loads exported from tea farms are lower than in agricultural lands and higher than in forest lands. Bioretention cells were used to reduce the pollution. The field results showed that it effectively reduced the tea runoff, and the reduction rate of SS, COD, TP, and NH3-N was 59.7%, 56.0%, 42.4%, and 37.8%, respectively. In order to link site performance and watershed management, this study provides a quantitative integrated method between watershed-scale and site-scale control policy. It downscales the watershed-scale goal to each site-scale goal. It not only determined the management goals but also the required bioretention cell areas to achieve the goals. A consistent management policy helps to ensure the site measures are effective and match the watershed management goal.
The study quantified pollutant export coefficients from tea farms and used the derived findings to establish recommendations for managing nonpoint source pollution in watersheds. The export coefficients are suggested as the preliminary estimation tool and can quickly obtain the possible pollution loads from tea farms. However, when applying the coefficient, it should be noted that this is suitable for subtropical climate regions. For different climate zones and different rainfall patterns, the value might be underestimated or overestimated. The unit pollution reduction by bioretention cells is also revealed in this study as the reference. In this study, the tea farm nonpoint source pollution is focused; however, the pollution from other sources should be controlled as well. The study addressed the data from onsite fields and applied models. Although the data was derived from the cases in Taiwan, the values, such as export coefficients and unit pollution reduction of unit bioretention cells, should be helpful for similar cases in different areas.
Author Contributions
C.-C.H.: research design, draft writing, and data validation. Y.-Q.S.: data collection and analysis, modeling, and literature review. C.-F.C.: research design, model supervision, manuscript writing. Y.-X.L.: onsite data sampling and water quality analysis. H.-F.L.: resources and results discussion. All authors have read and agreed to the published version of the manuscript.
Funding
This study was supported by the Taipei Water Management Office, Water Resources Agency, Taiwan.
Data Availability Statement
All the data and materials used in this paper were measured by the authors.
Acknowledgments
The authors are grateful to the Editor and anonymous reviewers for their constructive comments and suggestions.
Conflicts of Interest
The authors declare no conflicts of interest. This manuscript has not been published and is not under consideration for publication elsewhere.
References
- Chang, D.; Lai, Z.; Li, S.; Li, D.; Zhou, J. Critical source areas’ identification for non-point source pollution related to nitrogen and phosphorus in an agricultural watershed based on SWAT model. Environ. Sci. Pollut. Res. 2021, 28, 47162–47181. [Google Scholar] [CrossRef] [PubMed]
- Jiang, M.; Chen, H.; Chen, Q.; Wu, H. Study of landscape patterns of variation and optimization based on non-point source pollution control in an estuary. Mar. Pollut. Bull. 2014, 87, 88–97. [Google Scholar] [CrossRef] [PubMed]
- Marques, A.; Martins, I.S.; Kastner, T.; Plutzar, C.; Theurl, M.C.; Eisenmenger, N.; Huijbregts, M.A.; Wood, R.; Stadler, K.; Bruckner, M. Increasing impacts of land use on biodiversity and carbon sequestration driven by population and economic growth. Nat. Ecol. Evol. 2019, 3, 628–637. [Google Scholar] [CrossRef] [PubMed]
- Nobre, R.L.G.; Caliman, A.; Cabral, C.R.; de Carvalho Araújo, F.; Guerin, J.; Dantas, F.d.C.C.; Quesado, L.B.; Venticinque, E.M.; Guariento, R.D.; Amado, A.M. Precipitation, landscape properties and land use interactively affect water quality of tropical freshwaters. Sci. Total Environ. 2020, 716, 137044. [Google Scholar] [CrossRef] [PubMed]
- Lai, Y.; Yang, C.; Hsieh, C.; Wu, C.; Kao, C. Evaluation of non-point source pollution and river water quality using a multimedia two-model system. J. Hydrol. 2011, 409, 583–595. [Google Scholar] [CrossRef]
- Xue, H.; Sayama, T.; Takara, K.; He, B.; Huang, G.; Duan, W. Non-point source pollution estimation in the Pingqiao River Basin, China, using a spatial hydrograph-separation approach. Hydrol. Sci. J. 2019, 64, 962–973. [Google Scholar] [CrossRef]
- Yang, B.; Huang, K.; Sun, D.; Zhang, Y. Mapping the scientific research on non-point source pollution: A bibliometric analysis. Environ. Sci. Pollut. Res. 2017, 24, 4352–4366. [Google Scholar] [CrossRef] [PubMed]
- Zhao, W.; Zhou, Z.; Zhao, Z.; Li, W.; Li, Q. Risk assessment of non-point source pollution in karst reservoirs based on ‘source–sink’landscape theory. Water Supply 2022, 22, 6094–6110. [Google Scholar] [CrossRef]
- Ouyang, W.; Wang, X.; Hao, F.; Srinivasan, R. Temporal-spatial dynamics of vegetation variation on non-point source nutrient pollution. Ecol. Model. 2009, 220, 2702–2713. [Google Scholar] [CrossRef]
- Wang, M.; Jiang, T.; Mao, Y.; Wang, F.; Yu, J.; Zhu, C. Current Situation of Agricultural Non-Point Source Pollution and Its Control. Water Air Soil Pollut. 2023, 234, 471. [Google Scholar] [CrossRef]
- Qiu, J.; Shen, Z.; Chen, L.; Hou, X. Quantifying effects of conservation practices on non-point source pollution in the Miyun Reservoir Watershed, China. Environ. Monit. Assess. 2019, 191, 582. [Google Scholar] [CrossRef]
- Chen, C.F.; Chong, K.Y.; Lin, J.Y. A combined catchment-reservoir water quality model to guide catchment management for reservoir water quality control. Water Environ. J. 2021, 35, 1025–1037. [Google Scholar] [CrossRef]
- Xu, A.; Lai, W.; Chen, P.; Awasthi, M.K.; Chen, X.; Wang, Y.; Xu, P. A comprehensive review on polysaccharide conjugates derived from tea leaves: Composition, structure, function and application. Trends Food Sci. Technol. 2021, 114, 83–99. [Google Scholar] [CrossRef]
- Zhang, Z.; Zhang, X.; Bi, K.; He, Y.; Yan, W.; Yang, C.S.; Zhang, J. Potential protective mechanisms of green tea polyphenol EGCG against COVID-19. Trends Food Sci. Technol. 2021, 114, 11–24. [Google Scholar] [CrossRef] [PubMed]
- Wang, X.; Kato, T.; Tokuda, S. Environmental problems caused by heavy application of nitrogen fertilisers in Japanese tea fields. In Proceedings of the Land Degradation: Papers selected from Contributions to the Sixth Meeting of the International Geographical Union’s Commission on Land Degradation and Desertification, Perth, WA, Australia, 20–28 September 1999; Kluwer Academic Publishers: Dordrecht, The Netherland, 2001; pp. 141–150. [Google Scholar]
- Yan, P.; Shen, C.; Fan, L.; Li, X.; Zhang, L.; Zhang, L.; Han, W. Tea planting affects soil acidification and nitrogen and phosphorus distribution in soil. Agric. Ecosyst. Environ. 2018, 254, 20–25. [Google Scholar] [CrossRef]
- Ruan, J.; Ma, L.; Shi, Y. Potassium management in tea plantations: Its uptake by field plants, status in soils, and efficacy on yields and quality of teas in China. J. Plant Nutr. Soil Sci. 2013, 176, 450–459. [Google Scholar] [CrossRef]
- Tokuda, S.-I.; Hayatsu, M. Nitrous oxide emission potential of 21 acidic tea field soils in Japan. Soil Sci. Plant Nutr. 2001, 47, 637–642. [Google Scholar] [CrossRef]
- Mabaya, G.; Unami, K.; Yoshioka, H.; Takeuchi, J.; Fujihara, M. Robust optimal diversion of agricultural drainage water from tea plantations to paddy fields during rice growing seasons and non-rice growing seasons. Paddy Water Environ. 2016, 14, 247–258. [Google Scholar] [CrossRef]
- Wang, W.; Xie, Y.; Bi, M.; Wang, X.; Lu, Y.; Fan, Z. Effects of best management practices on nitrogen load reduction in tea fields with different slope gradients using the SWAT model. Appl. Geogr. 2018, 90, 200–213. [Google Scholar] [CrossRef]
- Tong, X.; Zhou, Y.; Liu, J.; Qiu, P.; Shao, Y. Non-point source pollution loads estimation in Three Gorges Reservoir Area based on improved observation experiment and export coefficient model. Water Sci. Technol. 2022, 85, 27–38. [Google Scholar] [CrossRef]
- Wu, L.; Gao, J.; Ma, X.; Li, D. Application of modified export coefficient method on the load estimation of non-point source nitrogen and phosphorus pollution of soil and water loss in semiarid regions. Environ. Sci. Pollut. Res. 2015, 22, 10647–10660. [Google Scholar] [CrossRef] [PubMed]
- Yuan, L.; Sinshaw, T.; Forshay, K.J. Review of watershed-scale water quality and nonpoint source pollution models. Geosciences 2020, 10, 25. [Google Scholar] [CrossRef] [PubMed]
- Zhang, P.; Liu, Y.; Pan, Y.; Yu, Z. Land use pattern optimization based on CLUE-S and SWAT models for agricultural non-point source pollution control. Math. Comput. Model. 2013, 58, 588–595. [Google Scholar] [CrossRef]
- Lee, S.-B.; Yoon, C.-G.; Jung, K.W.; Hwang, H.S. Comparative evaluation of runoff and water quality using HSPF and SWMM. Water Sci. Technol. 2010, 62, 1401–1409. [Google Scholar] [CrossRef]
- Cai, Y.; Rong, Q.; Yang, Z.; Yue, W.; Tan, Q. An export coefficient based inexact fuzzy bi-level multi-objective programming model for the management of agricultural nonpoint source pollution under uncertainty. J. Hydrol. 2018, 557, 713–725. [Google Scholar] [CrossRef]
- Wang, W.; Chen, L.; Shen, Z. Dynamic export coefficient model for evaluating the effects of environmental changes on non-point source pollution. Sci. Total Environ. 2020, 747, 141164. [Google Scholar] [CrossRef] [PubMed]
- Johnes, P.J. Evaluation and management of the impact of land use change on the nitrogen and phosphorus load delivered to surface waters: The export coefficient modelling approach. J. Hydrol. 1996, 183, 323–349. [Google Scholar] [CrossRef]
- Meng, C.; Liu, H.; Wang, Y.; Shen, J.; Liu, F.; Xia, Y.; Li, Y.; Wu, J. Landscape pattern exhibits threshold-driven effect on nitrogen export of typical land use in subtropical hilly watershed under specific hydrological regimes. J. Clean. Prod. 2023, 419, 138322. [Google Scholar] [CrossRef]
- Xin, Z.; Ye, L.; Zhang, C. Application of export coefficient model and QUAL2K for water environmental management in a rural watershed. Sustainability 2019, 11, 6022. [Google Scholar] [CrossRef]
- Endreny, T.A.; Wood, E.F. Watershed weighting of export coefficients to map critical phosphorous loading areas. JAWRA J. Am. Water Resour. Assoc. 2003, 39, 165–181. [Google Scholar] [CrossRef]
- Lian, H.; Lei, Q.; Zhang, X.; Yen, H.; Wang, H.; Zhai, L.; Liu, H.; Huang, C., Jr.; Ren, T.; Zhou, J.; et al. Effects of anthropogenic activities on long-term changes of nitrogen budget in a plain river network region: A case study in the Taihu Basin. Sci. Total Environ. 2018, 645, 1212–1220. [Google Scholar]
- Guo, Y.; Wang, X.; Melching, C.; Nan, Z. Identification method and application of critical load contribution areas based on river retention effect. J. Environ. Manag. 2022, 305, 114314. [Google Scholar] [CrossRef] [PubMed]
- Ho, C.-C.; Huang, C.-L. The Widespread Setting and Effectiveness Evaluation of On-Site LID Facilities for Non-Point Source Pollution Reduction of Tea Farms in Taipei Water Source Domain in 2020; Taipei Water Management Office, Water Resources Agency: New Taipei City, Taiwan, 2020. (In Chinese)
- Ho, C.-C.; Chen, C.-F.; Lee, T.-Y. The Widespread Setting and Effectiveness Evaluation of On-Site LID Facilities for Non-Point Source Pollution Reduction of Tea Farms in Taipei Water Source Domain in 2021; Taipei Water Management Office, Water Resources Agency: New Taipei City, Taiwan, 2021. (In Chinese)
- Ho, C.-C.; Chen, C.-F.; Lee, T.-Y. The Widespread Setting and Effectiveness Evaluation of On-Site LID Facilities for Non-Point Source Pollution Reduction in Taipei Water Source Domain; Taipei Water Management Office, Water Resources Agency: New Taipei City, Taiwan, 2022. (In Chinese)
- Ho, C.-C.; Chen, C.-F.; Chiang, L.-C. NBS Strategy Analysis and Application Plan for Non-Point Source Pollution Reduction in Taipei Water Source Domain; Taipei Water Management Office, Water Resources Agency: New Taipei City, Taiwan, 2023. (In Chinese)
- Goh, H.W.; Lem, K.S.; Azizan, N.A.; Chang, C.K.; Talei, A.; Leow, C.S.; Zakaria, N.A. A review of bioretention components and nutrient removal under different climates—Future directions for tropics. Environ. Sci. Pollut. Res. 2019, 26, 14904–14919. [Google Scholar] [CrossRef] [PubMed]
- Ho, C.-C.; Lin, Y.-X. Pollutant Removal Efficiency of a Bioretention Cell with Enhanced Dephosphorization. Water 2022, 14, 396. [Google Scholar] [CrossRef]
- Davis, A.P.; Shokouhian, M.; Sharma, H.; Minami, C. Laboratory study of biological retention for urban stormwater management. Water Environ. Res. 2001, 73, 5–14. [Google Scholar] [CrossRef]
- Beaulac, M.N.; Reckhow, K.H. An examination of land use-nutrient export relationships. JAWRA J. Am. Water Resour. Assoc. 1982, 18, 1013–1024. [Google Scholar] [CrossRef]
- Dillon, P.; Kirchner, W. The effects of geology and land use on the export of phosphorus from watersheds. Water Res. 1975, 9, 135–148. [Google Scholar] [CrossRef]
- Rossman, L.A. Storm Water Management Model User’s Manual—Version 5.0, United States Environmental Protection Agency; Water Supply and Water Resources Division, National Risk Management Research Laboratory: Cincinnati, OH, USA, 2010. [Google Scholar]
- Zhang, K.; Chui, T.F.M.; Yang, Y. Simulating the hydrological performance of low impact development in shallow groundwater via a modified SWMM. J. Hydrol. 2018, 566, 313–331. [Google Scholar] [CrossRef]
- Moriasi, D.N.; Gitau, M.W.; Pai, N.; Daggupati, P. Hydrologic and water quality models: Performance measures and evaluation criteria. Trans. ASABE 2015, 58, 1763–1785. [Google Scholar]
- Kourtis, I.; Kopsiaftis, G.; Bellos, V.; Tsihrintzis, V. Calibration and validation of SWMM model in two urban catchments in Athens, Greece. In Proceedings of the International Conference on Environmental Science and Technology (CEST), Rhodes, Greece, 31 August–2 September 2017. [Google Scholar]
- Hou, L.; Zhou, Z.; Wang, R.; Li, J.; Dong, F.; Liu, J. Research on the non-point source pollution characteristics of important drinking water sources. Water 2022, 14, 211. [Google Scholar] [CrossRef]
- Reza, A.; Eum, J.; Jung, S.; Choi, Y.; Owen, J.S.; Kim, B. Export of non-point source suspended sediment, nitrogen, and phosphorus from sloping highland agricultural fields in the East Asian monsoon region. Environ. Monit. Assess. 2016, 188, 692. [Google Scholar] [CrossRef] [PubMed]
- Tong, X.; Hu, B.; Xu, W.; Liu, J.; Zhang, P. The estimation of the load of non-point source nitrogen and phosphorus based on observation experiments and export coefficient method in Three Gorges Reservoir Area. Proc. IOP Conf. Ser. Earth Environ. Sci. 2017, 100, 012181. [Google Scholar] [CrossRef]
- Duan, M.; Du, X.; Peng, W.; Jiang, C.; Zhang, S.; Ding, Y. Quantitative assessment of background pollutants using a modified method in data-poor regions. Environ. Monit. Assess. 2020, 192, 160. [Google Scholar] [CrossRef] [PubMed]
- Zhu, J.Z.; Mazumder, A. Estimating nitrogen exports in response to forest vegetation, age and soil types in two coastal-forested watersheds in British Columbia. For. Ecol. Manag. 2008, 255, 1945–1959. [Google Scholar] [CrossRef]
- Wen, Q.; Chen, X.; Shi, Y.; Ma, J.; Zhao, Q. Analysis on Composition and Pattern of Agricultural Nonpoint Source Pollution in Liaohe River Basin, China. Procedia Environ. Sci. 2011, 8, 26–33. [Google Scholar] [CrossRef]
- Osman, M.; Wan Yusof, K.; Takaijudin, H.; Goh, H.W.; Abdul Malek, M.; Azizan, N.A.; Ab. Ghani, A.; Sa’id Abdurrasheed, A. A review of nitrogen removal for urban stormwater runoff in bioretention system. Sustainability 2019, 11, 5415. [Google Scholar] [CrossRef]
- Yu, S.L.; Kuo, J.-T.; Fassman, E.A.; Pan, H. Field test of grassed-swale performance in removing runoff pollution. J. Water Resour. Plan. Manag. 2001, 127, 168–171. [Google Scholar] [CrossRef]
- Jiang, C.; Li, J.; Li, H.; Li, Y.; Chen, L. Field performance of bioretention systems for runoff quantity regulation and pollutant removal. Water Air Soil Pollut. 2017, 228, 468. [Google Scholar] [CrossRef]
- Lucke, T.; Nichols, P.W. The pollution removal and stormwater reduction performance of street-side bioretention basins after ten years in operation. Sci. Total Environ. 2015, 536, 784–792. [Google Scholar] [CrossRef]
Disclaimer/Publisher’s Note: The statements, opinions and data contained in all publications are solely those of the individual author(s) and contributor(s) and not of MDPI and/or the editor(s). MDPI and/or the editor(s) disclaim responsibility for any injury to people or property resulting from any ideas, methods, instructions or products referred to in the content. |
© 2024 by the authors. Licensee MDPI, Basel, Switzerland. This article is an open access article distributed under the terms and conditions of the Creative Commons Attribution (CC BY) license (https://creativecommons.org/licenses/by/4.0/).

