Abstract
This paper analyses the effects of environmental flows on water quality within a highly regulated basin, focusing on the Turia River basin in the eastern Iberian Peninsula. Through water management and water quality models, a series of simulations were conducted, introducing variations in the outflows of the Loriguilla reservoir to evaluate the effects of different environmental flow scenarios on water quality, particularly at the location of the intake for the water supply to Valencia. Three environmental flow scenarios were analyzed, alongside an alternative management scenario, considering their implications on water quality and reliability of water demand. The findings of this paper, particularly the nitrate (NO3−) concentration evolution, highlight the influence of minimum e-flow and e-flow regimes on water quality within the basin. These results suggest that while modifying the current flow regime can lead to some improvements in nitrate concentrations at the Valencia supply intake point, the primary cause of high nitrate concentrations is attributed to irrigation return flow and the pre-existing contamination of the aquifer. This analysis offers valuable insights into the complexities of water quality management in regulated basins, emphasizing the need for a multi-faceted approach to address the diverse factors influencing water quality and demand supply reliability.
1. Introduction
Water is one of the most essential resources, playing a pivotal role in supporting life on our planet and facilitating a range of human activities [1,2]. The effective management of water resources is crucial in securing a sustainable supply of clean water for present and future generations [3,4]. This involves maintaining a delicate equilibrium amid competing demands and addressing multifaceted challenges, including water scarcity, contamination, and the repercussions of climate change [5,6].
The quality of surface water represents one of the most vulnerable variables influenced by the dynamics of population growth and socioeconomic development [7]. As communities expand and industrialize, it becomes increasingly imperative to delve into the potential impacts of pollution on rivers and aquatic ecosystems. The assessment of the water resources quality is a major concern in the realm of environmental protection policy. The significance of this endeavor cannot be overstated, as it has a direct impact not only on the health and well-being of human populations but also on the overall ecological balance [8,9].
Water quality monitoring entails a comprehensive assessment of various parameters such as chemical composition, physical characteristics, and biological indicators of water bodies, including rivers, lakes, oceans, and groundwater sources [10,11]. To assess the overall impact of these measures on a global scale, it is essential to employ a comprehensive visualization of the entire river basin [12]. This visualization should consider how actions within the basin are interconnected and influence each other [13]. By closely examining these parameters, policymakers and environmental scientists can gain crucial insights into the state of aquatic ecosystems, identifying potential contaminants, pollutants, and threats to biodiversity.
Environmental flows (e-flows) represent the water quantity and hydrological regime required to maintain the health and integrity of aquatic ecosystems [14,15]. They serve multiple vital functions, primarily preserving the habitat of diverse aquatic organisms, including fish and other wildlife [16]. This preservation is fundamental for their continued existence, making a substantial contribution to biodiversity conservation [17,18]. Secondly, they fulfil a pivotal function in maintaining water quality by effectively diluting pollutants and preventing the accumulation of contaminants within aquatic ecosystems [19]. Additionally, e-flows safeguard the ecological equilibrium in rivers, guaranteeing their enduring sustainability [20,21].
Several authors have highlighted the necessity of considering the impact of environmental river flow when evaluating water quality in rivers [22,23,24]. Testing various e-flow scenarios becomes essential to understanding how alterations in flow regimes can impact water quality parameters such as nitrate concentrations. Different e-flow scenarios can significantly influence the levels of nitrates and conductivity in rivers, impacting water quality and ecosystem health. Therefore, it is imperative to assess and model these scenarios to comprehend the potential ecological consequences [17,25].
Nitrates present a complex challenge when establishing a threshold concentration due to their numerous natural and human-induced sources, as well as their reactivity [26,27]. Nitrate contamination is predominantly a concern in agricultural regions, with urban areas also affected to some extent [28,29]. The nitrate thresholds in rivers can vary depending on regional regulations, environmental conditions, and intended uses of water. However, as a general guideline, nitrate concentrations in rivers are often monitored to ensure they remain below certain levels to protect aquatic ecosystems and human health. The World Health Organization (WHO) recommends a maximum nitrate-nitrogen concentration of 10 mg/L in drinking water to safeguard human health. In the European Union (EU) Water Framework Directive, the threshold for nitrate concentration in rivers is 50 mg/L as a maximum allowable concentration to prevent eutrophication and protect aquatic ecosystems.
Decision Support Systems (DSS), computer-based tools that help users make informed decisions by providing data analysis, modeling and visualization, play an important role in assessing the effects of e-flows on water quality in rivers. They integrate data, employ modeling and simulations to predict how water quantity and/or quality respond to changes in flow patterns, analyze various flow scenarios, assess risks, and ensure compliance with standards. DSS also facilitate real-time monitoring, public engagement, and adaptive management, empowering informed decision-making in sustainable water resources management [30,31,32,33,34,35,36]. These systems enhance communication and visualization to convey complex information to stakeholders and support long-term planning by considering cumulative effects.
The main objective of this work is to analyze the implications of minimum e-flows and e-flow regimes on nitrate concentrations and reliability of water demands in a highly regulated river basin. This methodology is illustrated through the case study of the Turia River Basin, where one of the biggest problems faced is the nitrate concentrations produced by irrigation returns in the middle part of the basin. By delving into the intricacies of nitrate dynamics across scenarios and time periods, the aim is to provide valuable insights for decision-makers and water resource managers.
2. Study Area
The Turia River basin is located in the eastern part of the Iberian Peninsula, in Spain. Administratively, it falls under the jurisdiction of the Júcar River Basin Agency. The basin covers a total area of 6394 km2 and is drained by the Turia River, which ultimately flows into the Mediterranean Sea (Figure 1). The region experiences a Mediterranean semi-arid climate characterized by irregular rainfall and seasonal summer scarcity, particularly during peak irrigation demands. On average, the annual precipitation is 450 mm/year [37]. The focus of this study is the lower-middle basin of the river, which is situated between the Loriguilla reservoir and the water supply intake for Valencia, referred to as “La Presa”. This area is heavily impacted by human activities and holds the highest quantitative and qualitative significance due to the concentration of environmental uses and pressures within it. The nitrate concentrations in the Loriguilla reservoir inflows remain consistently low, and within the reservoir itself, there is no perceptible impact on nitrate levels, either reduction or increase.
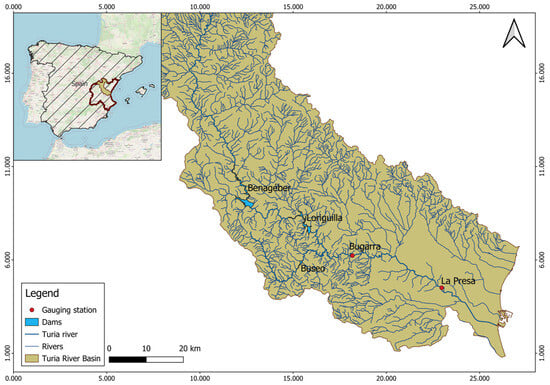
Figure 1.
Location of the Turia River Basin (eastern Spain).
3. Methodology
The methodology unfolds in a structured sequence of steps, as illustrated in Figure 2. It begins with an initial phase comprising data collection, data analysis, and an in-depth exploration of the challenges encountered within the basin. Then, a two-step modeling approach is used. First, a basin management model is developed to suit the basin’s specific features (SIMGES model). Next, a water quality model is created (GESCAL model) which is linked to SIMGES within the AQUATOOL DSS [38]. These models draw upon input data primarily encompassing physical characteristics and operational rules. They are primed to simulate minimum flow scenarios, generating water quality indicators that enable comparative assessments of different scenarios. Simultaneously, water demand reliability computations are conducted, a pivotal criterion in the context of e-flow considerations. The final phase of the study entails the presentation of a proposed management scenario for water quality improvement, offering a comprehensive strategy for addressing water quality issues within the basin.
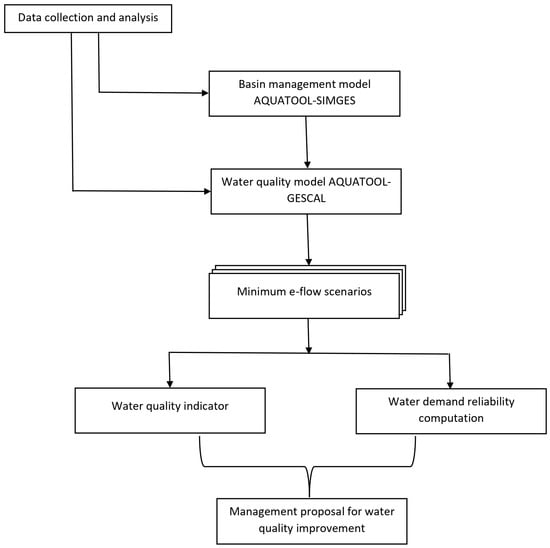
Figure 2.
Flow chart of the proposed methodology.
3.1. Data Collection and Analysis
The data for the water management model were obtained from the hydrological plan of the study basin, which includes data related to storage and operating rules of reservoirs, flows in channels and river stretches, water demand in the basin (urban and agricultural), e-flow regimes, aquifers, etc. In the case study analyzed in this work, this information was available in the Hydrological Plan of the Júcar River Basin [37]. This dataset was instrumental for understanding the structure and dynamics of the study area and shaping the water management model.
For the water quality model, nitrate concentrations were sourced from a previous study [39]. This dataset, covering a 27-year period from 1993 to 2020 and collected from four sampling points within the Turia River basin, contributed the foundational data for the subsequent development of a robust water quality model.
Temporal series of nitrate concentrations and natural inflows in the basin were analyzed to identify anomalous data and potential gaps and to fill in any missing information. It included implementing statistical techniques such as regression analysis and correlation analysis to examine the presence of any patterns, trends, and relationships in the dataset.
3.2. Water Management Model
The current water management of the basin was simulated using the SIMGES module of the AQUATOOL DSS. It is a mathematical model designed for simulating operational management of water resource systems, allowing for the analysis of complex water resource systems. The DSS control unit converts the developed scheme into a numerical format suitable for the model while also providing the necessary data from databases needed to run the model. Water resource management is executed through priorities and operational rules designed to maintain consistent reservoir storage levels based on predefined reservoir zoning curves. These operating rules are provided by the user and can include specifications for e-flow and various water use priorities.
In this paper, the SIMGES model was applied to the Turia water resources system, incorporating 60 river stretches, 3 reservoirs, 11 runoff elements, 1 hydropower station, 7 agricultural demands, 6 urban demands, 6 aquifers, and 49 nodes (Figure 3). Prior to this study, the model was calibrated during the elaboration of the Hydrological Plan for the Júcar River basin [37]. The model calibration involved comparing actual volumes measured at the main gauging stations with the volumes simulated by the model for the period from October 1993 to December 2020.
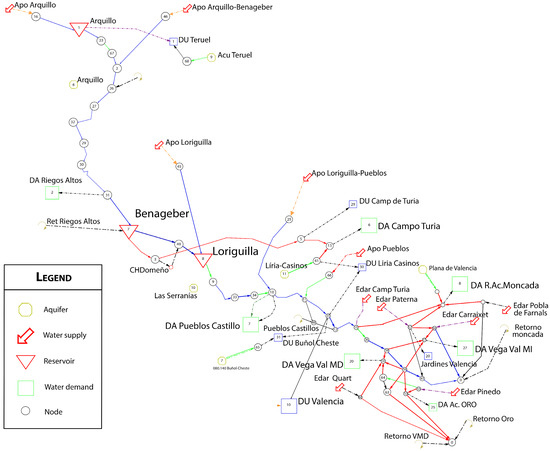
Figure 3.
Topology of the water management model generated in SIMGES.
3.3. Water Quality Model
The water quality model for the basin was simulated using the GESCAL water quality simulation model, which is also integrated into the AQUATOOL DSS for water resource planning and management. GESCAL facilitates the analysis of water quality dynamics in rivers, reservoirs, and entire water resource systems, considering runoff quality and demand discharges. To use GESCAL, it is necessary to first develop a flow simulation model with the SIMGES module of AQUATOOL. This joint approach allows for the modeling of both water management and quality within a single tool.
This module does not attempt to represent the evolution of water quality in the face of specific events but rather to reflect the spatial-temporal evolution of water quality in the modeled systems. It is capable of modeling various water constituents, including temperature, biochemical oxygen demand (BOD), dissolved oxygen, organic nitrogen, ammonium, nitrates, organic phosphorous, phosphates, Chlorophyll-a, toxins, and other specific constituents. In this work, the GESCAL model was coupled to the SIMGES model incorporating data related to nitrate concentrations. The calibration of the Gescal model focused on adjusting the parameters governing physical, chemical, and biological processes.
3.4. Environmental Flow Scenarios
The water management and water quality models were simulated under three distinct e-flow scenarios to assess the effects of minimum e-flows and e-flow regimes on water quality, particularly regarding nitrates: (1) Scenario 1 represents the historical e-flow; (2) Scenario 2 is based on the current environmental e-flow, with a minimum e-flow greater than that in Scenario 1; (3) Scenario 3 is a proposed scenario in which the minimum e-flow of Scenario 2 is maintained while modifying its regime.
3.4.1. Scenario 1: Historical Scenario
In this scenario, modifications were introduced to the e-flow within a specific river stretch, a choice made based on its representative character regarding the average natural flow contribution. The selection criteria for this adjustment focused on identifying river sections with the most substantial contribution to the natural flow relative to other sections in the basin. Consequently, the e-flow applied to this chosen river section mirrors the minimum historical e-flow that had previously been established in the basin. The primary objective of this scenario is to review the effects of reverting to the minimum historical flow on the quality of the main water demand intake in the basin. This is instrumental in comprehending the repercussions when e-flow provisions are minimal and the maintenance of only the minimum historical flow is sustained.
3.4.2. Scenario 2: Current Basin Plan Scenario
This scenario is based on the current e-flows specified in the Hydrological Basin Plan for 2022–2027 [37]. It is designed to achieve two primary objectives; first, to assess the existing water quality conditions at the main water demand intake location under the current e-flow regulations as proposed in the hydrological plan; second, to analyze the effects of variations in minimum e-flow on nitrate concentration.
3.4.3. Scenario 3: Proposed Scenario for Analyzing the Role of E-Flow Regimes
Scenario 3 focuses on maintaining the minimum e-flow while modifying its regime to reduce the maximum nitrate concentration values. The proposal for the new e-flow regime was developed while retaining the total annual volume. It is formulated based on an analysis of water quality data in the studied sections of the basin, particularly during the months when there is the highest concentration of contaminants, with a specific focus on nitrate concentration. In response, an increase in flow during these months was recommended as part of this new regime to address and improve water quality conditions.
3.5. Additional Management Flow Scenario
A fourth scenario was introduced, involving a strategic adjustment in the location of the main water demand intake, with a focus on nitrate concentration while retaining the current e-flow (Scenario 2). This adjustment is expected to have a significant impact on reducing the pollutant concentrations. The scenario aims to illustrate that water quality in rivers can be influenced by various factors within the basin not limited only to e-flows. It also assists in identifying potential sources of contaminants, offering valuable insights for decision-makers to consider when addressing water quality concerns and making informed choices regarding relevant elements within the basin. This scenario underscores the multifaceted nature of factors that influence water quality in river systems.
3.6. Water Supply Reliability Comparison
Across all scenarios, a comprehensive assessment of the annual, biannual, and decadal reliabilities for both agricultural and urban water demands was conducted. This assessment was carried out in accordance with the criteria delineated in the Spanish water planning regulations, as specified by MARM [40]. The aim was to ensure that the various water demand components met the prescribed standards and criteria, thereby upholding the integrity of water supply and allocation within the study area.
4. Results and Discussion
4.1. Nitrate Concentration Analysis for the E-Flow Scenarios
The analysis focused on nitrate concentrations at the Valencia water demand intake point, specifically to evaluate the effects of e-flows immediately downstream of the Loriguilla reservoir on the quality of the water supplied to Valencia.
Figure 4 illustrates an overview of the annual maximum nitrate concentrations obtained for the three simulated scenarios. Each scenario exhibits varying peaks in nitrate concentration levels, with some instances reaching as high as 60 mg/L. Notably, these values exceed the regulatory threshold set by the EU directive 2020/2184 of the European Parliament and the Council on 16 December 2020, which specifies water quality standards for human consumption [41]. The nitrate concentration levels in the scenarios range between 20 mg/L and 60 mg/L, highlighting a consistent concern regarding elevated nitrate levels at the intake point for the water supply to Valencia.
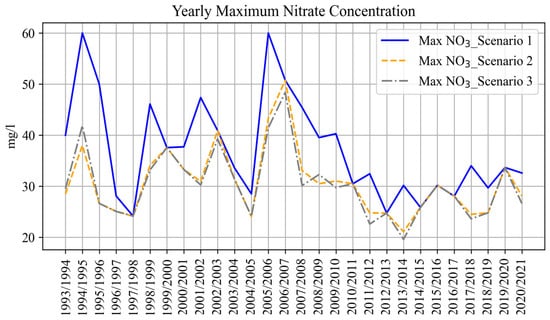
Figure 4.
Maximum nitrate concentration profiles simulated with the GESCAL model.
To study the effects of e-flows, specifically regarding minimum e-flows and e-flow regimes, on nitrate concentrations, the analysis concentrated on a critical period encompassing two consecutive years of severe drought, the hydrological years 2005/2006 and 2006/2007. The objective was to assess the effects of e-flow scenarios under critical conditions that warrant special attention in terms of nitrate concentration. The choice of this specific timeframe was predicated on its association with the highest annual nitrate concentrations among the scenarios. This observed seasonal pattern holds considerable significance for the management of water quality and the overall health of the ecosystem [33,42].
4.2. Effects of Minimum E-Flows on Water Quality
In this section, the impact of minimum e-flows on water quality is analyzed, specifically focusing on the e-flow downstream of the Loriguilla dam. Scenario 1, which represents the historical conditions, is compared to Scenario 2, which represents the current minimum e-flow scenario. Figure 5 illustrates the nitrate concentration levels for these two scenarios. The nitrate concentrations in both scenarios are notably elevated, reaching levels of up to 60 mg/L in Scenario 1 and exceeding 50 mg/L in Scenario 2 during specific years. This comparative analysis highlights that the historical e-flow scenario consistently displays higher maximum nitrate concentrations when compared to the current scenario (scenario 2). The main factor contributing to this difference is the higher values of the minimum e-flow in Scenario 2.
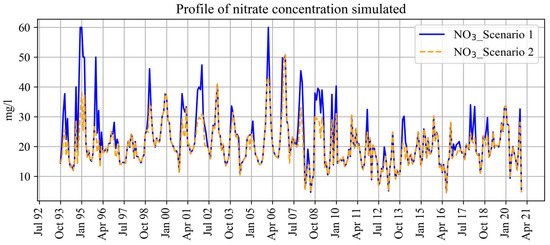
Figure 5.
Evolution of nitrate concentration simulated using the GESCAL model for Scenarios 1 and 2.
During the drought period from 2005 to 2007, where the maximum nitrate concentrations were registered, a distinctive pattern emerges in the analysis of nitrate concentrations, with higher levels predominantly occurring during the months from October to February in both scenarios (Figure 6). In January 2006, Scenario 1 registered the highest nitrate concentration at 60 mg/L, while Scenario 2 exhibited a maximum nitrate concentration of 43 mg/L. This observation highlights a 28% reduction in the maximum nitrate concentrations in Scenario 2 compared to Scenario 1, where the historical minimum flow was maintained. The same trend is observed in November 2006, with Scenario 1 registering 50 mg/L while Scenario 2 recorded 33 mg/L. This underscores the significant impact of modifying the minimum e-flow downstream of Loriguilla in mitigating nitrate concentrations, particularly during periods characterized by elevated nitrate concentration values [39].
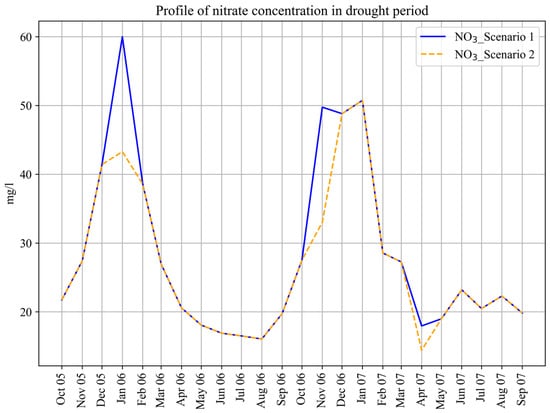
Figure 6.
Evolution of nitrate concentration simulated using the GESCAL model for Scenarios 1 and 2 during the drought period.
4.3. Effects of the E-Flow Regimes on Water Quality
This section focuses on examining the impact of e-flow regimes on water quality, specifically comparing Scenario 3 with Scenario 2. Scenario 3 represents the proposed e-flow regime based on the minimum e-flow considered in Scenario 2, maintaining the same water volume in both scenarios. Figure 7 provides a clear visualization of the nitrate concentration levels for these two scenarios, highlighting distinct differences, particularly during peak nitrate concentration periods. Scenario 3 consistently exhibits lower values of nitrate concentrations, especially when nitrate concentrations are at their highest, compared to Scenario 2. This decrease in nitrate concentration values is primarily observed during periods characterized by elevated nitrate levels. It is worth mentioning, however, that implementing this proposed e-flow regime for a single river stretch (downstream of Loriguilla) represents a step towards improving nitrate levels in the intake for water supply to Valencia. However, this reduction in nitrate concentrations must be assessed in conjunction with water demand reliability for various water demand units within the study area. The effectiveness of the e-flow regime should consider the overall water management and reliability of water demands, as is analyzed in Section 4.5.
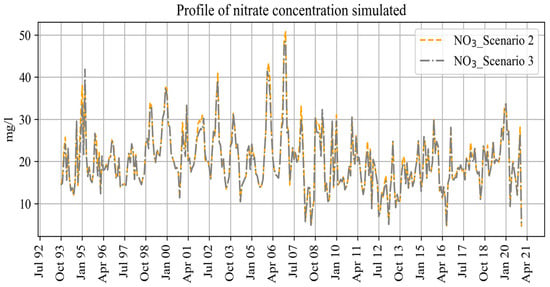
Figure 7.
Evolution of nitrate concentration simulated using the GESCAL model for Scenarios 2 and 3.
During the same drought period of 2005–2007, characterized by higher nitrate concentrations in both scenarios, a difference is observed between Scenario 3 and Scenario 2 (Figure 8). Scenario 3 consistently leads to lower concentration values, particularly during the peak nitrate concentration periods. In January 2007, both scenarios registered the highest nitrate concentration values, with Scenario 2 reaching 51 mg/L, exceeding the allowable limit set by the EU water framework directive. In contrast, Scenario 3 recorded a concentration of 48 mg/L, staying below this threshold. This represents a 6% reduction in high nitrate concentration values. For January 2006, a more substantial reduction percentage was observed. It can be inferred that the new proposed e-flow regime has a notable effect on reducing nitrate values, particularly during periods of elevated nitrate concentrations [43].
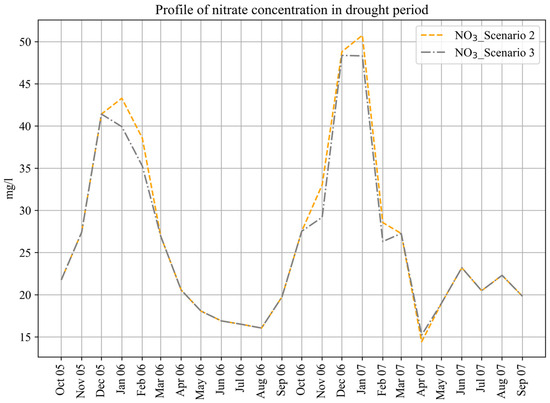
Figure 8.
Evolution of nitrate concentration simulated using the GESCAL model for Scenarios 2 and 3 during the drought period.
4.4. Effects of Relocating the Intake for Urban Water Supply
The analysis of the impact of relocating the intake for water supply to Valencia (Figure 9) reveals a substantial reduction in nitrate concentration values. Figure 10 demonstrates that the average nitrate concentration value in Scenario 4 is approximately 5 mg/L, in stark contrast to the average concentration in Scenario 2 with an average of about 27 mg/L.
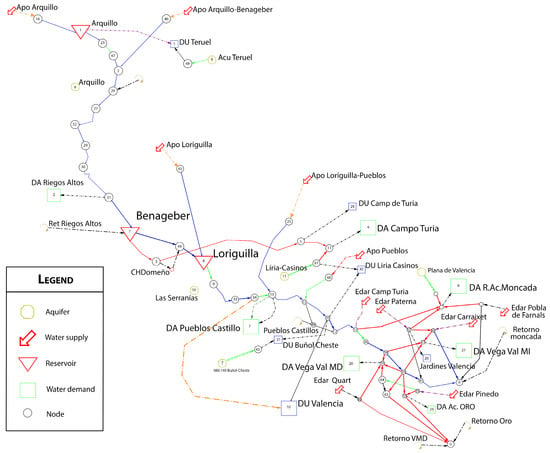
Figure 9.
Topology of the water management model after the change made for Valencia water demand intake (red dashed line).
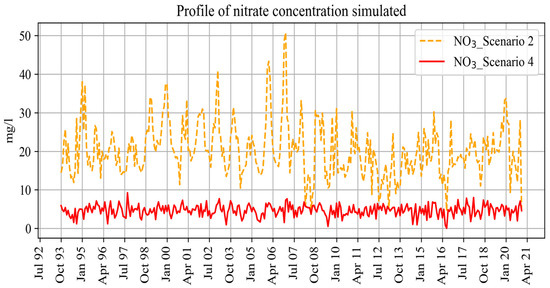
Figure 10.
Evolution of nitrate concentration simulated using the GESCAL model for Scenarios 2 and 4.
Over the entire simulation period from October 1993 to September 2020, the values registered for Scenario 4 consistently fell within a similar range, with no abrupt peaks in nitrate concentrations. These results suggest that moving the Valencia water supply intake upstream within the river basin, just before the main agricultural water demands, can make a substantial difference in terms of enhancing the water quality designated for the supply to Valencia, since the water supplied is not affected by the contaminated water returns derived from agricultural water demands.
Nitrate concentrations in the downstream section of the basin are primarily influenced by two key factors. The first factor is the return of agricultural irrigation runoff, which contributes to elevated nitrate levels in the river. The second significant factor is the fact that 90% of the river flow in this part of the basin is sourced from the Buñol-Cheste aquifer. This aquifer is characterized by complex hydrogeological features due to the presence of multiple aquifer segments from the Tertiary and Mesozoic periods which affects its hydrogeological behavior [44].
The combination of these factors results in exceptionally high nitrate concentrations when the Valencia water demand intake is located downstream (Scenarios 1, 2, and 3). Moreover, the water from the Loriguilla reservoir is predominantly allocated to other agricultural water demands before it reaches the location where the Valencia water demand intake is positioned (“La Presa”). This arrangement prevents the dilution of nitrate concentrations further downstream, exacerbating the issue of high nitrate levels in the water supply. At this location, the river is heavily influenced by the aquifer, which is already contaminated with nitrates. Consequently, the high nitrate concentrations in the Valencia water supply point are primarily attributed to the aquifer’s nitrate contamination.
During the drought period from 2005 to 2007, the nitrate concentration at the Valencia water supply intake in Scenario 4 averaged around 5 mg/L (Figure 11). This value aligns with the WHO’s recommendations for nitrate levels in drinking water, indicating a significant improvement in water quality compared to Scenario 2, where nitrate concentrations reached maximum values up to 50 mg/L. This suggests that the elevated nitrate concentrations recorded in the previous scenarios are likely attributed to water runoff and infiltration derived from agricultural uses. The relocation of the Valencia water demand intake upstream of the river basin would effectively reduce nitrate levels, providing water of high quality for human consumption.
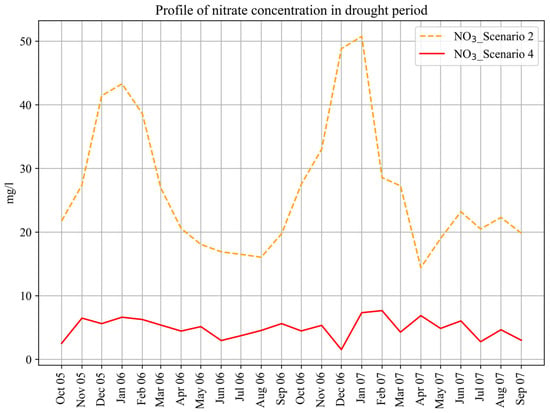
Figure 11.
Evolution of nitrate concentration simulated using the GESCAL model for Scenarios 2 and 4 during the drought period.
4.5. Impact on Water Demand Reliability
The effectiveness of e-flows scenarios should also consider their effects on the reliability of the water demands of the basin. This integrated approach ensures a comprehensive understanding of the factors influencing water quality and water supply in the region. For this reason, in addition to assessing nitrate concentrations, it is imperative to examine the impact of these scenarios on water demand reliability within the studied basin. It is important to note that only the results of reliability of agricultural water demands are reported in this section, as urban water demand did not face deficits. This is in line with Spanish water planning regulations (MARM, 2008), which prioritize urban demands in the allocation of available water resources.
Table 1 provides an overview of the annual, biannual, and decadal water demand reliabilities for the four simulated scenarios. Remarkably, all scenarios consistently meet the annual reliability criteria for agricultural water demand, with deficits well below the specified 50% threshold of the annual demand. Similarly, the biannual reliability criteria for agricultural water demand are consistently fulfilled across all scenarios.

Table 1.
Annual, biannual, and decadal water demand reliabilities obtained for the four scenarios simulated. The green color indicates that the water supply criteria are met, whereas the red signifies a failure to meet these criteria.
However, when assessing decadal reliability, Scenario 1 consistently meets the criteria, with deficits remaining below the 100% threshold for all water demand units. In contrast, Scenarios 2 and 3 exhibit similar patterns in terms of decadal reliability, where a significant portion of water demand units experience failures. It is important to highlight that Scenarios 2 and 4 share identical water demand reliability values, as the difference between these scenarios lies solely in the Valencia water demand intake location, without any modifications to the minimum e-flow or e-flow regime.
5. Conclusions
This work has jointly applied water management and water quality models to assess the effects of minimum e-flows and e-flow regimes on nitrate concentrations for urban supply within the Turia River basin. Three distinct e-flow scenarios were modelled using the SIMGES and GESCAL models, covering a range of environmental and hydrological conditions. These scenarios included a historical baseline, representing the minimum historical e-flow, a contemporary scenario aligned with the Basin Hydrological Plan for 2022-2027, and a new regulated scenario incorporating a modified e-flow regime. In addition, a new management scenario involving the relocation of the intake for the Valencia water supply to an upstream location was proposed to reduce the nitrate concentration values.
The simulation of various scenarios revealed that the current e-flow downstream of the Loriguilla reservoir leads to elevated nitrate concentrations in the water supply to Valencia. Acting on the minimum e-flow has a more pronounced effect in reducing nitrate concentrations when compared to altering the e-flow regime. The relocation of the Valencia water supply intake improved the nitrate concentrations compared to the other e-flow scenarios. These results suggests that the high nitrate concentrations are primarily sourced from elements downstream, which may include agricultural returns and the influence of the nitrate concentration in the aquifer that directly communicates with the river.
This methodology can be reconsidered in terms of various case studies, providing an approach to deal with water quality problems in river basins. However, some points should be considered to ensure the applicability of the approach and the reliability of scenarios. For this reason, it is critical to recognize that the SIMGES and GESCAL models are sensitive to the input data and the relevance of their validation and that the complexity of the water management system within the river basin may present a challenge in accurately reproducing the real state and achieving reliable results.
Taking a comprehensive view, this study provides a holistic and well-rounded perspective to inform decision-making in the management of water. It becomes evident that addressing both e-flow and water demand intake can potentially lead to a more substantial enhancement of water quality within the river system. By optimizing the e-flow regime and strategically managing water demand intakes, a holistic approach to river system management can be achieved. This, in turn, may result in even more favorable water quality conditions and greater ecological benefits. This underscores the importance of considering multiple factors and their interactions when formulating effective strategies for enhancing water quality and ecological health in river systems.
Author Contributions
Conceptualization, J.P.-A., R.J.B. and S.G.; methodology, J.P.-A., R.J.B., A.S. and S.G.; software, J.P.-A., R.J.B., A.S. and S.G.; validation, J.P.-A. and R.J.B.; investigation, J.P.-A., R.J.B., A.S., J.A. and S.G.; writing—original draft preparation, S.G.; writing—review and editing, R.J.B., A.S., J.A. and J.P.-A.; supervision, J.P.-A., R.J.B. and J.A.; project administration, J.A. All authors have read and agreed to the published version of the manuscript.
Funding
This work was carried out in the framework of a PAID-06-23 project, which is funded by the Vice-Rectorate for Research of the Polytechnic University of Valencia (UPV), and the AGREEMAR project (PCI2022-133001), which is funded by PRIMA and the Spanish Research Agency. The third author of the paper was partly funded by the Spanish Ministry of Science and Innovation through Juan de la Cierva-Incorporación program (IJC2019-038848-I).
Data Availability Statement
The data presented in this study are available on request from the corresponding author.
Conflicts of Interest
The authors declare no conflicts of interest.
References
- Sharma, S.; Bijukshe, S.; Puppala, S.S. Monitoring, Modeling and Planning Best Management Practices (BMPs) in the Atwood and Tappan Lake Watersheds with Stakeholders Engagements. Water 2023, 15, 3028. [Google Scholar] [CrossRef]
- Souza, J.D.S.D.; Cirilo, J.A.; Bezerra, S.D.T.M.; Oliveira, G.A.D.; Freire, G.D.; Coutinho, A.P.; Cabral, J.J.D.S.P. Decision support system for the integrated management of multiple supply systems in the Brazilian Semiarid Region. Water 2023, 15, 223. [Google Scholar] [CrossRef]
- Cosgrove, W.J.; Loucks, D.P. Water management: Current and future challenges and research directions. Water Resour. Res. 2015, 51, 4823–4839. [Google Scholar] [CrossRef]
- Mirás-Avalos, J.M.; Araujo, E.S. Optimization of vineyard water management: Challenges, strategies, and perspectives. Water 2021, 13, 746. [Google Scholar] [CrossRef]
- Ashu, A.B.; Lee, S.I. Simulation-optimization model for conjunctive management of surface water and groundwater for agricultural use. Water 2021, 13, 3444. [Google Scholar] [CrossRef]
- Fan, M.; Xu, J.; Chen, Y.; Li, D.; Tian, S. How to sustainably use water resources—A case study for decision support on the water utilization of Xinjiang, China. Water 2020, 12, 3564. [Google Scholar] [CrossRef]
- Yan, T.; Shen, S.L.; Zhou, A. Indices and models of surface water quality assessment: Review and perspectives. Environ. Pollut. 2022, 308, 119611. [Google Scholar] [CrossRef] [PubMed]
- Cruz-Retana, A.; Becerril-Piña, R.; Fonseca, C.R.; Gómez-Albores, M.A.; Gaytán-Aguilar, S.; Hernández-Téllez, M.; Mastachi-Loza, C.A. Assessment of Regression Models for Surface Water Quality Modeling via Remote Sensing of a Water Body in the Mexican Highlands. Water 2023, 15, 3828. [Google Scholar] [CrossRef]
- Kim, J.; Jonoski, A.; Solomatine, D.P.; Goethals, P.L. Water quality modelling for nitrate nitrogen control using HEC-RAS: Case study of Nakdong River in South Korea. Water 2023, 15, 247. [Google Scholar] [CrossRef]
- Boyacioglu, H. Surface water quality assessment using factor analysis. Water Sa 2006, 32, 389–393. [Google Scholar] [CrossRef]
- Huang, F.; Zhang, H.; Wu, Q.; Chi, S.; Yang, M. An Optimal Model and Application of Hydraulic Structure Regulation to Improve Water Quality in Plain River Networks. Water 2023, 15, 4297. [Google Scholar] [CrossRef]
- Wang, W.; Zanazzi, A.; Cadet, E.; Rakotoarisaona, H.; Peterson, H. Investigating Temporal and Spatial Variations of Nutrient and Trace Metal Loading in Utah Lake (Utah, USA). Water 2024, 16, 502. [Google Scholar] [CrossRef]
- Ma, B.; Wu, C.; Jia, X.; Zhang, Y.; Zhou, Z. Predicting Water Quality using Partial Least Squares Regression of Land Use and Morphology (Danjiangkou Reservoir, China). J. Hydrol. 2023, 624, 129828. [Google Scholar] [CrossRef]
- Tang, C.; Yi, Y.; Yang, Z.; Zhang, S.; Liu, H. Effects of ecological flow release patterns on water quality and ecological restoration of a large shallow lake. J. Clean. Prod. 2018, 174, 577–590. [Google Scholar] [CrossRef]
- Wu, M.; Wu, H.; Warner, A.T.; Li, H.; Liu, Z. Informing environmental flow planning through landscape evolution modeling in heavily modified urban rivers in China. Water 2021, 13, 3244. [Google Scholar] [CrossRef]
- Poff, N.L.; Matthews, J.H. Environmental flows in the Anthropocence: Past progress and future prospects. Curr. Opin. Environ. Sustain. 2013, 5, 667–675. [Google Scholar] [CrossRef]
- Poff, N.L.; David Allan, J.; Bain, M.B.; Karr, J.R.; Prestegaard, K.L.; Richter, B.D.; Sparks, R.E.; Stromberg, J.C. The natural flow regime. BioScience 1997, 47, 769–784. [Google Scholar]
- Arthington, A.H.; Bhaduri, A.; Bunn, S.E.; Jackson, S.E.; Tharme, R.E.; Tickner, D.; Young, B.; Acreman, M.; Baker, N.; Capon, S.; et al. The Brisbane declaration and global action agenda on environmental flows (2018). Front. Environ. Sci. 2018, 6, 45. [Google Scholar] [CrossRef]
- Pulido-Calvo, I.; Gutiérrez-Estrada, J.C.; Sanz-Fernández, V. Drought and ecological flows in the lower Guadiana river basin (Southwest Iberian Peninsula). Water 2020, 12, 677. [Google Scholar] [CrossRef]
- Richter, B.D.; Thomas, G.A. Restoring environmental flows by modifying dam operations. Ecol. Soc. 2007, 12, 1. [Google Scholar] [CrossRef]
- Kim, Y.W.; Lee, J.W.; Woo, S.Y.; Lee, J.J.; Hur, J.W.; Kim, S.J. Design of Ecological Flow (E-Flow) Considering Watershed Status Using Watershed and Physical Habitat Models. Water 2023, 15, 3267. [Google Scholar] [CrossRef]
- Palmer, C.G.; Rossouw, N.; Muller, W.J.; Scherman, P.A. The development of water quality methods within ecological Reserve assessments, and links to environmental flows. Water SA 2005, 31, 161–170. [Google Scholar] [CrossRef][Green Version]
- Acreman, M.C.; Ferguson, A.J.D. Environmental flows and the European water framework directive. Freshw. Biol. 2010, 55, 32–48. [Google Scholar] [CrossRef]
- Arthington, A.H. Environmental Flows: Saving Rivers in the Third Millennium; University of California Press: Berkeley, CA, USA, 2012; Volume 4. [Google Scholar]
- Li, X.; Li, C.; Wang, X.; Liu, Q.; Yi, Y.; Zhang, X. A developed method of water pollution control based on environmental capacity and environmental flow in Luanhe River Basin. Water 2022, 14, 730. [Google Scholar] [CrossRef]
- Gao, Y.; Xu, Z.; Li, S.; Yu, W. Modeling monthly nitrate concentration in a Karst spring with and without discrete conduit flow. Water 2022, 14, 1622. [Google Scholar] [CrossRef]
- Xu, Y.; Yuan, Q.; Zhao, C.; Wang, L.; Li, Y.; Ma, X.; Guo, J.; Yang, H. Identification of nitrate sources in rivers in a complex catchment using a dual isotopic approach. Water 2021, 13, 83. [Google Scholar] [CrossRef]
- Panno, S.V.; Kelly, W.R.; Martinsek, A.T.; Hackley, K.C. Estimating background and threshold nitrate concentrations using probability graphs. Groundwater 2006, 44, 697–709. [Google Scholar] [CrossRef] [PubMed]
- Kupiec, J.M.; Staniszewski, R.; Kayzer, D. Assessment of Water Quality Indicators in the Orla River Nitrate Vulnerable Zone in the Context of New Threats in Poland. Water 2022, 14, 2287. [Google Scholar] [CrossRef]
- Mysiak, J.; Giupponi, C.; Rosato, P. Towards the development of a decision support system for water resource management. Environ. Model. Softw. 2005, 20, 203–214. [Google Scholar] [CrossRef]
- Monico, V.; Solera, A.; Bergillos, R.J.; Paredes-Arquiola, J.; Andreu, J. Effects of environmental flows on hydrological alteration and reliability of water demands. Sci. Total Environ. 2022, 810, 151630. [Google Scholar] [CrossRef]
- Pardo-Loaiza, J.; Bergillos, R.J.; Solera, A.; Paredes-Arquiola, J.; Andreu, J. Habitat alteration assessment for the management of environmental flows in regulated basins. J. Environ. Manag. 2022, 319, 115653. [Google Scholar] [CrossRef]
- Momblanch, A.; Paredes-Arquiola, J.; Munné, A.; Manzano, A.; Arnau, J.; Andreu, J. Managing water quality under drought conditions in the Llobregat River Basin. Sci. Total Environ. 2015, 503, 300–318. [Google Scholar] [CrossRef]
- Ghannem, S.; Bergillos, R.J.; Paredes-Arquiola, J.; Martínez-Capel, F.; Andreu, J. Coupling hydrological, habitat and water supply indicators to improve the management of environmental flows. Sci. Total Environ. 2023, 898, 165640. [Google Scholar] [CrossRef]
- Xia, J.; Lin, L.; Lin, J.; Nehal, L. Development of a GIS-based decision support system for diagnosis of river system health and restoration. Water 2014, 6, 3136–3151. [Google Scholar] [CrossRef]
- Reljić, M.; Romić, M.; Romić, D.; Gilja, G.; Mornar, V.; Ondrasek, G.; Kovačić, M.; Zovko, M. Advanced Continuous Monitoring System—Tools for Water Resource Management and Decision Support System in Salt Affected Delta. Agriculture 2023, 13, 369. [Google Scholar] [CrossRef]
- CHJ. Plan Hidrológico de la Demarcación Hidrográfica del Júcar 2022–2027. 2022. Available online: https://www.chj.es/es-es/medioambiente/planificacionhidrologica/Documents/Plan-Hidrologico-cuenca-2021-2027/PHC/Version%20Final/PHJ2227_Anejo06_Balances_2023_01_24.pdf (accessed on 30 April 2024).
- Andreu, J.; Capilla, J.; Sanchís, E. AQUATOOL, a generalized decision-support system for water-resources planning and operational management. J. Hydrol. 1996, 177, 269–291. [Google Scholar] [CrossRef]
- Dorado-Guerra, D.Y.; Paredes-Arquiola, J.; Pérez-Martín M, Á.; Tafur Hermann, H. Integrated surface-groundwater modelling of nitrate concentration in mediterranean rivers, the júcar river basin district, Spain. Sustainability 2021, 13, 12835. [Google Scholar] [CrossRef]
- MARM. Orden ARM/2656/2008, de 10 de Septiembre, por la que se Aprueba la Instrucción de Planificación Hidrológica. BOE núm. 229, 22 de septiembre de 2008. 2008, pp. 38472–38582. Available online: https://www.boe.es/diario_boe/txt.php?id=BOE-A-2008-15340 (accessed on 30 April 2024).
- Dettori, M.; Arghittu, A.; Deiana, G.; Castiglia, P.; Azara, A. The revised European Directive 2020/2184 on the quality of water intended for human consumption. A step forward in risk assessment, consumer safety and informative communication. Environ. Res. 2022, 209, 112773. [Google Scholar] [CrossRef]
- Paredes-Arquiola, J.; Andreu-Álvarez, J.; Martín-Monerris, M.; Solera, A. Water quantity and quality models applied to the Jucar River Basin, Spain. Water Resour. Manag. 2010, 24, 2759–2779. [Google Scholar] [CrossRef]
- Zhao, C.S.; Yang, Y.; Yang, S.T.; Xiang, H.; Ge, Y.R.; Zhang, Z.S.; Zhao, Y.; Yu, Q. Effects of spatial variation in water quality and hydrological factors on environmental flows. Sci. Total Environ. 2020, 728, 138695. [Google Scholar] [CrossRef]
- Pérez-Indoval, R.; Rodrigo-Ilarri, J.; Cassiraga, E.; Rodrigo-Clavero, M.E. Numerical modeling of groundwater pollution by chlorpyrifos, bromacil and terbuthylazine. Application to the buñol-cheste aquifer (Spain). Int. J. Environ. Res. Public Health 2021, 18, 3511. [Google Scholar] [CrossRef] [PubMed]
Disclaimer/Publisher’s Note: The statements, opinions and data contained in all publications are solely those of the individual author(s) and contributor(s) and not of MDPI and/or the editor(s). MDPI and/or the editor(s) disclaim responsibility for any injury to people or property resulting from any ideas, methods, instructions or products referred to in the content. |
© 2024 by the authors. Licensee MDPI, Basel, Switzerland. This article is an open access article distributed under the terms and conditions of the Creative Commons Attribution (CC BY) license (https://creativecommons.org/licenses/by/4.0/).