Article

Assessing the Impacts of Changing Connectivity of Hydropower Dams on the Distribution of Fish Species in the 3S Rivers, a Tributary of the Lower Mekong

School of GeoSciences, University of Edinburgh, Edinburgh EH8 9XP, UK
*
Author to whom correspondence should be addressed.
Water 2024, 16(11), 1505; https://doi.org/10.3390/w16111505
Submission received: 26 April 2024 / Revised: 16 May 2024 / Accepted: 20 May 2024 / Published: 24 May 2024

Abstract

:
Hydropower plants (HPPs) create barriers across rivers and fragment aquatic ecosystems, river reaches and habitats. The reservoirs they create slow the flowing water and convert the riverine into lacustrine ecosystems. The barriers created by HPPs interrupt the seasonal migrations of many fish species, while the reservoirs drive away fish species that are dependent on flowing water habitats. This paper assesses the distribution of fish species in the 3S rivers—Sekong, Sesan and Sre Pok, in Cambodia, Laos and Viet Nam—using IUCN Red List-assessed species distribution by HydroBasin Level 8 from the freshwater reports of the Integrated Biodiversity Assessment Tool (IBAT) and their connectivity with the Mekong. There are currently 61 commissioned dams in the 3S basins and a further 2 under construction, 23 of which are larger than the 30 MW installed capacity. A further 24 HPPs are proposed or planned in these basins. The changes in connectivity caused by the dams are measured by adapting the River Class Connectivity Index (RCICLASS); the original connectivity of the 3S basin taking into account the two major waterfalls in the Sesan and Sre Pok rivers was estimated at 80.9%. With existing dams, the connectivity has been reduced to 23.5%, and with all planned dams, it is reduced further to 10.9%. The resulting re-distribution of fish species occurring throughout the 3S basins is explored, by focusing on migratory guilds and threatened and endemic fish species. With all dams built, it is predicted that the total numbers of species in HydroBasins above the dams will be reduced by 40–50%. The Threatened Species Index is estimated to fall from over 30 near the confluence of the three rivers to less than 10 above the lowest dams on the 3S rivers. The analysis demonstrates how widely available global and regional datasets can be used to assess the impacts of dams on fish biodiversity in this region.

1. Introduction

There have been many studies and reviews of hydropower development and the resulting environmental and social impacts, especially on fish. In a global study of hydropower development on eco-sensitive rivers, Chowdhury et al. identified 20 eco-sensitive river basins using basin-scale parameters such as fish species richness, annual fish catch, hydropower potential and existing hydropower capacity. The Mekong basin was identified amongst the highest-eco-sensitivity basins, after the Congo, Yangtse, Amazon and Ganges. In 2015, the Lancang/Mekong in China had 34% untapped hydropower potential, while the Lower Mekong Basin (LMB) had 66% untapped potential in 2015. By 2050, rapid hydropower expansion across the basin would harness about 75% of the total hydropower potential [1]. In 2019, there were eleven dams on the Mekong mainstream in China, two completed mainstream dams in Laos with several others being planned, as well as fifty-nine tributary dams commissioned and thirty-six under construction [2,3].
In 2010, Dugan and Barlow found no evidence to indicate that dam construction in the Mekong region would stop, although dam building in the Viet Nam part of the 3S basin appears to be complete [4]. They concluded that the mainstream dams planned on the Lower Mekong would have a significant impact on fish populations, especially the disruption of upstream spawning migrations of economically and biologically important species, and the downstream drift of fish eggs and larvae with a reduction in fishery recruitment caused by the trapping of juveniles in reservoirs [4]. Groupings of dams on the Mekong have been shown to affect fish migrations, river hydrology, and sediment transfers, negatively impacting riparian communities up to 1000 km away [5,6,7]. Dams impede the flow of water and sediments, block fish migrations, and only support a fraction of the fish stock that a free-flowing river could. The cumulative effect of the disruptions to the water flow can have devastating impacts on life in and around the river; it could even lead to the collapse of entire ecosystems [8]. Alterations in seasonal floods, which affect the functioning of the aquatic ecosystems of the Mekong and its tributaries, will affect the biodiversity and ecosystem services on which the people and economies in the region depend [9].
While most of the emphasis on dam impacts focuses on upstream migration barriers, which prevent migratory fish from spawning and completing their life cycles, dams also inhibit downstream migration. Mortality from passage through the turbines will be especially significant. For small- and medium-sized fishes, survival is typically 5–20% at each dam. Large-bodied fish are unlikely to survive downstream migration through turbines or over spillways [10]. Hydropeaking—daily variation in electricity generation according to peak demand—produces large and rapid variations in the downstream flow patterns that tend to increase bed and bank erosion and change the river habitats. This can mask or confuse migration triggers and would be particularly damaging to a downstream fishery [10].
Ziv and Baran [11] used a model of fish migration to estimate fish biomass and biodiversity losses likely to result from the construction of various dam scenarios. The model was based on the premise that riverine habitats upstream of dams have a local carrying capacity of migratory fish. After dam construction, this proportion was assumed to be unable to migrate downstream. Applying this method in the 3S basin, they estimated that the construction of the Lower Sesan 2 dam would result in a 9.3% decline in fish biomass in the Mekong basin, with a series of further declines estimated due to the construction of dams on the Sekong. They projected that the change in the average number of endangered species would be 56 for Lower Sesan 2. They concluded that the damming of tributaries on the Mekong could have catastrophic impacts on fish productivity and biodiversity [11].
Schmutz and Moog describe the transformation of rivers into reservoirs, changing from riverine to lacustrine environments, slowing down the flow, allowing sediment to be trapped in the reservoir, and changing water quality. The new reservoir ecosystem is colonised by the fish species that inhabited the original river and are able to adapt to the changed conditions. Non-migratory, generalist and non-native species tend to dominate because their life cycles have less complex ecological requirements. Migratory species experience declines due to the barrier effect of the dams, and rheophilic species cannot survive in the changed lentic conditions. The inundation of spawning grounds and loss of critical habitats compound the pressures on these populations. Lotic species will tend to move upstream to find suitable habitats where species richness reflects the higher habitat heterogeneity of tributaries upstream [12].
Even if fish can move up into the reservoirs by fishways, they may lose their way up long reservoirs to their spawning grounds because of the very low flow rate in the reservoir or impoundment. Migratory fish navigate upstream through the faster flow of the river. Many migratory fish are egg scatterers, relying upon the drift downstream to the juvenile feeding grounds. The slow-moving reservoirs allow fish eggs and larvae to sink to the bottom, where they are unable to develop and so die.
While the impacts of hydropower development have been extensively studied, most studies have focused on hydrological changes, sediment transport and trapping, and changes in fish production. Freshwater fish diversity, non-fish species, primary production, trophic ecology and nutrient loading have been less commonly studied [13].
The 3S rivers consist of three rivers—Sekong, Sesan and Sre Pok—which arise in the southern Annamite mountains and volcanic geological formations of the Central Highlands of Viet Nam and flow westwards towards the confluence with the Mekong at Stung Treng in Cambodia. The combined mean annual flow is estimated at between 17 and 20% of the flow in the Mekong, making it one of the most important tributaries of the Mekong [14]. The rivers rise at over 2400 masl, falling to around 50 masl at Stung Treng. They pass through five different ecological zones—high- and mid-elevation moist broadleaf forests, mid- and low-elevation dry broadleaf forests, and a small amount of floodplain and wetland [15]. The three rivers are different geomorphologically and ecologically, which broadly explains the differences in fish species distributions and the occurrence of super-endemic species, especially in the headwaters of the Sekong.
The ecosystem profile of the Indo-Burma Biodiversity Hotspot, reported by the Critical Ecosystem Partnership Fund (CEPF) in 2011, notes that the Lower Mekong Basin (LMB) supports at least 850 freshwater fish species [16] with 11% of all the species found in the Sekong catchment alone being un-named [17]. By 2020, the CEPF reported a significant increase in the number of fish species in the Indo-Burma Hotspot that had been Red List-assessed by IUCN [6,18]. In total, 9% of the species in the hotspot are globally threatened, and a further 39% are classified as Data Deficient [6]. Since then, the IUCN Red Listing process of freshwater fish has progressed further and was last updated in December 2023, covering many species in regions surrounding the Mekong in China and Sundaland, so the species list of Red-Listed fish in the 3S basin is more comprehensive than before (Catherine Sayer pers.com).
Baran reviewed the lists of fish species in the 3S rivers from earlier surveys [19,20,21,22,23,24]. He consolidated these species lists, reporting 329 fish species, or 42% of the 781 fish species found in the Mekong, even though the 3S basin area is only 10% of the total Mekong basin. He reported that 17 super-endemic species are found only in the 3S rivers, of which 14 are endangered or Critically Endangered [25]. The super-endemic species are often rithron-resident species only found in a single sub-catchment, making them particularly vulnerable to dams, which may obstruct their migrations or inundate their river habitats. Rapids are particularly notable as sites of high species richness, endemism and periodic congregations of fish, such as some headwaters areas [16,17,26]
All the globally threatened species mentioned by CEPF are found in the 3S basin—Mekong giant catfish (Pangasianodon gigas), giant freshwater stingray (Urogymnus polylepis), giant dog-eating catfish (Pangasius sanitwongsei), giant carp (Catlocarpio siamensis) and Jullien’s golden carp (Probarbus jullieni). Most of these large species are migratory, depend upon large-scale riverine ecosystems, and are sensitive to changes in flow and access to their spawning and feeding habitats. Long-distance migrations are also made by many smaller-bodied species, e.g., Siamese mudcarp Henichorynchus siamensis (now classified as Gymnostomus) [6].
In a paper on the best practices for compensation from dam construction, with Lower Sesan 2 as a case study, Baird used village and fisherfolk meetings to identify important groups of migratory species that would not be able to move above the dam site into the Sesan and Sre Pok rivers [27]. These fall into three main groups: (i) Large cyprinids with upstream migrations occurring in May–June, and downstream migrations back to the Mekong River in October to December, such as Scaphognathops bandanensis, Mekongina erythrospila, Hypsibarbus malcolmi, Labeo erythropterus, Incisilabeo behri and Cirrhinus moliterella. (ii) Small cyprinids, which migrate up the Mekong River from the Tonle Sap River each year between December and February, far up the Sesan and Sre Pok rivers, such as Gymnostomus lobatus, Paralaubuca typus and at least 30 other species. These are important for the ecology of the rivers as they are algae-eaters and are food sources for non-migratory, predatory fish such as Hemibagrus wyckiodes, Hemibagrus nemurus and Channa spp. The populations of non-migratory predators would suffer due to the decline in these small food species [19]. (iii) Pangasid catfish species such as Pangasius conchophilus, Pangasius larnaudii, Pangasius hypophthamus, Pangasius krempfi, Pangasius bocourti and Pangasius macronema, which migrate upstream between April and July. Their larvae float downstream when the river is full at the end of the wet season. Migrations of other species such as Belodontichthys spp., Wallago spp. and Probarbus spp. would be disrupted by the lower dams of Lower Sesan 2 and Sekong Downstream A, as would less common aquatic species such as the large eel, Anguilla marmorata and the large freshwater shrimp Macrobrachium rosenbergii [27].
Baran reviewed the estimates of fish catches in the 3S basin, which are very variable, ranging from 9500 tonnes per year in the Sekong alone and 5600 tonnes in 2001 in the Viet Nam parts of the basin (including aquaculture) to 647 tonnes per year estimated by the EIA of Lower Sesan 2. In discussion with fishermen in the Sesan River, Baran learnt that at least 41 migratory fish species form about 60% of their total catch [14], underlining the importance of ensuring the continuation of fish migration. In the Atlas of Cambodia, Baran estimates that inland capture fisheries [28,29] provide 40.3 kg of fish/person per year with 15.5 kg contributed by long-distance migrants, 6.0 kg from short-distance migrants and 18.8 kg from floodplain residents. Within the 3S provinces in Cambodia, the average consumption is estimated at 53.3 kg of fish/person/year with 35.4 kg coming from the capture fishery in the 3S rivers [30]. This illustrates the importance of migratory species in Cambodia’s fisheries.
The IUCN Red List classifies many species as “Full Migrants”, but this hides the differences in migration behaviour and preferred habitats and does not allow a further sub-classification into fish guilds. The different migratory behaviours of Mekong River fishes have been grouped into “blackfishes”, “greyfishes” and “whitefishes” according to their behaviour and ecology. Whitefishes migrate along the main channels of the rivers and tributaries and between floodplains and channel habitats. They require high dissolved oxygen concentrations and avoid low-oxygen conditions by migrating [30]. Blackfishes tend to only migrate locally within a restricted area and are generally bottom feeders, inhabiting floodplain pools and channels, flooded forests and rice fields—habitats often low in dissolved oxygen. Many blackfishes can tolerate low oxygen levels in more stagnant waters. Many blackfish species remain in their adult habitats without significant migrations. Greyfishes (e.g., Labeo spp.), have facultative behaviour with both migratory and static movement patterns, enabling them to respond to changes in flow conditions [30].
Most river fishes in Southeast Asia migrate to spawning grounds as river flows increase with the wet season. They make return migrations as river levels fall. Many blackfish species migrate laterally onto the floodplains and flooded forests for feeding or spawning and return to the main channel as water levels fall. Whitefish migrate to an upstream site to spawn in the main river or tributaries and return downstream.
After spawning, the eggs and larvae drift downstream with the current, especially at peak flows, flowing with the reversed flow into the floodplains to reach their feeding habitats in Cambodia and southern Viet Nam. The fish mainly migrate to spawning grounds as the river starts to rise, and move back into deep pools for refuge during times of low water levels. Spawning is often triggered by rapid increases in discharge. The specific migration in the Xe Kong basin shows that the number of migrating species declines with distance upstream.
The differences in size, body shape and migration patterns make it difficult to predict the impact of dams on such highly diverse fisheries. The baseline information on the natural variability of the fish populations is limited, and there are few studies of the precise effects of the construction and operation of dams upon the flood pulses, which may trigger migration. Montaña et al. studied the functional and trophic diversity of fish in the 3S rivers and the Mekong and mapped the changes with flow alteration. They noted that the Sesan showed the greatest flow alteration from dams and as a result showed the lowest taxonomic and functional diversity; the Sekong had the greatest functional diversity, with more dispersion of species. Species in the Mekong and Sre Pok were more evenly distributed and had intermediate levels of functional diversity. They concluded that impoundment and flow regulation can act as an environmental filter that reduces fish functional diversity [31]. With the exception of those discussed below, relatively few studies have assessed the ability of different species or guilds to traverse fish passages which are sometimes built around new dams [32].
Halls and Kshatriya [33] developed models for the cumulative barrier and passage effects of the mainstream hydropower projects on the migratory fish populations in the Lower Mekong Basin. They used an environmental guild framework and identified 58 highly migratory species threatened by mainstream dam development, from which they took ten species of different families to model their ability to use fish passages for upstream spawning and safe downstream survival through dam turbines or spillways. Because it allows species to be grouped according to migratory behaviour, we have used this fish migratory guild classification for this study (see Supplementary Materials, Table S4).
Most of the dams in the 3S rivers are high dams—between 10 m and 100 m in height—and are impassable for migrating fish. Lower Sesan 2 has a fish pass, and we understand that Sekong Downstream A will have one installed. The Lower Sesan 2 dam, commissioned in 2017, has incorporated a nature-like by-pass at the dam to allow migrating fish to reach upstream or downstream for spawning. It was designed specifically for protected, high-value fish with migratory and semi-migratory characteristics, including the following 10 species: Pangasianodon hypophthalmus, Probarbus jullieni, Poropuntius deauratus, Tenualosa thibaudeaui, Osphronemus exodon, Hypsibarbus malcolmi, Henicorhynchus lobatus, Cyclocheilichthys enoplos and Pangasius larnaudii. The rock ramp by-pass is 3286 m in total, with three sections—inlet, channel and exit sections. The difference in height between entrance and exit is 26.5 m. There are three rest pools of nearly 50 m in length constructed in the channel section (2624.277 m long and 4–5 m wide), with an area of more than 1000 m2 [34].
An evaluation of the performance of the fish by-pass, carried out with both gill net sampling and video monitoring, showed that during two sampling periods (December and May), a total of 24 species from 12 families used the fish by-pass, with 77% being small-bodied, 22% medium-sized and only 1% large fish. The dominant species was Mastacembalus armatus (a non-migratory species) at 33.4%, followed by Hampala dispar (migratory) at 25.1% and Sikukia gudgeri (non-migrant) at 10.7%. The only target species recorded using the by-pass was Poropuntius deauratus, and not all species exited the by-pass into the reservoir.
This shows that even if fish ladders are installed, they are unlikely to allow a large number of migratory species to move across the dams because of their different behavioural characteristics. In several instances where fish ladders have been installed, fish catch directly upstream declines by over 50% with the total disappearance of some species [35].
The Mekong River Commission (MRC) carried out population monitoring of major migratory species, taking into account fish passage and turbine mortality [33]. The MRC has recently specified design guidance for fish passage, such that for long-distance migratory species (i.e., Guilds 2, 3, 4 and 8) passing a single dam, large fishes (>75 cm) require more than 90% passage and medium-sized (50–75 cm) fish require more than 80% passage. If there are multiple dams, more than 95% passage at each dam site is required for both size groups [36]. Tropical rivers with a high fish diversity and different migratory behaviours are a challenge for such a generic standard of fish passage design and monitoring. O’Connor et al. suggest that performance standards need to be applied at catchment scale rather than single-site scale [29].
River connectivity is an important measure of the accessibility of different parts of the river to migratory fish. Connectivity acts in four dimensions, three spatial and one temporal dimension (i) longitudinal from headwaters to confluences and the sea, (ii) lateral from the main channel to the floodplains and (iii) vertical from the river to groundwater. In this study, we are principally concerned with the longitudinal connectivity and the temporal dimension of seasonal migrations [37]. Seasonal fish migrations depend upon hydrological connectivity and changes in flows, water temperature and water quality, which may trigger migration. In addition to the barrier effects of dams, fish migration may be disturbed by hydrological changes and other migration triggers.
Dams and weirs fragment riverine habitats, and the intensity of fragmentation has been measured in different ways, such as the number of dams within a catchment, or the mean and maximum depth between two barriers. The Dendritic Connectivity Index (DCI) measures the sum of the lengths of each river fragment in relation to the overall length of the river network; however, this considers the whole river network as equally important, but it does not recognise that some sections are more vulnerable to damming than others [37,38]. Shaad et al. [39] evaluated the effects of dams in the 3S by using the Dendritic Connectivity Index (DCI) to see how the provision of fish passages in current, under-construction and planned dams on the 3S rivers would affect fish populations. They concluded that at the current stage of development, the overall connectivity of the river system is sensitive to the efficiency of fish passes.
Grill et al. considered reduced river connectivity and changes in the natural flow regime induced by 81 proposed dams in the Mekong River Basin [40]. They developed the DCI by replacing the length of the river fragments with the volume of water available to fish in the fragmented river reaches—River Connectivity Index (RCIvol). They also introduced a weighting process that includes important characteristics of the river network, by measuring the diversity of river classes as a proxy for ecosystems—the River Class Connectivity Index (RCICLASS). They used a preliminary river reach network classification for the Mekong with 27 individual river classes by combining seven hydrological river types with six ecological regions [40].
They developed these indices further in mapping the world’s free-flowing rivers [41], identifying six pressure indicators as proxies for the main human interferences within the four dimensions of river connectivity, described above. These proxies included the DOF (degree of fragmentation), DOR (degree of regulation), SED (sediment trapping), USE (consumptive water use), URB (urban areas) and RDD (road density). All are applied to every river reach across the global river network (HydroSHEDS). The DOF identifies river reaches upstream and downstream of each dam as being fragmented, based upon the “distance” from the dam site, measured by comparing the river sizes (mean annual flow). The DOR is similarly based upon the mean annual flow of the river reach in comparison to the active storage of the reservoir. All the pressure indicators are then combined into an integrated Connectivity Status Index (CSI), which is used to determine the free-flowing river status. If the CSI of a river is greater than 95%, the river is classed as free-flowing. In their analysis, most parts of the 3S rivers in Viet Nam were estimated to have reduced CSI, suggesting that none are free-flowing and many are quite significantly fragmented. They also assessed the natural fragmentation of rivers due to waterfalls by incorporating a global database of about 2400 waterfalls (HydroFALLS). They made the assumption that a dam just downstream of a waterfall should not be considered to affect the fragmentation of the river upstream, an example being the Yali Falls HPP in Viet Nam.
A consideration of connectivity should also include any impedance of the downstream movement of river sediments, e.g., the SED proxy used by Grill [41]. Sediment trapping in reservoirs is a cumulative process progressively reducing the downstream movement of sediment through a cascade of dams. Not only does sediment trapping lead to a reduction in the active storage of reservoirs, but it can lead to bed and bank erosion downstream (the “hungry river”) and deprive downstream habitats of finer material which may be important for some fish. Schmitt estimated that the current (2018) portfolio of dams in the 3S basin exploits 54% of the hydropower potential while trapping 91% of the sand load [42].
The purpose of this study is to demonstrate how readily available global and regional information can be used to make initial predictions on the impacts of hydropower dams and reservoirs upon river connectivity and migratory fish populations, including endangered and endemic fish species, without the need for detailed surveys. We anticipate that this method will be useful for environmental impact assessments of hydropower and large impoundments in other rivers where fish diversity information may be limited.
We are principally considering the barrier effects of hydropower dams, with or without fish passage, upon migratory fish guilds, and the associated changes in connectivity in river reach classes upstream of dams. We are using the global Red List of threatened fish species, made available by the IBAT (Integrated Biodiversity Assessment Tool), which provides the species likely to be found in 3S HydroBasins. We compare these IBAT lists with the consolidated species lists from earlier 3S river surveys. We thus ensure that it is appropriate to use the IBAT lists, which have the advantage that they show the changing distribution of fish species through all three rivers. We attribute a suggested migratory guild to each species in order to assess the impacts of dams and fish passages. We assess the risks to certain fish guilds from the inundation of critical habitats such as high-gradient rivers and streams where specialised, and often endemic, species exist. We assess the changes to the river reach class connectivity within each HydroBasin isolated by the cascades of existing and future dams in the 3S rivers.

2. Materials and Methods

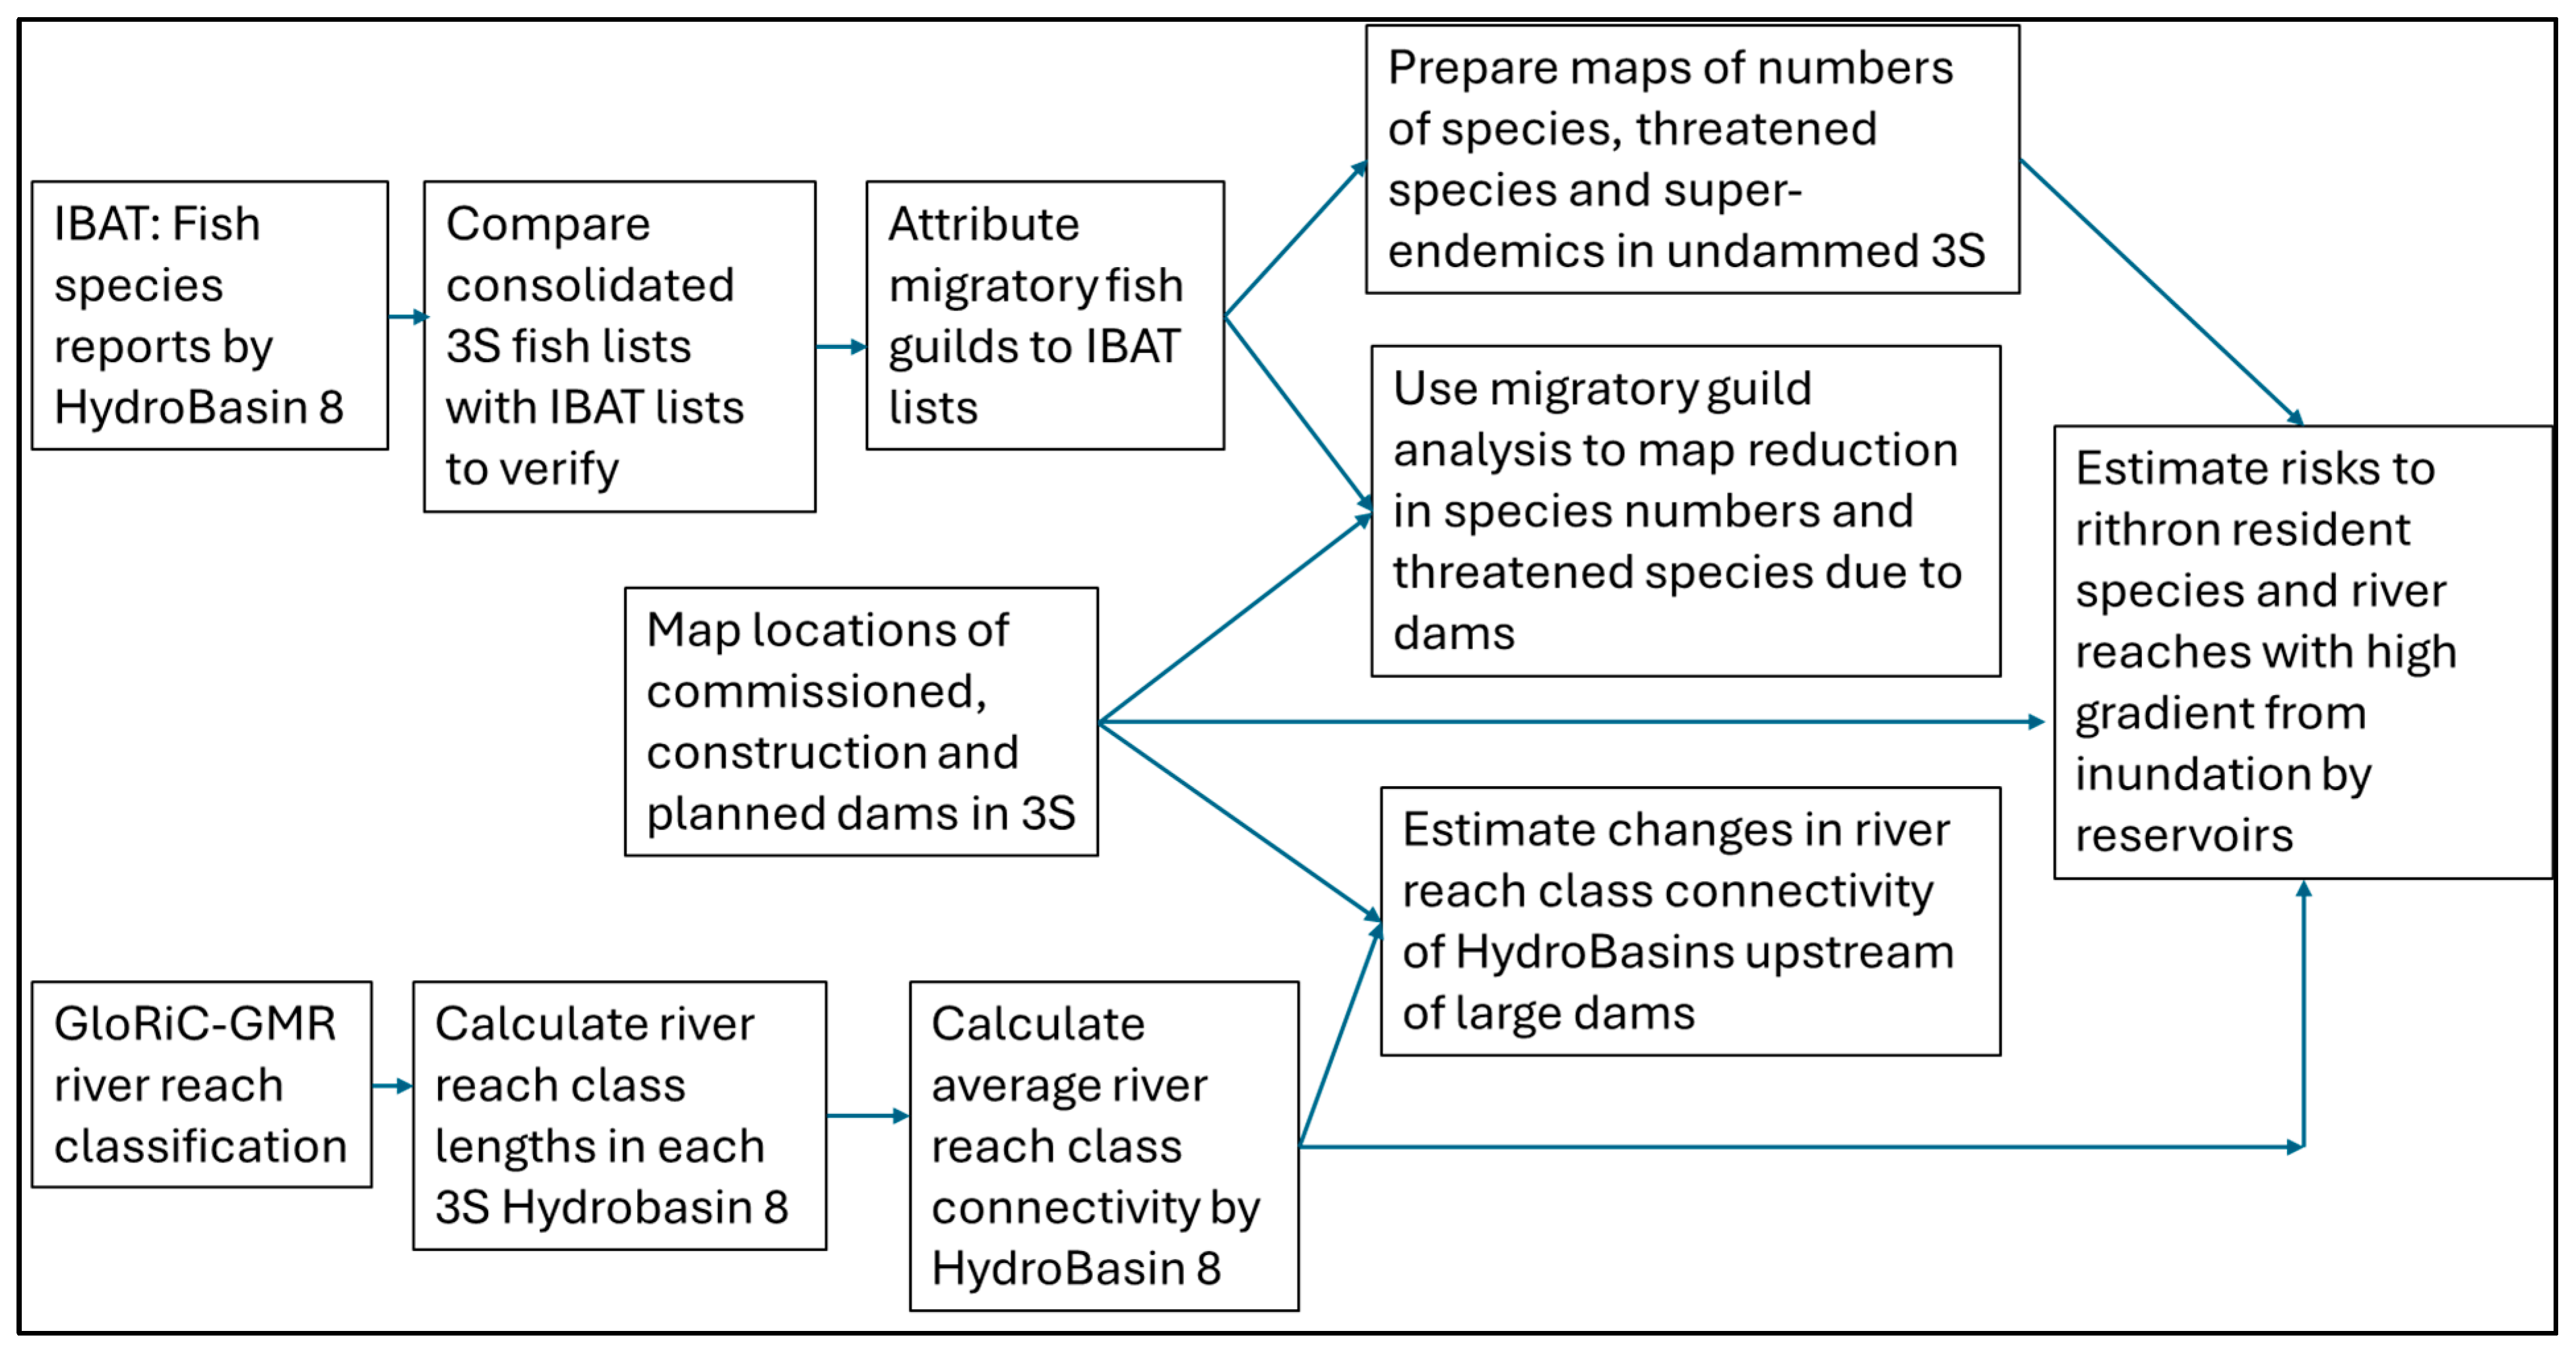
2.1. Data and Process
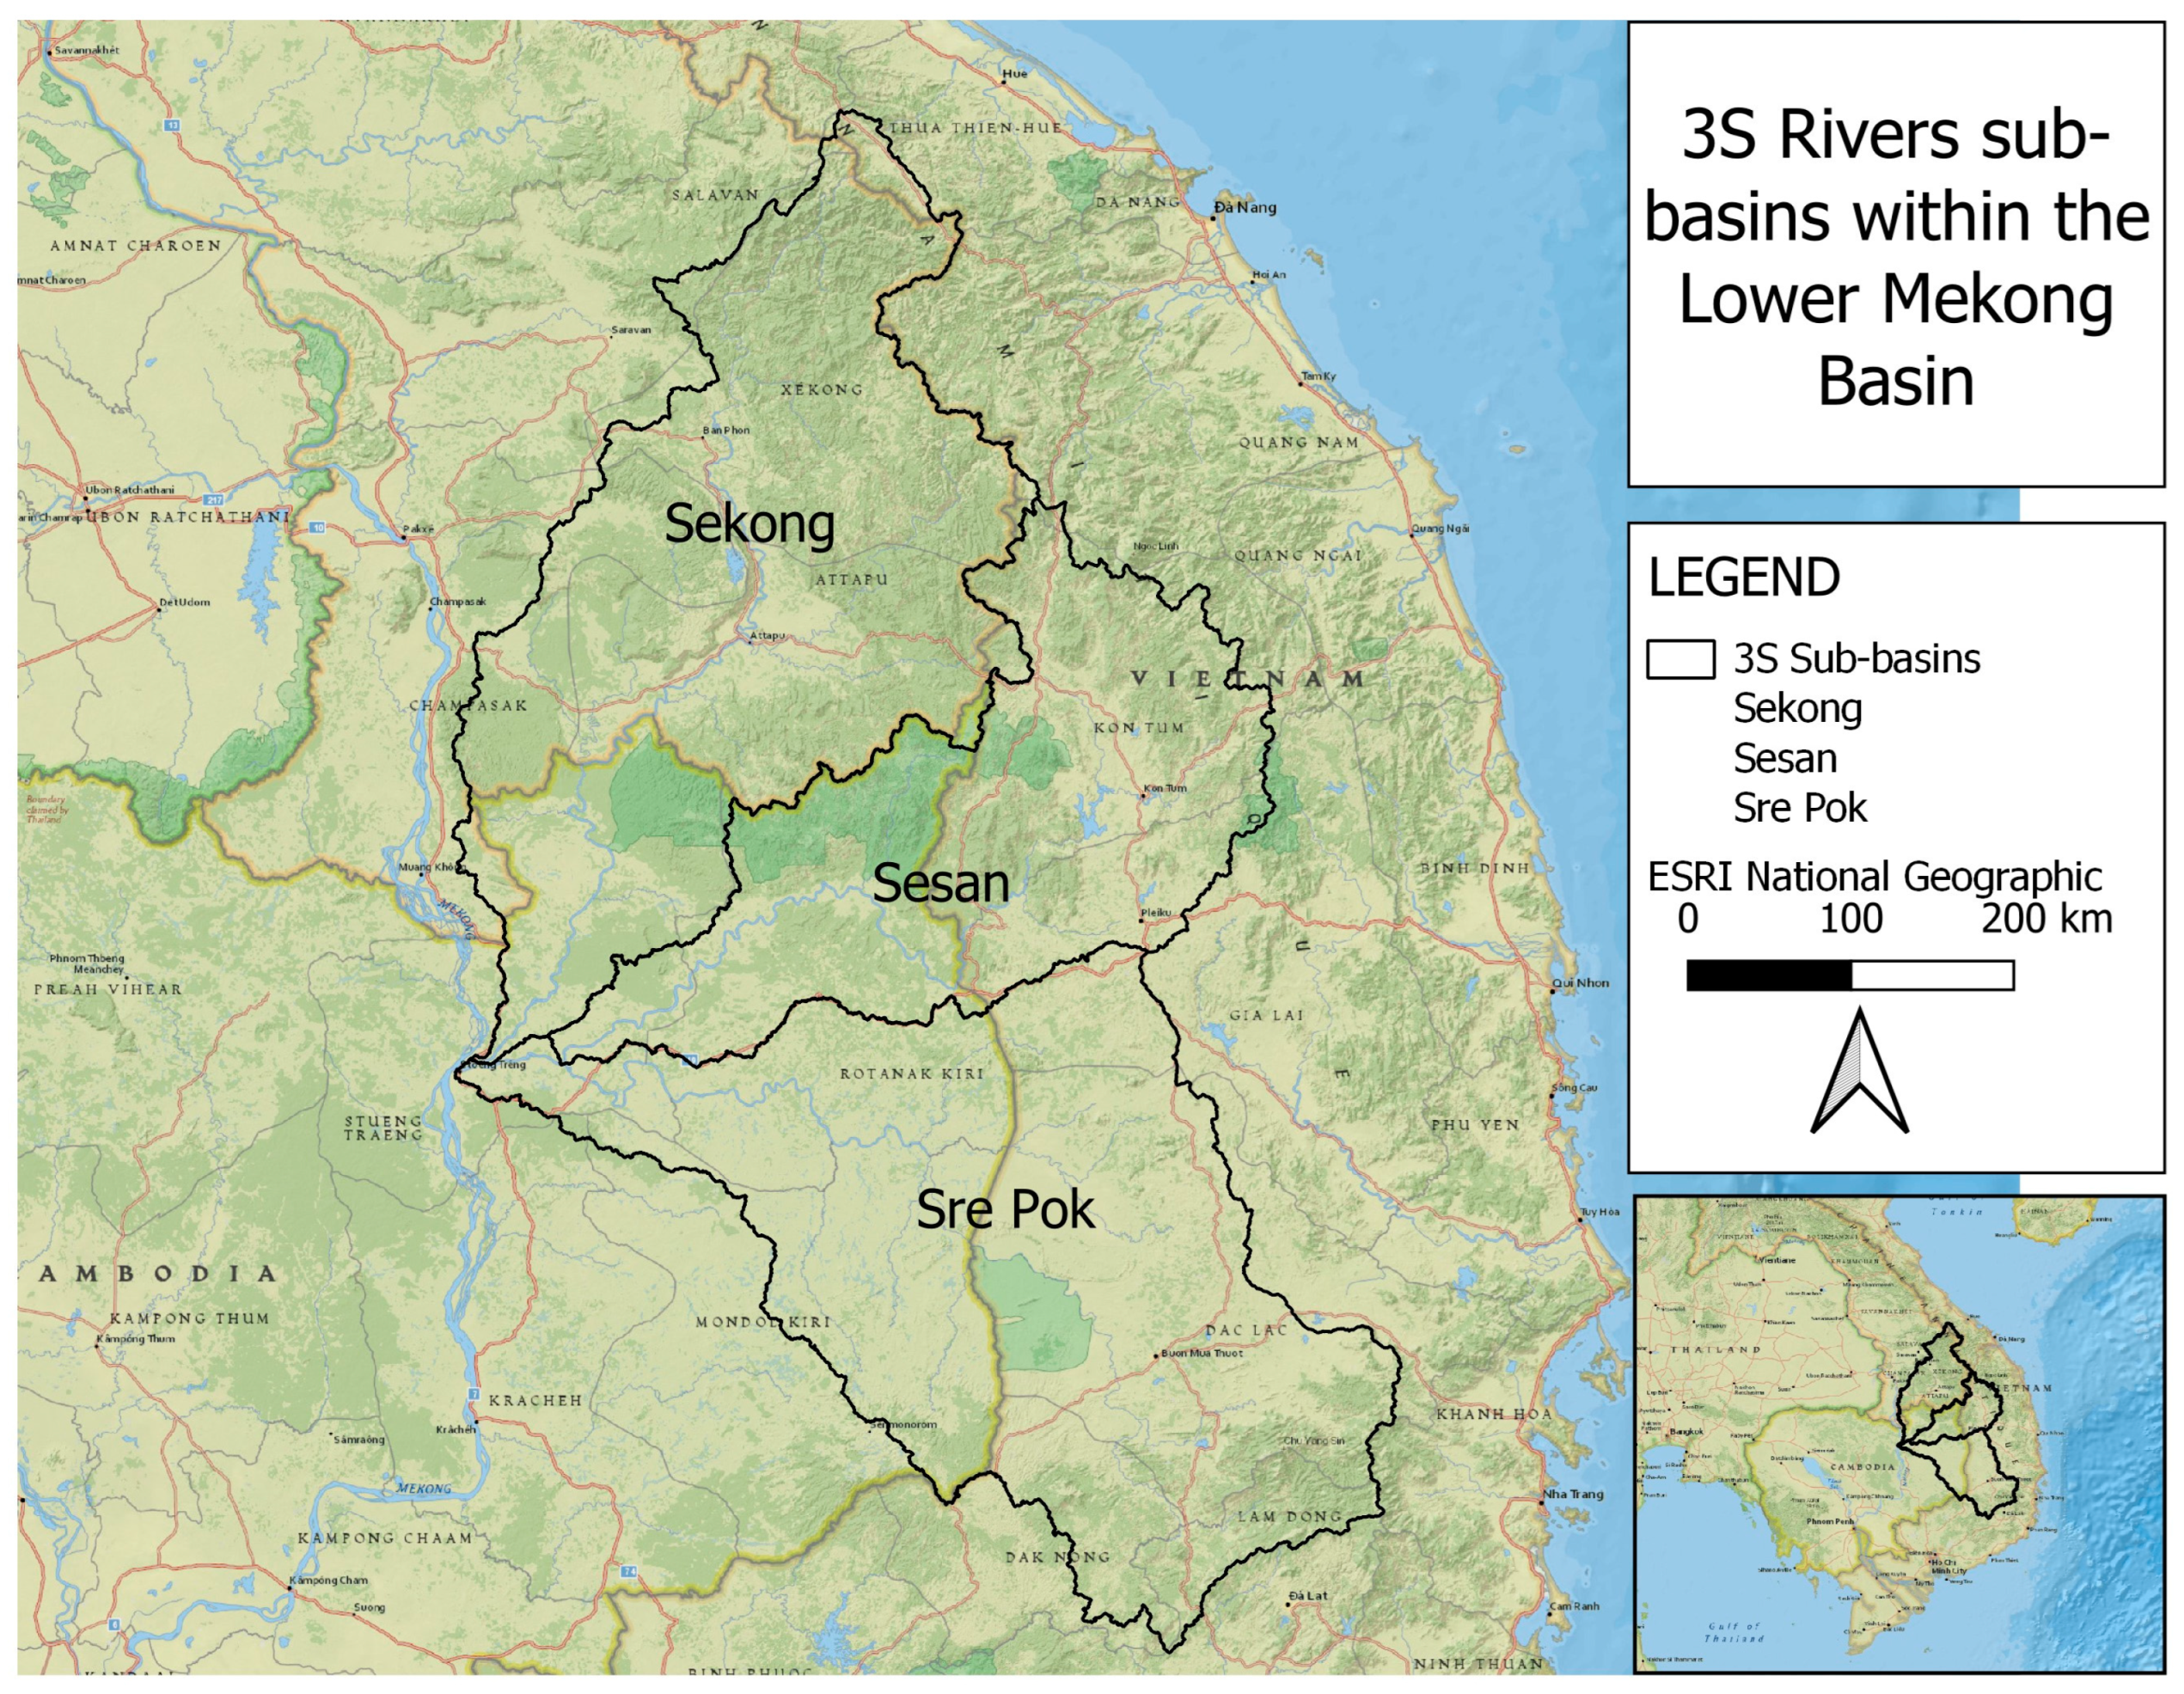
Figure 1 summarises the data used, processes for analysis and mapping of the results of this study, described in greater detail below.

2.2. Study Area

The catchment areas and flows of the 3S rivers are shown in Table 1 and Figure 2. While the Sre Pok has the largest catchment area (39%) compared to 37% for the Sekong and 24% for the Sesan, the mean annual flows from the Sekong are 43% of the total flow, much higher than the Sesan at 30% and even more than the Sre Pok at 26%. This reflects the higher rainfall in the Sekong catchment compared to the Sre Pok.
The mainstream of the Sekong rises in the Annamites with a small part of the catchment in Viet Nam. The river changes from fast-flowing reaches in the northern part of the catchment to broad floodplains characterised by slower-flowing water, sandy substrate, few rapids and deep pools. Rapids and deep pools are important geomorphological features of the Sekong, with 23 deep pools ranging from under 5 to 25 m deep [15]. As it flows in a south-westerly direction, it is joined by several tributaries, such as Dak-e-Meule and Houay Lamphan Ngai, and the Xe Nam Noy, Xe Pian and Xe Khampho arising on the volcanic massif of the Bolevan Plateau. The largest tributary is the Xe Kaman, joining the Sekong at Attapeu, with smaller tributaries such as the Xe Xou and Nam Kong within Laos. These tributaries have large- and medium-sized hydropower dams commissioned or planned, e.g., Xe Kaman 1 and 3. The river forms the border between Laos and Cambodia for about 50 km and then flows for 136 km through Cambodia to the confluence with the other two rivers. Three large protected areas lie in the Sekong basin—Xe Xap NPA in the headwaters, Dong Ampham NPA in Xe Kaman and Xe Pian NPA in the west. The Western Siem Pang Wildlife Sanctuary lies along the Cambodian border. The Sekong mainstem has been free-flowing, though there are several large dams on the tributaries, and at the border with Cambodia, a new mainstream dam—Sekong Downstream A—is under construction.
The Sesan River flows almost due west from Viet Nam into Cambodia, arising at the southern end of the Annamites with high elevation and slopes and then through the agricultural landscapes downstream of Plei Krong and Kontum. Baran identified eight ecological zones in the Sesan: (i) from the confluence with the Mekong to the confluence with the Sekong (ii) to the confluence with the Sre Pok—riverine wetland habitat, (iii) upstream for 100 km with long sand banks, (iv) upstream to the Vietnam border, a succession of sandbars and islands with some rapids, (iv) the cascade of dams in Viet Nam up to (v) the Yali Falls dam and reservoir, then (vi) upstream of the Plei Kong dam when the river consists of a mix of rocky channels, sand banks and small wetland areas, and (vii) and (viii) are two headwater rivers—Krong Poko and Dak Bla—with increasingly narrow rocky channels, sandbars and a succession of wetlands [25]. The oldest hydropower project was built at Yali Falls in 1996, with a cascade of four dams downstream to the border with Cambodia. Within Cambodia, the Sesan flows for about 260 km to the Lower Sesan 2 dam through rolling country, being rapidly converted to agricultural landscape [43]. The Lower Sesan 2 dam is located below the confluence of the Sesan and Sre Pok rivers, and the reservoir floods back up the Sesan for over 30 km and up the Sre Pok for over 50 km. There are four protected areas in Viet Nam, especially in the headwaters, e.g., Chu Mom Ray, and one in Cambodia, Virachey NPA.
The Sre Pok river is relatively flat with a lower elevation, although it rises to the highest elevation in the 3S basin in the volcanic range above Buon Ma Thuot, which extends to the west into the Mondulkiri province of Cambodia. The flatter areas of the Central Highlands have been extensively converted to agriculture, especially for coffee, with significant irrigation, which has decreased both groundwater and flows down the Sre Pok [2]. The Sre Pok is characterised by a dendritic drainage system of many tributaries. Only 11 deep pools have been identified on the Sre Pok, which is expected from the lower elevation gradient. The Sre Pok is formed by the confluence of two headwater rivers, Krong Ana and Krong Kno, just downstream of the border with Cambodia. There are two large waterfalls on the Krong Ana—Dray Nur and Dray Sap Falls—which lie between the cascade of hydropower dams of Buon Kuop, Sre Pok 3 and Sre Pok 4. In Viet Nam, there are several important protected areas in the Sre Pok basin especially, Yok Don and Chu Prong on the border with Cambodia and Chu Yang Sin in the headwaters. In Cambodia, the Sre Pok river flows through flatter dry dipterocarp forests of the Sre Pok and Lumphat Wildlife Sanctuaries [44].

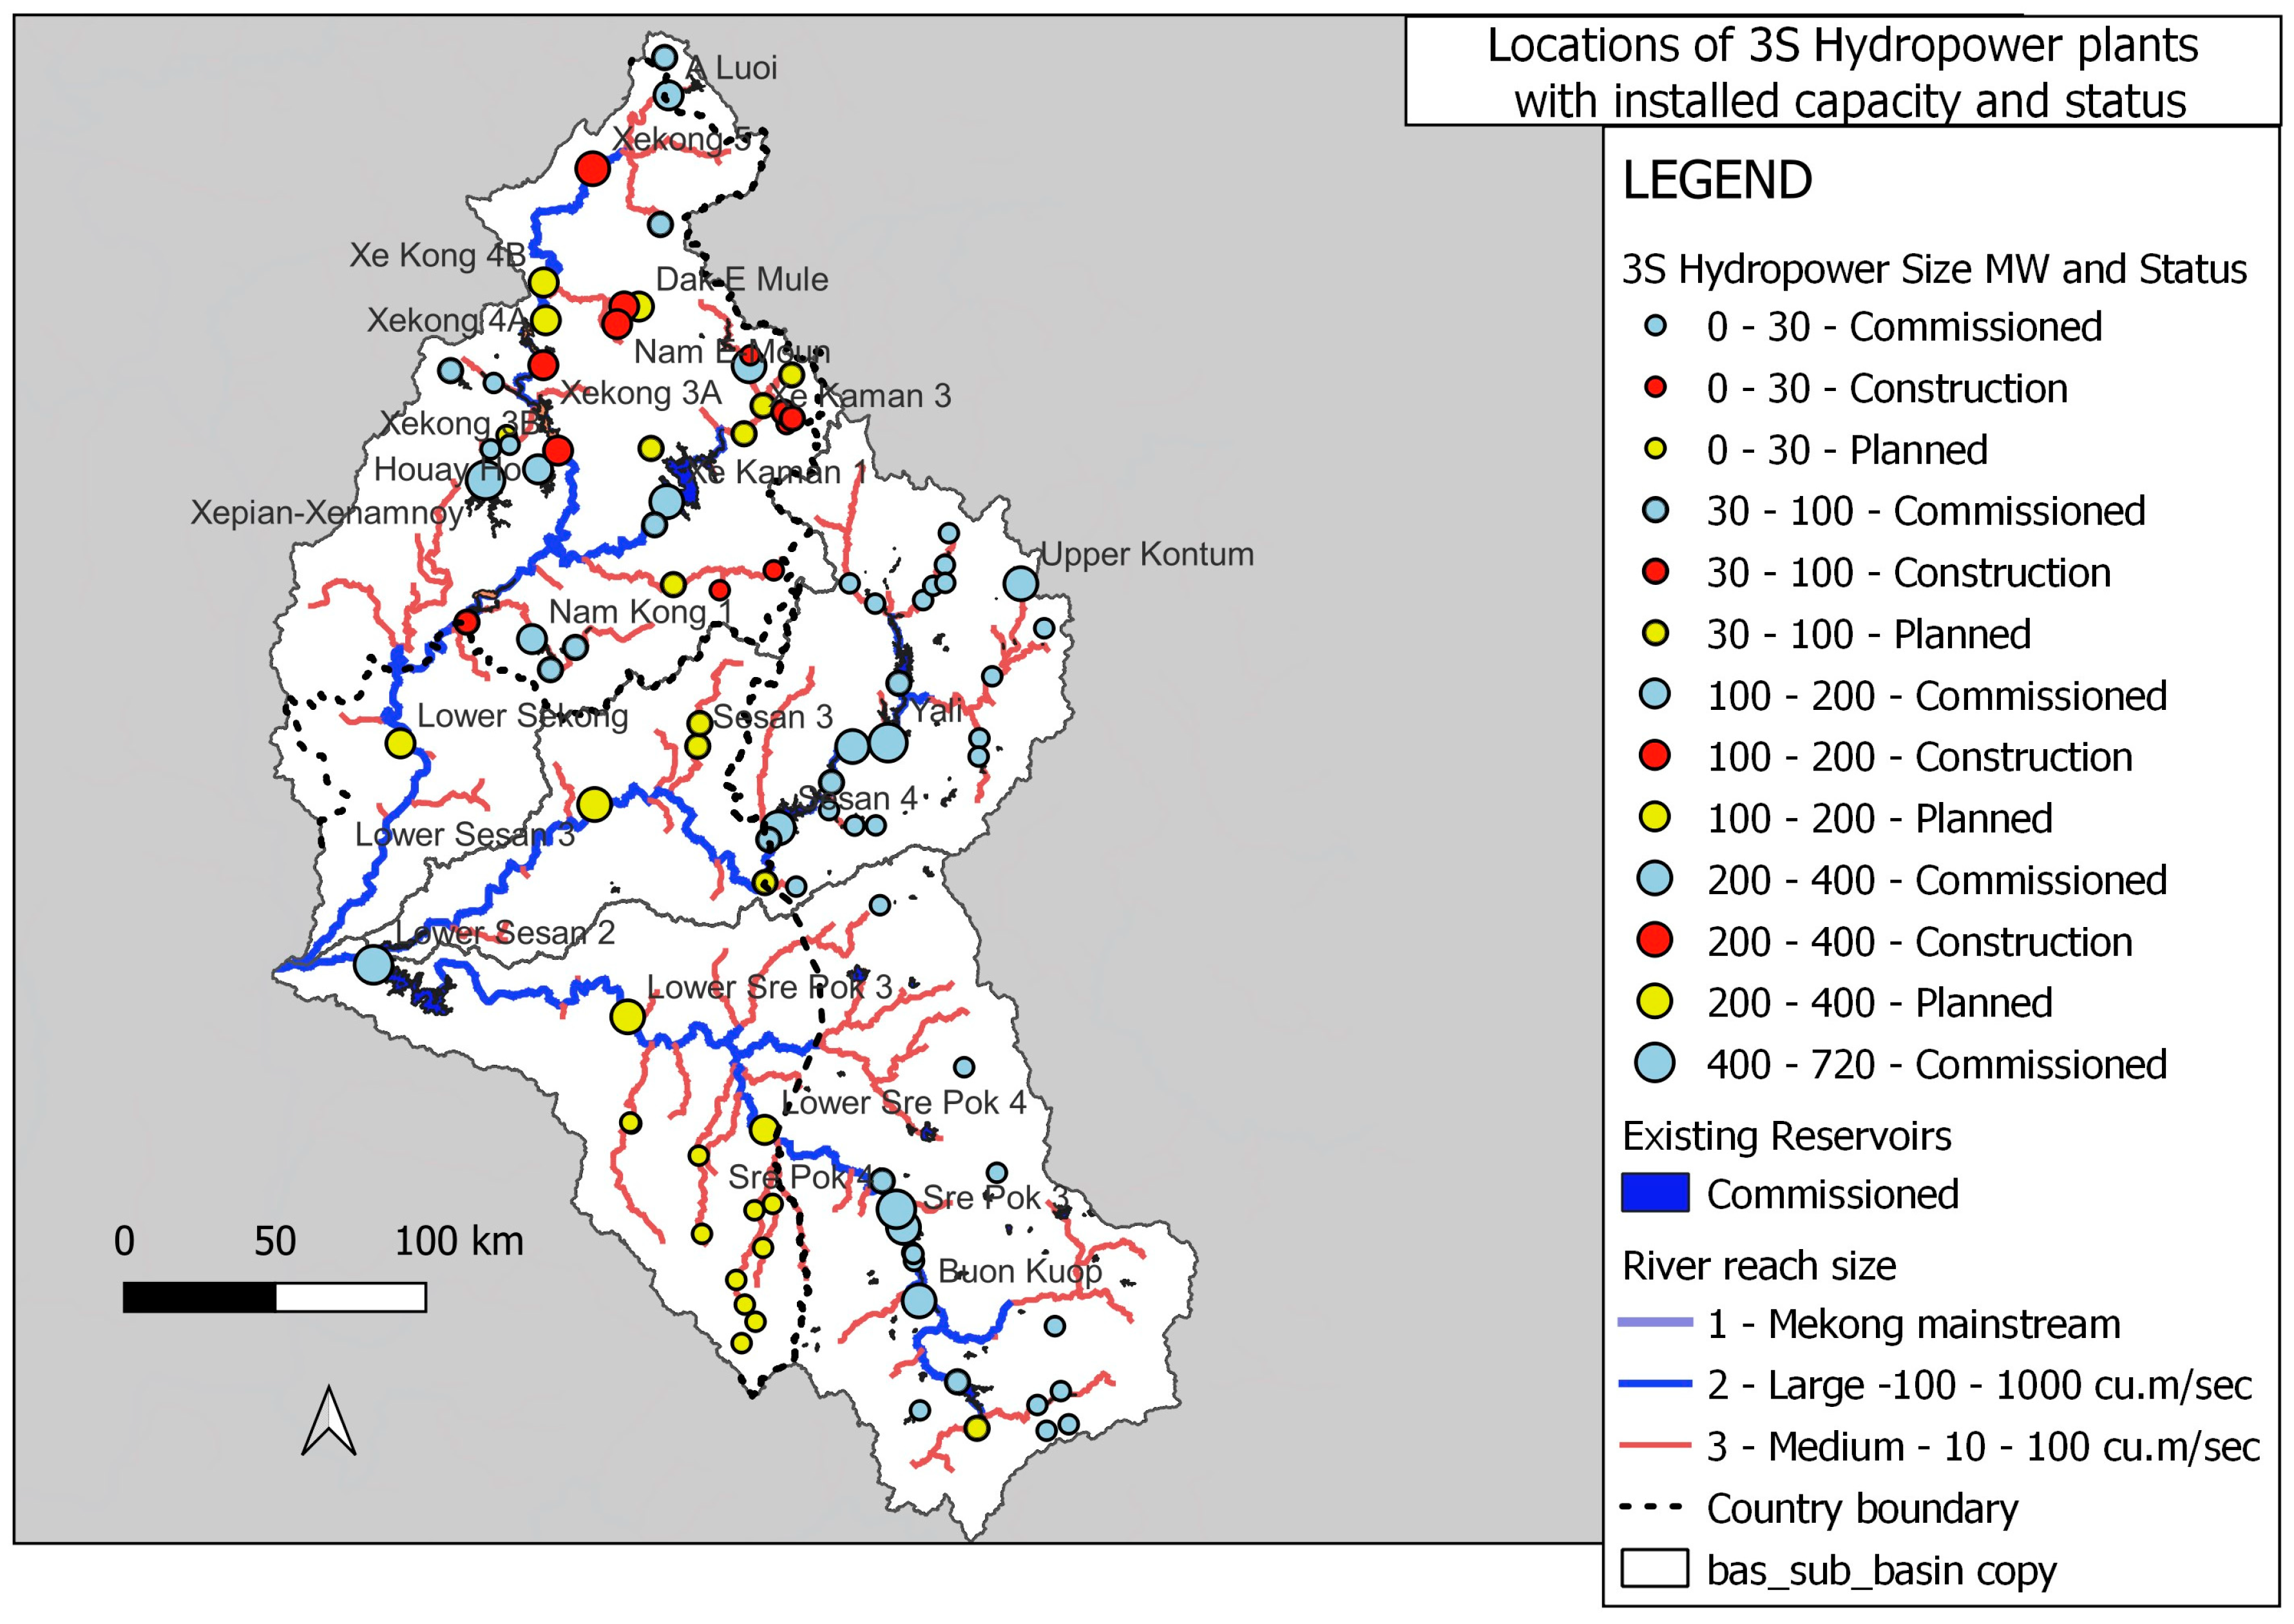
2.3. Distribution of Hydropower Projects in 3S Basins

Sources of information on the location, status and sizes of hydropower plants were collated from various sources, for example, the Global Hydropower Tracker [45], Open Development Mekong (Cambodia, Laos, Viet Nam) [46], Ministry of Mines and Energy, Lao PDR, IWMI-WLE [47], and Mekong River Commission. The sizes of the existing reservoirs were calculated from a GIS-based calculation of areas with permanent water in 2021 from the JRC Global Open Surface Water using the seasonality dataset [48,49]. The sizes of future reservoirs were based upon estimates by Servir Mekong [50]. The details of the hydropower plants found in each of the three basins can be found in Supplementary Material Table S5. The estimates of active storage within the key existing hydropower plants come from a recent study by the Stimson Center [2].
A schematic of the main large hydropower plants has been updated from the study by the Stimson Center to show the major barriers to fish migration (Figure 3). The two lowest hydropower plants, Lower Sesan 2 and Sekong Downstream A (currently under construction), do include some fish passage facilities. None of the other plants include fish passage, often because the dams are too high for effective fish migration.
There are a number of waterfalls on these rivers which would certainly have been a barrier to natural fish migration. The two most important waterfalls on the Sesan and Sre Pok rivers are Yali Falls, where the Yali HPP now operates, and the Dray Nur/Dray Sap Falls, which now lies between the Buon KuopHPP and Sre Pok 3 HPP. On the Sekong, the numerous smaller waterfalls which drain the Bolevan Plateau help to isolate the plateau from migratory species, but the Sekong mainstream has no major waterfalls right up to the headwaters.

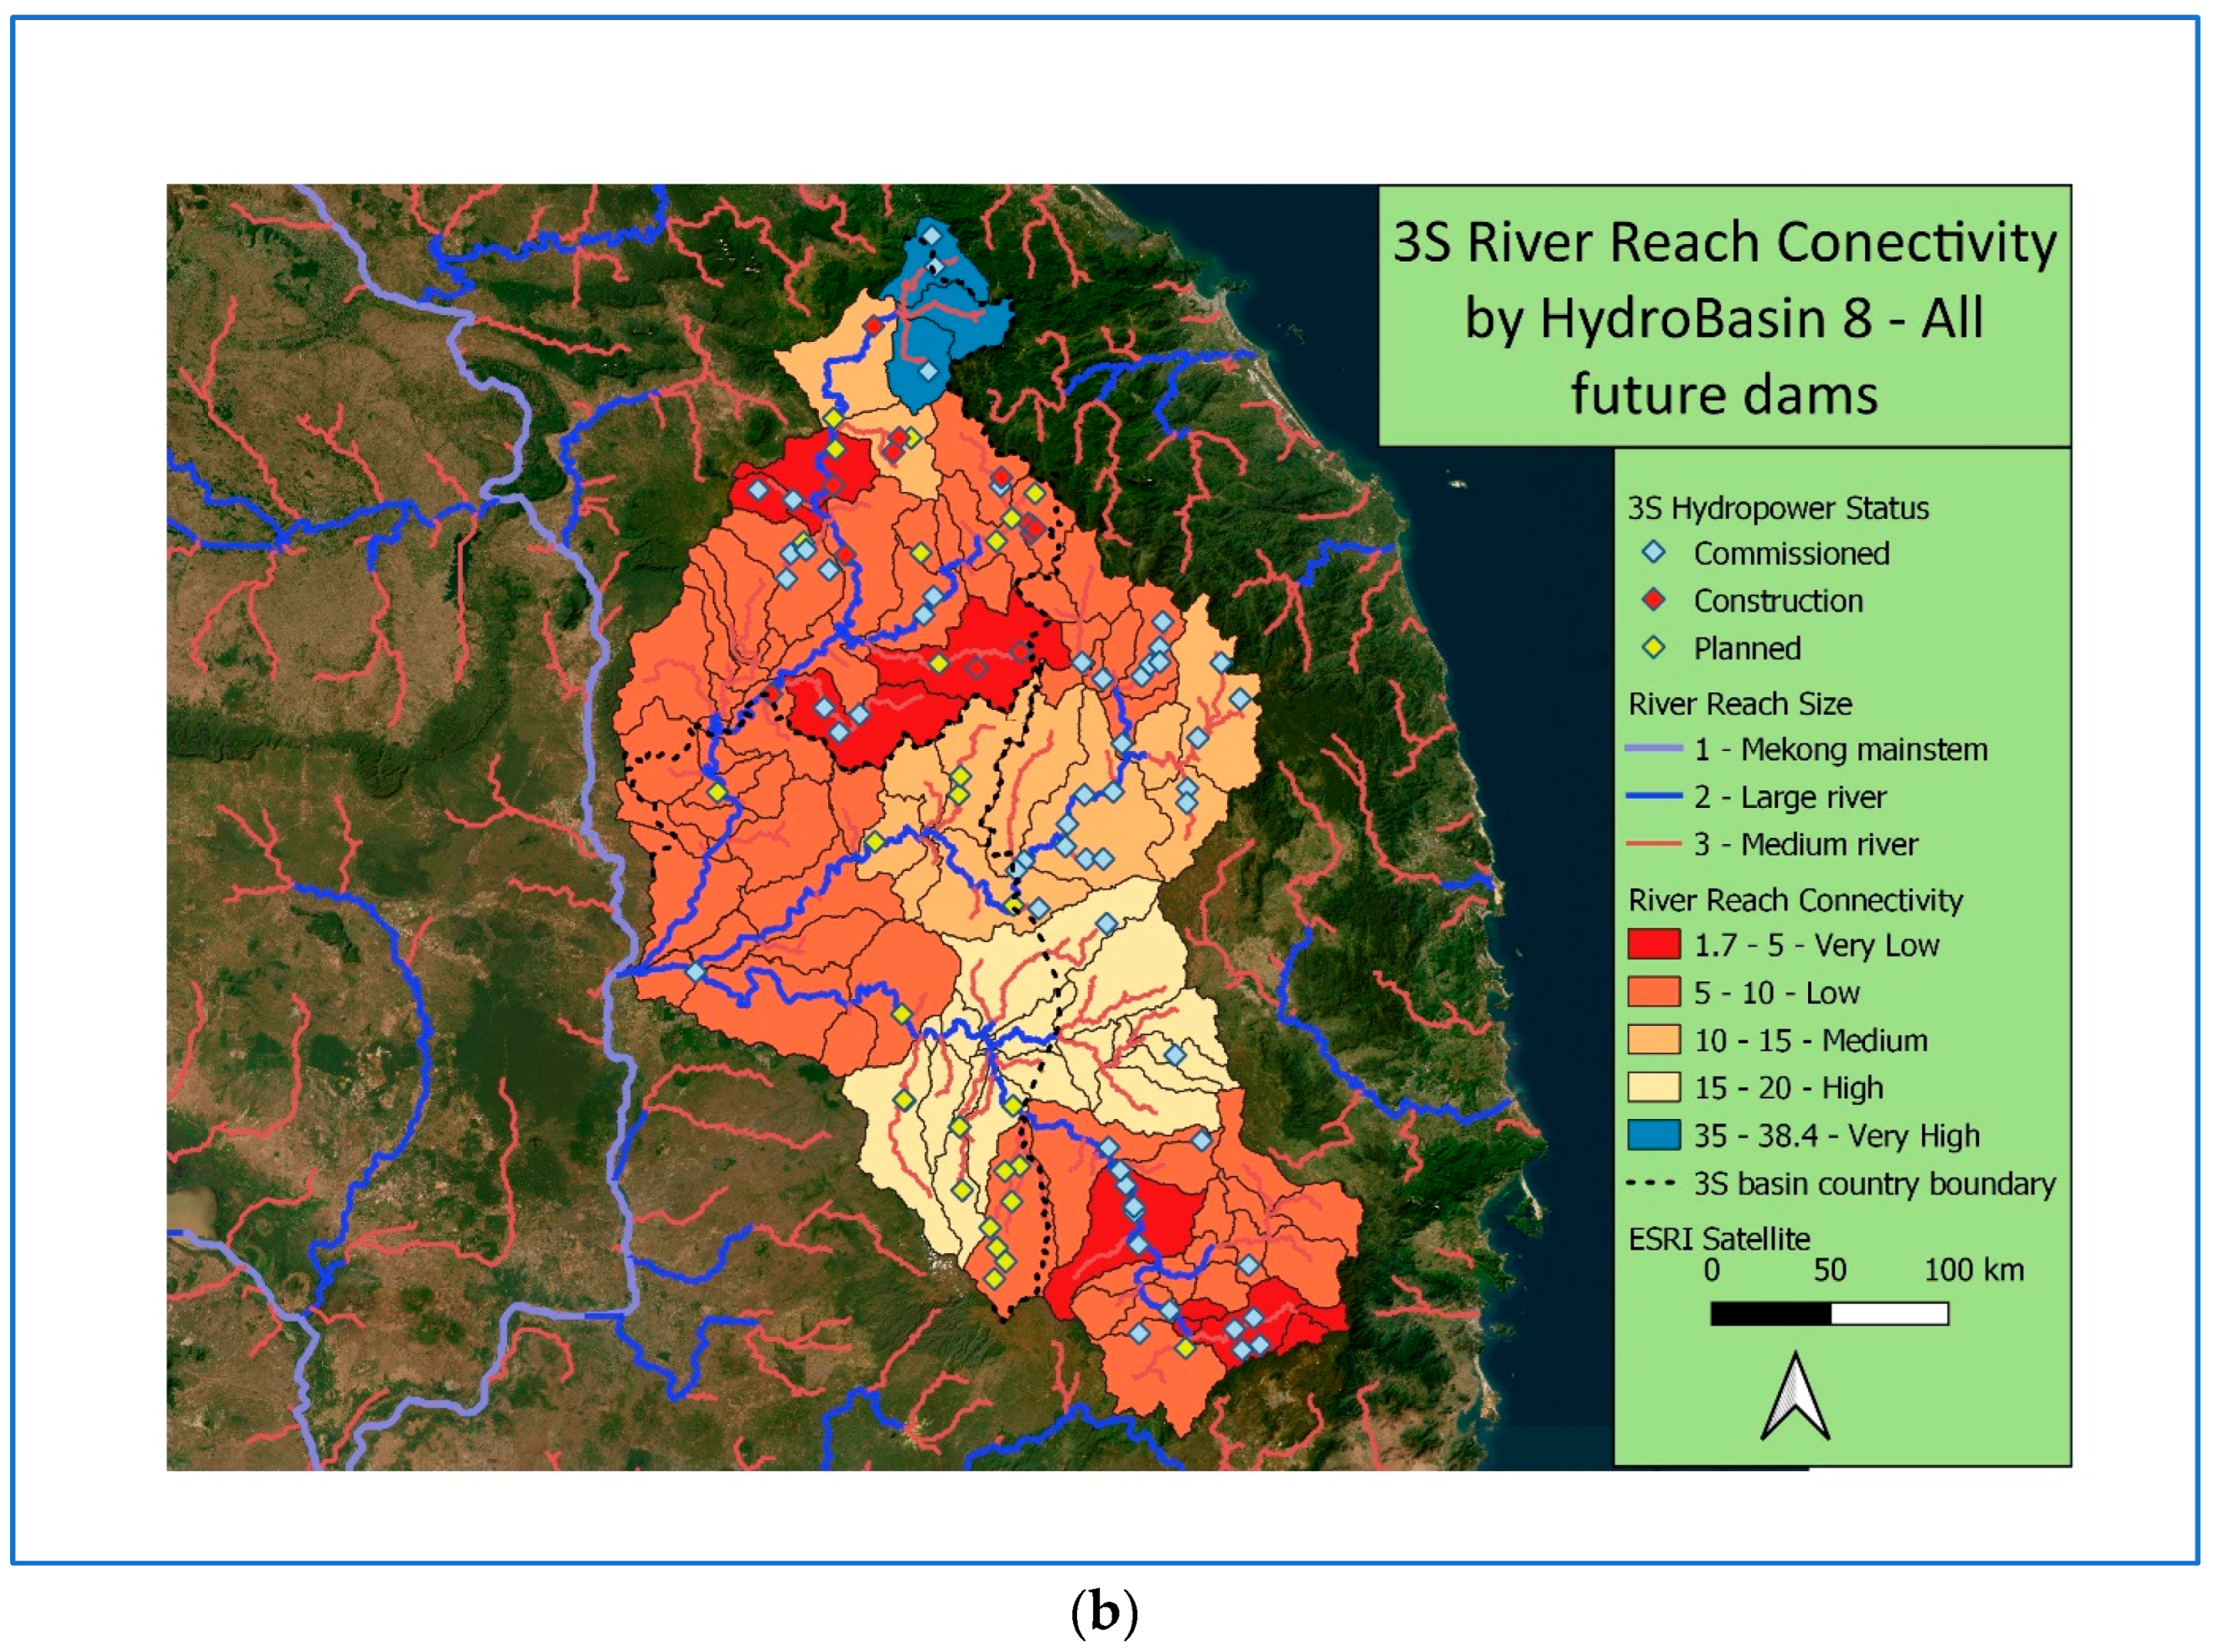
2.4. Connectivity of River Reaches within the 3S Basin

River reach classes have often been used as proxies for large-scale biodiversity management and can provide specific information to complement biodiversity and environmental data. Dallaire et al. have compared the spatial distribution of fish species in the Greater Mekong, estimating how much the variability in fish species data can be explained by river reach types. They used the GloRiC-GMR (Global River Classification—Greater Mekong Region) dataset with 70 river reach types, developed for the WWF in 2013 [51], to correlate with the distribution of fish species in the Indo-Burma Biodiversity Hotspot as described by Allen et al. [18]. They show a statistically strong, positive correlation between fish species and the main river basin in the GMR, and a moderate correlation between the fish species and river reach types. However, their river reach types did not include data on migratory species, habitats and migration routes. The fish species data use sub-basins (HydroBasins) with a mean area of 500 km2 with multiple river reach types and are therefore coarser than the river reach dataset. They note that their use of IUCN data is a first step to providing large-scale species data [52].
In order to estimate the connectivity of the 3S rivers, we have adapted the River Class Connectivity Index, developed by Grill et al. [40] by using the more detailed river reach classification developed for the Greater Mekong Region used in the study above [51]. This river reach classification for the Greater Mekong is based upon five river sizes with hydrological, physical and geomorphology attributes. Within the 3S river basins, 24 river reach classes are represented. We calculate the lengths of each river reach class within the 3S HydroBasins Level 8, which is also the scale at which the distribution of fish species is provided from the IBAT Freshwater reports. These lengths are then expressed as a percentage of the total lengths of each class in the 3S basin. The river reach connectivity of the HydroBasin is taken as the average percentage length of all the river reaches represented.
An undammed 3S basin is assumed to have 100% connectivity, with all 24 river reach classes connected. In an undammed river, all the different river reach classes or river habitats are connected with each other, allowing movement and mixing of fish and other aquatic species throughout the basin. Hydropower dams reduce the basin connectivity, isolating river reaches and HydroBasins. When dams are constructed, groups of upstream HydroBasins become isolated and their connectivity within the wider basin is reduced. Maps have been created showing the connectivity index for groups of HydroBasins with both large existing and under-construction dams and future planned dams. The overall connectivity index for the entire 3S basin would be calculated as the average connectivity of all the isolated groups of HydroBasins. Note that this method also picks up rare river reach classes which are only found in a few HydroBasins, e.g., in the upper reaches of the Sekong, resulting in high connectivity scores.

2.5. Distribution of Fish Species

Baran consolidated earlier field surveys of the fish species in each of the three rivers conducted between 1995 and 2009 [25]. This provides the baseline for the fish species in the 3S. However, these lists do not differentiate between parts of the three rivers, and it is recognised that different species occupy headwaters or lowland reaches nearer the confluence with the Mekong. Some of the specialist surveys have identified super-endemic species with very restricted ranges in the Sekong, e.g., [17,24], which would have been consolidated into the whole river lists.
The Integrated Biodiversity Assessment Tool (IBAT) provides access to three key global biodiversity datasets: the IUCN Red List of Threatened Species, World Database of Protected Areas and World Database of Key Biodiversity Areas [53]. The IBAT Freshwater reports allow lists of Red-Listed aquatic species (fish, turtles, molluscs, crustacea, odonata and plants) to be compiled in HydroBasins Level 8 [54] both upstream and downstream of a selected site (HydroBASINS represents a series of vectorised polygon layers that depict sub-basin boundaries at a global scale. extracted from the gridded HydroSHEDS core layers at a 15-arc-second resolution). The big advantage of the IBAT list over the consolidated species lists is that the species distribution by HydroBasins can be mapped. Within the 3S rivers, there are 155 Level 8 HydroBasins, so a much more detailed distribution within each river is possible.
We have accessed the IBAT Freshwater reports for the three main rivers and their tributaries to develop the fish species that have been assessed for the Red List and which have clearly defined distribution ranges. We have then compared this list with the survey lists consolidated by Baran (Supplementary Material, Table S1) in order to verify the use of the IBAT listing for this study. In this cross-check of the latest IBAT listing, we find that 66% of the fish species recorded by IBAT were also identified in the various surveys, with a combined listing of 333 species, of which 224 are common to both lists. The differences between the two lists are explained in the Results section. It is considered that the IBAT listing is the best available dataset, with the added advantage that the IBAT tool for freshwater species allows the identification of Red-Listed species likely to be present in that HydroBasin and in each of four groups of HydroBasins at 50 km, 100 km, 150 km and over 150 km upstream and downstream of the site. For the Sekong, the HydroBasin around the confluence of the Sekong and Xe Kamman at Attapeu was the chosen site; for the Sesan and the Sre Pok, the chosen sites were on the border between Viet Nam and Cambodia. In this way, the three rivers can each be divided into a total of 9 groups of HydroBasins covering headwaters to the confluence with the Mekong. Some of the tributaries and HydroBasins off the mainstream have to be assessed with separate IBAT freshwater reports, in order to get coverage of the complete 3S basin, e.g., Xe Pian.
The numbers of species and the numbers of threatened species likely to occur in each HydroBasin can be mapped; by applying migratory guild information, the numbers of migratory species can also be mapped. The wider Mekong basin has a large number of Mekong-endemic species, of which 61 are represented in the 3S, with an additional 28 super-endemic species that are only found in the 3S. Identification of the endemics and super-endemics was based upon the IUCN Red List range details, FishBase: A Global Information System on Fishes [55], and an earlier report for the Mekong River Commission [56].
The IUCN Red List status is identified in the IBAT lists. For this study, a fish species Rarity Index was calculated by adding CR numbers weighted by a factor of 3, with EN numbers weighted by a factor of 2, plus unweighted VU numbers, and dividing by the total number of fish species in each river basin. This Rarity Index gives a measure of the threatened fish species in each Level 8 HydroBasin.
Both the IBAT and IUCN Red Lists identify those fish species that make regular or seasonal cyclical movements beyond the breeding range with predictable timing and destinations as “Full Migrants”. In contrast, “Altitudinal Migrants” are those which regularly/seasonally make cyclical movements to higher/lower elevations with predictable timing and destinations. However, there are several different migratory movements made by fish; not all of these will be seriously impacted by barriers such as dams, some migrations may be over a shorter distance within a tributary or may be lateral migrations from the mainstream into floodplain wetlands for spawning in the flood seasons. In order to differentiate between the movement patterns of fish, we categorised the fish species by guild using the classification of Halls and Kshatriya [33], and with reference to the species information in the Red List and FishBase. Baran has identified the 55 most important migratory species moving into the 3S basins from the Mekong mainstream [25] (see Supplementary Material Table S3). These have been cross-referenced with the IBAT list. The identification of the guild of each species is based upon the available information on habitat and migratory behaviour, which may be questionable for some species, but is considered appropriate as a first attempt to subdivide migratory species.
A definition of these fish guilds is shown in Supplementary Material Table S2. Drawing upon the potential of the different fish guilds to be affected by dams and fish passage in Table 2, we have suggested a dam migration impact factor ranging from 0 to signify little or no impact to 1 to signify a very high impact. This factor is then used to estimate the number of species that will be affected by each dam. In a cascade of dams with fish passes, the factor is used repeatedly, indicating the cumulative effect of reducing migration. Using this method, in each HydroBasin where major dams are located, we estimated the reduced numbers of fish species present in upstream groups of HydroBasins as a result of barriers to fish migration.

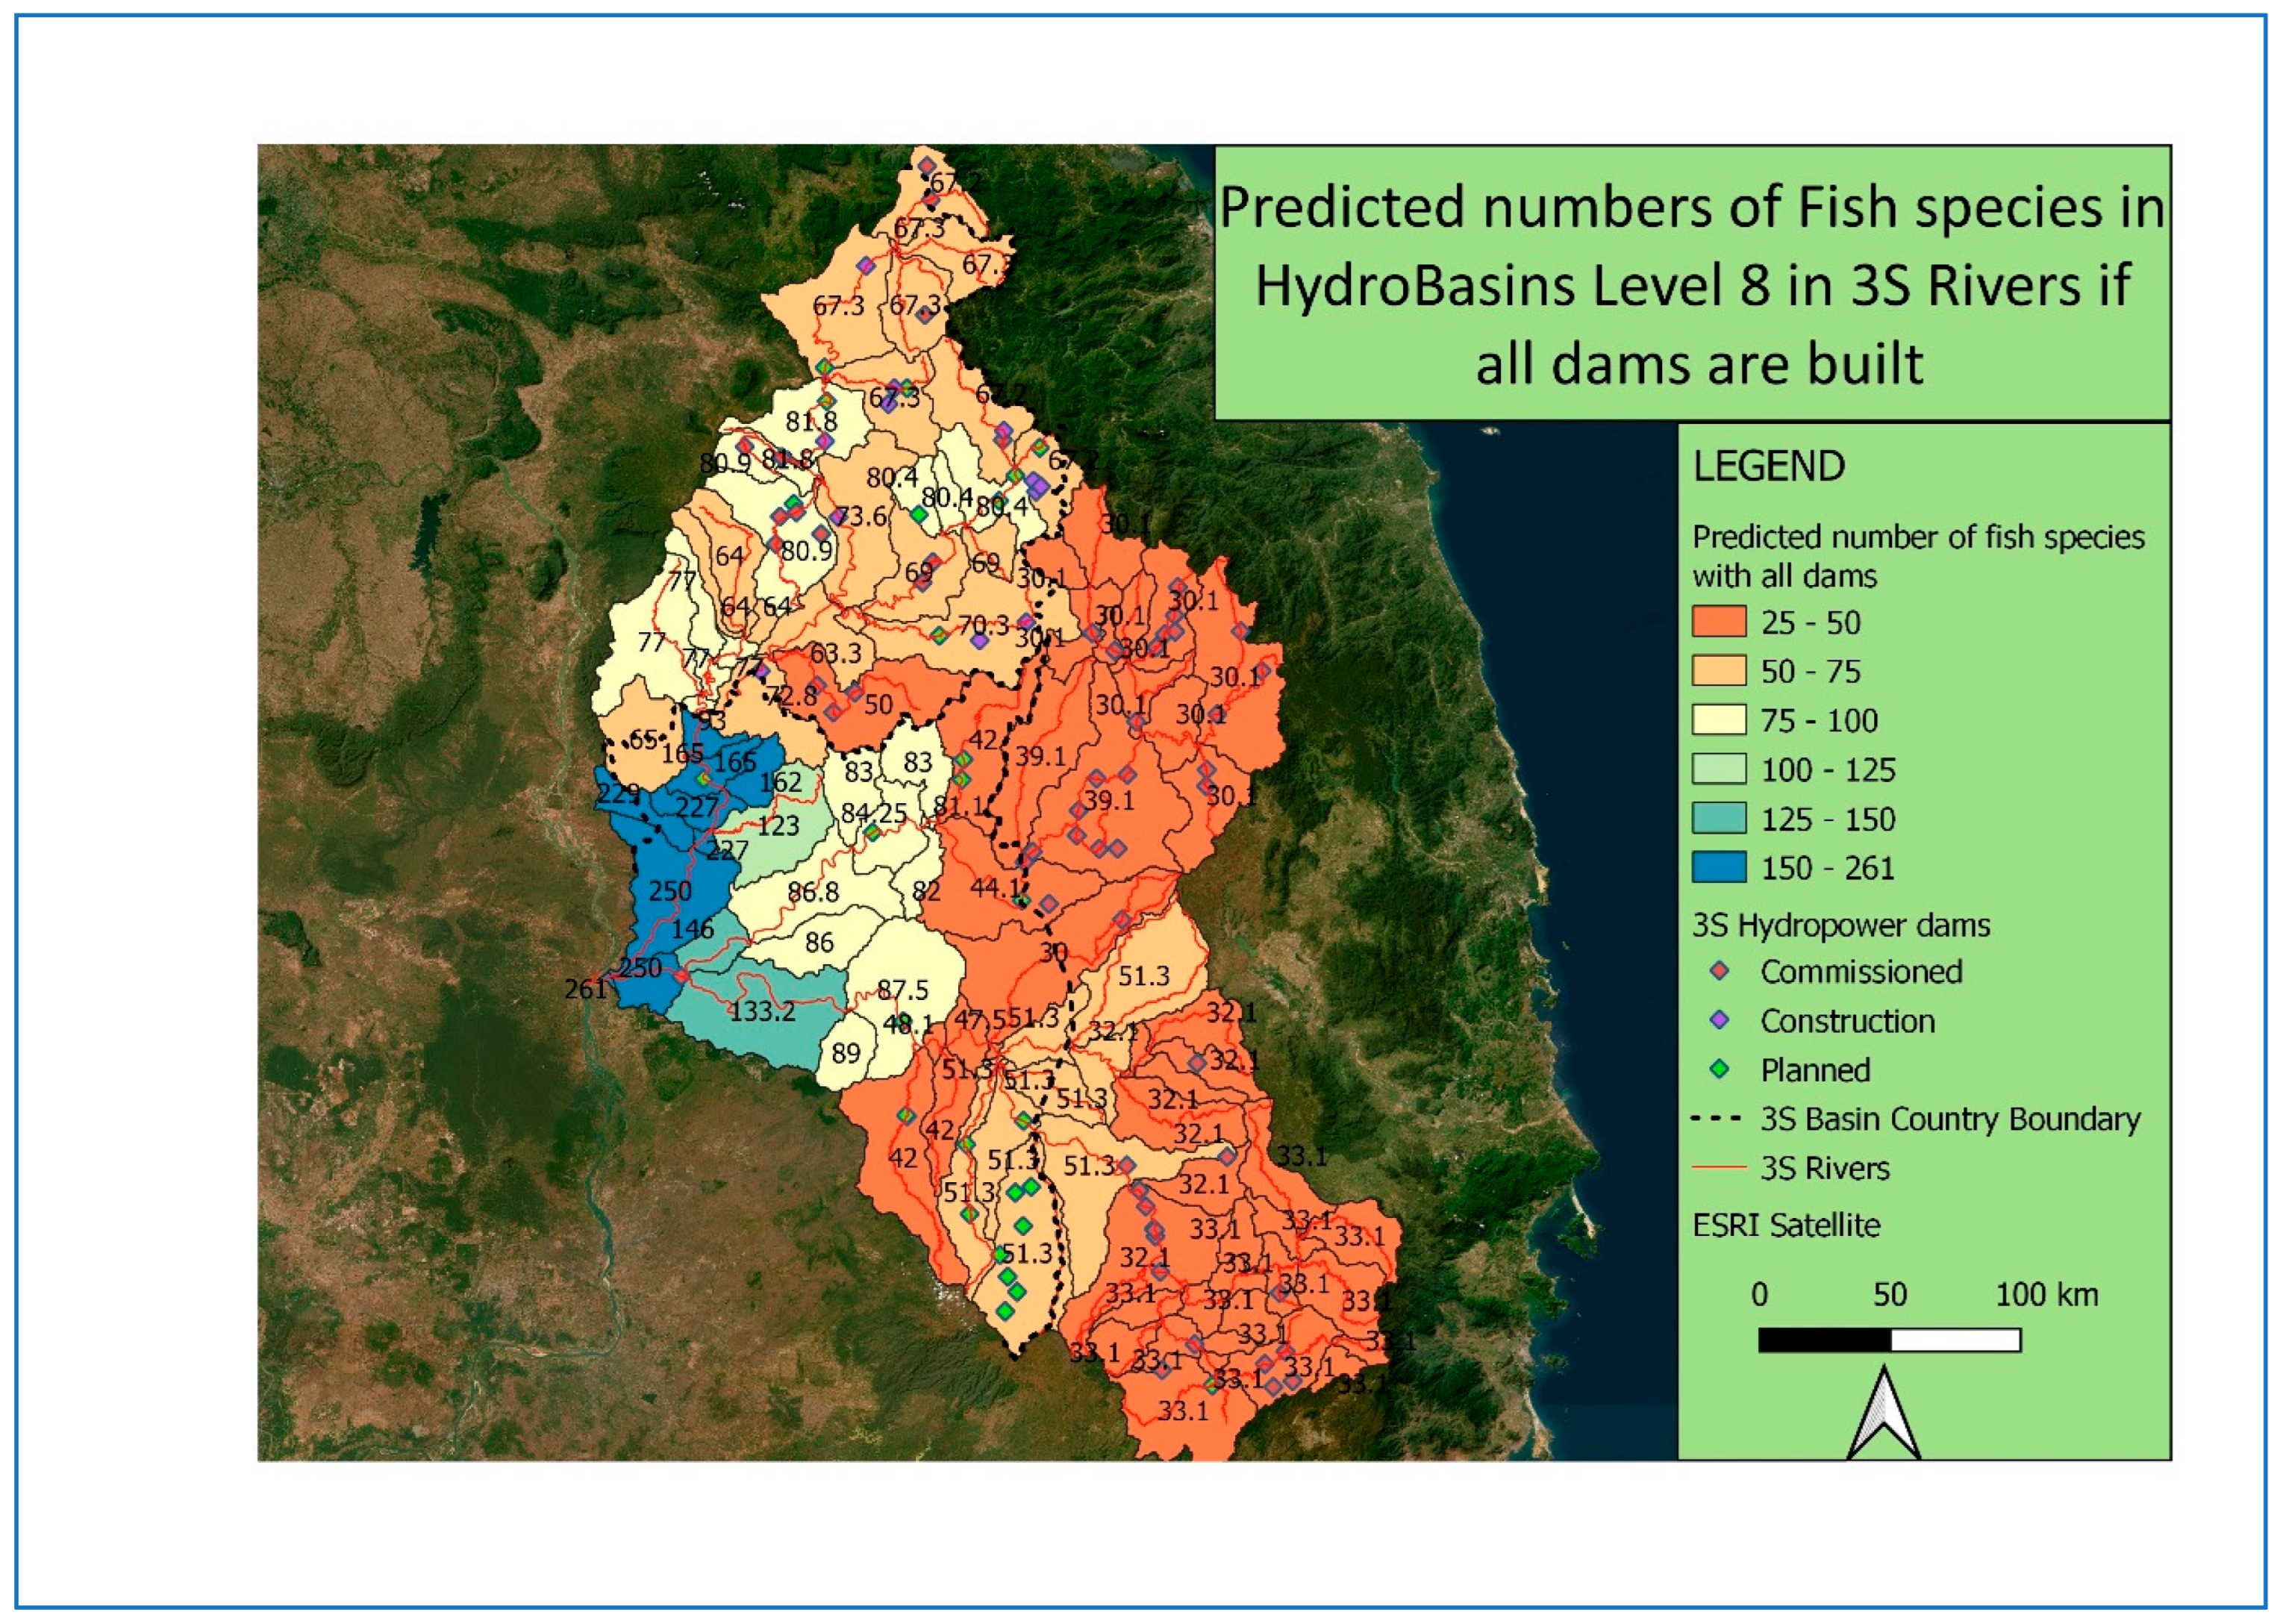
2.6. Impact of Reservoirs on Species Distribution

Reservoirs created by hydropower dams change the hydraulic conditions from the flowing waters in the river to a very slow-moving lacustrine environment. This change has implications for the fish populations in the rivers. The fish most likely to remain within the reservoirs will be the generalist guilds, and experience in the Lower Mekong reservoirs shows that non-native species such as carp and tilapia often predominate. The presence of non-native species is not recorded in the IBAT lists, but earlier surveys show that at least 6 non-native species occur in the 3S basin.
In the upper reaches of the rivers where many of the hydropower projects are located, the stream flow can be very fast, and fish that frequent such fast-flowing water such as the rithron-resident guilds will not survive within the reservoirs; as the reservoir fills, they will move upstream if they can. Rithron-resident species live in habitats of rapidly flowing rivers and streams, with rocks, sand and gravel substrates. They are generally found in the headwaters or in rivers with high gradients, rapids and waterfalls. Many of the endemic species, both within the Mekong and super-endemics within the 3S basins, are rithron residents. These species are at the greatest risk of extinction by hydropower reservoir development.
An estimate of the risk to these species was calculated with the following steps:
  • Calculating the proportion of the lengths all the river reach classes with high gradients in each Level 8 HydroBasin—codes 33102, 33302, 43102, 43302, 44102, 48300, 53300 and 58300. The full list of the river reach classes in the 3S is found in Supplementary Material Table S6.
  • Calculating the proportion of the area of each Level 8 HydroBasin which has been or will be inundated by hydropower reservoirs.
  • Multiplying these two proportions together to obtain an estimate of the percentage of the river reach classes that will be inundated in each Level 8 HydroBasin.
  • Multiplying the percentage of inundated, high-gradient river reaches by the number of rithron-resident species represented in each Level 8 HydroBasin. The resulting values are then normalised to show very high to very low risks to rithron-resident species in each HydroBasin.

3. Results

3.1. Existing and Proposed Hydropower Projects in 3S Basin

Table 3 and Table 4 show a summary of the existing and future planned hydropower projects in each of the 3S rivers. The location, status and installed capacities of these dams are illustrated in Figure 4. Detailed information about each of the dam sites is shown in the Supplementary Materials, Table S5. Most of the hydropower projects have been constructed in the Viet Namese portions of the three rivers, with the largest number in the Sesan, including the cascade of large dams from Plei Krong, Yali, and Sesan 3, 3A, 4A and 4B. On the Sre Pok in Viet Nam, there is a cascade of large dams from Buon Tua Srah, Buon Kuop, and Sre Pok 3, 4 and 4A.
In Cambodia, there is only one large dam—Lower Sesan 2, located below the confluence between the Sesan and Sre Pok rivers. This is a major barrier to fish movement and although a fish passage has been constructed, a recent study has reported on its effectiveness in allowing fish migration, and it appears to allow some but not all of the target migratory fish to pass [34]. In the future, one large dam on the Sesan (Sesan 3) is planned with another on the border between Cambodia and Viet Nam, and two large dams (Sre Pok 3 and 4) are planned on the Sre Pok river. All three of these dams in Cambodia are currently projected to have large reservoirs, but it is expected that the area inundated may be reduced as the design process progresses, though this would be at the expense of storage and installed capacity.
On the Sekong in Lao PDR, 14 dams have already been constructed and 11 are at different stages of construction; 12 more large or medium dams are planned. At present, the largest dam is the Xe Kaman 1 and Xe Kaman–Sanxay dam on a major tributary of the Sekong, and two other large dams on the Bolevan Plateau—Xe Pian/Xe Nam Noy and Houay Ho. There are no large dams on the Sekong mainstream from the confluence to the headwaters in Viet Nam, where A Luoi HPP diverts water seasonally away from the Sekong. This free-flowing river—the last major undammed tributary of the Mekong—is now changing with the construction of Sekong Downstream A, located just upstream of the Laos/Cambodia border, and, we understand, incorporating a fish pass. Other mainstream dams on the Sekong are beginning to be constructed or designed—Sekong 3A and B, Sekong 4A and B, and Sekong 5. In addition, in Cambodia, there is the Lower Sekong dam planned in the Siem Pang district.

3.2. Mapping the Connectivity of the River Reaches with Existing and Future HPPs

The barriers created by these existing and proposed dams have inevitably disturbed the connectivity of the rivers. Many of the sub-basins or groups of HydroBasins have been isolated by both dams and reservoirs. The connectivity indices of these groups of HydroBasins for the existing situation and for the future situation when all large dams have been built are shown in Figure 5.
Figure 5a shows the existing situation with only commissioned dams. It can be seen that the Sekong river reaches are connected throughout the entire length of the mainstem, with a few tributaries on the Bolevan Plateau, Xe Kaman and Nam Kong showing low and very low connectivity. In the Sesan, the river reaches above Lower Sesan 2 to the Viet Nam border have high connectivity within Cambodia, but these decline to medium connectivity in the middle reaches of the upper Sesan, especially in the HydroBasin with the Yali and the Sesan 3 and 4 dams. Connectivity declines further in the river reaches above the Plei Krong dam. On the Sre Pok, much of the HydroBasins above Lower Sesan 2 have medium connectivity, slightly lower than the Sesan, until the cascades of Sre Pok 3 and 4 and Buon Kuop are reached. This HydroBasin has very low connectivity. The HydroBasins above Buon Tua Srah have low connectivity.
The overall connectivity score of the whole basin, i.e., the average of all the HydroBasin scores, is 23.5%, compared to a score of 100% if no dams had been constructed. If we consider that the two large waterfalls of Yali and Dray Nur/Dray Sap (250 m long and 30 m high) would reduce the connectivity naturally, the 3S basin prior to any dam construction would have had a connectivity index score of 80.9%. The building of Yali HPP and Buon Kuop by themselves would not have changed this natural level of connectivity.
In contrast, Figure 5b shows the situation including all future dams (commissioned, under-construction and planned dams). The future connectivity score for the whole basin will be just 10.9%—half the current score. The major change will be the loss of connectivity caused by the construction of the Sekong Downstream A, Sekong 3A and 3B, Sekong 4A and 4B, and Sekong 5 dams. The future construction of the Lower Sekong dam in Cambodia would break the connectivity of the Xe Pian tributary of the Sekong. The Sekong mainstream scores would fall from very high to low, apart from the Sekong headwaters, which would retain their high connectivity score, because of the 100% presence of several very rare reach classes in karst landscapes (48,100—small river, in karst region at low elevation; 48,300—small river, in karst region at high elevation; 58,100—small headwater stream, in karst region at low elevation; 58,300—small headwater stream, in karst region at high elevation).
The HydroBasins between Lower Sesan 2, Lower Sesan 3, and Lower Sre Pok 3 have similarly low connectivity scores to the Sekong, but the upper Sesan above Lower Sesan 3 and into Viet Nam has medium connectivity scores. The HydroBasins between Lower Sre Pok 3 and Lower Sre Pok 4 retain a high score, but above Lower Sre Pok 4, the HydroBasins have a low score, and the cascade of the Sre Pok 3 and 4 and Buon Kuop dams has very low connectivity. The construction of the Duc Xuyen dam in the upper reaches of the Sre Pok will further reduce the connectivity of these highland HydroBasins.
This analysis illustrates how the dams have already greatly reduced the connectivity of the river reaches in the 3S HydroBasins. Figure 5a,b show visually how further planned dams on the Sekong, in particular, will reduce the connectivity of the mainstem in the north of the region. All three rivers will see further large increases in areas inundated with reservoirs above new dams, with by far the greatest expansion in reservoir area on the Sre Pok river. This continuing expansion in dam construction can be anticipated to result in more isolated populations of fish species, further preventing the migration and mixing of species. The consequent effects on fish distribution are already evident, as the analysis in the following section shows.

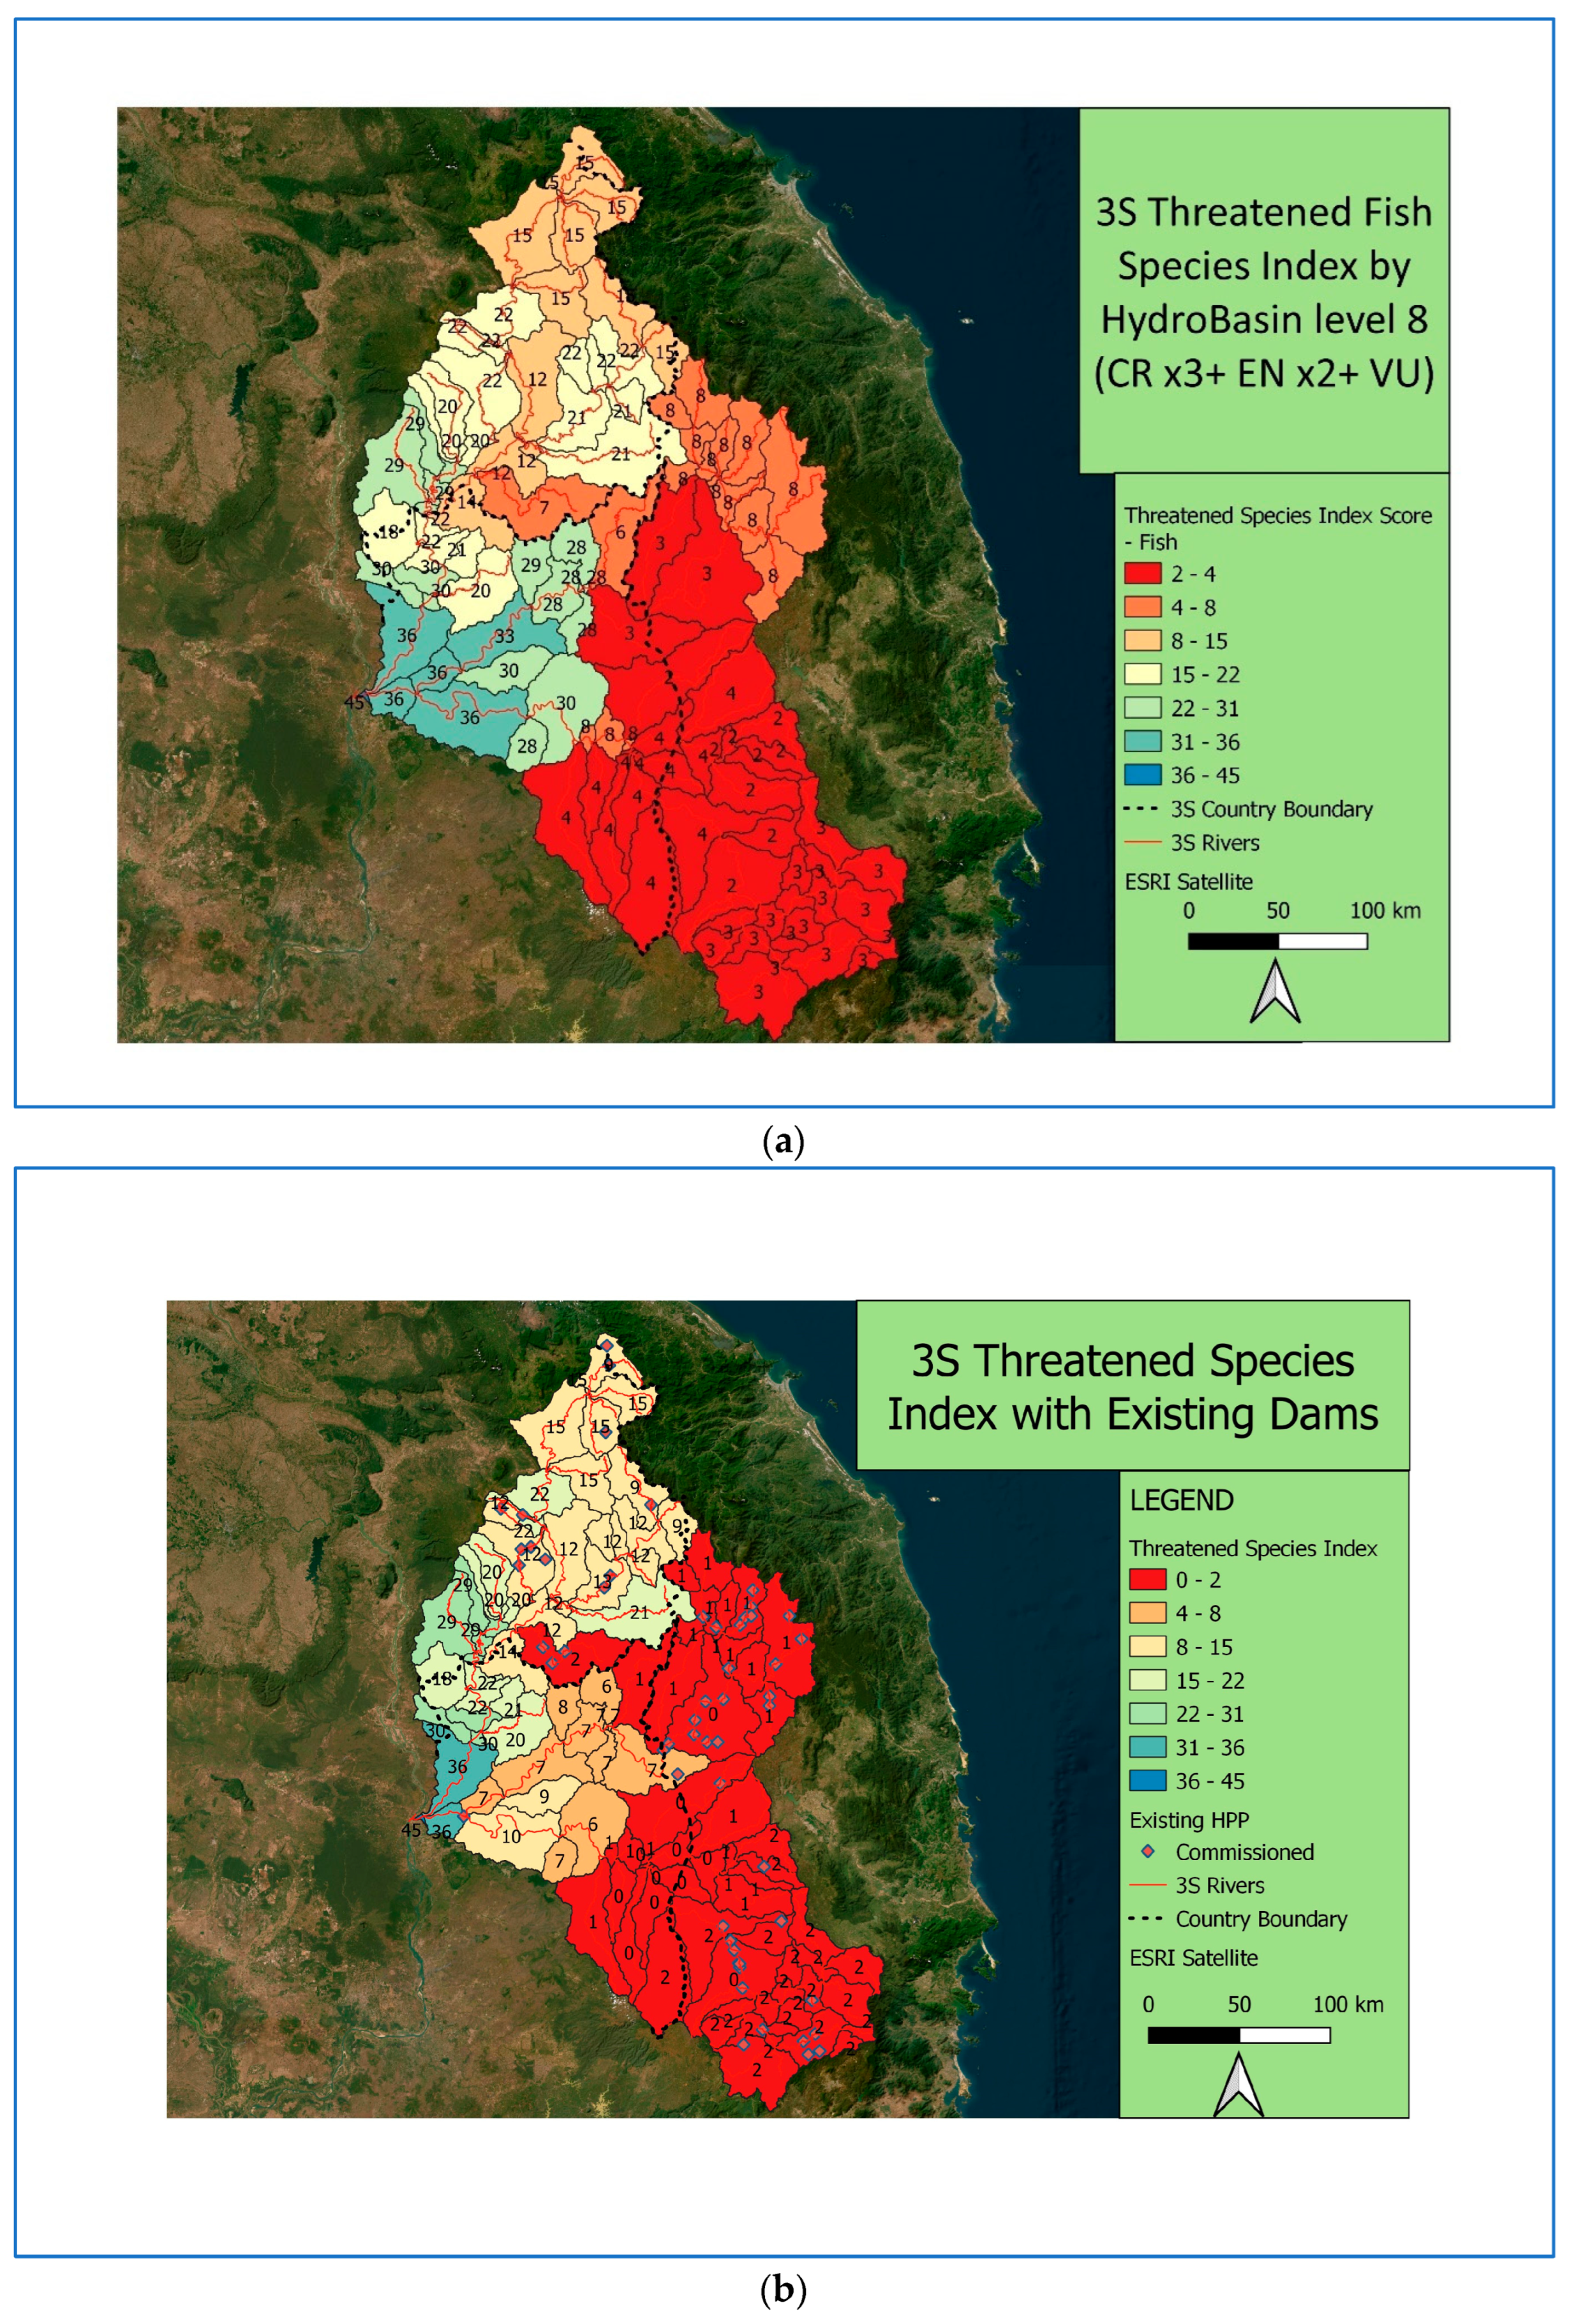
3.3. Confirmation of the Global Red List Fish Species Distribution by HydroBasin

We compared the fish species lists for the 3S rivers available through the IBAT with the consolidated species list for the 3S rivers prepared by Baran [25]. These are listed together in the Supplementary Materials, Table S1. Impact assessment practitioners have found that the IBAT lists can be unreliable in other parts of the world (discussion at IAIA conference, 2024), so it was important for us to confirm that the use of the IBAT species lists was appropriate for this study. A total of 435 species have been recorded, of which 223 are common to both lists, 102 species are found in the IBAT lists only, and 105 species are found only in the consolidated species lists. This means that if we use the IBAT lists with a total of 331 fish species, 67.5% of the species are common to both lists (those colour-coded in blue in the Supplementary Materials, Table S1). Since the IBAT provides distribution information within each river by HydroBasin Level 8, this is considered to be acceptable and more useful compared to the consolidated species lists by each river basin. Catherine Sayer of the IUCN Freshwater Group has provided some explanation about the differences between the two lists (see Supplementary Materials, Table S2) (pers comm.)
The most likely reasons for the differences are that some of the original surveys were not available to the Red List assessors, and the IBAT lists do not include species for which spatial ranges are not available. The Red Listing process may also overestimate the ranges of some species, which do not, in fact, occur in the 3S. In addition, the IBAT list does not include non-native species, and there were some anomalous marine species isolated at the top of the Sre Pok river, which have been eliminated. The most probable difference between the two lists is that some species in Baran’s list of 3S species are Data Deficient and have not had their ranges defined.
An analysis of the IBAT list of species in the 3S rivers, shown in Table 5, provides the numbers of threatened species, endemic species and different migratory guilds found in each of the three rivers. Out of a total of 331 species in the IBAT lists, 95% are found in the Sekong, 87% in the Sesan and 85% in the Sre Pok. There are 7 Critically Endangered species, 14 endangered and 16 vulnerable species, with 50 being Data Deficient. Twenty-nine species of super-endemics are found in the 3S, of which twenty-two are found in the Sekong. Adding up all the migratory guilds, there are 141 migratory species and 64 rithron-resident species found in the 3S IBAT list.

3.4. Distribution of Migratory, Threatened and Endemic Species on the 3S River Sub-Catchments

The geographical distribution of Red-Listed fish species according to the Level 8 HydroBasins is shown in Figure 6. The Red Listing process takes into account the natural distribution of the fish species without the presence of later dams. The surveys that made up Baran’s consolidated list were conducted between 1995 and 2009, during which time only the Yali Falls HPP in Viet Nam and the Houay Ho HPP in Laos were commissioned. We know that at least 67.5% of the species in the IBAT list are common to the consolidated list, so this list can be assumed to represent the natural pre-dam distribution. The map contains the actual numbers of species in each HydroBasin, starting at 261 species at the confluence with the Mekong and then reducing with distance upstream in all three rivers. The Sekong has by far the greater diversity of fish species, reducing from 250 species to between 100 and 150 species, with 111 different species per basin in the headwaters. Progressing up the lower reaches of the Sesan and Sre Pok, there are 179 and 166 species reported. There appears to be a marked decline in fish species numbers in the HydroBasins around the border between Cambodia and Viet Nam, with about 70 species per basin. The upper Sesan basins have the lowest numbers with about 50 species, possibly isolated originally by the Yali Falls. There is a band of about 100 species per basin along the border of the Sre Pok, and this declines in the headwaters to between 50 and 75 species. This reduction in numbers may also result from the Dray Nur/Dray Sap Falls, which would isolate the Sre Pok headwaters. This distribution pattern provides a baseline for making projections about the impact of dams as barriers to migration on numbers of fish species.
There are 61 Mekong-endemic species and 28 super-endemic species found in the 3S basin. The distribution of these super-endemic species which are only found in the 3S basin is shown in Figure 7. This shows zero super-endemics in the lower reaches of all three rivers, increasing slightly in the Sesan and Sre Pok, with only two species found in the headwaters of the Sre Pok, and between five and six in the headwaters of the Sesan. The picture is very different for the Sekong, with about 8 species in the Xe Pian river, 14 species in the Xe Kaman and Xe Xou rivers, and 16 super-endemic species found in the Sekong headwaters. This concentration of super-endemics in headwaters is opposite to the overall species numbers shown in Figure 6. The distinct habitat characteristics of these headwaters and the distance from the Mekong and 3S mainstreams lead to the isolation and evolution of restricted-range super-endemic species. This confirms the diversity and richness of the Sekong fish populations. It should also be noted that about 90% of the super-endemics are rithron-resident species [17], which will not be affected by the dams because they do not need to migrate. However, they would move away from reservoir impoundments to find their preferred fast-flowing and rocky/gravel habitats, if these are still available upstream.
The threatened fish species may also be identified from the Red List. The Threatened Fish Species Index which combines Critically Endangered, endangered and vulnerable fish species is shown in Figure 8a. This distribution reflects the natural distribution before dams, and also may be changing because 51 species on the list are Data Deficient, and further details may be found to reclassify these species in the future. This shows high scores (between 31 and 36) in the lower reaches of all three rivers, but they decline rapidly upstream on the Sesan and Sre Pok. The upper Sre Pok basin has the lowest Threatened Fish Species Index, with scores of between 2 and 4. In the upper reaches of the Sesan, the index increases slightly to a score of 8 with a number of endangered super-endemic species. In the Sekong, the richness and diversity of threatened fish species increase on the Bolevan Plateau, in the Xe Pian river with scores between 20 and 30, and also in the Xe Kaman and Xe Xou rivers. The mainstream Sekong shows a decline with progress upstream, with scores between 12 and 15. The Sekong shows a pattern of higher scores in the tributaries and headwaters, reflecting the greater number of threatened super-endemics. The results emphasise the difference between the three rivers in the greater richness and diversity of the fish populations in the Sekong compared to the Sesan and Sre Pok.
The presence of dams reduces these scores, with some threatened species already being extirpated from the 3S basin (see Figure 8b). Thus, the Lower Sesan 2 dam on the Sesan and Sre Pok rivers reduces the Threatened Index score from 36 below the dam to 7 and 10 above the dams in the two rivers, respectively. These scores are expected to fall further with the construction of the Lower Sesan 3 and Lower Sre Pok 3. On the Sekong, the Threatened Index score falls gradually from 36 to 22 in HydroBasins up to the Cambodian/Laos border. When the Sekong Downstream A dam is completed, the score will fall to 5 and then to 3 around the planned Sekong 3B. Above these key dams on the lower reaches of all three rivers, the Threatened Index gradually increases again as rare, generalist and rithron-resident species remain, and the rare migratory species are lost, especially in the headwaters of the Sekong and Sesan.

3.5. Changes in Migratory Fish Populations by the Barrier Effects of Dams

We have used the fish migration guilds to predict the proportions of migratory species that will be blocked by the dams and the proportions that will be able to use fish passages where they have been built. Some migratory fish guilds are able to pass, but others are not. We have not analysed the data for each individual fish species but rather as a proportion of the numbers of fish species in each guild, listed previously in Table 2.
Figure 9 shows the predicted numbers of fish species likely to be present in each HydroBasin if all the dams are built. In comparison with Figure 6, we can observe that only the HydroBasins downstream of Lower Sesan 2 and of Sekong Downstream A are expected to retain the same numbers of fish species as before. In all other HydroBasins upstream, there is a reduction of about 40–50% of the previous numbers of species. The cascades of dams very quickly eliminate the migratory species completely, even if fish passages are provided, because there is a compound effect of reducing the proportion of fish that can pass.
It is probable that some migratory fish species live in the 3S rivers naturally and move seasonally upstream into tributaries or floodplains to spawn or feed, rather than coming in from the Mekong. Some of the fish that come in from the Mekong may have been trapped behind dams such as Lower Sesan 2, and remain as relict populations. It is not known whether these species will eventually die out or establish isolated populations upstream of the dams. However, Figure 9 suggests the cascade of dams in all three rivers will limit the extent to which these isolated migratory fish species will be able to survive. A comparison with the river reach connectivity index, shown in Figure 5b, illustrates the increasingly smaller lengths of connected river reaches available to these isolated populations of migratory fish species.
The fish species likely to successfully remain within the isolated groups of HydroBasins are those which do not depend upon migration in their lifecycle. For the most part, these are the generalists, floodplain and rithron residents. The generalists are the fish guild most likely to be unaffected by dams, and these are usually the species which survive and thrive in the reservoirs. The floodplains of the 3S are limited to the lower reaches of the 3S rivers, e.g., in the Attapeu Plain in Laos, but in the Sesan and Sre Pok rivers, these have been reduced in area by the Lower Sesan 2 dam and other proposed dams in Cambodia. Floodplain resident species may be restricted locally throughout the basin depending upon local wetlands. Inundation by dams of these floodplains or local wetlands will also threaten the survival of the floodplain residents.
Rithron residents will be expected to move away from impoundments, where the water flow is very slow, but their survival will depend on the availability of suitable habitats within the upstream rivers and streams. Some of the super-endemic species are only found in a few locations and their survival is at risk from inundation caused by impoundments. Figure 10 shows the risks to rithron-resident species from hydropower reservoir formation. The risk is based upon the numbers of rithron-resident species and the proportion of the high-gradient river reach classes in each HydroBasin that will be flooded. The HydroBasins where these risks are highest are on the Bolevan Plateau where there are a high number of rithron-resident species and two large reservoirs caused by Xe Pian–Xe Nam Noy and Houay Ho HPP, which stand out in Figure 10. The other HydroBasins with high risk are focused in the upper Sekong, Xe Kaman and Xe Xou, where there are high numbers of rithron residents and a number of large dams commissioned and planned.
On the Sesan, there are very low risks in the upper HydroBasins, with Yali and the Sesan cascade, and the Plei Krong and Upper Kontum dams, but a low risk where Lower Sesan 3 is planned. On the Sre Pok, we see very low risks in the HydroBasin with the cascade from Buon Kuop to Sre Pok 4, and in the HydroBasins where Duc Xuyen is planned in the headwaters. The HydroBasin with Buon Tua Srah HPP also has a low risk. It is perhaps surprising that the Lower Sesan 2 and planned Lower Sre Pok 3 and 4 do not show risks to the rithron-resident species, but this probably reflects the low proportions of the high-gradient river reach classes.

4. Discussion

This study has shown how the application of global and regional datasets of fish species distribution and river reach classification can be used to make predictions about changes in the distribution of fish species due to hydropower dams and reservoirs. Many current species distributions can be explained from the location of the current dams on the 3S rivers by the barrier effects excluding migratory species from the overall fish populations, and by the loss of connectivity of river reaches in those groups of HydroBasins isolated by the dams. We factor in the ability of certain migratory guilds to use fish passages around dams, but we do not consider other impacts of hydropower dams, such as downstream mortality through turbines or hydrological changes which may disturb migration triggers.
The connectivity of the 3S rivers has already been reduced from the original three connected groups of HydroBasins with an estimated connectivity index score of 80.9%, and the two sub-basins above the waterfalls with connectivity index scores of 14.1% and 13.7%, respectively. The existing dams have reduced that overall connectivity index in the 3S basin to 23.5%, and with the addition of all planned hydropower projects, our analysis shows that the overall connectivity index score would be only 10.3% (Figure 5b). The connectivity index has been built up from the lengths of each river reach class within each HydroBasin and the composite scores calculated for groups of HydroBasins isolated from the rest of the 3S network by the dams.
The numbers of fish species likely to be present in each HydroBasin without the dams, shown in Figure 6, demonstrate how the numbers of species tend to decline with distance upstream from the main confluence with the Mekong. The numbers of migratory species also decline with distance upstream from the confluence. The data also demonstrate the differences in the species assemblages in each of the three rivers. The Sekong has the highest diversity with 95% of all the 331 species in the 3S IBAT list, compared to the Sesan and Sre Pok, which have about 85% of the species. The higher number of species in the Sekong can be associated with the greater diversity of riverine habitats, as indicated by the larger number of river reach classes in the Sekong—23 out of a total of 24 in the 3S, compared to 19 reach classes in Sesan, and 16 reach classes on the Sre Pok.
This is somewhat different from the species numbers and distribution in the 3S rivers summarised by Baran, who reported 329 fish species in the basin, with 213, 133 and 240 species in each of the Sekong, Sesan and Sre Pok rivers, respectively [25]. These differences highlight the limitations of the Red List-assessed species obtained from the IBAT. While 223 species (67%) are common to both lists and all have been through the Red List assessment, the ranges for some species have not been defined and/or are Data Deficient, with the result that they do not appear on the IBAT list. There may also be a tendency in the IBAT lists to generalise the ranges, so that the nuances of distribution in individual rivers may be lost. The big advantage that the IBAT list has over the consolidated species lists is that the species distribution by sub-catchments or HydroBasins can be mapped.
The more recent Red Listing process up to 2023 picked up 29 super-endemic species in the 3S, whereas Baran had listed 17 super-endemics [25]. In contrast to the trends in species numbers, the numbers of super-endemic species found only in the 3S tends to increase with distance upstream to the headwaters (Figure 7), especially in the Sekong and to a lesser extent in the Sesan and Sre Pok. This is because the super-endemics are usually restricted to riverine habitats in the headwaters and fast-flowing streams—the rithron residents, such as Devario spp., Poropuntius spp., Schistura spp. and Sewellia spp. We can make the connection with the river reach classes with high gradients to indicate where these species may be found, and we have used this classification to estimate the risks to rithron residents (and by extension, super-endemics) from inundation by hydropower reservoirs (Figure 10). Critical habitats for these species, with high flow rates associated with rocky and gravel substrates, are likely to be lost in the new reservoirs.
The numbers of threatened species, estimated through a Threatened Species Index, also shows a decline from high values near the confluence with the Mekong with passage upstream in all three rivers, especially marked in the Sre Pok (Figure 8). In the Sekong and, to some extent, in the Sesan, the index scores are higher in the headwater catchments because many of the super-endemics are also threatened due to their restricted ranges.
When we apply the locations of hydropower dams that create barriers to fish migration (Figure 9), there is a marked decline in the predicted numbers of species present in each HydroBasin, even taking into account the presence of fish by-passes at Lower Sesan 2 and, in the future, at Sekong Downstream A. The application of fish migratory guilds to subdivide the species lists allows the sorting of species that are likely to be excluded from upstream by the dams. It is recognised that the classification of all 331 fish species into migratory guilds may sometimes be questionable at this stage of knowledge, but the overall predictions of species numbers in each HydroBasin are probably more or less correct. It is also recognised that there may be some relict populations of migratory species that are trapped between the dams, but which have managed to find undisturbed river reaches and spawning sites and have thus survived. These results are in line with the finding by the MRC’s Design Guidance that a cascade of dams and reservoirs will eliminate most riverine fish species that require flowing water habitats, even if a fish passage is provided [36].
The predicted declines in species in this geographical study are compared with a more statistical study by Ratha Sor and colleagues, who analysed a 7-year fish monitoring dataset in the 3S rivers (between 2007 and 2014) by regressing fish abundance and biodiversity trends against the cumulative number of upstream dams. They found that the hydropower dams upstream of their sampling points in each river reduced fish biodiversity, including migratory, IUCN-threatened and indicator species in the Sesan and Sre Pok basins, where most of the Viet Namese dams have been constructed. Possibly as a result, because migratory species learnt about these barriers upstream, fish biodiversity increased in the Sekong, the basin with the fewest dams during this period. In the three sampling stations on these rivers in Cambodia (i.e., low downstream), fish fauna in the Sesan and Sre Pok basins decreased from 60 and 29 species in 2007 to 42 and 25 species in 2014, respectively. In the Sekong basin, they increased from 33 in 2007 to 56 species in 2014 in the Sekong Basin. The results underscore the importance of the Sekong basin to fish biodiversity and highlight the likely significance of all remaining free-flowing sections of the Lower Mekong Basin (before the Lower Sesan 2 dam had been completed) [43]. Ngor et al. also analysed fish monitoring data between 2007 and 2014 and found that flow alterations in the 3S rivers were associated with declining trends in local species richness and abundance, with strong temporal variability [57]. Undisturbed sites are characterised by seasonal assemblage variability, while disturbed sites are characterised by seasonal assemblage changes. Temporal shifts in assemblage composition suggest that dams alter seasonal flow patterns and favour generalist species.
This finding is confirmed by Kano and colleagues, who made projections of the responses of 363 fish species within the Indo-Burma global biodiversity hotspot to the separate and joint impacts of dams and global warming. Projections for 81 dam-building scenarios revealed progressive impacts upon projected species richness, habitable area, and the proportion of threatened species as generating capacity increased [58]. The changes in fish diversity are similar to those described by local fishermen on the Nam Ou in Cambodia, who reported the absence of about 60% of the species that they used to catch before impoundment by the Nam Ou 5 reservoir in northern Laos [59].
The projections made in this study are limited by the inadequate understanding of the behaviour of migratory species, or in simple terms, their migratory guild. Loury has identified six top priorities for developing this understanding for managing migratory fishes in Cambodia: (1) population abundances and trends, (2) life cycles and life history, (3) migration timing and triggers, (4) migration routes and distances, (5) locations of key habitats and spawning areas, and (6) environmental and habitat requirements [60].
Regular monitoring of fish passages should contribute to a greater understanding of how they can be improved and made more attractive to a wider range of migratory species. The initial results of monitoring the effectiveness of the Lower Sesan 2 dam show that while some migratory fish have been allowed to pass, its effectiveness for the wide range of target species has been limited. The operation and management of the by-pass, including ensuring adequate flow of water, simulating migration triggers, and other attractions for migratory fish, are likely to be needed [29].
The loss of connectivity and barriers to fish migration have been used in two recent basin assessments and plans in the 3S. In the Xe Kong Sustainable Hydropower Development Plan, Thomas et al. provided an analysis of the main barriers to fish migration, sediment transport and loss of connectivity of the cascades of dams on the Sekong. They suggested sustainability criteria for siting, designing and operating hydropower projects to avoid or counteract adverse impacts on (i) the passage of migratory fish upstream and downstream of the dams so they can complete their life cycle; (ii) the natural variability in the flow patterns that connect the river to its floodplains and provide the cues for fish migrations; and (iii) the flows of sediment and associated nutrients that sustain the morphology and habitats downstream of dams. They recommended putting the construction of mainstream dams on the Sekong river on hold because of expected negative consequences for connectivity, sediment transport and fish migration [10]. However, this recommendation has been disregarded with the current construction of Sekong Downstream A on the Laos/Cambodia border.
Similarly, the IFC (International Finance Corporation) sponsored a Cumulative Impact Assessment (CIA) of the Sekong considering the impacts of three different dam development scenarios on so-called Valued Environmental Components (VECs), especially fish and livelihoods that rely on river fisheries and agriculture or are affected by resettlement. They concluded that (i) bank and bed erosion may increase in alluvial parts of the river; (ii) reduced variability in river levels and smaller loads of nutrient-rich silt will restrict riverbank gardening; and (iii) in some years, little or no floodplain inundation will reduce harvests from floodplain fisheries. The “full” development pathway is likely to come at the cost of the loss of unique, highly valued biodiversity. These negative impacts would result from all three scenarios to a greater or lesser extent, of which the least damaging, “conservative” development scenario included a total of sixteen additional tributary projects, but excluded the Sekong mainstream dams [61].

5. Conclusions

This application of two global and regional datasets—the freshwater species lists of Red List-assessed fish species available through IBAT and the river reach classification for the Greater Mekong, which stems from the global GloRic river reach network—can be used to make predictions on the distribution of fish species and river connectivity in sub-catchments at a scale of HydroBasin Level 8. The distribution of species numbers, threatened and endemic species in the 3S rivers has been mapped. The updated locations and sizes of existing and planned hydropower dams in the 3S rivers have been used to identify the barriers to fish migrations, from which it has been possible to make predictions about the numbers of fish species remaining in different groups of HydroBasins and the connectivity of the river reach classes isolated by the hydropower dams. Projections for the loss of threatened and super-endemic species from dams and reservoirs have also been possible.
This methodology can be used for making initial assessments of the impacts of hydropower dams and reservoirs on fish populations, for both single dams and cumulatively for cascades of dams within a whole river basin. It can also be used to design fish passages appropriate to the migratory fish found in the rivers, and to assess their effectiveness in different locations. Such knowledge of the historical and predicted patterns in the distribution of fish biodiversity will provide a starting point for the restoration and protection objectives of critical aquatic habitats and their assemblages of fish species in dammed river basins.

Supplementary Materials

The following supporting information can be downloaded at: https://www.mdpi.com/article/10.3390/w16111505/s1, Table S1. Comparison of earlier fish species lists in 3S rivers with the most recent IBAT Freshwater report. Table S2. Explanations for differences between Red List fish species from IBAT and consolidated lists from Baran. Table S3. Important migratory fish species from the Mekong mainstream into the 3S rivers. Source: Baran 2014 [25]. Table S4: Migratory guilds proposed for mainstream dam impact forecasting (Halls and Kshatriya 2009) [33]. Table S5: Details of hydropower plants in the 3S river basins. Table S6: River reach classes found in the 3S rivers.

Author Contributions

Conceptualisation, P.-J.M., M.J.M. and N.S.; methodology, P.-J.M.; validation, P.-J.M., M.J.M. and N.S.; formal analysis, P.-J.M.; investigation, P.-J.M.; resources, P.-J.M.; data curation, P.-J.M.; writing—original draft preparation, P.-J.M.; writing—review and editing, P.-J.M., M.J.M. and N.S.; visualisation, P.-J.M.; supervision, M.J.M. and N.S. All authors have read and agreed to the published version of the manuscript.

Funding

This research received no external funding.

Data Availability Statement

(1) Freshwater report of Red List-assessed fish species by HydroBasin from IBAT available through https://www.ibat-alliance.org accessed on 10 March 2024 (2) GloRiC-GMR—Lehner, B., and Dallaire, C. River reach classification for the Greater Mekong Region. Report for WWF Greater Mekong. 2014, WWF Greater Mekong: Vientiane, Lao PDR. and Dallaire, C.O., Lehner, B., Peres-Neto, P., River reach types as large-scale biodiversity proxies for management: The case of the Greater Mekong Region. Ecological Indicators, 2023. 146(109907).

Acknowledgments

We acknowledge the advice and support of Jeremy Carew-Reid and his colleagues in ICEM, Hanoi, Viet Nam. This study was undertaken with the ICEM team as a contribution to the development of the Basin Diagnostic of the 3S River Basin for the Mekong River Commission and GIZ.

Conflicts of Interest

The authors declare no conflicts of interest.

References

  1. Chowdhury, K.A.F.M.; Wild, T.; Zhang, Y.; Binsted, M.; Iyer, G.; Kim, S.H.; Lamontagne, J. Hydropower expansion in eco-sensitive river basins under global energy-economic change. Nat. Sustain. 2024, 7, 213–222. [Google Scholar] [CrossRef]
  2. Eyler, B.; Kwan, R.; Basist, A.; Weatherby, C. Analysis of Hydropower Impacts in the Mekong’s 3S Basin—A Technical Report Using Mekong Dam Monitor Observations and MRC Data to Show How 20 Dams are Changing the Hydrological Flow of the 3S Basin and the Mekong River at large; Stimson Centre: Washington, DC, USA, 2023; Available online: https://www.stimson.org/2023/analysis-of-hydropower-impacts-in-the-mekongs-3s-basin/ (accessed on 10 February 2024).
  3. Baird, I.G.; Thorne, M.A.S. The downstream impacts of dams on the seasonally flooded riverine forests of the Mekong River in northeastern Cambodia. South-East Asia Res. 2023, 31, 377–399. [Google Scholar] [CrossRef]
  4. Dugan, P.J.; Barlow, C.; Agostinho, A.A.; Baran, E.; Cada, G.F.; Chen, D.; Cowx, I.G.; Ferguson, J.W.; Jutagate, T.; Mallen-Cooper, M.; et al. Fish Migration, Dams, and Loss of Ecosystem Services in the Mekong Basin. AMBIO 2010, 39, 344–348. [Google Scholar] [CrossRef]
  5. Soukhaphon, A.; Baird, I.G.; Hogan, Z.S. The Impacts of Hydropower Dams in the Mekong River Basin: A Review. Water 2021, 13, 265. [Google Scholar] [CrossRef]
  6. CEPF. Ecosystem Profile—Indo-Burma Biodiversity Hotspot—2020 Update; Critical Ecosystem Partnership Fund: Arlington, VA, USA, 2020. [Google Scholar]
  7. MRC, M.R.C. Basin-Wide Assessment of Climate Change Impacts on Hydropower Production. Final Report; Mekong River Commission: Vientiane, Laos, 2018. [Google Scholar]
  8. Lowgren, S. Mekong River at Its Lowest in 100 Years, Threatening Food Supply, in National Geographic. 2019. Available online: https://www.nationalgeographic.com/environment/2019/07/mekong-river-lowestlevels-100-years-food-shortages/ (accessed on 2 April 2024).
  9. Fancourt, M.; Walker, S.; Sassen, M. Commodities and Biodiversity in the Greater Mekong—Impacts of Commodity Development on Biodiversity and Ecosystem Services in the Greater Mekong and Its Headwaters; UNEP World Conservation Monitoring Centre: Cambridge, UK, 2015. [Google Scholar]
  10. Thomas, G.A.; Annandale, G.; Bouapao, L.; Hortle, K.G.; Jensen, E.D.; Kaini, P. Sustainable Hydropower Master Plan for Xe Kong Basin in Lao PDR. Thomas, G., Ed.; Natural Heritage Institute: Vientiane, Laos, 2018. [Google Scholar]
  11. Ziv, G.; Baran, E.; So Nam Rodríguez-Iturbe, I.; Levin, S. Trading-off fish biodiversity, food security, and hydropower in the Mekong River Basin. Proc. Natl. Acad. Sci. USA 2012, 109, 5609–5614. [Google Scholar] [CrossRef]
  12. Schmutz, S.; Moog, O. Dams: Ecological Impacts and Management, in Riverine Ecosystem Management; Schmutz, S., Sendzimir, J., Eds.; Springer: Cham, Switzerland, 2018. [Google Scholar] [CrossRef]
  13. Null, S.E.; Farshid, A.; Goodrum, G.; Gray, C.A.; Lohani, S.; Morrisett, C.N.; Prudencio, L.; Sor, R. A Meta-Analysis of Environmental Tradeoffs of Hydropower Dams in the Sekong, Sesan, and Srepok (3S) Rivers of the Lower Mekong Basin. Water 2021, 13, 63. [Google Scholar] [CrossRef]
  14. Adamson, P.T.; Rutherfurd, I.D.; Peel, M.C.; Conlan, I.A. Chapter 4—The Hydrology of the Mekong River. In The Mekong Biophysical Environment of an International River Basin; Campbell, I.C., Ed.; Aquatic Ecology; Academic Press: Cambridge, MA, USA, 2009; pp. 53–76. [Google Scholar] [CrossRef]
  15. Meynell, P. The Sekong River in Vietnam, Lao PDR and Cambodia. An information sourcebook for dialogue on River Flow Management; IUCN: Bangkok, Thailand, 2014; p. 139. [Google Scholar]
  16. CEPF. Indo-Burma Biodiversity Hot Spot—Ecosystem Profile—2011 Update; Critical Ecosystem Partnership Fund: Arlington, VA, USA, 2012. [Google Scholar]
  17. Kottelat, M. Fishes of the Xe Kong Drainage in Laos, Especially from the Xe Kaman; WWF: Gland, Switzerland; Critical Ecosystem Partnership Fund: Arlington, VA, USA, 2011. [Google Scholar]
  18. Allen, D.J.; Smith, K.G.; Darwall, W.R.T. (Eds.) The Status and Distribution of Freshwater Biodiversity in Indo-Burma; IUCN: Cambridge, UK; Gland, Switzerland, 2012; p. x+158pp+4pp cover. [Google Scholar]
  19. Baird, I.G. Investigations of the Xekamman and Xexou Rivers with special reference to freshwater fish and river ecology; and a review of the potential social and environmental impacts of large dam projects on these two rivers in Attapeu Province, Southern Lao PDR. In Report Prepared for the Protected Areas Division; Department of Forestry, Lao PDR: Vientiane, Laos, 1995. [Google Scholar]
  20. MFD. Mekong Fish Database: A Taxonomic Fish Database for the Mekong Basin CDROM; Mekong_River_Commission: Phnom Penh, Cambodia, 2003. [Google Scholar]
  21. Baird, I.G.; Mean, M. Sesan River Fisheries Monitoring in Ratanakiri Province, Northeast Cambodia: Before and After the Construction of the Yali Falls Dam in the Central Highlands of Viet Nam; 3S Rivers Protection Network (3SPN), the Global Association for people and the Environment(GAPE): Ban Lung, Northeast Cambodia, 2005; p. 45. [Google Scholar]
  22. Nguyen, H.D.; Van Thiet, T.; Van Sang, L. Fish Fauna at Chu Yang Sin National Park, Dak Lak Province; Chu Yang Sin National Park: Tây Nguyên, Vietnam, 2006; p. 17. [Google Scholar]
  23. Chan, S.; Solida, P.; Nam, S. Fish abundance survey and installation of fish catch monitoring system for the Srepok River. In Srepok Wilderness Area Project Technical Paper; WWF Greater Mekong—Cambodia country programme and Inland Fisheries Research and Development Institute: Phnom Penh, Cambodia, 2008; p. 37. [Google Scholar]
  24. Kottelat, M. Fishes of the Xe Kong drainage in Laos. In WWF Project “Aquatic Resources Management to Improve Rural Livelihoods of the Xe Kong Basin; WWF: Vientiane, Laos, 2009. [Google Scholar]
  25. Baran, E.; Saray, S.; Teoh, S.J.; Tran, T.C. Fish and fisheries in the Sesan, Sekong and Srepok River Basins (Mekong Watershed). In On Optimizing the Management of Cascades or System of Reservoirs at Catchment Level; ICEM: Hanoi, Vietnam, 2014. [Google Scholar]
  26. Baird, I.G.; Flaherty, M.S.; Phylavanh, B. Rhythms of the river: Lunar phases and migrations of small carps (Cyprinidae) in the Mekong River. Nat. Hist. Bull. Siam Soc. 2003, 51, 5–36. [Google Scholar]
  27. Baird, I.G. Best Practices in Compensation and Resettlement for Large Dams: The Case of the Planned Lower Sesan 2 Hydropower Project in Northeastern Cambodia; Rivers Coalition in Cambodia: Phnom Penh, Cambodia, 2009. [Google Scholar]
  28. Mallen-Cooper, M.; Cowx, I.; Jensen, E. Fish Passage at Lower Sesan 2 Dam: Design Principles, Preliminary Criteria and Concepts; Natural Heritage Institute: San Francisco, CA, USA, 2015. [Google Scholar]
  29. O’Connor, J.; Hale, R.; Mallen-Cooper, M.; Cooke, S.J.; Stuart, J. Developing performance standards in fish passage: Integrating ecology, engineering and socio-economics. Ecol. Eng. 2022, 182, 106732. [Google Scholar] [CrossRef]
  30. Welcomme, R.L.; Winemiller, K.O.; Cowx, I.G. Fish environmental guilds as a tool for assessment of ecological condition of rivers. River Res. Appl. 2006, 22, 377–396. [Google Scholar] [CrossRef]
  31. Montaña, C.G.; Ou, C.; Keppeler, F.W.; Winemiller, K.O. Functional and trophic diversity of fishes in the Mekong-3S river system: Comparison of morphological and isotopic patterns. Environ. Biol. Fishes 2020, 103, 185–200. [Google Scholar] [CrossRef]
  32. Welcomme, R.L.; Baird, I.G.; Dudgeon, D.; Halls, A.; Lamberts, D.; Mustafa, M.G. Fisheries of the rivers of Southeast Asia. In Freshwater Fisheries Ecology; Craig, J.E., Ed.; John Wiley & Sons Ltd.: Hoboken, NJ, USA, 2016; pp. 363–376. [Google Scholar]
  33. Halls, A.S.; Kshatriya, M. Modelling the cumulative barrier and passage effects of mainstream hydropower dams on migratory fish populations in the Lower Mekong Basin. In MRC Technical Paper; Mekong River Commission: Vientiane, Laos, 2009; p. 104. [Google Scholar]
  34. Sun, J.; Yu, F.; Zhang, Q.; Luo, S.; Zhou, W.; Zhang, H.; Tan, J.; Shi, X.; Shen, Y.; Shi, J. Evaluation of a Nature-like Bypass for Non-Salmonids in the Sesan River. Water 2023, 15, 16. [Google Scholar] [CrossRef]
  35. Orr, S.; Pittock, J.; Chapagain, A.; Dumaresq, D. Dams on the Mekong River: Lost fish protein and the implications for land and water resources. Glob. Environ. Change 2012, 22, 925–932. [Google Scholar] [CrossRef]
  36. Mekong River Commission. Preliminary Design Guidance for Proposed Mainstream Dams in the Lower Mekong River Basin; Mekong River Commission: Vientiane, Laos, 2023. [Google Scholar]
  37. Seliger, C.; Zeiringer, B. River Connectivity, Habitat Fragmentation and Related Restoration Measures. In Riverine Ecosystem Management; Schmutz, S., Sendzimir, J., Eds.; Springer: Cham, Switzerland, 2018. [Google Scholar]
  38. Cote, D.; Kehler, D.G.; Bourne, C.; Wiersma, Y.F. A new measure of longitudinal connectivity for stream networks. Landsc. Ecol. 2009, 24, 101–113. [Google Scholar] [CrossRef]
  39. Shaad, K.; Souter, N.J.; Farrell, T.; Vollmer, D.; Regan, H.M. Evaluating the sensitivity of dendritic connectivity to fish pass efficiency for the Sesan, Srepok and Sekong tributaries of the Lower Mekong. Ecol. Indic. 2018, 91, 570–574. [Google Scholar] [CrossRef]
  40. Grill, G.; Dallaire, C.O.; Chouinarda, E.F.; Sindorf, N.; Lehner, B. Development of new indicators to evaluate river fragmentation and flow regulation at large scales: A case study for the Mekong River Basin. Ecol. Indic. 2014, 45, 148–159. [Google Scholar] [CrossRef]
  41. Grill, G.; Lehner, B.; Thieme, M.; Geenen, B.; Tickner, D.; Antonelli, F.; Babu, S.; Borrelli, P.; Cheng, L.; Crochetiere, H.; et al. Mapping the world’s free-flowing rivers. Nature 2019, 569, 215–221. [Google Scholar] [CrossRef] [PubMed]
  42. Schmitt, R.J.P.; Bizzi, S.; Castelletti, A.; Kondolf, G.M. Improved trade-offs of hydropower and sand connectivity by strategic dam planning in the Mekong. Nat. Sustain. 2018, 96, 96–104. [Google Scholar] [CrossRef]
  43. Constable, D. The Sesan and Sre Pok River Basins; IUCN: Bangkok, Thailand, 2015; p. 56. [Google Scholar]
  44. Constable, D. Atlas of the 3S Basins; IUCN: Bangkok, Thailand, 2015. [Google Scholar]
  45. Global Hydropower Tracker. March 2024. Available online: https://globalenergymonitor.org/projects/global-hydropower-tracker/ (accessed on 10 March 2024).
  46. Open Development Mekong. March 2024. Available online: https://opendevelopmentmekong.net/ (accessed on 10 March 2024).
  47. IWMI-WLE. Map of Hydropower Dams in Greater Mekong Region. 2016. Available online: https://www.iwmi.cgiar.org/archive/wle/solutions/map-hydropower-dams-greater-mekong-region/index.html (accessed on 10 March 2024).
  48. Global Surface Water Appspot. March 2024. Available online: https://global-surface-water.appspot.com/download (accessed on 10 March 2024).
  49. Pekel, J.-F.; Cottam, A.; Gorelick, N.; Belward, A.S. High-resolution mapping of global surface water and its long-term changes. Nature 2016, 540, 418–422. [Google Scholar] [CrossRef] [PubMed]
  50. Servir-ADPC. Reservoir Mapping Tool. 2024. Available online: https://servir.adpc.net/tools/reservoir-mapping-tool (accessed on 10 March 2024).
  51. Lehner, B.; Ouellet Dallaire, C. River Reach Classification for the Greater Mekong Region. Report for WWF Greater Mekong; WWF Greater Mekong: Vientiane, Laos, 2014. [Google Scholar]
  52. Dallaire, C.O.; Lehner, B.; Peres-Neto, P. River reach types as large-scale biodiversity proxies for management: The case of the Greater Mekong Region. Ecol. Indic. 2023, 146, 109907. [Google Scholar] [CrossRef]
  53. IBAT. Integrated Biodiversity Assessment Tool. March 2024. Available online: https://www.ibat-alliance.org/ (accessed on 10 March 2024).
  54. HydroSHEDS. HydroBasins. 2024. Available online: https://www.hydrosheds.org/products/hydrobasins (accessed on 1 March 2024).
  55. Froese, R.; Pauly, D. (Eds.) FishBase; World Wide Web Electronic Publication: Saratoga Springs, NY, USA, 2024. [Google Scholar]
  56. Meynell, P.J. Assessing the Ecological Significance of the Mekong Tributaries; Mekong River Commission: Vientiane, Laos, 2012; p. 118. [Google Scholar]
  57. Ngor, P.B.; Legendre, P.; Oberdorff, T.; Lek, S. Flow alterations by dams shaped fish assemblage dynamics in the complex Mekong-3S river system. Ecol. Indic. 2018, 88, 103–114. [Google Scholar] [CrossRef]
  58. Kano, Y.; Dudgeon, D.; Nam, S.; Samejima, H.; Watanabe, K.; Grudpan, C.; Grudpan, J.; Magtoon, W.; Musikasinthorn, P.; Nguyen, P.T.; et al. Impacts of Dams and Global Warming on Fish Biodiversity in the Indo-Burma Hotspot. PLoS ONE 2016, 11, e0160151. [Google Scholar] [CrossRef] [PubMed]
  59. IFC. Nam Ou River Basin Profile, Laos; International Finance Corporation: Vientiane, Laos, 2017. [Google Scholar]
  60. Loury, E.K.; Elliott, V.L.; Ainsley, S.M.; Baird, I.G.; Baumgartner, L.J.; Chhuoy, S.; Lee, D.J.; Ngor, P.B.; Touch, B.; Vu, A.V.; et al. Priority knowledge needs for management of migratory fish species in Cambodia. Fish. Manag. Ecol. 2021, 28, 393–416. [Google Scholar] [CrossRef]
  61. IFC. Cumulative Impact Assessment and Management of Renewable Energy Development in the Sekong River Basin, Lao People’s Democratic Republic; International Finance Corporation: Washington, DC, USA, 2021. [Google Scholar]
Figure 1. Data used and processes for analysis and mapping.
Water 16 01505 g001
Figure 2. Context of 3S river basin within the Lower Mekong Basin.
Water 16 01505 g002
Figure 3. Schematic of the main large-storage hydropower plants in the 3S basin, with HPPs under con-struction (Water 16 01505 i001) on Sekong and major waterfalls (Water 16 01505 i002). Adapted with permission from the Stimson Center [2].
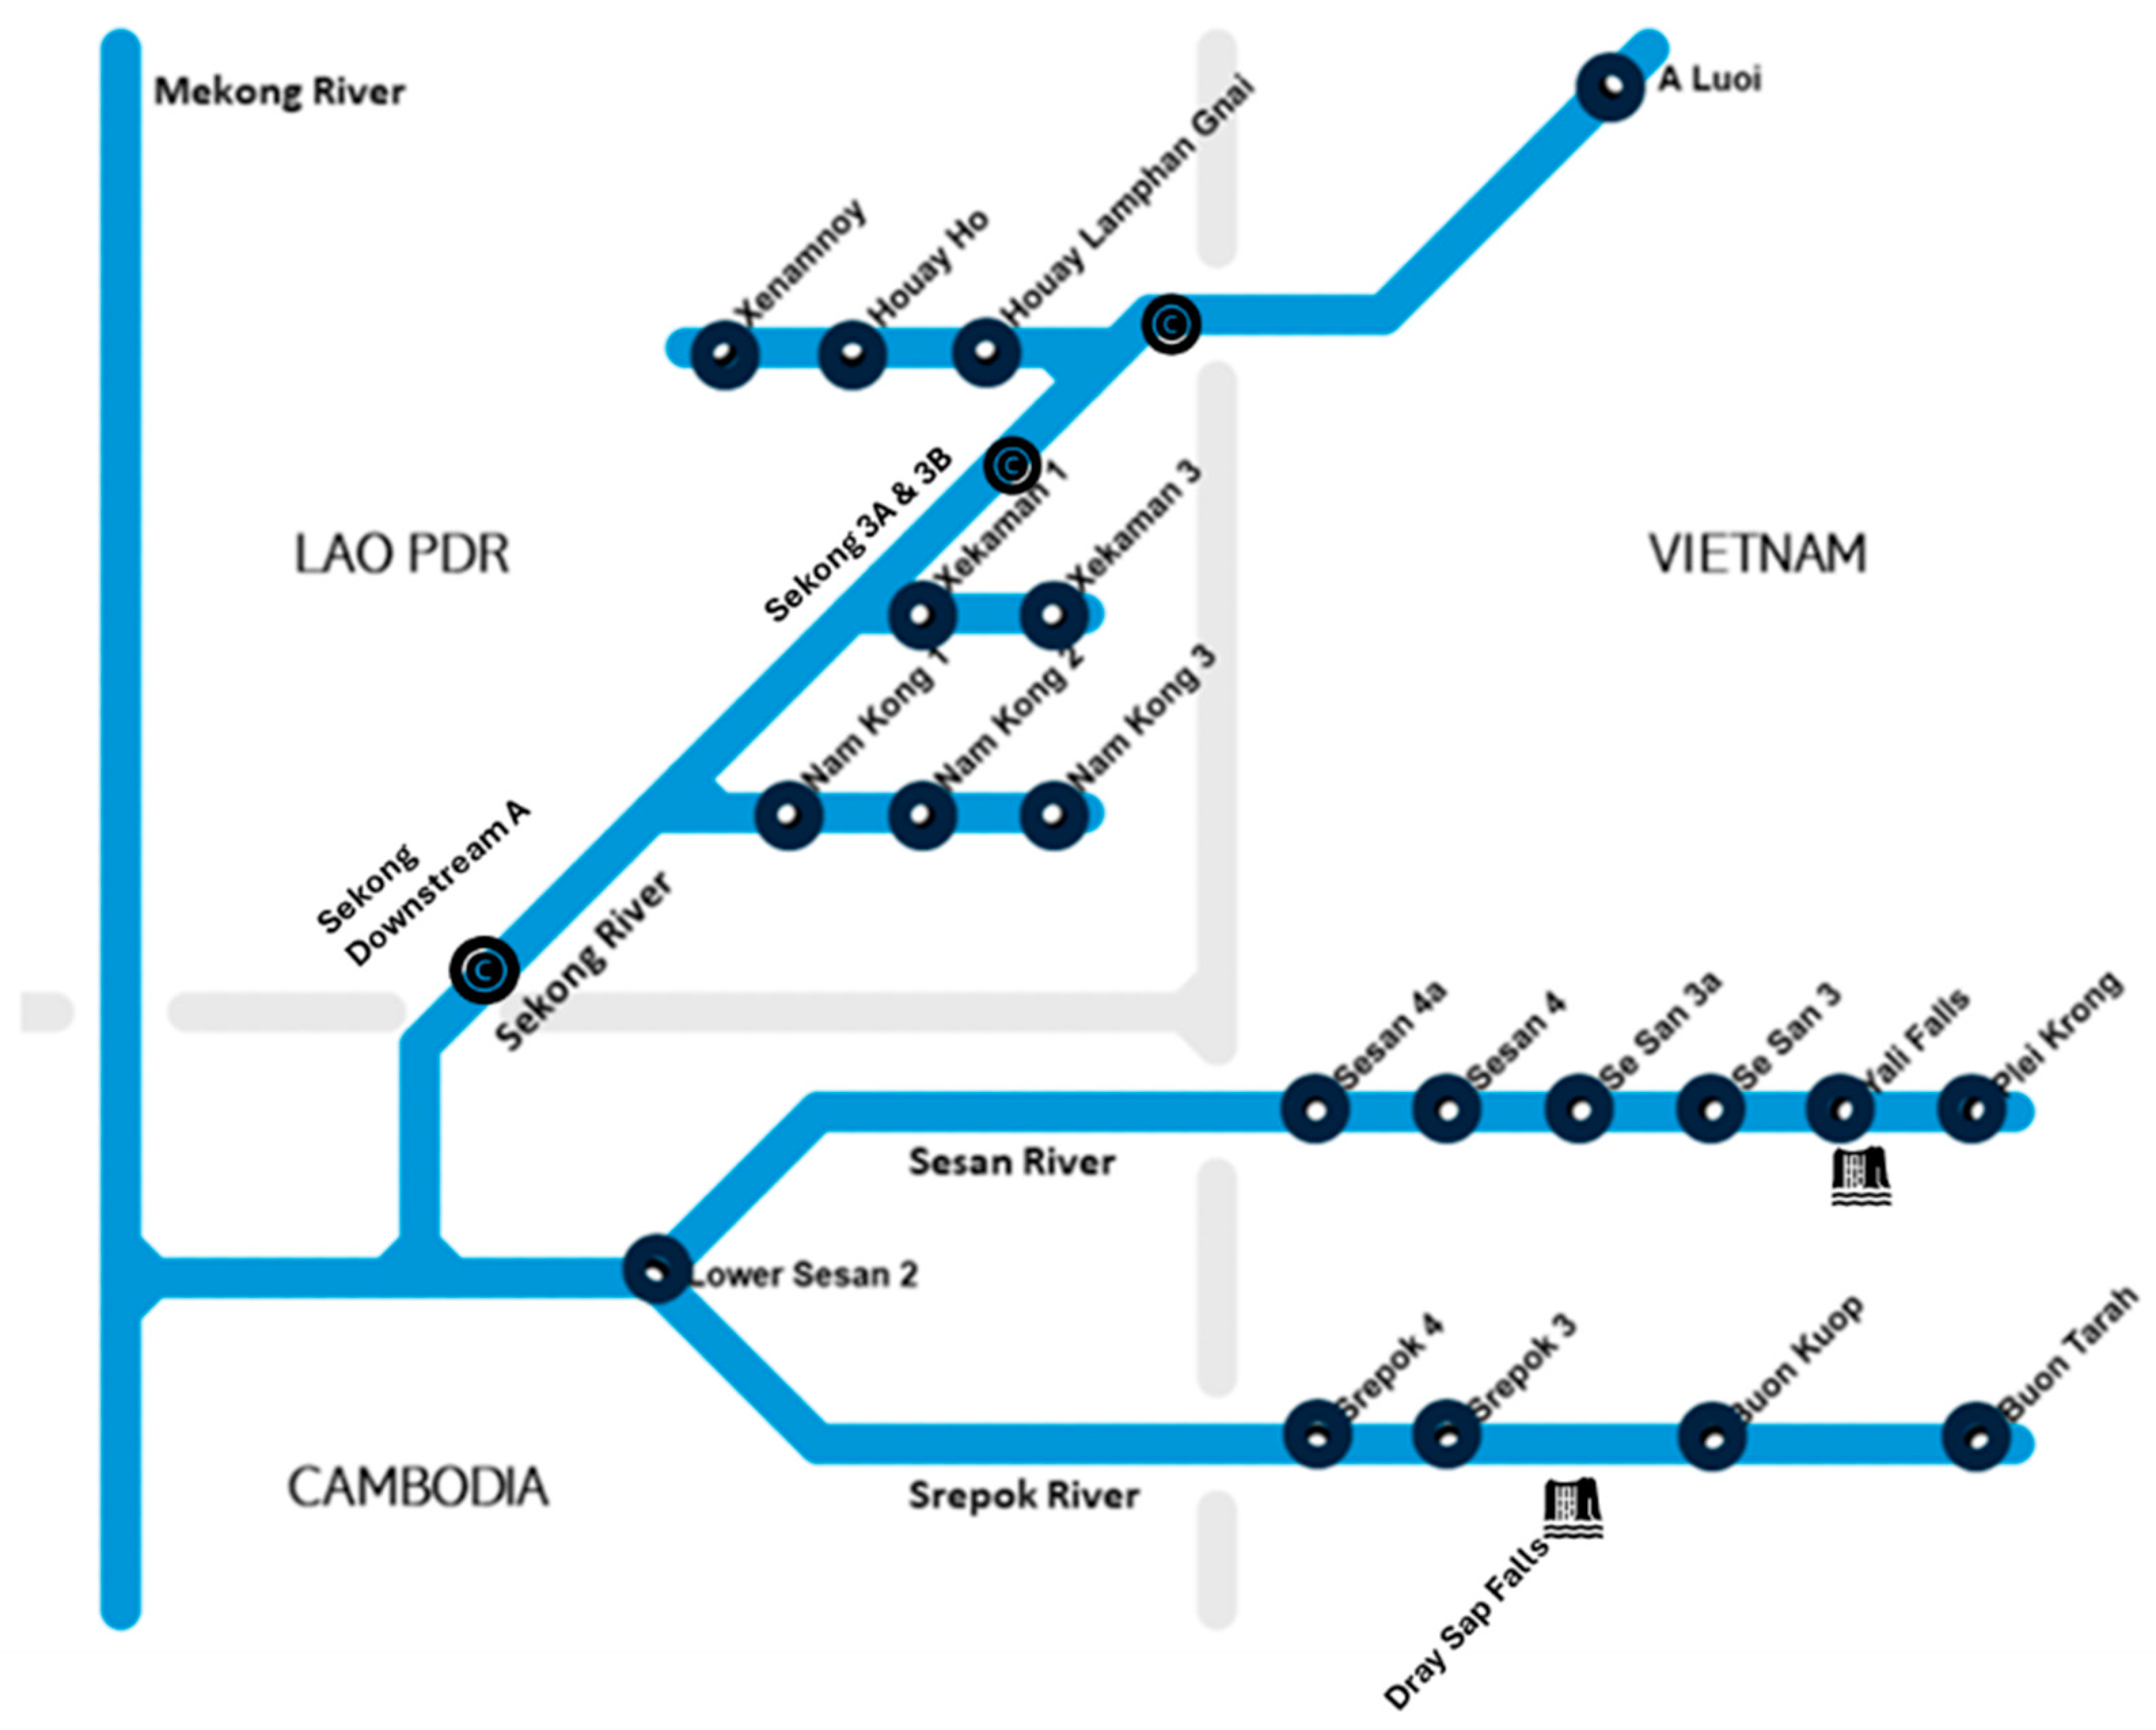
Water 16 01505 g003
Figure 4. Locations of hydropower plants in 3S rivers with installed capacity and status.
Water 16 01505 g004
Figure 5. River reach connectivity index scores by HydroBasin with (a) existing dams and (b) all future dams.
Water 16 01505 g005aWater 16 01505 g005b
Figure 6. Numbers of fish species by HydroBasin—without dams (IBAT Freshwater report, March 2024).
Water 16 01505 g006
Figure 7. Distribution of 3S super-endemic species in 3S Level 8 HydroBasins—without dams.
Water 16 01505 g007
Figure 8. Distribution of endangered fish species—Threatened Fish Species Index—(a) without dams and (b) with existing dams in place.
Water 16 01505 g008
Figure 9. Predicted numbers of fish species in 3S rivers if all dams are built.
Water 16 01505 g009
Figure 10. Risks to rithron-resident species from hydropower reservoir formation.
Water 16 01505 g010
Table 1. Catchment areas and flows of the 3S rivers.
Sub-BasinCambodia (km2)Laos (km2)Viet Nam (km2)Total (km2)Mainstem Length (km)Total Stream Length (km)No. of All Stream OrdersMean Annual Flow (km3)
Sekong556522,56569028,820425493135739.92
Sesan7630-11,26018,890399278425327.2
Sre Pok12,780-18,16030,940487672962623.57
Total25,97522,56530,11078,650131114,444123690.68
Total %33%28.7%38.3%100%
Note(s): Source: [2,15].
Table 2. Fish migratory guilds potentially impacted by dams—after Halls and Kshatriya.
Fish GuildImpact of Dams on MigrationDam Migration Impact Factor
1. Rithron-resident guildLittle or no impact0
2. Migratory main channel and tributary-resident guildMedium0.5
3. Migratory main channel spawner guild Very high1
4. Migratory main channel refuge-seeker guildVery high1
5. Generalist guildLittle or no impact0
6. Floodplain-resident guild (blackfish)Little or no impact0
7. Estuarine resident guildLittle or no impact 0
8. Semi-anadromous guildHigh 0.75
9. Catadromous guildVery high1
10. Marine guild Little or no impact0
Table 3. Summary of the numbers and capacities of the hydropower projects in the 3S rivers.
CommissionedUnder ConstructionPlanned
NumberInstalled CapacityNumberInstalled CapacityNumberInstalled Capacity
MW MW MW
Sekong
Large dams > 100 MW5127256245950
Medium dams—30–100 MW528232047398
Small dams < 30 MW457336235
Sesan
Large dams > 100 MW721680 1325
Medium dams—30–100 MW2930 196
Small dams < 30 MW171740 260
Sre Pok
Large dams > 100 MW25000 2443
Medium dams—30–100 MW42600 149
Small dams < 30 MW101380 1072
56 11 30
Table 4. Total hydropower installed capacity, combined reservoir area and active storage in 3S rivers.
Installed CapacityReservoir AreaActive Storage
MWHaM cu.m
Sekong
Total Commissioned + under construction247542,4714.232
Future Total385867,1364.232
Sesan
Total Commissioned + under construction243534,5452.695
Future Total291676,3112.695
Sre Pok
Total Commissioned + under construction897.567980.61
Future Total1462115,6770.61
Total for 3S basin8236259,1247.537
Table 5. Analysis of the IBAT species list of the 3S rivers.
Number of Species
3S RiversSekongSesanSre Pok
Total number of species in 3S331316287282
% of total 95.4786.7185.20
Red List status
CR—Critically Endangered7776
EN—endangered141288
VU—vulnerable16151513
NT—Near Threatened8877
LC—Least Concern237
DD—Data Deficient50
Origin
Super-endemics—11292293
Endemics—161595252
Indigenous—2240233240226
Non-native—32211
Migratory guilds
1. Rithron-resident guild64563937
2. Migratory main channel and tributary)-resident guild18181616
3. Migratory main channel spawner guild 59585756
4. Migratory main channel refuge-seeker guild55555555
5. Generalist guild86838078
6. Floodplain-resident guild (blackfish)28262424
7. Estuarine-resident guild10998
8. Semi-anadromous guild7755
9. Catadromous guild2211
10. Marine guild2211
Disclaimer/Publisher’s Note: The statements, opinions and data contained in all publications are solely those of the individual author(s) and contributor(s) and not of MDPI and/or the editor(s). MDPI and/or the editor(s) disclaim responsibility for any injury to people or property resulting from any ideas, methods, instructions or products referred to in the content.

