Article

Investigation of Kinetic, Equilibrium, and Thermodynamic Modeling of Perfluorooctanoic Acid (PFOA) Adsorption in the Presence of Natural Organic Matter (NOM) by Dielectric Barrier Discharge Plasma-Modified Granular Activated Carbon (GAC)

by
Thera Sahara
1,
Doonyapong Wongsawaeng
1,*,
Kanokwan Ngaosuwan
2,
Worapon Kiatkittipong
3,
Peter Hosemann
4 and
Suttichai Assabumrungrat
5,6
1
Research Unit on Plasma Technology for High-Performance Materials Development, Department of Nuclear Engineering, Faculty of Engineering, Chulalongkorn University, Bangkok 10330, Thailand
2
Division of Chemical Engineering, Faculty of Engineering, Rajamangala University of Technology Krungthep, Bangkok 10120, Thailand
3
Department of Chemical Engineering, Faculty of Engineering and Industrial Technology, Silpakorn University, Nakhon Pathom 73000, Thailand
4
Department of Nuclear Engineering, Faculty of Engineering, University of California, Berkeley, CA 94720, USA
5
Center of Excellence in Catalysis and Catalytic Reaction Engineering, Department of Chemical Engineering, Faculty of Engineering, Chulalongkorn University, Bangkok 10330, Thailand
6
Bio-Circular-Green-economy Technology & Engineering Center (BCGeTEC), Faculty of Engineering, Chulalongkorn University, Bangkok 10330, Thailand
*
Author to whom correspondence should be addressed.
Water 2024, 16(11), 1499; https://doi.org/10.3390/w16111499
Submission received: 19 April 2024 / Revised: 17 May 2024 / Accepted: 20 May 2024 / Published: 24 May 2024
(This article belongs to the Topic Removal of Hazardous Substances from Water Resources)

Abstract

:
Perfluorooctanoic acid (PFOA) contamination in water sources poses significant environmental and health concerns. The kinetic, equilibrium, and thermodynamic features of PFOA adsorption in the existence of natural organic matter (NOM) were thoroughly investigated in this work using granular activated carbon (GAC) modified by dielectric barrier discharge (DBD) plasma. The impacts of DBD plasma parameters on the adsorption process were systematically examined. The results demonstrated that GAC modified by DBD plasma exhibited enhanced adsorption performance for PFOA, even in the presence of NOM. The optimal condition for plasma-treated GAC was achieved with 20 min of plasma treatment time and 100 W of plasma power, resulting in 92% PFOA removal efficiency in deionized water (DIW) and 97% removal efficiency in Chao Phraya River water (CPRW). A kinetic investigation using the pseudo-first-order model (PFOM), the pseudo-second-order model (PSOM), and the Elovich model (EM) indicated that plasma treatment time and NOM presence influenced the adsorption capacity and rate constants of PFOA with the PSOM having emerged as the most fitting kinetic model. The Langmuir isotherm model indicates monolayer adsorption of PFOA on plasma-treated GAC, with higher maximum adsorption capacity while NOM is present. The Redlich–Peterson and Sips isotherm models indicated varying adsorption capacity and heterogeneity in the adsorption system. The Sips model was determined as the most fitting isotherm model. Furthermore, the favorable and spontaneous character of PFOA adsorption onto plasma-treated GAC was validated by thermodynamic analysis, with endothermic heat absorption during the process. Overall, this comprehensive investigation provides valuable insights into the adsorption characteristics of PFOA in the existence of NOM using GAC modified by DBD plasma.

1. Introduction

Perfluorooctanoic acid (PFOA) belongs to a class of anthropogenic chemicals known as perfluorinated compounds (PFCs. In these compounds, the carbon–fluorine (C–F) bonds replace carbon–hydrogen (C–H) bonds typically found in organic molecules. This makes PFCs more stable due to the stronger C–F bond, which is harder to break down than the C–H bond. It exhibits exceptional surfactant characteristics and high stability, primarily due to the coexistence of hydrophobic and hydrophilic components [1]. This chemical property has led to global concern about water pollution with PFOA for the scientific community and government agencies, as PFOA’s surfactant characteristics facilitate its persistence and spread in the environment, posing potential risks to aquatic ecosystems and human health. Despite the inclusion of PFOA in the restricted or prohibited list in several countries, such as the United States, Canada, and Germany, its usage is still permitted in specific sectors [2,3]. These include applications in electroplating, polytetrafluoroethylene manufacturing, and optoelectronic industries [2]. However, the presence of PFOA in aquatic systems poses a significant environmental and health risk [4]. For humans, the primary exposure routes are through the consumption of contaminated groundwater or surface water used as potable water supplies, as well as through the consumption of contaminated aquatic organisms. These risks include neurotoxicity, developmental toxicity, endocrine toxicity, hepatotoxicity, immune toxicity, gene toxicity, and tumorigenic potential [4]. In South Korea, non-industrial areas show PFOA serum concentrations in the female population ranging from 15.0 to 256 μg/L [5]. Elevated PFOA levels in the serum can have significant health implications, particularly for women, as PFOA exposure has been associated with reproductive and developmental issues, liver damage, and potential carcinogenic effects. Concentrations exceeding 100 ng/L indicate the presence of pollution sources [6], while the Environmental Protection Agency (EPA) has determined the highest permissible level of PFOA in drinking water to be 0.07 μg/L.
Natural organic matter (NOM) is widely found in water bodies like rivers, lakes, and groundwater comprising a complex mixture of organic compounds, that includes hydrophilic acid, humic substances, lipids, proteins, carbohydrates, amino acids, hydrocarbons, and carboxylic acids [7]. This intricate matrix of organic complexes can pose various challenges in the water supply system. NOM has the ability to bind or attach to organic pollutants using covalent bonds, hydrogen bonds, hydrophobic interactions, and other mechanisms [8]. During water treatment, NOM reacts with chlorine or other disinfectants, producing hazardous disinfection byproducts, including haloacetonitriles (HANs) and trihalomethanes (THMs) [9]. These toxic byproducts raise concerns for water quality and human health. NOM also causes issues such as unpleasant odor, taste, and membrane fouling in water treatment plants [10], owing to its unique physicochemical properties influencing interactions with other molecules and overall behavior in water systems.
The elimination of NOM and its components from water poses a significant global challenge. Various techniques proposed for their removal include membrane filtration, coagulation, oxidation, and adsorption [11]. Adsorption is widely recognized as an effective approach [9], but efficient adsorbents for real wastewater are needed, considering factors like cost, capacity, competitive adsorption, regeneration, and reuse. While adsorption has shown promise as a viable option for organic contaminant removal, limited research has been performed to comprehend the mechanism of PFOA adsorption in the presence of NOM. There are different types of adsorbents, including activated carbon and carbon nanotubes, which effectively adsorb PFCs [12]. Granular activated carbon (GAC) is commonly utilized in water treatment for its extensive surface area, cost-effectiveness, and reactive surface groups [6]. GAC adsorption is widely acknowledged as one of the most effective methods for removing NOM, PFOA, and a variety of other water contaminants. Studies have shown that dissolved oxygen in the water source can enhance the adsorption capacity (ACP) of GAC for NOM, with the existence of molecular oxygen leading to a two-fold increase in ACP [13]. NOM also significantly affects the adsorption of PFOA. The efficiency of removing PFCs from water using activated carbons was investigated, considering the presence of organic matter with varying molecular sizes [14]. The findings revealed that PFC adsorption was significantly reduced by small organic compounds and played a major role in competitive sorption. More research is required to fully understand their adsorption interaction in natural environments. Investigating the relationship between PFOA and NOM, along with its influencing factors, will enhance comprehension of their adsorption behavior in nature. However, there is still a need for further comprehension of the behavior of PFOA and NOM on GAC. Currently, there are no reports in the literature exploring PFCs and NOM adsorption from natural water systems. Most experimental studies on PFCs adsorption utilize synthetic solutions of NOM, but in natural systems, NOM comprises a diverse range of organic compounds, including carboxylic acids, proteins, and hydrophilic acids [10]. Therefore, using actual water samples provides more reliable results for a comprehensive understanding of adsorption behavior.
The properties of adsorbents’ surfaces are crucial for the adsorption process, involving particular interactions with designated molecules. GAC’s ACP can be significantly improved through thermal or chemical modifications, such as heat and acid treatment, but these methods often have drawbacks, including the use of various chemicals, resulting in increased operational costs and limited efficiency [15]. Therefore, it is imperative to develop adsorbents that are low-cost, readily available, effective, reusable, and preferably environmentally friendly to remove PFOA and NOM from water. Cold plasma techniques have attracted considerable interest in recent years because of their advantages over traditional modification methods. Plasma treatment serves as a green modification method, offering several benefits such as the absence of solvents, rapid, non-toxic, versatile, and energy efficiency [16]. Numerous active species, including ions, electrons, and radicals, are generated by plasma discharge during plasma treatment. These species cause interactions with material surfaces and functional groups (FGs) that are challenging to accomplish through conventional chemical processes. [17]. Plasma treatment has emerged as a versatile method for modifying the surface properties of various solid materials, often requiring minimal or no surface preparation [18]. Yang et al. [19] utilized a plasma-induced technique to synthesize chitosan-grafted magnetic bentonite, that demonstrated magnetic properties, low turbidity, and improved ACP for entrapping Cs+ ions. Atmospheric pressure dielectric barrier discharge (DBD) plasma is a low-temperature plasma that eliminates the need for vacuum systems, reducing costs and system complexities. By adjusting parameters including discharge power, treatment time, plasma carrier gases, and gas flow rate, different modifications can be achieved on adsorbent surfaces [20,21]. Despite numerous studies reporting improved surface properties of certain adsorbents using cold plasma, there has been no research yet on increasing GAC’s ACP for PFOA in the presence of NOM employing this technique.
When assessing an adsorbent’s feasibility, factors beyond ACP must be considered, including thermal, mechanical, and chemical stability, affinity for the adsorbate, favorable isotherm and kinetic models, and other relevant properties. Understanding the mechanisms and interactions that take place during the adsorption process is crucial for optimizing operating conditions and ensuring the effectiveness of the adsorbent. To acquire a thorough insight into the entire process of adsorption, it is crucial to investigate mass transfer phenomena, thermodynamics, and equilibrium. This can be achieved through the application of suitable mathematical models that consider kinetics, thermodynamics, and equilibrium, instead of relying solely on empirical approaches [22]. By employing phenomenological models, a deeper understanding of the underlying mechanisms can be obtained. Applying appropriate mathematical modeling is vital for interpreting experimental data related to GAC adsorption in different water sources. It also helps in the development of enhanced adsorbent properties and the optimization of wastewater treatment operating parameters [22].
The Chao Phraya River in Thailand exemplifies such a river, forming a vast interconnected system with numerous tributaries [23]. However, the land along the river is a significant source of pollutants from industrial parks, agricultural runoff, and aquaculture drainage, impacting water quality and NOM concentrations [24]. Given the complexity and influence of these pollution sources on water quality, Chao Phraya River water (CPRW) was chosen as the source of NOM for this study. The purpose was to investigate the PFOA adsorption when NOM is present, utilizing the CPRW to accurately represent the NOM composition and characteristics in the system and compare it to PFOA in the deionized water source. By studying PFOA adsorption under these conditions, valuable insights can be gained into the interaction between PFOA and NOM, shedding light on the behavior and fate of this contaminant in natural water systems.
The general objective of this study is to investigate the adsorption of PFOA from water solutions utilizing plasma-modified GAC as the adsorbent. The specific goals included: (i) synthesizing and characterizing the adsorbent, (ii) experimentally exploring the influence of DBD plasma operating conditions, (iii) assessing the impact of NOM on the adsorption behavior of PFOA, (iv) modeling the isotherm and kinetics data to enhance the comprehension of adsorption mechanisms, (vi) studying the thermodynamics of PFOA adsorption, and (vii) providing a critical summary of the interaction between NOM and PFOA in different aqueous media. Notably, this study represents the first and novel investigation of GAC modification using non-thermal plasma to enhance the adsorption of PFOA in the existence of NOM from the CPRW source.

2. Materials and Method

2.1. Materials

The CPRW was collected at lat. 13°54′56.9″ N and long. 100°29′38.1″ E, as depicted in Figure S1. The pH of the water at the time of collection was 6.8. The collected water sample was well preserved at 4 °C in the refrigerator for the adsorption experiment and used within 28 days. The measurement of total organic carbon (TOC), dissolved organic carbon (DOC), and UV254 yielded values of 30.15 mg/L, 23.49 mg/L, and 0.957 cm−1, respectively. Subsequently, the water was filtered using a pre-washed filter with a pore size of 0.3 mm and was then placed in a refrigerator at a temperature of 4 °C. PFOA of 95% purity and possessing a molecular weight of 414.07 g/mol was purchased from Sigma-Aldrich (St. Louis, MO, USA). An 85% phosphoric acid (H3PO4, PA) was procured from Anapure (Auckland, New Zealand). GAC was manufactured by Aquatek (Bangkok, Thailand). A syringe filter made from glass fibers with a 2.0 µm pore size was acquired from Merck Millipore (Darmstadt, Germany). All necessary solutions were made using deionized water (DIW) that was produced locally in the laboratory. Alternative Chemical supplied ultra-high purity (UHP) oxygen and helium gas cylinders.

2.2. Activated GAC with PA

To prepare the GAC, it was initially soaked in DIW for approximately 4 h to remove impurities and suspended particles. Afterward, it was thoroughly washed to ensure cleanliness. The GAC was dried for 24 h at 50 °C in an oven. Following the drying process, the GAC was immersed for 24 h in 1 M PA solution. After filtering the mixture, DIW was used to rinse the GAC until the pH level was neutral. The residue obtained from the filtration was dried at 105 °C in an oven until it achieved a stable weight. The resulting PA-activated GAC was used consistently throughout the entire investigation.

2.3. DBD Plasma Treatment of PA-Activated GAC

The DBD plasma system utilized an adjustable neon transformer with an output voltage range of 0–15 kV and a maximum current of 30 mA, operating at a fixed frequency of 25 kHz. The output power was controlled using a neon transformer linked to a voltage regulator (variac) and varied from 25 to 100 W. The system employed aluminum parallel-plate electrodes measuring 9 cm × 13 cm for the upper electrode and 11 cm × 15 cm for the lower electrode. The 800 mL borosilicate glass container that served as the reaction chamber, was positioned on top of the lower electrode. A glass dielectric material, measuring 10 cm × 14 cm, was fixed to the discharge electrode. Throughout the experiments, a 3 mm air gap was maintained between the bottom of the glass reactor and the bottom of the glass dielectric material. The PA-activated GAC samples were subjected to DBD plasma treatment. A gas mixture of 30 vol.% O2 and 70 vol.% He was fed into the DBD plasma reactor with a 1.5 L/min flow rate. Calibrated mass flow controllers were used to individually regulate the two gases (He and O2). Plasma was applied to the PA-activated GAC samples for 10 to 30 min and then plasma-treated GAC was stored in airtight glass containers.

2.4. Adsorption Experiment

A total of 20 mg of PA-activated plasma-treated GAC were added to a glass beaker for each batch adsorption experiment. The beaker was filled with a 100 mL solution containing PFOA at a starting concentration of 100 mg/L. Using this high concentration allows us to assess the maximum adsorption potential of the material, which provides useful information for understanding its adsorption isotherms and kinetics. At room temperature, the adsorption process was carried out utilizing a hot plate stirrer with a magnetic stirrer bar that was set to 300 rpm. The experiment was conducted for 24 h [25].
To conduct kinetic, equilibrium, and thermodynamic adsorption experiments, a predetermined amount of solution and a measured quantity of the adsorbent were mixed under monitored conditions, including pH, agitation, temperature, and contact time as depicted in Table 1. Every experiment was carried out twice. The equilibrium state was properly attained since the experiments were set up due to the solution’s concentration staying above the apparatus’s lowest detection limit.

2.5. PFOA Determination

Following the adsorption process, the mixture was filtered using a syringe filter with a pore size of 2.0 μm. The amount of PFOA that remained in the mixture was quantified with gas chromatography–flame ionization detection (GC–FID), which was modified from Koc et al. [26]. Helium was used as the carrier gas, flowing at a rate of 30 mL/min, whereas the column flow was 5.0 mL/min. For reliable analysis, the injector and detector temperature were 280 °C; the initial column oven temperature was 40 °C for 2 min, ramped at 30 °C/min to 225 °C, and held for 7.5 min; the peak area was measured electronically.

2.6. Characterization of Plasma-Treated GAC

Characterizing the chemical changes was carried out using Fourier transform infrared spectroscopy (FTIR) that occurred on the GAC surface both before and after modification.

2.7. Adsorption Kinetic Models

2.7.1. Pseudo-First-Order Model (PFOM)

The PFOM, originally introduced by Lagergren in 1898, is represented by Equation (1) in its differential form [27]:
d q t d t = k 1 ( q e q t )
where k1 is PFOM rate constant (1/min), qt signifies the ACP (mg/g) at time t, t = time (min), and qe represents the ACP at equilibrium (mg/g). The linearized form (Equation (2)) is produced by integrating Equation (1) with q = 0 when t = 0 as the starting condition.
ln ( q e / ( q e q ) ) = k 1 t
When plotting l n ( q e / ( q e q ) ) against t, a straight line is obtained, and for systems that follow the PFOM model, this line originates from the origin with a slope of k1 [27]. The rate constant (k1) in the PFOM model is influenced by various process conditions.

2.7.2. Pseudo-Second-Order Model (PSOM)

The PSOM (Equation (3)) was initially used by Ho et al. [28] to explain how lead adsorbs onto peat. Since then, the PSOM has been employed in various studies to explain adsorption processes. Many published research papers have utilized the PSOM to explain experimental adsorption data and estimate the rate constants for adsorption [29].
d q t d t = k 2 ( q e q t ) 2
The PSOM could be expressed in its integrated form as follows:
q t = q e 2 k 2 t 1 + q e k 2 t
The model parameters are calculated by transforming the nonlinear PSOM into a linear form (Equation (5)).
t q t = 1 k 2 q e 2 + t q e
The process of linearizing the PSOM alters the significance of qt and triggers errors, potentially leading to inaccuracies in the determination of the model parameters [29].
Similar to the PFOM rate constant (k1), the PSOM rate constant (k2) is utilized to characterize the adsorption rate in the PSOM [30]. However, in the PSOM, the adsorption rate, represented by d q t / d t , is correlated to both the PSOM rate constant (k2) and ( q e q t ) 2 . Therefore, for a more accurate calculation of the PSOM rate constant (k2), it is recommended to use Equation (6).
PSOM   adsorption   rate = k 2 ( q e q t ) 2

2.7.3. Elovich Model (EM)

According to the EM, the activation energy rises as adsorption time increases and with increasing heterogeneity of the adsorbent surface [31]. It is an empirical model that lacks specific physical interpretations. Although originally developed to describe gas chemisorption on solid surfaces, the EM has found widespread use [31]. It is described by Equation (7) [32].
d q t d t = α e β q t
Performing the integration of Equation (8) under the condition of q0 = 0 obtains the following:
q t = 1 β ln ( 1 + α β t )
Equation (8) is a nonlinear equation that could be approached using either the nonlinear least square regression technique (plotting qt versus t) or a linear method (plotting qt versus ln(1 + αβt)). The linear method requires appropriate initial values of αβ [33,34]. Chien and Clayton [35] simplified Equation (8), while assuming that αβt >> 1:
q t = 1 β ln ( α β t ) = 1 β ln ( α β ) + 1 b ln ( t )
The EM, a kinetic model extensively described for depicting the chemisorption process [36], operates under the principle that the adsorption rate is directly proportional to the quantity of unoccupied active sites on the adsorbent’s surface [36]. The α parameter indicates the initial adsorption rate constant [36]. Conversely, the β parameter represents the desorption constant, signifying the rate at which the adsorbate is released from the surface of the adsorbent [36].

2.8. Adsorption Isotherm

An isotherm describes the correlation between the quantity of adsorbate that has been adsorbed onto the solid phase at a specific temperature and the concentration of adsorbate at equilibrium in the liquid phase [37]. By fitting experimental data to isotherm models, various aspects of adsorption, including the adsorption mechanisms, maximum ACP, and properties of the adsorbents can be analyzed.

2.8.1. Freundlich Isotherm Model (FIM)

The FIM is a commonly employed isotherm model to represent nonlinear adsorption phenomena on multilayer adsorbents [38]. It offers both linear and nonlinear forms to represent the adsorption process. The equations for the nonlinear (Equation (10)) and linear (Equation (11)) forms of the FIM are as follows [39]:
q e = K F C e 1 / n
log q e = log K F + 1 n log C e
In the FIM, the constants KF (L1/n·mg1−1/n·g−1) and n represent the parameters of the model.

2.8.2. Langmuir Isotherm Model (LIM)

A chemical adsorption isotherm model known as the LIM describes how adsorbate molecules adsorb and it is widely used to exhibit gas–solid adsorption [40,41]. The nonlinear form of LIM is presented in Equation (12) and can be linearized as shown in Equation (13):
q e = q m K L C e 1 + K L C e
C e q e = C e q m + 1 K L q m
where KL (L/mg) represents the ratio of the adsorption rate to the rate of desorption, and qmax (mg/g) is the maximum ACP.
Webber and Chakkravorti [42] proposed the use of the separation factor (RL) to assess the favorability of adsorption in the LIM. Equation (14) is used to determine the separation factor [42]:
R L = 1 1 + K L C 0
The interpretation of RL values in the LIM is as follows: if RL > 1, it signifies unfavorable adsorption; when RL = 1, it denotes linear adsorption; and when RL < 1, it suggests favorable adsorption [42].
The LIM relies on some basic assumptions [43]. It presumes that adsorption occurs on the monolayer adsorbent’s surface, where adsorption sites are evenly distributed and have similar adsorbate molecule affinity [43]. The model also presumes constant adsorption energy throughout the process, indicating no variation in energy among different sites [43]. Additionally, it is expected that the adsorbate molecules on the surface do not significantly interact or repel one another, and each site acts independently without being influenced by neighboring molecules [43].

2.8.3. Redlich–Peterson (R–P) Isotherm

The R–P model is a practical hybrid model that combines aspects of both the LIM and FIM [44]. It is commonly used to describe adsorption processes, whether they are homogeneous or heterogeneous in nature [44]. Equation (15) represents the R–P isotherm model [44]:
q e = K R P C e 1 + a R P C e g
where KRP (L/g) and a RP (Lg/mgg) are constants, and g is the exponent 0 ≤ g ≤ 1. Notably, when g is equal to 1, the R–P model simplifies to the LIM. Moreover, as Ce approaches infinity, qe approaches the value of qe (KRP/ α RP), which corresponds to the FIM [44].

2.8.4. Sips Isotherm Model (SIM)

The SIM combines the models of both the LIM and FIM [45] and is widely recognized as a suitable three-parameter model for monolayer adsorption [46]. The SIM is capable of describing both homogeneous and heterogeneous systems [45]. The non-linear SIM is represented by Equation (16) [45]:
q e = q m s K S C e n s 1 + K S C e n s
where qms (mg/g) represents the maximum quantity that has been adsorbed, and Ks (Lns/mgns) and ns are the Sips constants that determine the shape of the isotherm curve and the level of nonlinearity, respectively. The SIM becomes the LIM if ns = 1, while at a low C0 it becomes the FIM [45]. The parameters defining the ACP and degree of nonlinearity in this model are denoted by the constants Ks and ns, respectively. The value of ns reflects the adsorbent surface’s heterogeneity, which influences the adsorption isotherm’s shape [46].

2.9. Adsorption Thermodynamics

The thermodynamic parameters associated with the adsorption of PFOA include the differential enthalpy of PFOA adsorption (ΔH, expressed in kJ/mol), the standard molar integral entropy of PFOA adsorption (Δ, expressed in kJ/(mol·K), and Gibbs free energy (Δ, expressed in kJ/mol) [47]. It is crucial to emphasize that the absolute value of ΔH is equivalent to the isosteric heat of adsorption of methane (Qst), i.e., Δ H = Q s t [47].
Both ΔH and ΔS° could be employed to describe the correlation between temperature and pressure for a fixed amount of PFOA adsorption. These parameters provide insights into the thermodynamic characteristics of the adsorption process and how it is influenced by changes in pressure and temperature as indicated by Equation (17) [48]:
P = P 0 · exp Δ S 0 R · exp Δ H R T
In the context of the equation provided, P0 represents the reference pressure at which the system is considered to be in the ideal gas state, and it is typically set at 0.1 Mpa [48]. R represents the ideal gas constant, an important constant in thermodynamics, with an approximate value of 8.314 J/(mol·K).
By integrating Equation (17), the following equation is obtained [48]:
ln P P 0 = Δ H R · 1 T Δ S 0 R
In this study, which involved liquid-phase adsorption, the distribution coefficient of the adsorbent (K), which typically represents the P/P0 ratio in gas-phase adsorption, was redefined as K = qe/Ce [49]. The values of ΔG, ΔH, and ΔS° were then calculated by multiplying them with the universal gas constant (R). By plotting ln(K) against 1/T and examining the resulting graph as shown in Figure S2, the slope can be used to determine ΔH and Qst [50]. Additionally, the y-axis intercept of the plot can provide an estimate of ΔS° [50]. The formulas used are provided below (Equations (19)–(21)) [49]:
G = R T ln K
H = s l o p e · R
S ° = int e r c e p t · R

3. Results and Discussions

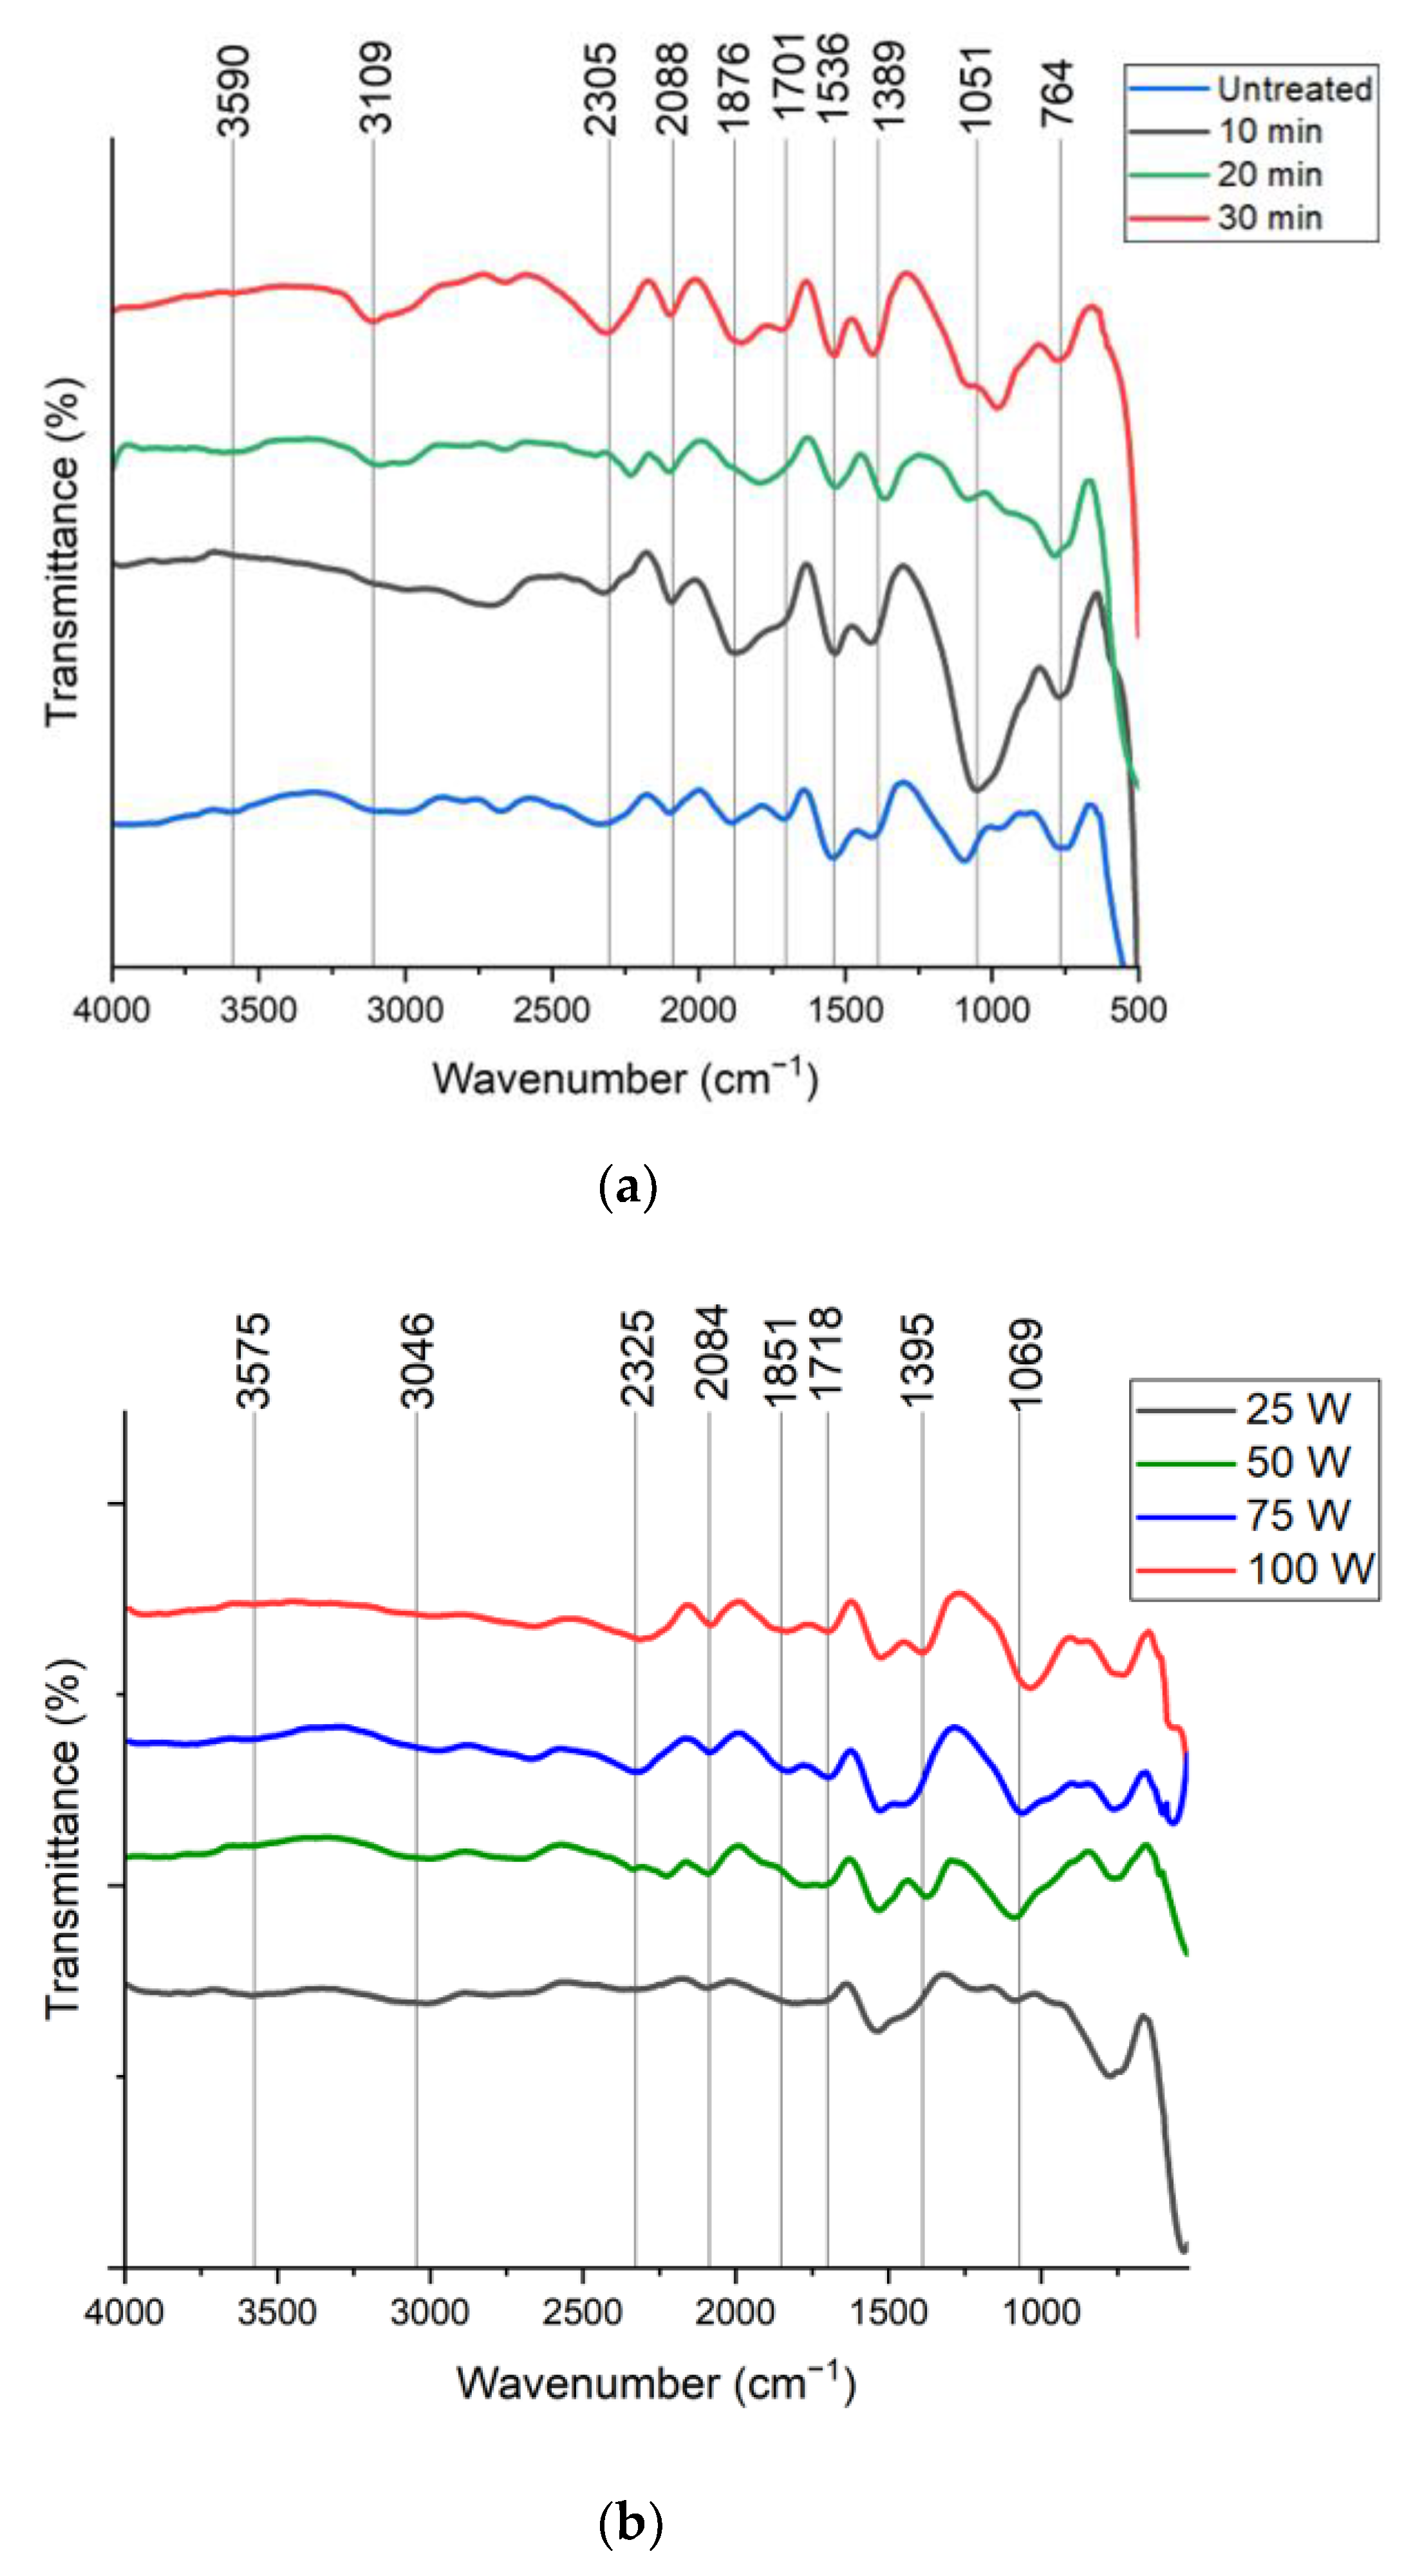
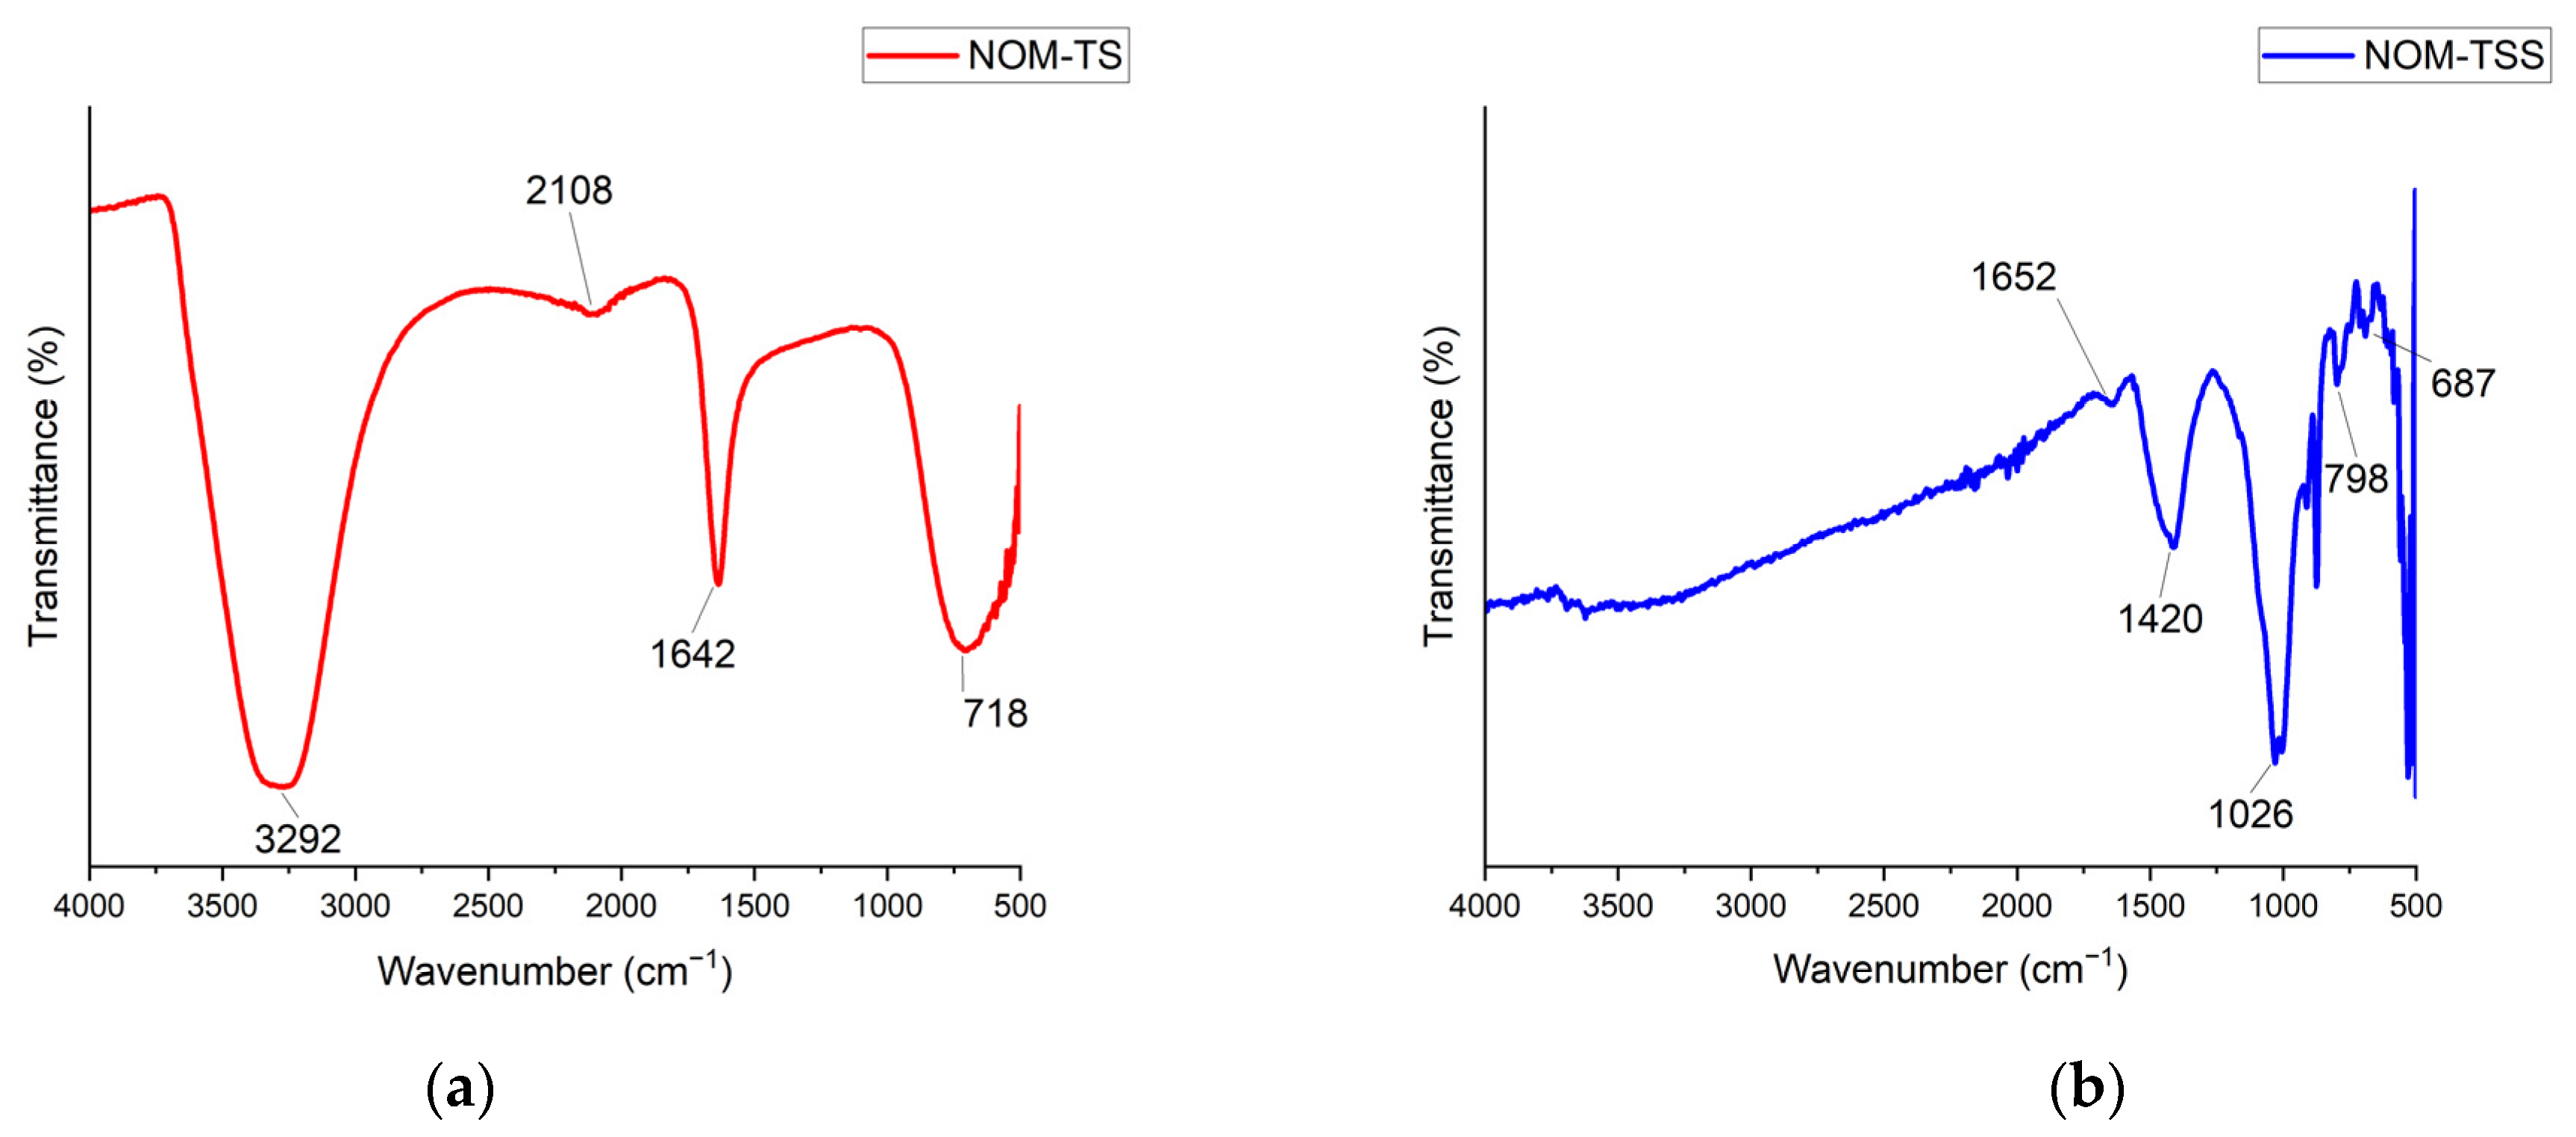
3.1. FTIR Analysis of GAC

Fourier transform infrared (FTIR) spectroscopy is a highly effective analytical method for qualitative and quantitative analyses. In Figure 1a, the FTIR spectra of both untreated and plasma-treated GAC are displayed, with variations in plasma treatment time (PTT). While the profiles of the spectra appear similar, there is a noticeable increase in the intensity of the absorption peaks in the treated sample compared to the untreated one. The band centered at 1051 cm−1 is associated with C–O stretching of the primary alcohol [38]. The band around 1389 cm−1 primarily corresponds to C–O stretching of the aromatic ester [51]. The peak located at 1876 cm−1 corresponded to the C=O stretching of the anhydride [52]. The peak around 3109 cm−1 was typically associated with O–H stretching of carboxylic acid confirming the existence of the oxygen-containing functional groups (OCFGs) [52].
The existence of OCFGs on the GAC surface increased with the increase in plasma discharge power (PDP), as seen in Figure 1b. This can be observed through the peak at 1718 cm−1 representing the C=O group [53] and the peak at 1395 cm−1 is assigned to O–H bend [54]. In particular, when the PA-activated GAC was treated with 100 W of PDP, the peak appeared slightly sharper compared to the 25 W treatment. The sharper peak suggested a higher concentration or stronger presence of the C=O group on the GAC surface, indicating that higher PDP was beneficial for the generation of OCFGs. The increase in PDP resulted in the generation of more active species, leading to a higher concentration of OCFGs on the surface. The increased power also supplied more energy for the plasma reactions, facilitating the integration of oxygen atoms into the GAC surface. Therefore, the PA-activated GAC was treated with 100 W of PDP for 20 min PTT selected for adsorption and analyzed by FTIR for the next section.

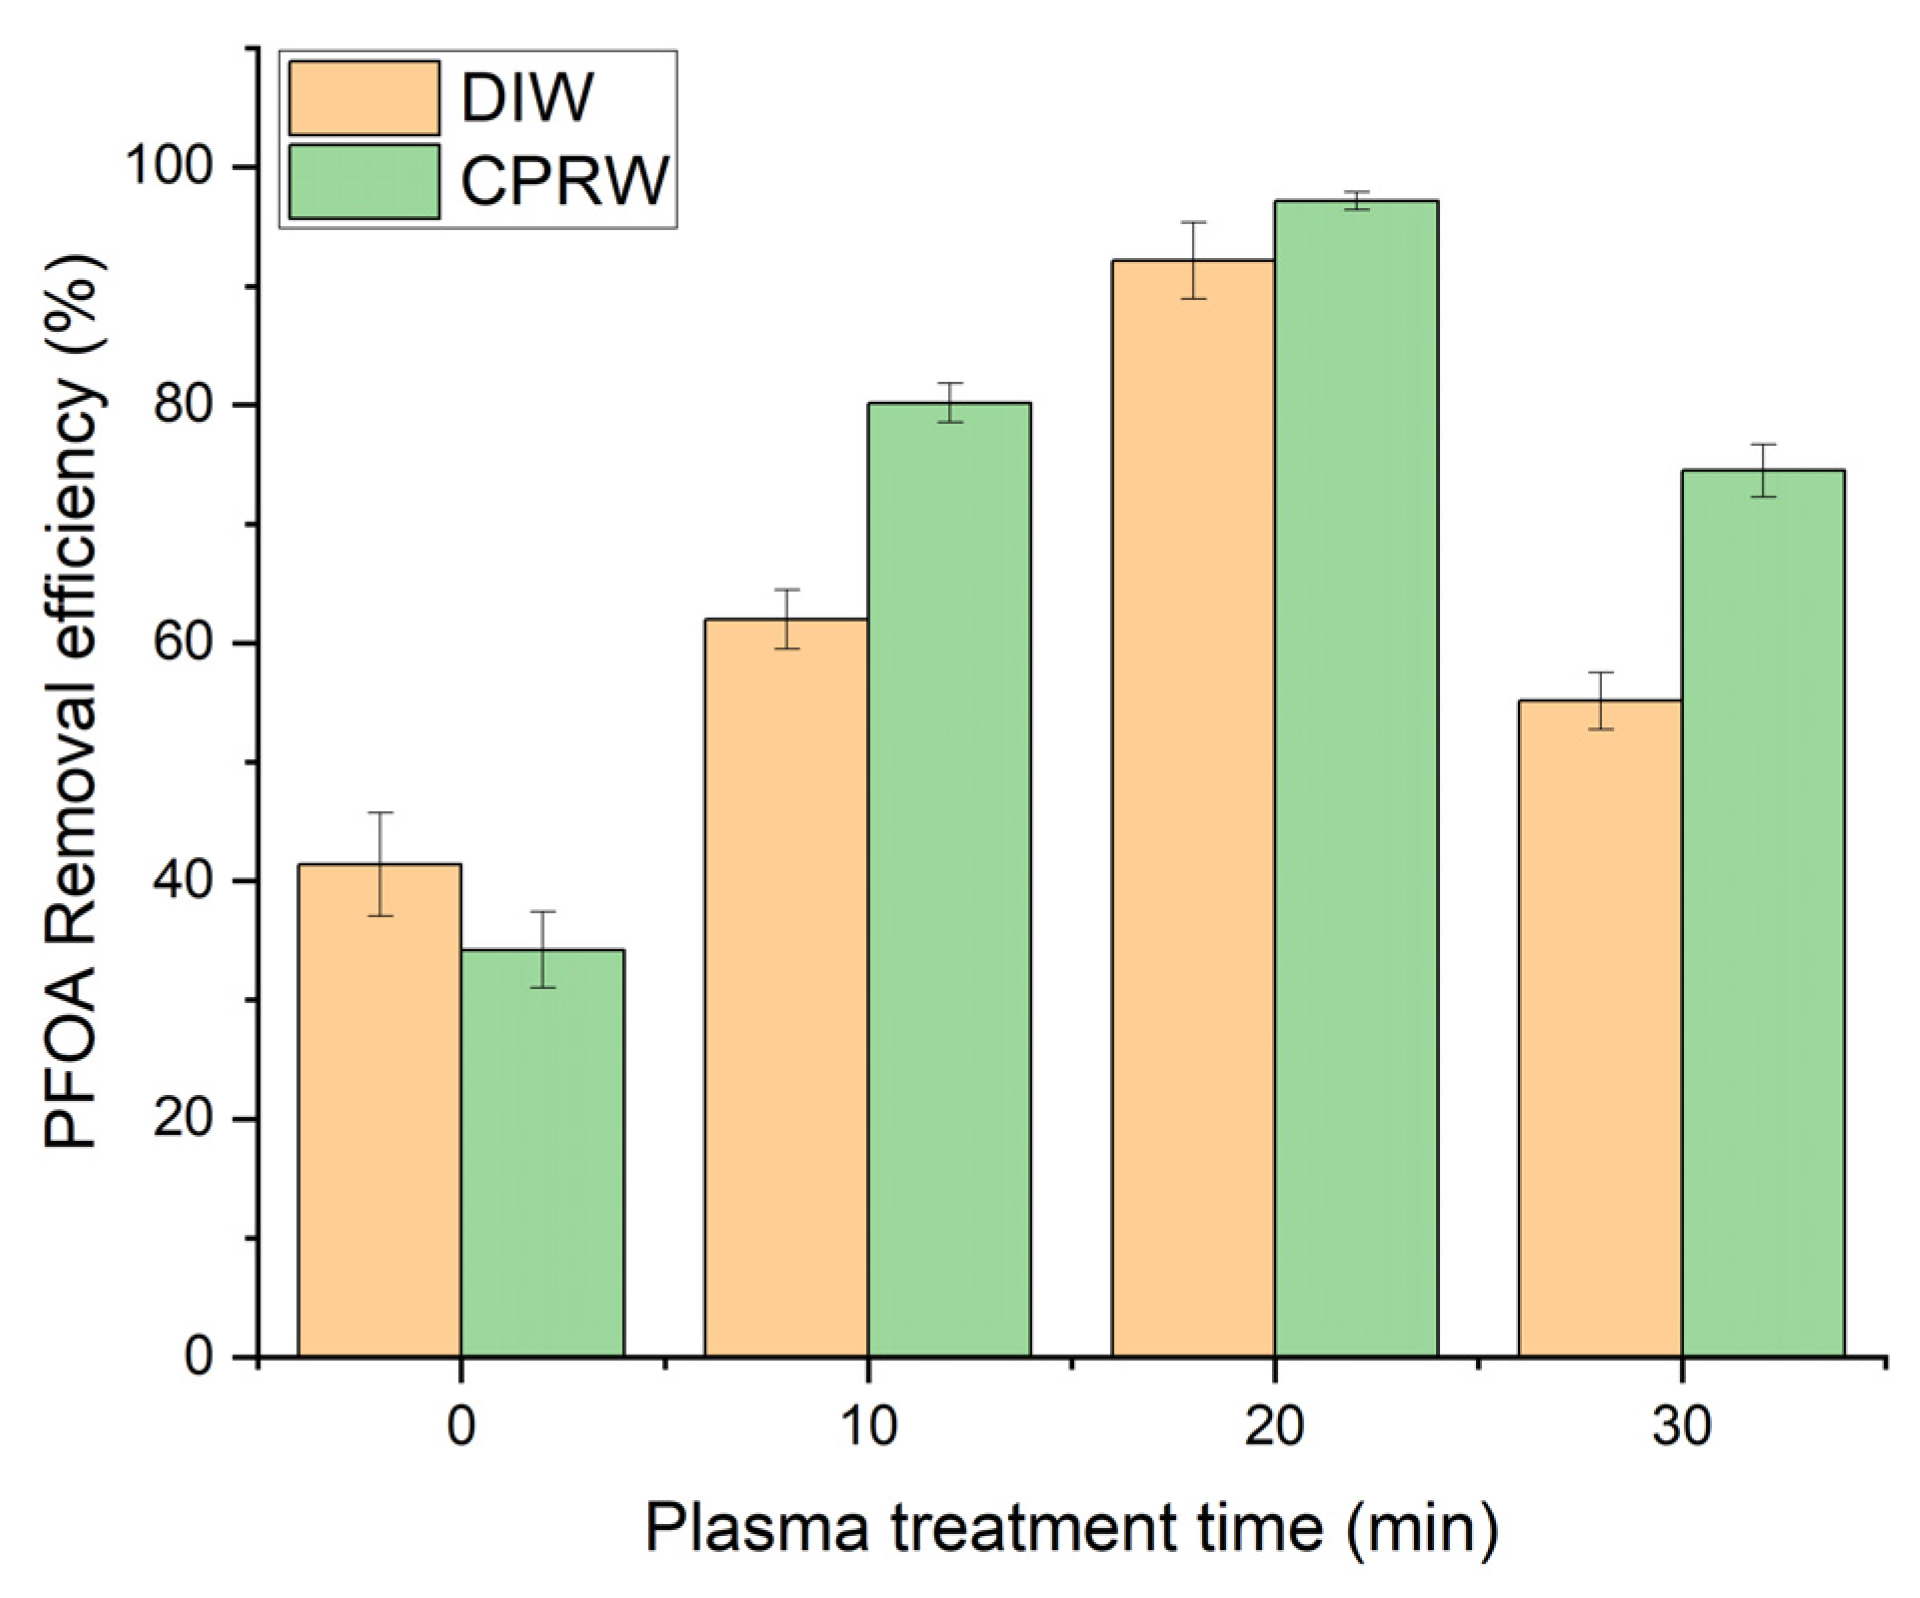
3.2. Effect of Plasma Treatment Time (PTT)

The impact of PTT on the PFOA removal efficiency was investigated. A comparison was made between the DIW solution (used as a standard) and CPRW, which served as a representative source of NOM. Figure 2 revealed a considerable decrease in the remaining level of PFOA after the adsorption process using plasma-treated GAC, compared to the untreated GAC (0 min treatment time). The results found that a treatment duration of 20 min showed the highest PFOA removal efficiency, reaching approximately 92% in DIW (with a final concentration of PFOA at 7.7 mg/L) and 97% in CPRW (with a final concentration of PFOA at 2.9 mg/L). Nonetheless, upon extending the duration of plasma treatment to 30 min, the ACP was negatively impacted. Overall, the study highlighted that plasma treatment of GAC enhanced its ability to adsorb PFOA. In comparison, Zhang et al. [55] reported a PFOA removal efficiency of ca. 75.2% using electrocoagulation (EC) with an aluminum electrode.
Our finding that the existence of NOM in water improved the ACP of plasma-treated GAC is in contrast with the previous research. A prior study indicated that the existence of NOM became a competitor for PFOA adsorption onto resin [56]. However, in the current study, the existence of OCFGs on plasma-treated GAC led to a decrease in NOM loading on the GAC surface, further increasing PFOA adsorption. These OCFGs, such as hydroxyl (–OH), carboxyl (–COOH), and carbonyl (–C=O) are polar groups and can interact with contaminants like PFOA, which is also a polar molecule because of the electronegativity of fluorine atoms. The dominant interaction for NOM adsorption onto GAC is typically electrostatic [10]. Therefore, the observed disparity in findings may be attributed to the specific surface chemistry modifications induced by plasma treatment, favoring PFOA adsorption over NOM, contrary to the findings reported in prior studies.

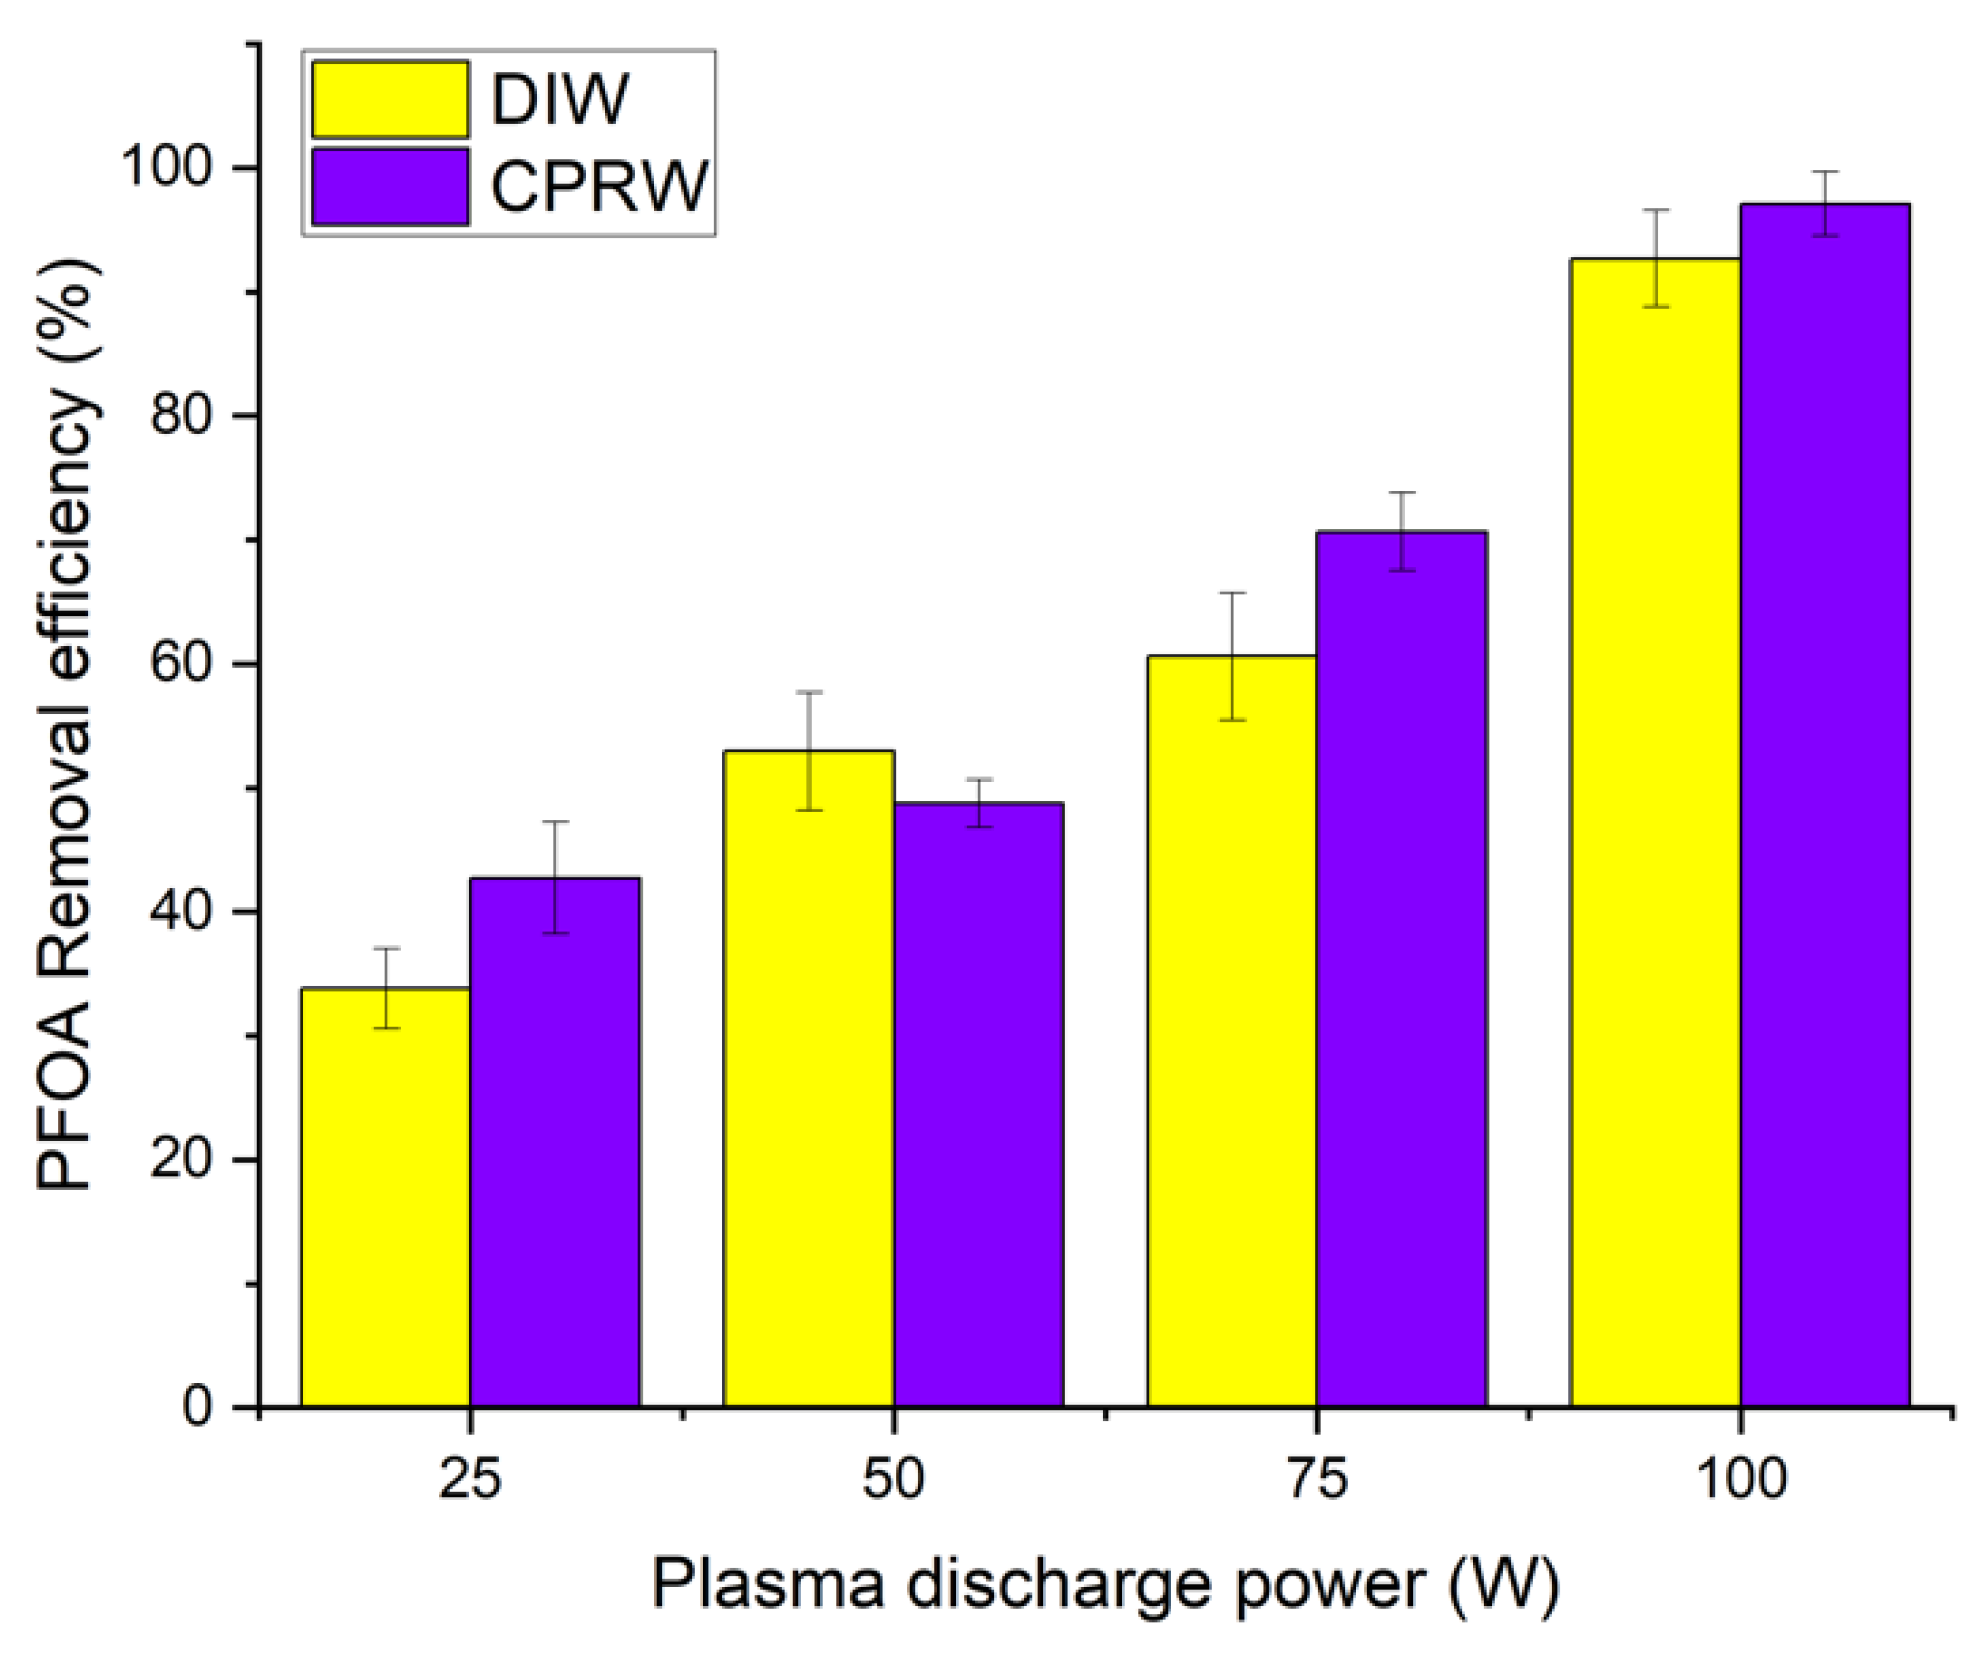
3.3. Effect of Plasma Discharge Power (PDP)

The effect of PDP on PFOA adsorption on GAC and its subsequent removal efficiency was investigated. Figure 3 indicates that PDP is a crucial factor influencing the adsorption performance and removal efficiency of PFOA. Increasing the PDP resulted in enhanced PFOA adsorption on GAC. This can be attributed to the generation of more energetic electrons and active free radicals at higher PDP [57]. These energetic species are capable of attacking and modifying the external surface of GAC, creating additional adsorption sites for PFOA [58]. Consequently, the ability of GAC to adsorb increased with higher PDP. The efficiency of removing PFOA also demonstrated a rising trend with the rise in PDP up to a certain point. At 100 W of PDP and 20 min of PTT, the highest removal efficiency was observed for both DIW and CPRW.
The higher PDP led to a more extensive surface modification of GAC. The more energetic electrons and active free radicals generated at higher powers facilitate the creation of new functional groups (FGs) or the alteration of existing FGs on the GAC surface [58]. These modifications can enhance the adsorption affinity and accessibility of PFOA molecules, leading to an increased ACP and removal efficiency. It is important to note that while higher PDP can be beneficial for PFOA adsorption, there may be practical limitations to consider. The study was limited to a maximum discharge power of 100 W, as this was the maximum power that the power supply could generate.
Hence, the optimal conditions for DBD plasma treatment of PA-activated GAC were determined to be a 20 min PTT and 100 W of PDP. Subsequently, plasma-treated GAC under these optimum conditions was utilized for adsorption kinetic, isotherm, and thermodynamic analyses.

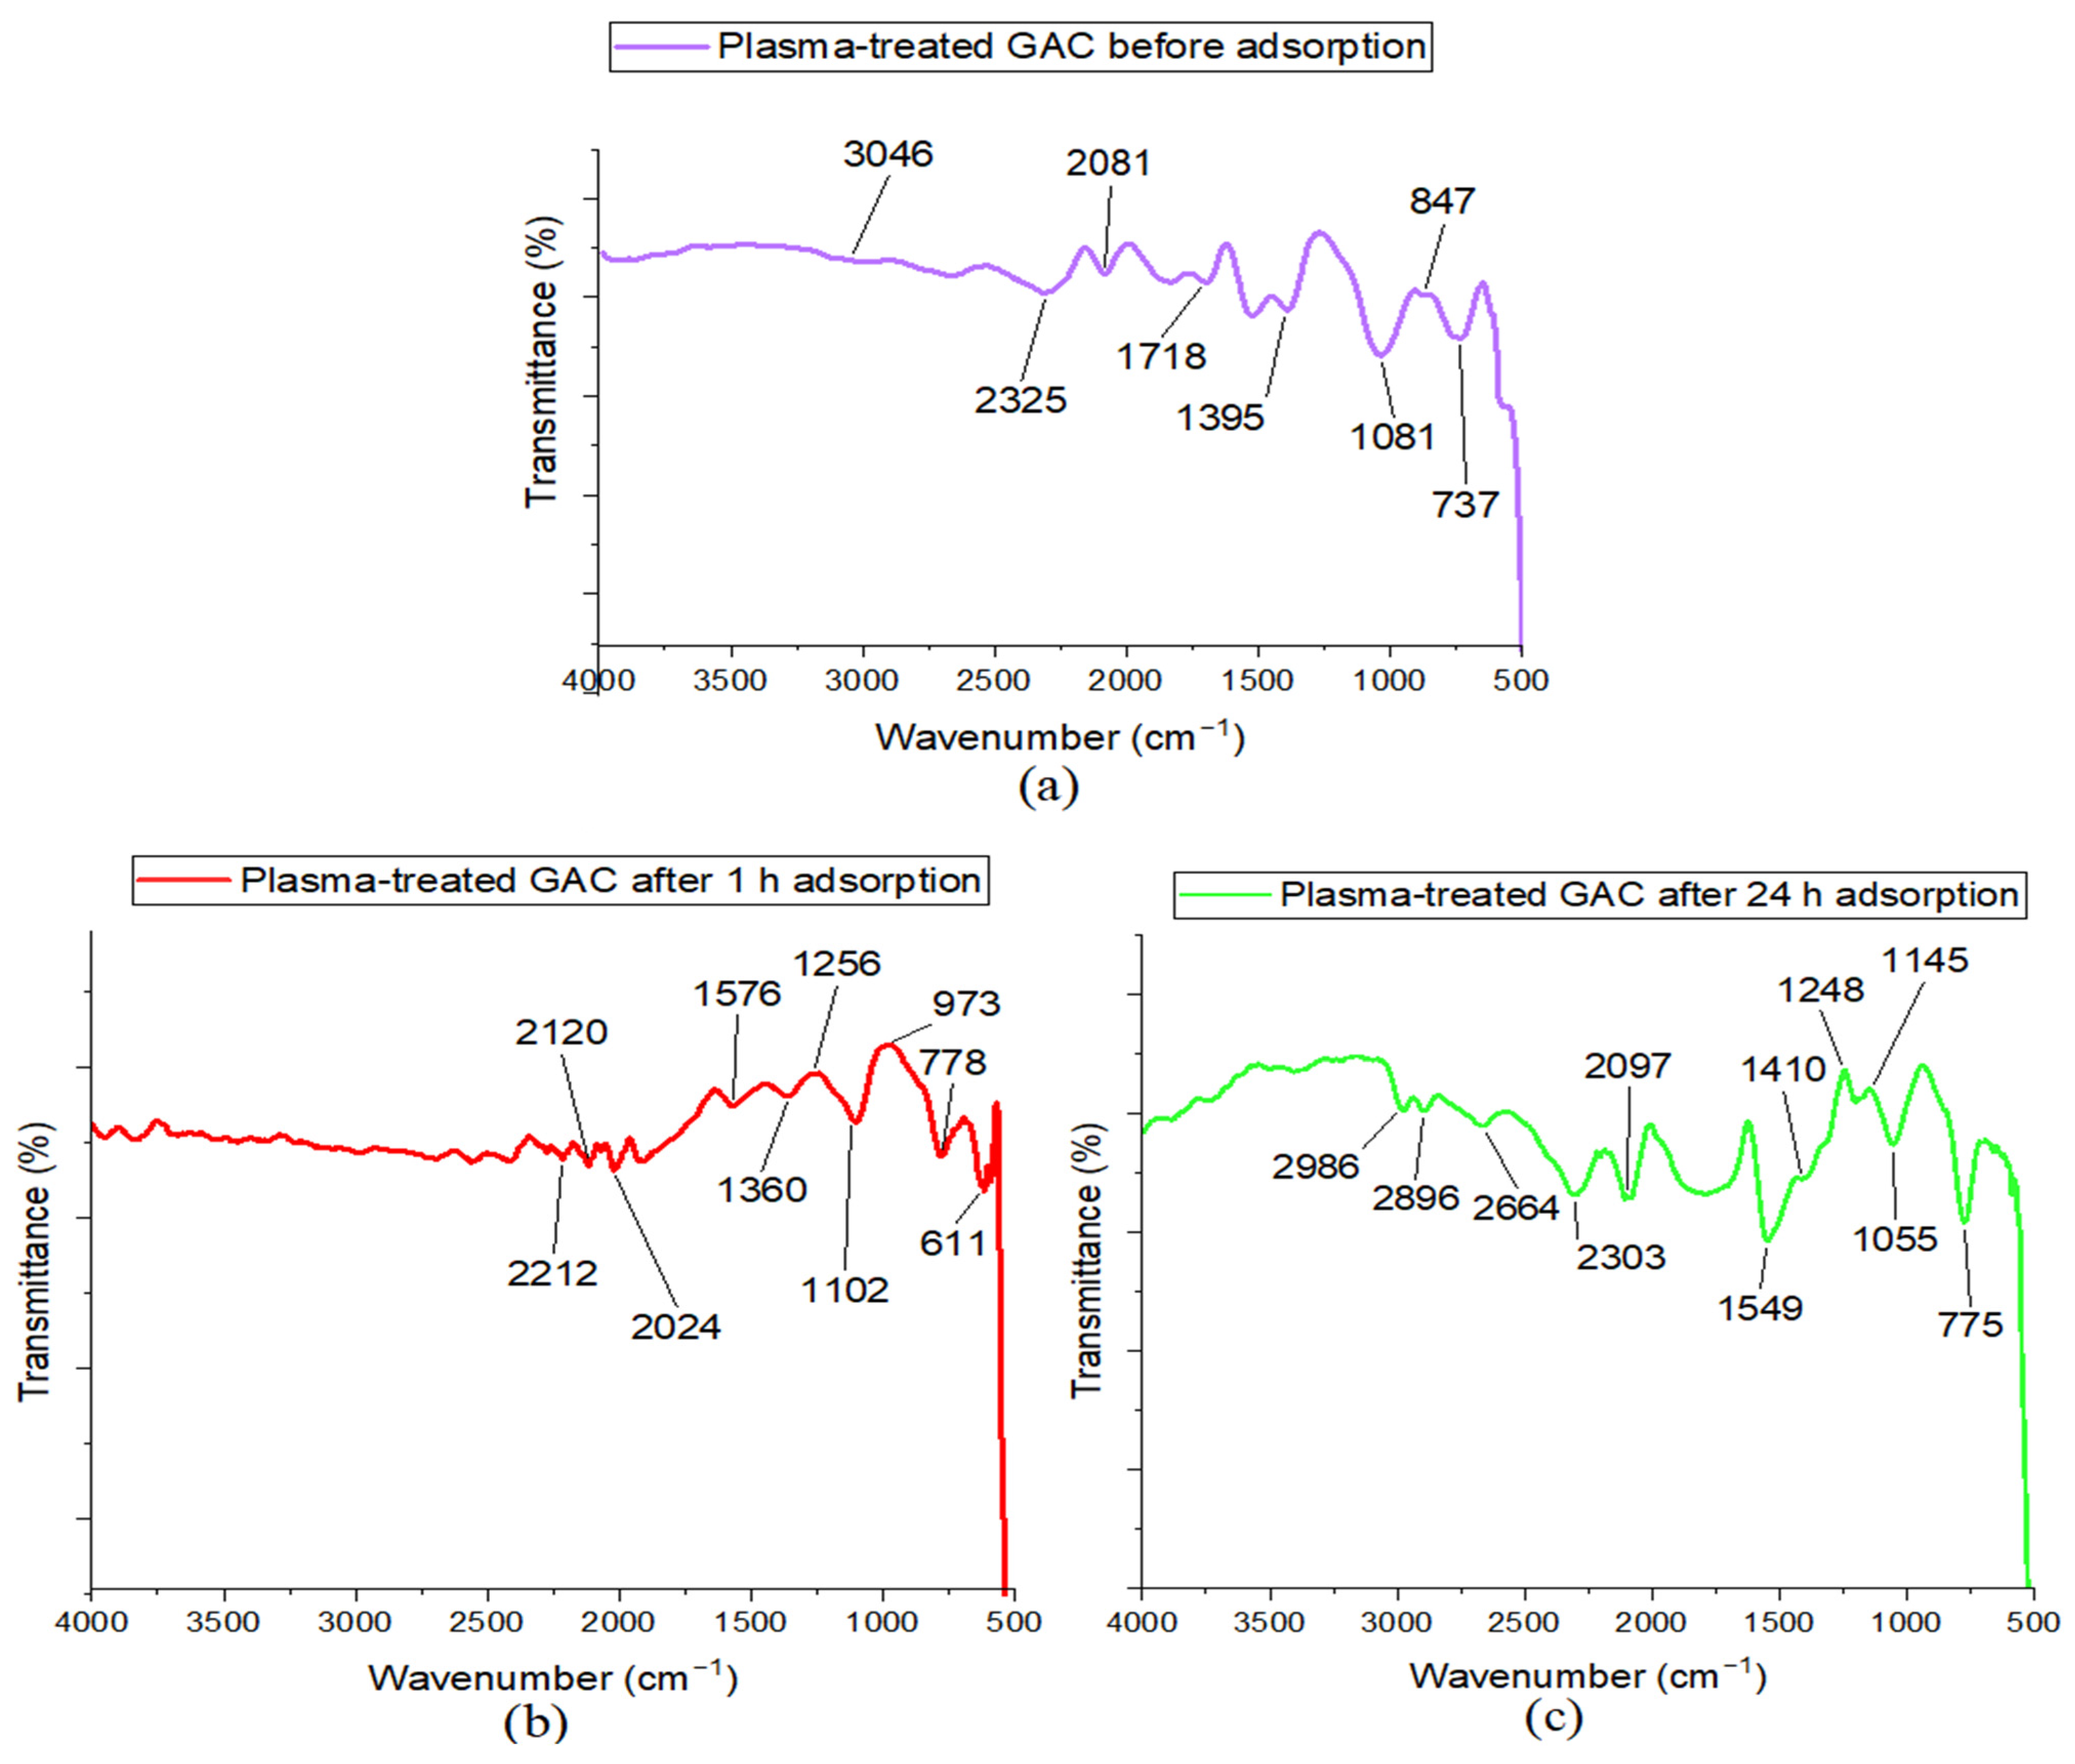
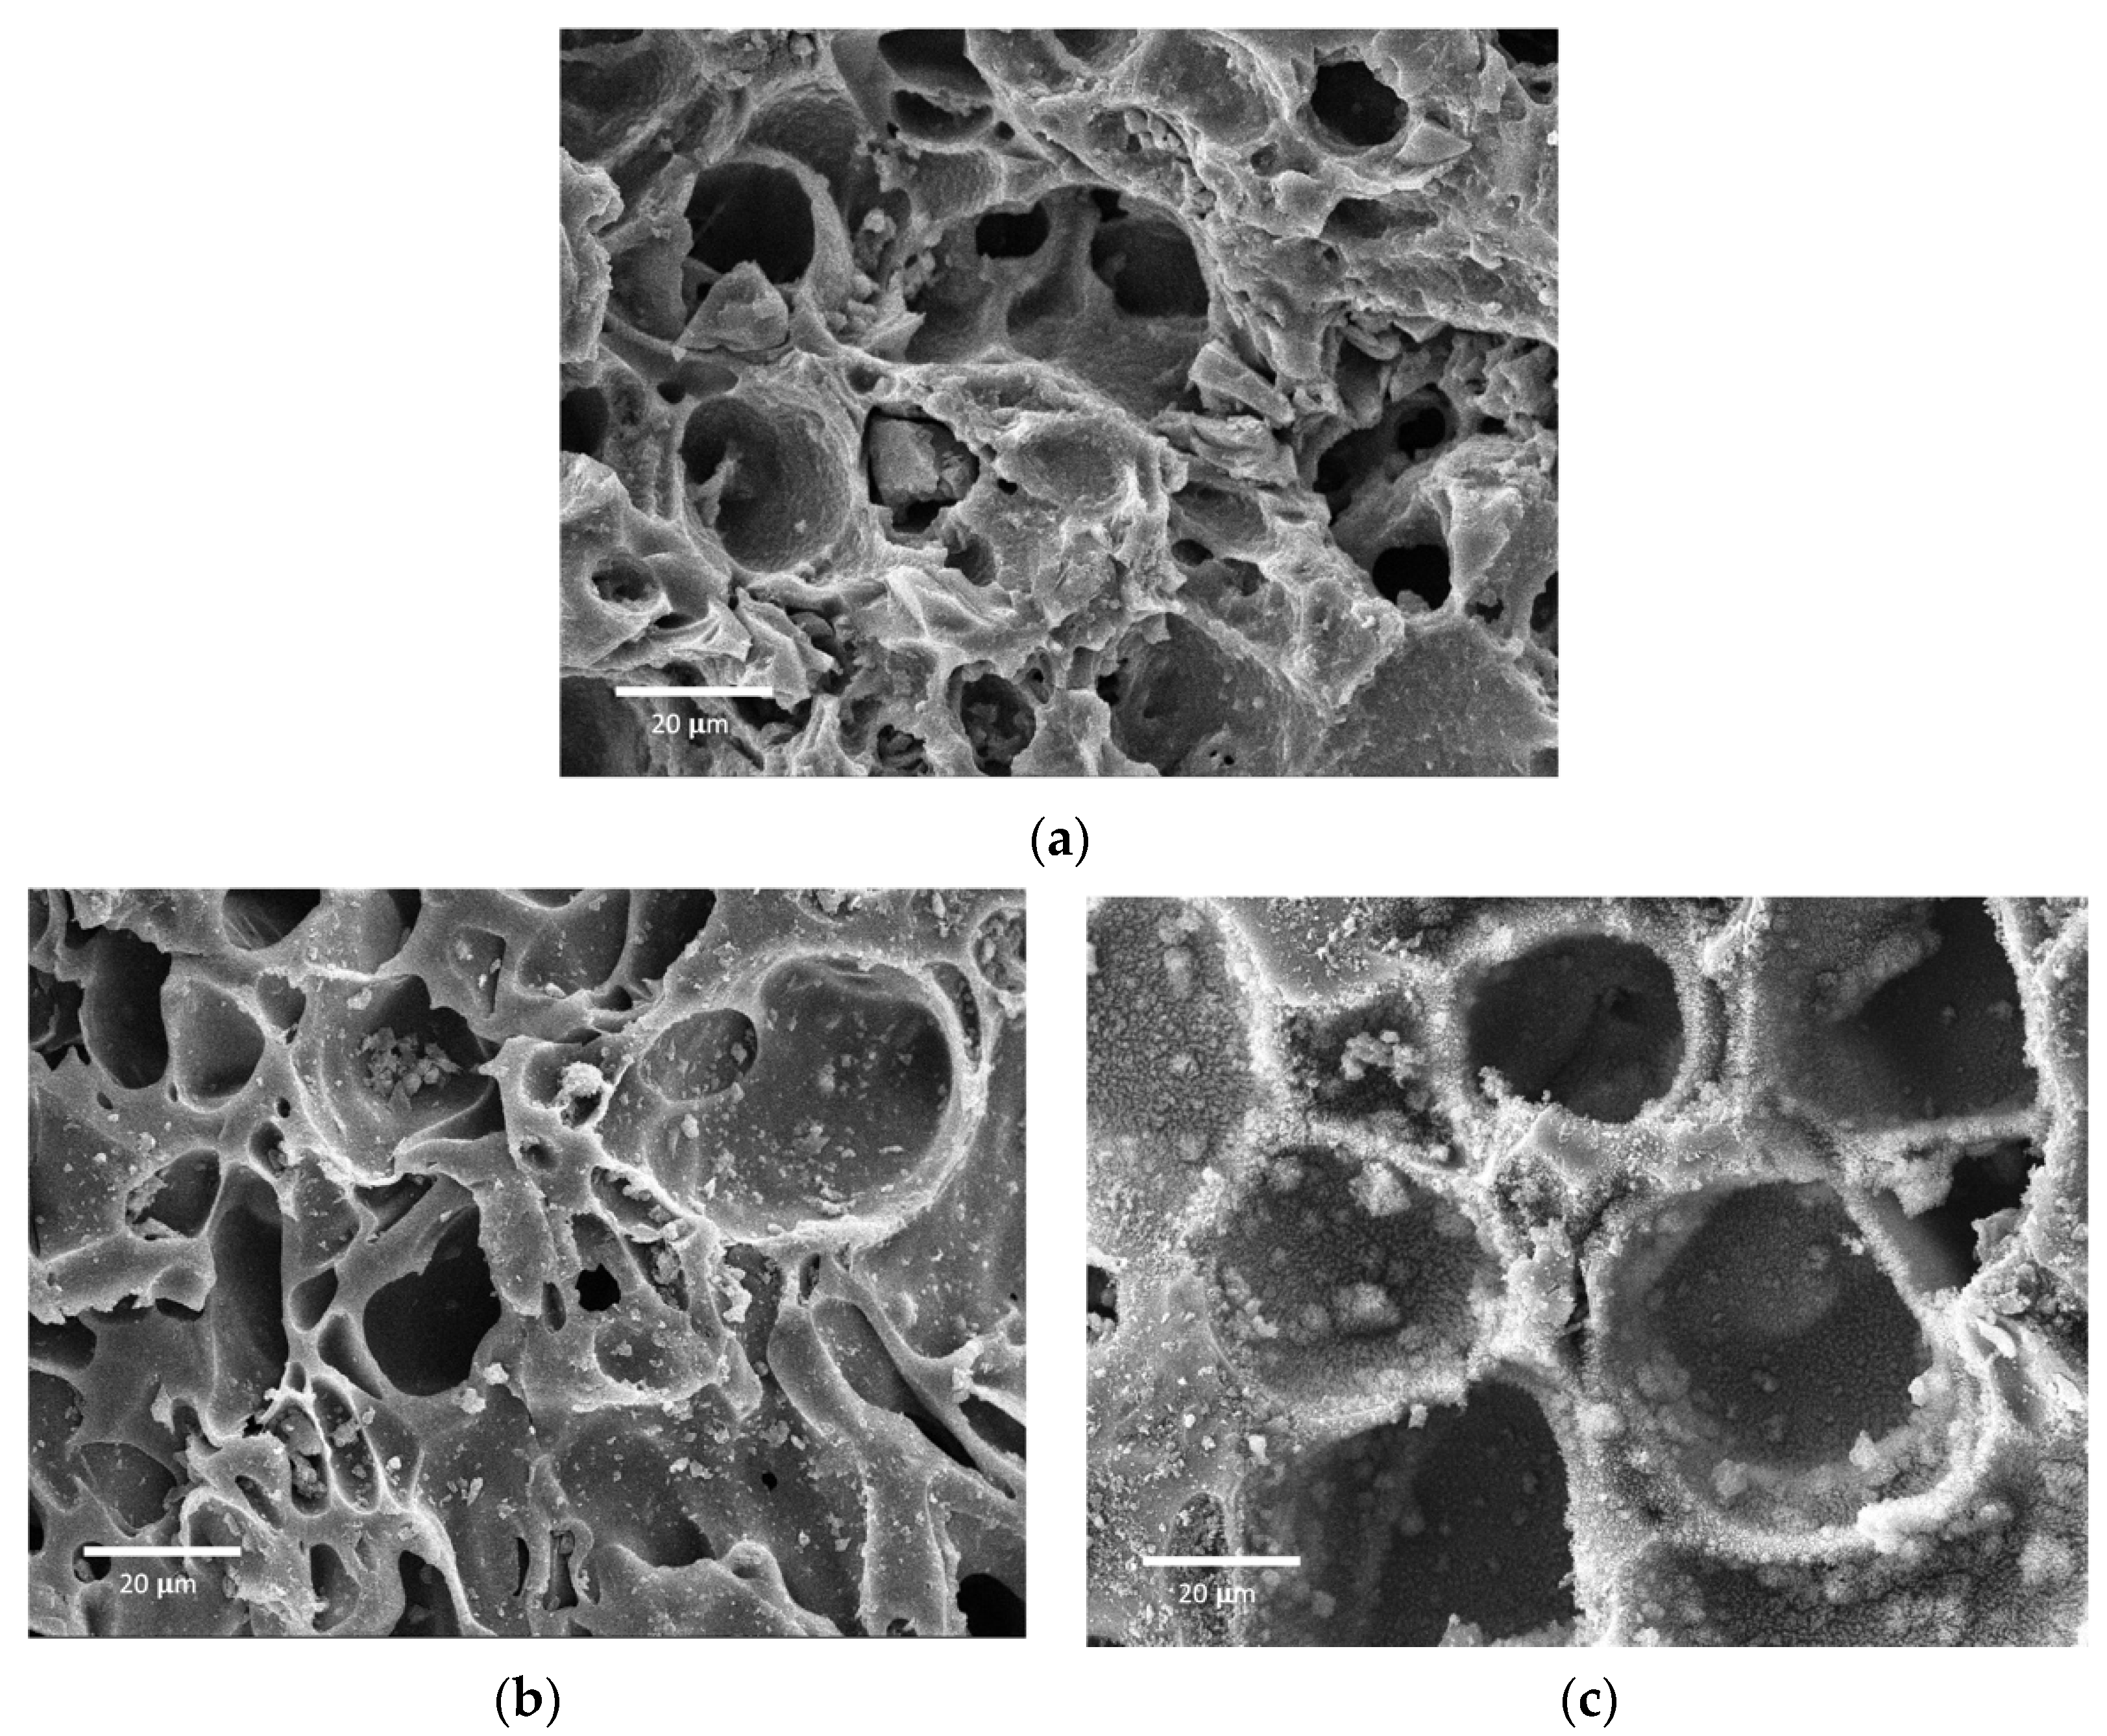
3.4. Characterization Results for the NOM and PFOA Adsorption on the Plasma-Treated GAC

The variations in peaks observed in the plasma-treated GAC before, after 1 h, and after 24 h adsorption in CPRW indicate alterations in the chemical composition of the GAC surface because of PFOA and NOM adsorption, as depicted in Figure 4. Initially, the plasma-treated GAC before adsorption (Figure 4a) exhibited characteristic peaks of OCFGs that were favorable for adsorption, such as band at 1718 cm−1 and 1395 cm−1, that are assigned to C=O and O–H, respectively. Upon the introduction of NOM and PFOA, the FTIR spectra underwent notable changes. This suggests that PFOA and NOM experienced chemical sorption interacting with FGs on the plasma-treated GAC surface [59], possibly through hydrogen bonding, electrostatic interaction, or hydrophobic interaction [60]. After 1 h of adsorption (Figure 4b), one would expect to see a decrease in the intensity of peaks associated with FGs on the GAC. The adsorption process could change the chemical environment of the GAC surface due to chemical bonding, leading to a shift in energy levels and a redistribution of peaks [59]. The peaks of plasma-treated GAC after 1 h spectrum shifted some new wavenumbers at 1360 cm−1, which is assigned to O–H in-plane bending of carbohydrates [61], 611 cm−1 is ascribed to O–H out-of-plane bending [61], and 1576 cm−1 is associated to the –COO– asymmetric stretch of carboxylic acid [61], which are indicators of NOM components being adsorbed, as they represent typical FGs in NOM. Since PFOA is primarily characterized by its C–F bonds in the region of 1290–1010 cm−1 [62], it was found that only one peak was discovered at 1256 cm−1. Indicating that within the first hour, the GAC has a higher affinity for NOM adsorption instead of PFOA. NOM competes for adsorption sites on GAC, potentially in the first hour impeding the rate of PFOA uptake.
However, the FTIR spectrum of GAC after 24 h adsorption (Figure 4c) revealed a decrease in these NOM-associated peaks, concurrent with a relative increase in peaks attributed to C–F stretches, characteristic of PFOA. The band consists of two distinct peaks at 1248 cm−1 and 1145 cm−1, associated with C–F stretching, possibly from the PFOA. When the F/C ratio is low, the peak located at 1145 cm−1 becomes more prominent. The extended duration of adsorption is proportional to the consequent increase in the F/C ratio, causing the peaks in the C–F bond spectra to gradually enhance [63]. Remarkably, the peak absorption intensity at 1248 cm−1 exhibits a larger rate than that observed for the peak at 1145 cm−1 [63]. The peak discovered at 1248 cm–1 is assigned to the C–F bond possessing a higher binding energy (C–F)I, while the peak at 1145 cm–1 is attributed to (C–F)II bonding.
The adsorption mechanism of PFOA onto GAC can occur through direct adsorption and bridging effects facilitated by NOM. PFOA can adsorb directly onto the GAC through the hydrogen bond interaction with the OCFGs [64]. However, NOM can act as a bridge, enhancing the affinity of GAC for PFOA and thereby increasing the ACP at equilibrium. NOM, with its diverse FGs and larger molecular size, can adsorb onto GAC first, creating additional binding sites where PFOA molecules can be electrostatically attracted [65].
Figure 5a illustrates the morphology of plasma-treated GAC before adsorption at a magnification of 1000×. The plasma treatment bombards the surface of GAC resulting in a rough surface, irregular micropores, and mesopores [66]. This is important for the adsorption process, facilitating the penetration and diffusion of both PFOA and NOM into the internal structure of the GAC. Additionally, the pores of the GAC remain clear, without blockage or filling due to contaminants. Meanwhile, after 1 h of adsorption (Figure 5b), it was found that there were small particles dispersed on the plasma-treated GAC surface, which could signify the initial stages of NOM and PFOA loading. However, the surface was not fully covered by these adsorbates, which implies that the adsorption process was not complete. The porosity of the GAC is still noticeable, suggesting that there is still a significant accessible surface area for further adsorption. The adsorbate molecules attach to the pore walls, during the initial phase of adsorption due to the attractive force with the surface FGs created by the plasma treatment [67]. Figure 5c reveals that after a 24 h adsorption, the pores of the plasma-treated GAC appear to be filled with a significant amount of adsorbates coverage, with many of the pores becoming obscured, implying that more PFOA and NOM have filled the pores through hydrophobic interaction. The SEM findings are consistent with that of FTIR spectra.
NOM is composed of various organic compounds, which often contain FGs that can dissociate, and form charged species in water [7]. Therefore, CPRW was prepared in the form of total solid and total suspended solid for FTIR analysis of NOM-TS and NOM-TSS, respectively. This characteristic is evident in the NOM-TS FTIR spectrum (Figure 6a) from CPRW, where the peak at 3292 cm−1 is assigned to the O–H stretching of the hydroxylic group which is common in NOM [68]. The absorbance peak at 2108 cm−1, representing C≡C stretching vibrations (non-polar), suggests the presence of alkyne groups. Alkyne groups could be discovered in a variety of sources, including plants, insects, algae, fungi, and bacteria [68]. The bands at 1642 cm−1 and 718 cm−1, are associated with aromatic C=C and C–H bending, respectively [69]. Similarly, the NOM-TSS spectrum (Figure 6b) with bands at 1420 cm−1 and 1026 cm−1, are related to the O–H bending of carboxylic acid and C–O vibrations of carbohydrate (aliphatic) [61], respectively. The bands at 687 cm−1 and 798 cm−1 are assigned to aromatic O–H out-of-plane bending and C–H bending, respectively [61,69], and further support the presence of various compounds commonly found in NOM.
NOM components might affect the ACP kinetics, which could lead to pore blockage or surface modification [70]. Especially aromatic rings and aliphatic compounds derived from NOM are inherently hydrophobic due to their nonpolar nature [71]. When PFOA is introduced into an environment containing NOM with hydrophobic regions, the nonpolar tails of the PFOA are naturally attracted to the aromatic and aliphatic components of NOM. Consequently, PFOA molecules tend to align themselves with the hydrophobic parts of NOM, leading to the formation of structures like micelles or aggregates [72]. In these mechanisms, the hydrophobic tails are repelled away from the water, while the more hydrophilic parts are exposed to the aqueous environment.
Furthermore, these charged species within NOM can interact with the charged sites on the GAC surface through electrostatic interaction. The oxygen content introduced by the plasma treatment can increase the negative surface charge on the GAC surface [64]. Both of the GAC surface and NOM species that carry negative charges may be more electrostatically repelled by this enhanced negative charge. Resulting in the electrostatic interaction between NOM and GAC becoming less favorable and reducing NOM adsorption onto the GAC surface. Meanwhile, the positively charged (aromatic compounds) of NOM could be attracted to the GAC surface and act as the bridge for the PFOA [65].
On the other hand, PFOA, being an amphiphilic compound, can exhibit multiple types of interactions with the GAC surface. These interactions may encompass hydrophobic interactions, van der Waals forces, and potentially specific chemical interactions like hydrogen bonding [73]. The amphiphilic nature of PFOA, with its hydrophobic perfluorinated carbon chain and hydrophilic carboxylic acid group, allows it to interact favorably with the GAC surface.
While the existence of NOM can compete for adsorption sites on the GAC surface, the amphiphilic nature of PFOA may enable it to overcome the competitive effects of NOM. The hydrophobic portion of PFOA can interact with hydrophobic sites on the surface of GAC, while the carboxylic acid group may form particular interactions with the GAC surface’s FGs.

3.5. Adsorption Kinetics

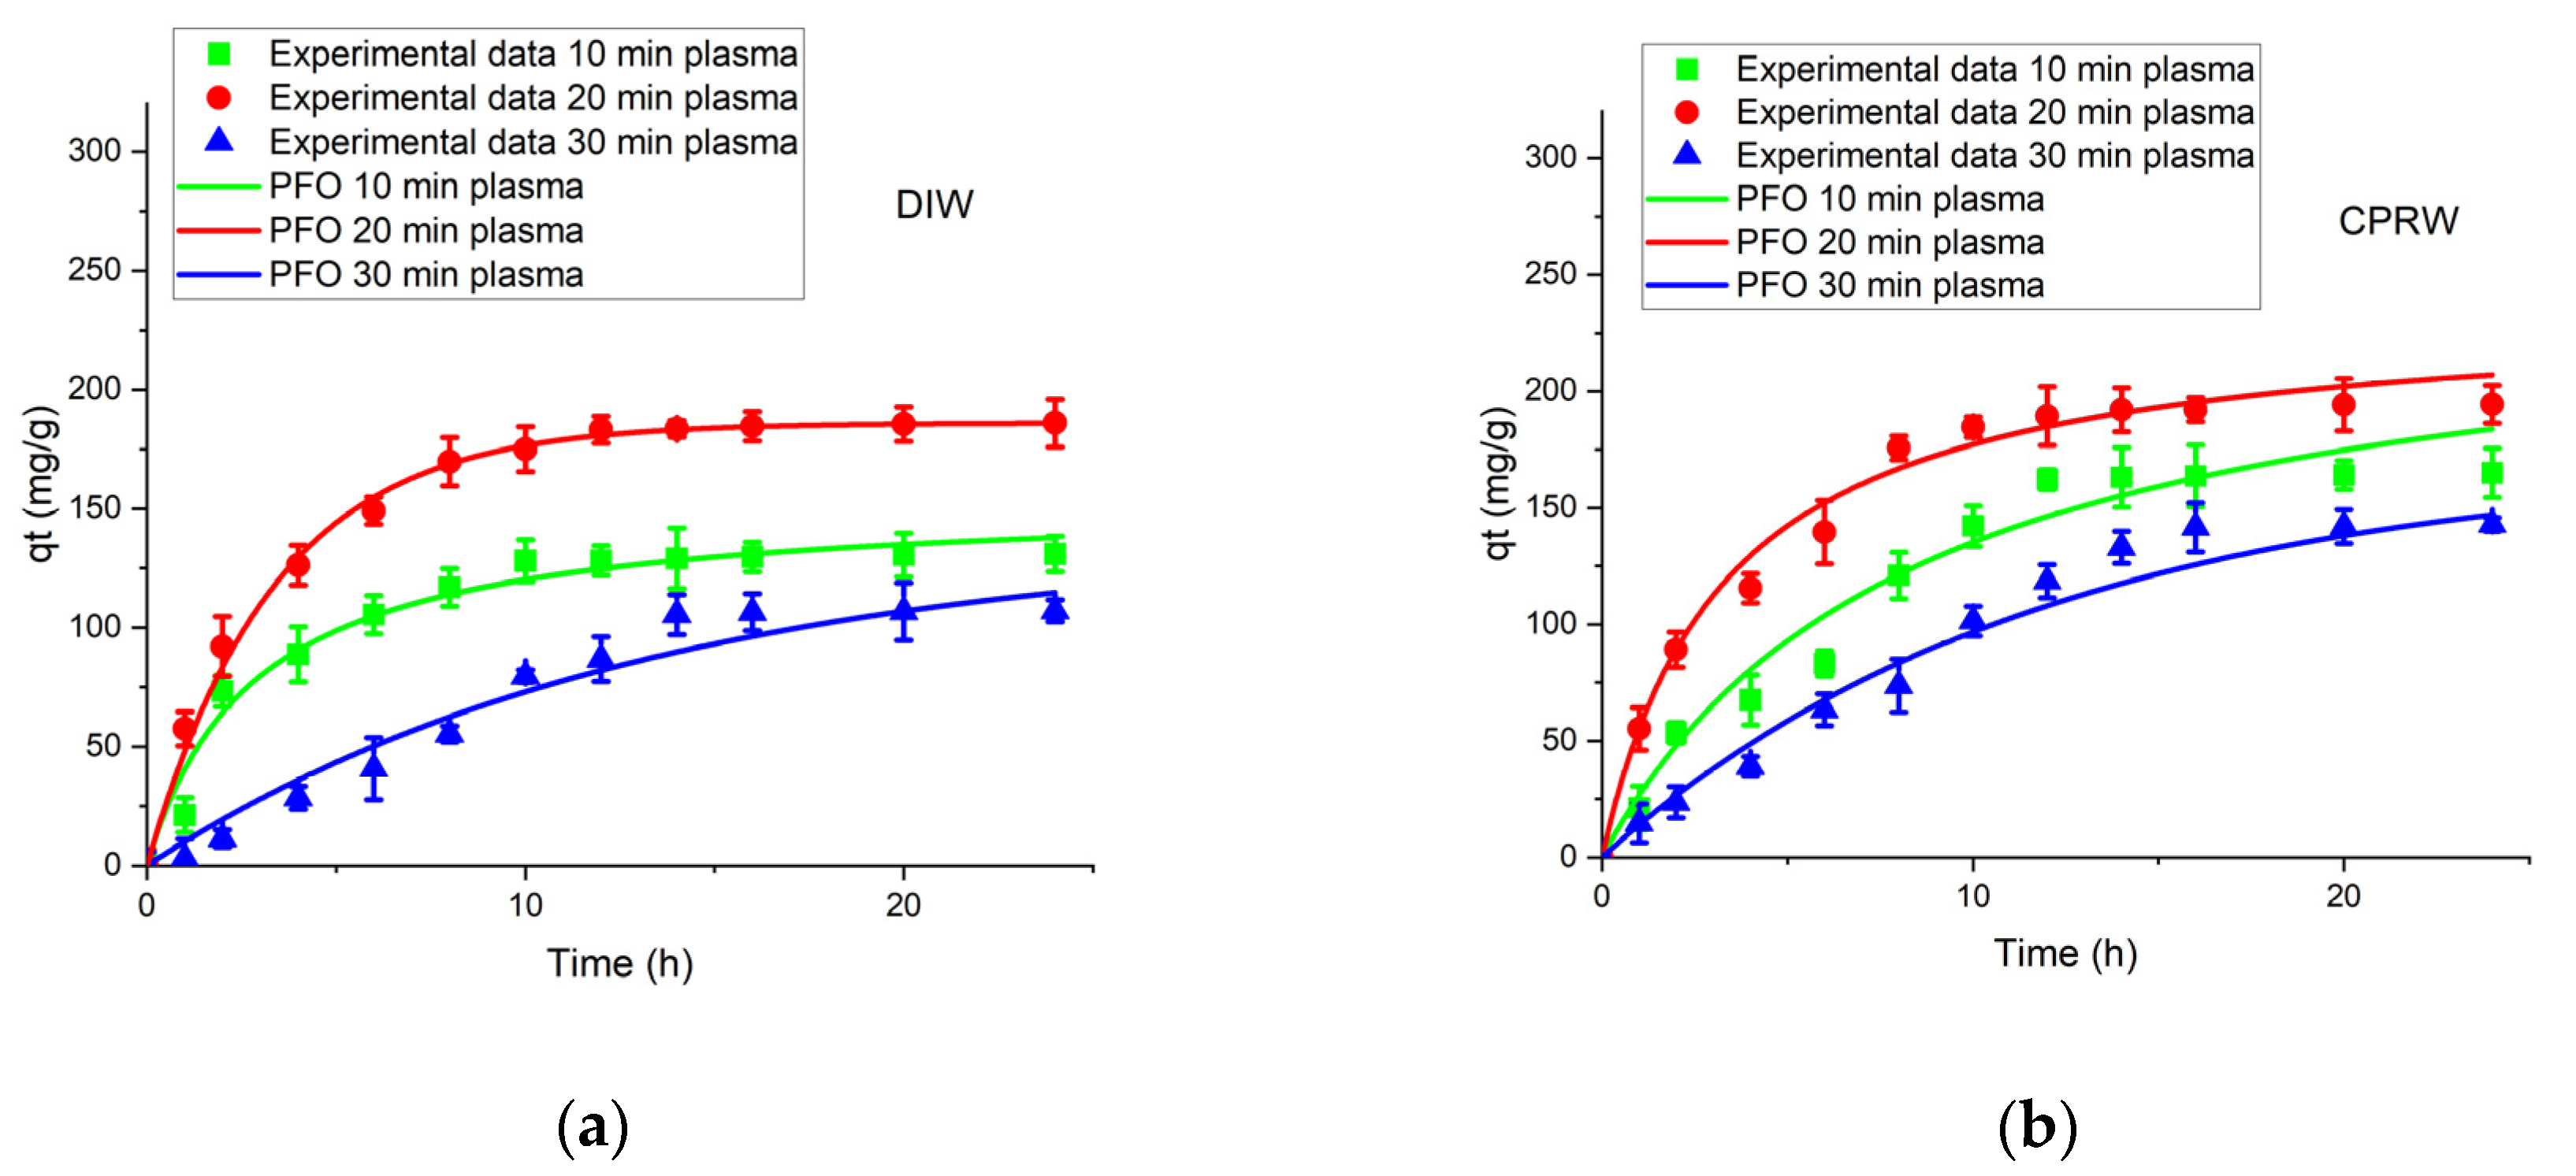
3.5.1. PFOM Adsorption Kinetic

The provided data in Figure 7 and Table 2 represent the findings of the PFOM analysis for the adsorption of PFOA onto plasma-treated GAC at different PTT in both DIW and CPRW. The rate constant (k1) increased with longer treatment times, indicating faster adsorption kinetics while the decrease in ACP indicated a reduction in the cumulative amount of PFOA adsorbed onto the modified GAC surface.
For DIW, the highest qe value is obtained for the 20 min plasma-treated GAC, indicating the optimal treatment duration for maximum ACP. However, k1 in DIW is significantly higher compared to CPRW, indicating faster adsorption kinetics in the absence of NOM. NOM itself contains more FGs, including carboxyl and hydroxyl groups that are capable of providing additional adsorption sites for the target adsorbate [74]. These FGs can form complexation or chemical bonding with PFOA, leading to increased ACP. Therefore, the existence of NOM can have a counter balancing effect on the adsorption process. While it competes for adsorption sites and may slow down the adsorption kinetics, it can also contribute to enhancing the capacity for adsorption by adding more adsorption sites, surface modification, and enhanced interactions with the PFOA [75]. Hydrophobic organic matter in NOM can interact with the hydrophobic tails of PFOA molecules, facilitating PFOA adsorption onto NOM surfaces and providing additional adsorption sites. The experimental data in the DIW scenario is better fitted by the PFOM, as evidenced by the higher R2 values reported in DIW when compared to CPRW.

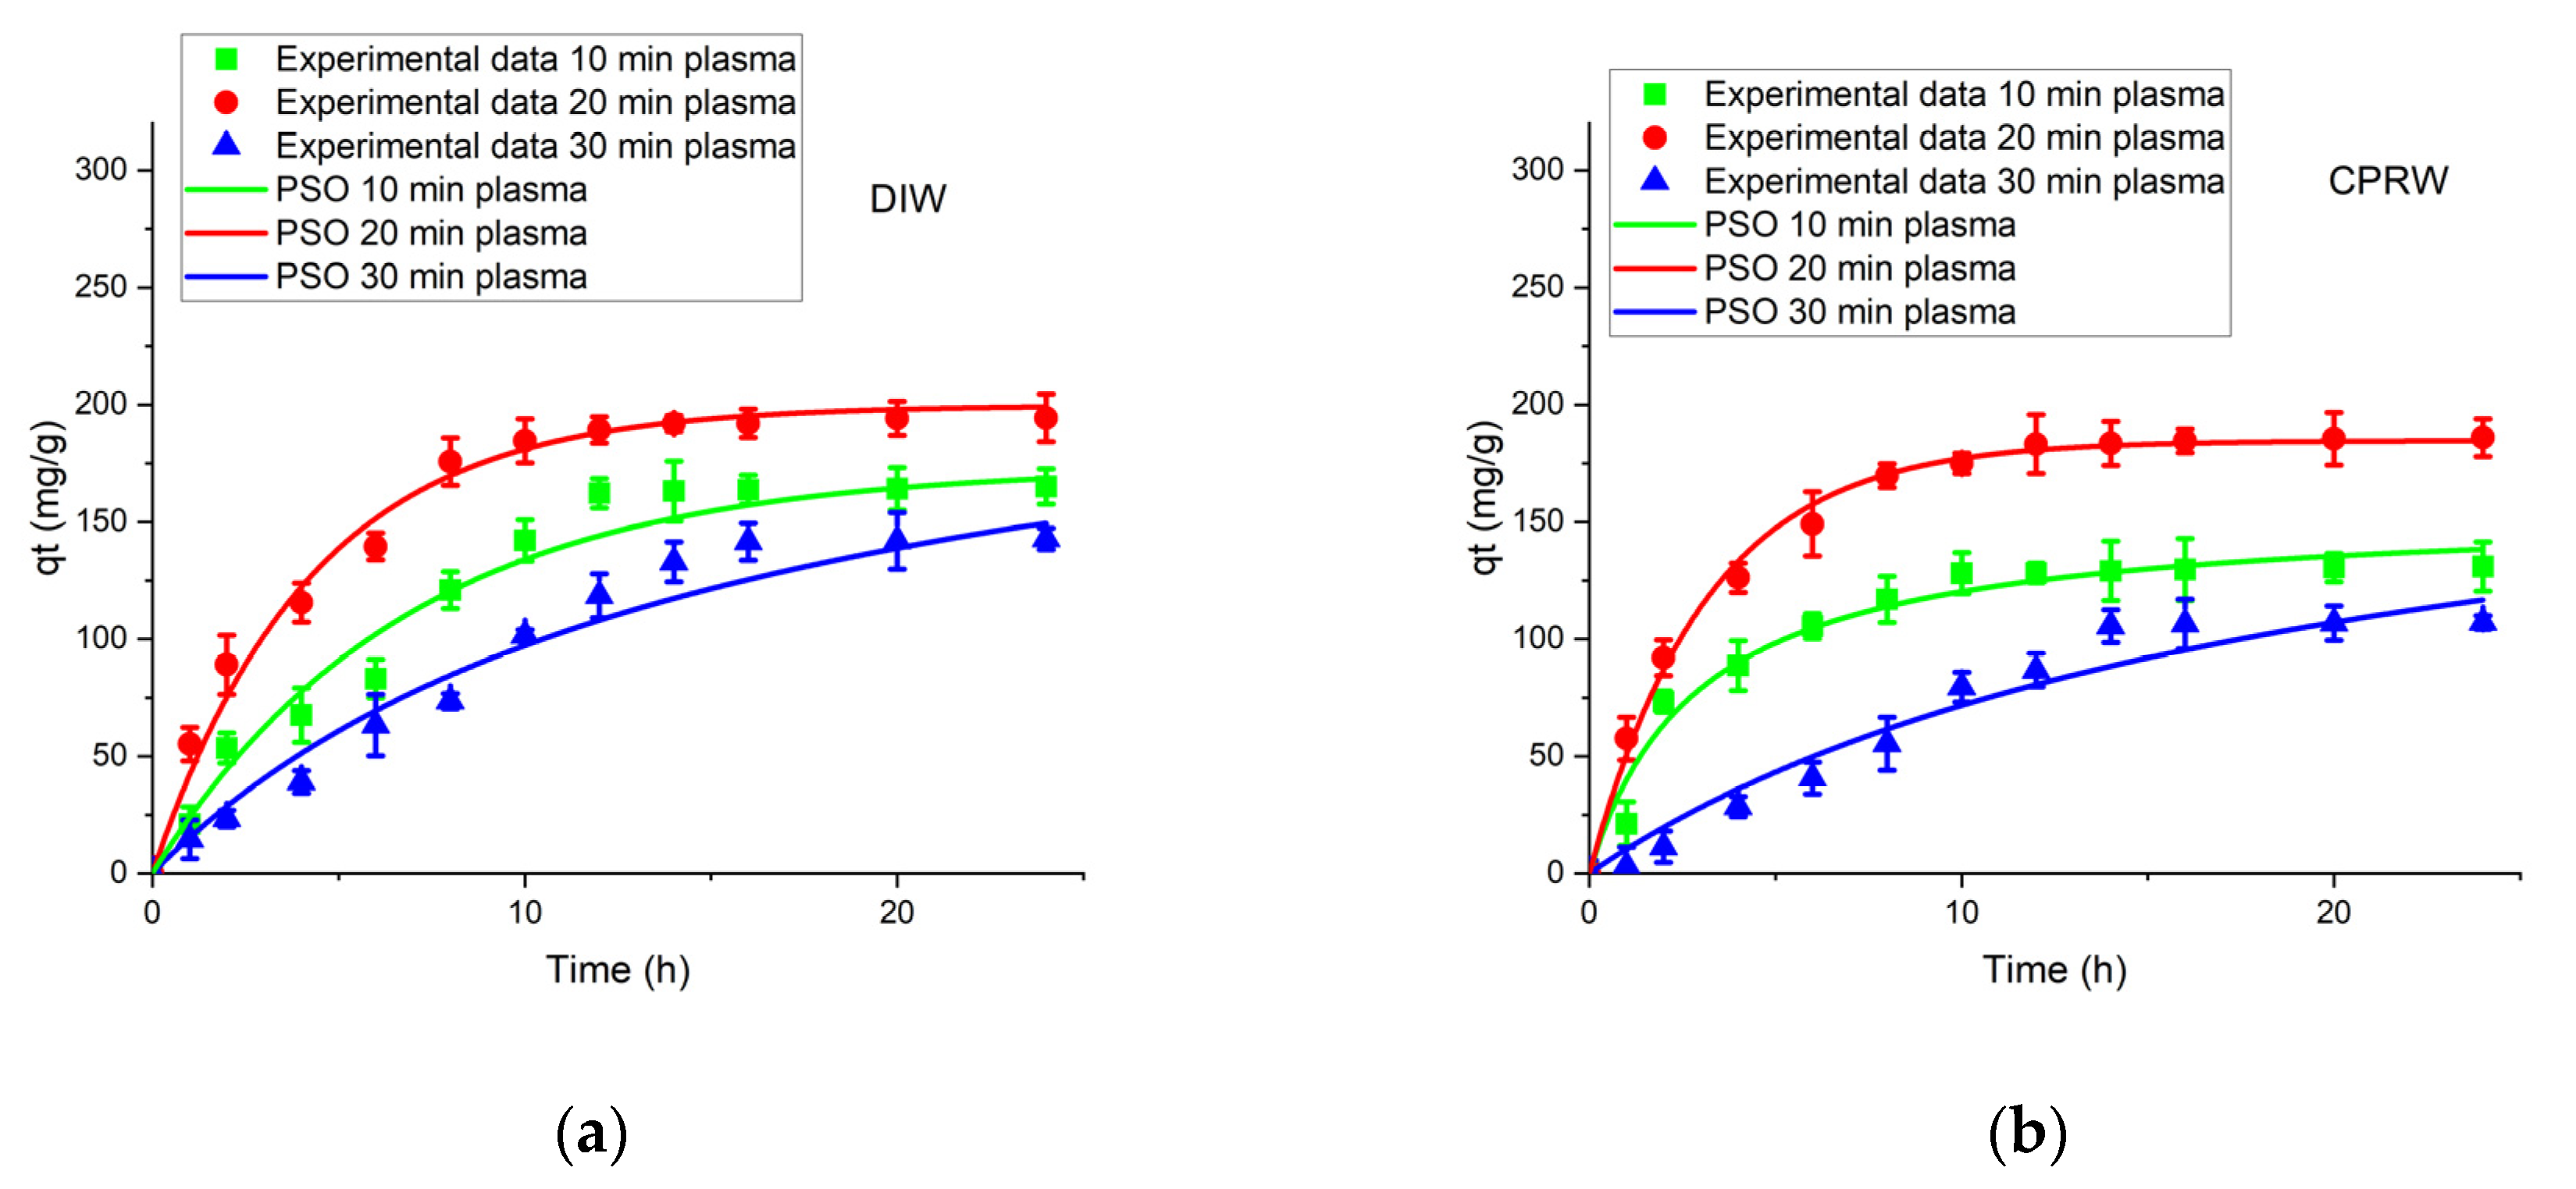
3.5.2. PSOM Adsorption Kinetic

Figure 8 and Table 3 present the data of the PSOM. The qe value for the CPRW case is higher than the DIW case for the same treatment duration, suggesting that the presence of NOM enhances the PFOA ACP. The k2 varies between CPRW and DIW for different treatment times. In the CPRW samples, k2 ranges from 0.078 to 0.311 g/(mg·h), and in DIW samples it ranges from 0.0018 to 0.254 g/(mg·h), indicating relatively fast adsorption kinetics. The k2 value for the 20 min plasma-treated GAC in CPRW and DIW samples is 0.311 and 0.254 g/(mg·min), respectively, indicating a higher rate of chemisorption in DIW for the same plasma treatment duration. The faster chemisorption rate in DIW indicates that the existence of NOM in river water may slightly hinder the adsorption kinetics of PFOA onto the GAC surface.
The R2 values in CPRW vary from 0.962 to 0.995, and the values in DIW range from 0.975 to 0.987, showing that the PSOM fits well with both experimental data. The higher R2 values in CPRW suggest that the presence of NOM enhances the adsorption process. NOM may provide additional adsorption sites or interact with PFOA, leading to increased ACP and improved model fitting. The lower R2 values in DIW suggest that the absence of NOM may result in reduced ACP and less favorable model fitting.

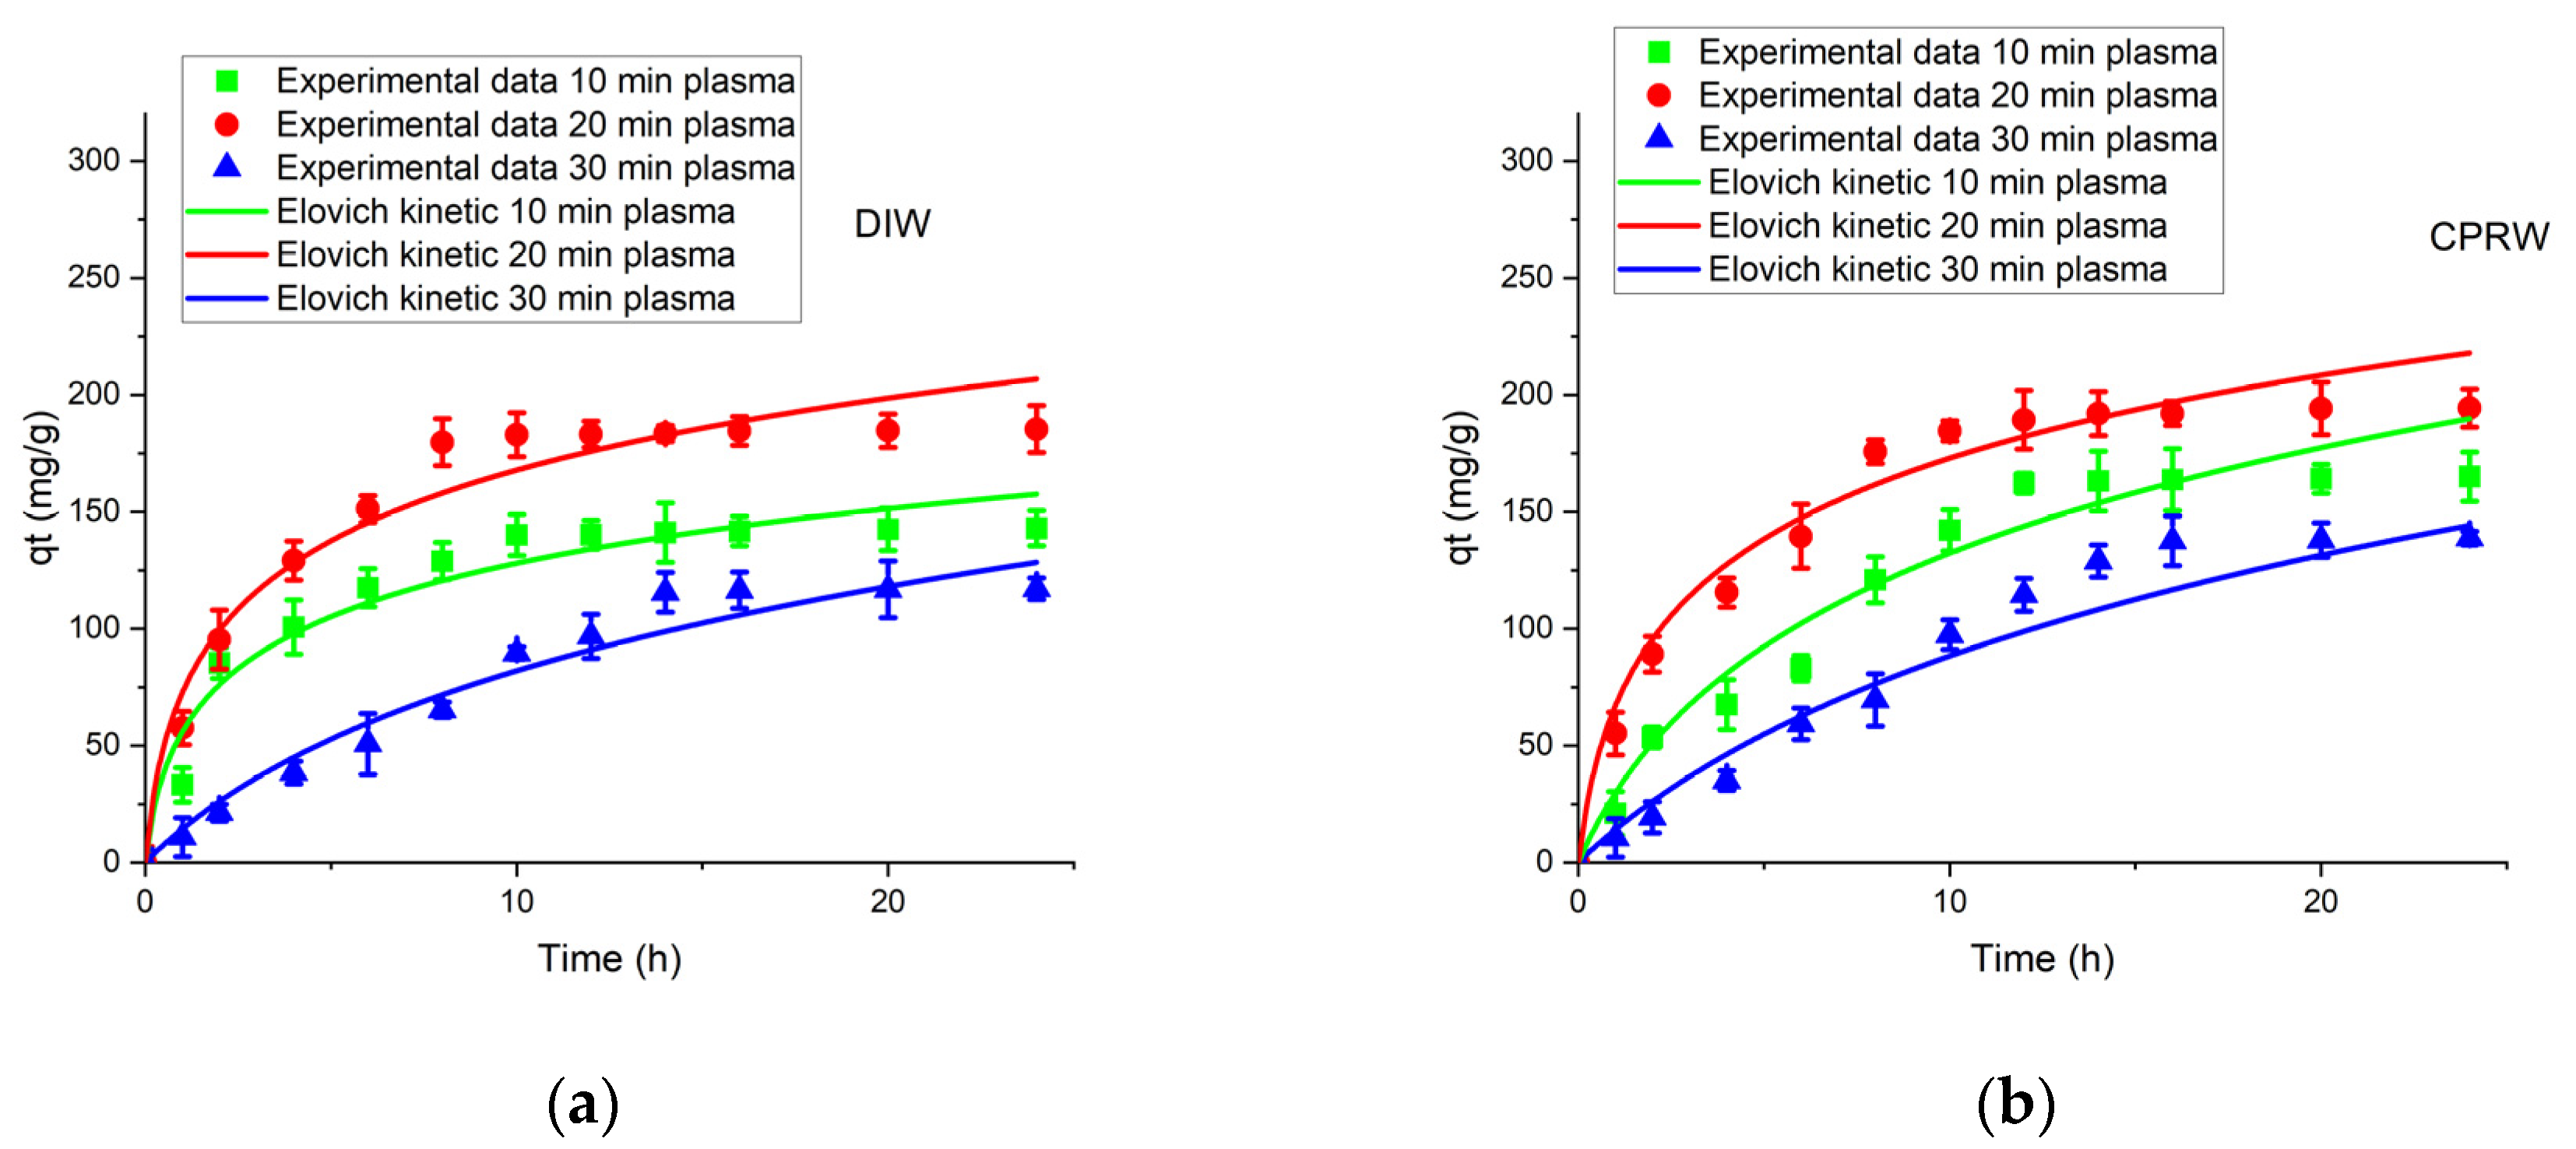
3.5.3. Elovich Kinetic Model (EM)

Figure 9 shows that the 30 min PTT for plasma-treated GAC on both CPRW and DIW provides a better fit to the EM model compared to the 10- and 20-min PTT. The α values for the CPRW case are generally lower than the DIW case as shown in Table 4, indicating a slower initial adsorption rate in CPRW and suggesting that the existence of NOM in river water might influence the initial adsorption kinetics of PFOA onto the plasma-modified GAC. NOM components can interact with the adsorbent surface, potentially creating a barrier effect [75].
The β values in DIW are generally higher compared to CPRW, implying that the extent of surface coverage or the strength of the interaction between PFOA and plasma-modified GAC is greater in DIW than in CPRW. The higher β values in DIW suggest that the adsorption of PFOA onto the plasma-modified GAC is more strongly bound in DIW compared to CPRW. This could be attributed to the absence of interfering substances, such as NOM. PFOA molecules can quickly access and occupy available adsorption sites, leading to a faster initial adsorption rate. However, the overall number of adsorption sites on the adsorbent may be limited. Once these sites are filled, further adsorption of PFOA may be restricted, resulting in a lower overall ACP [65].

3.6. Adsorption Isotherm Models

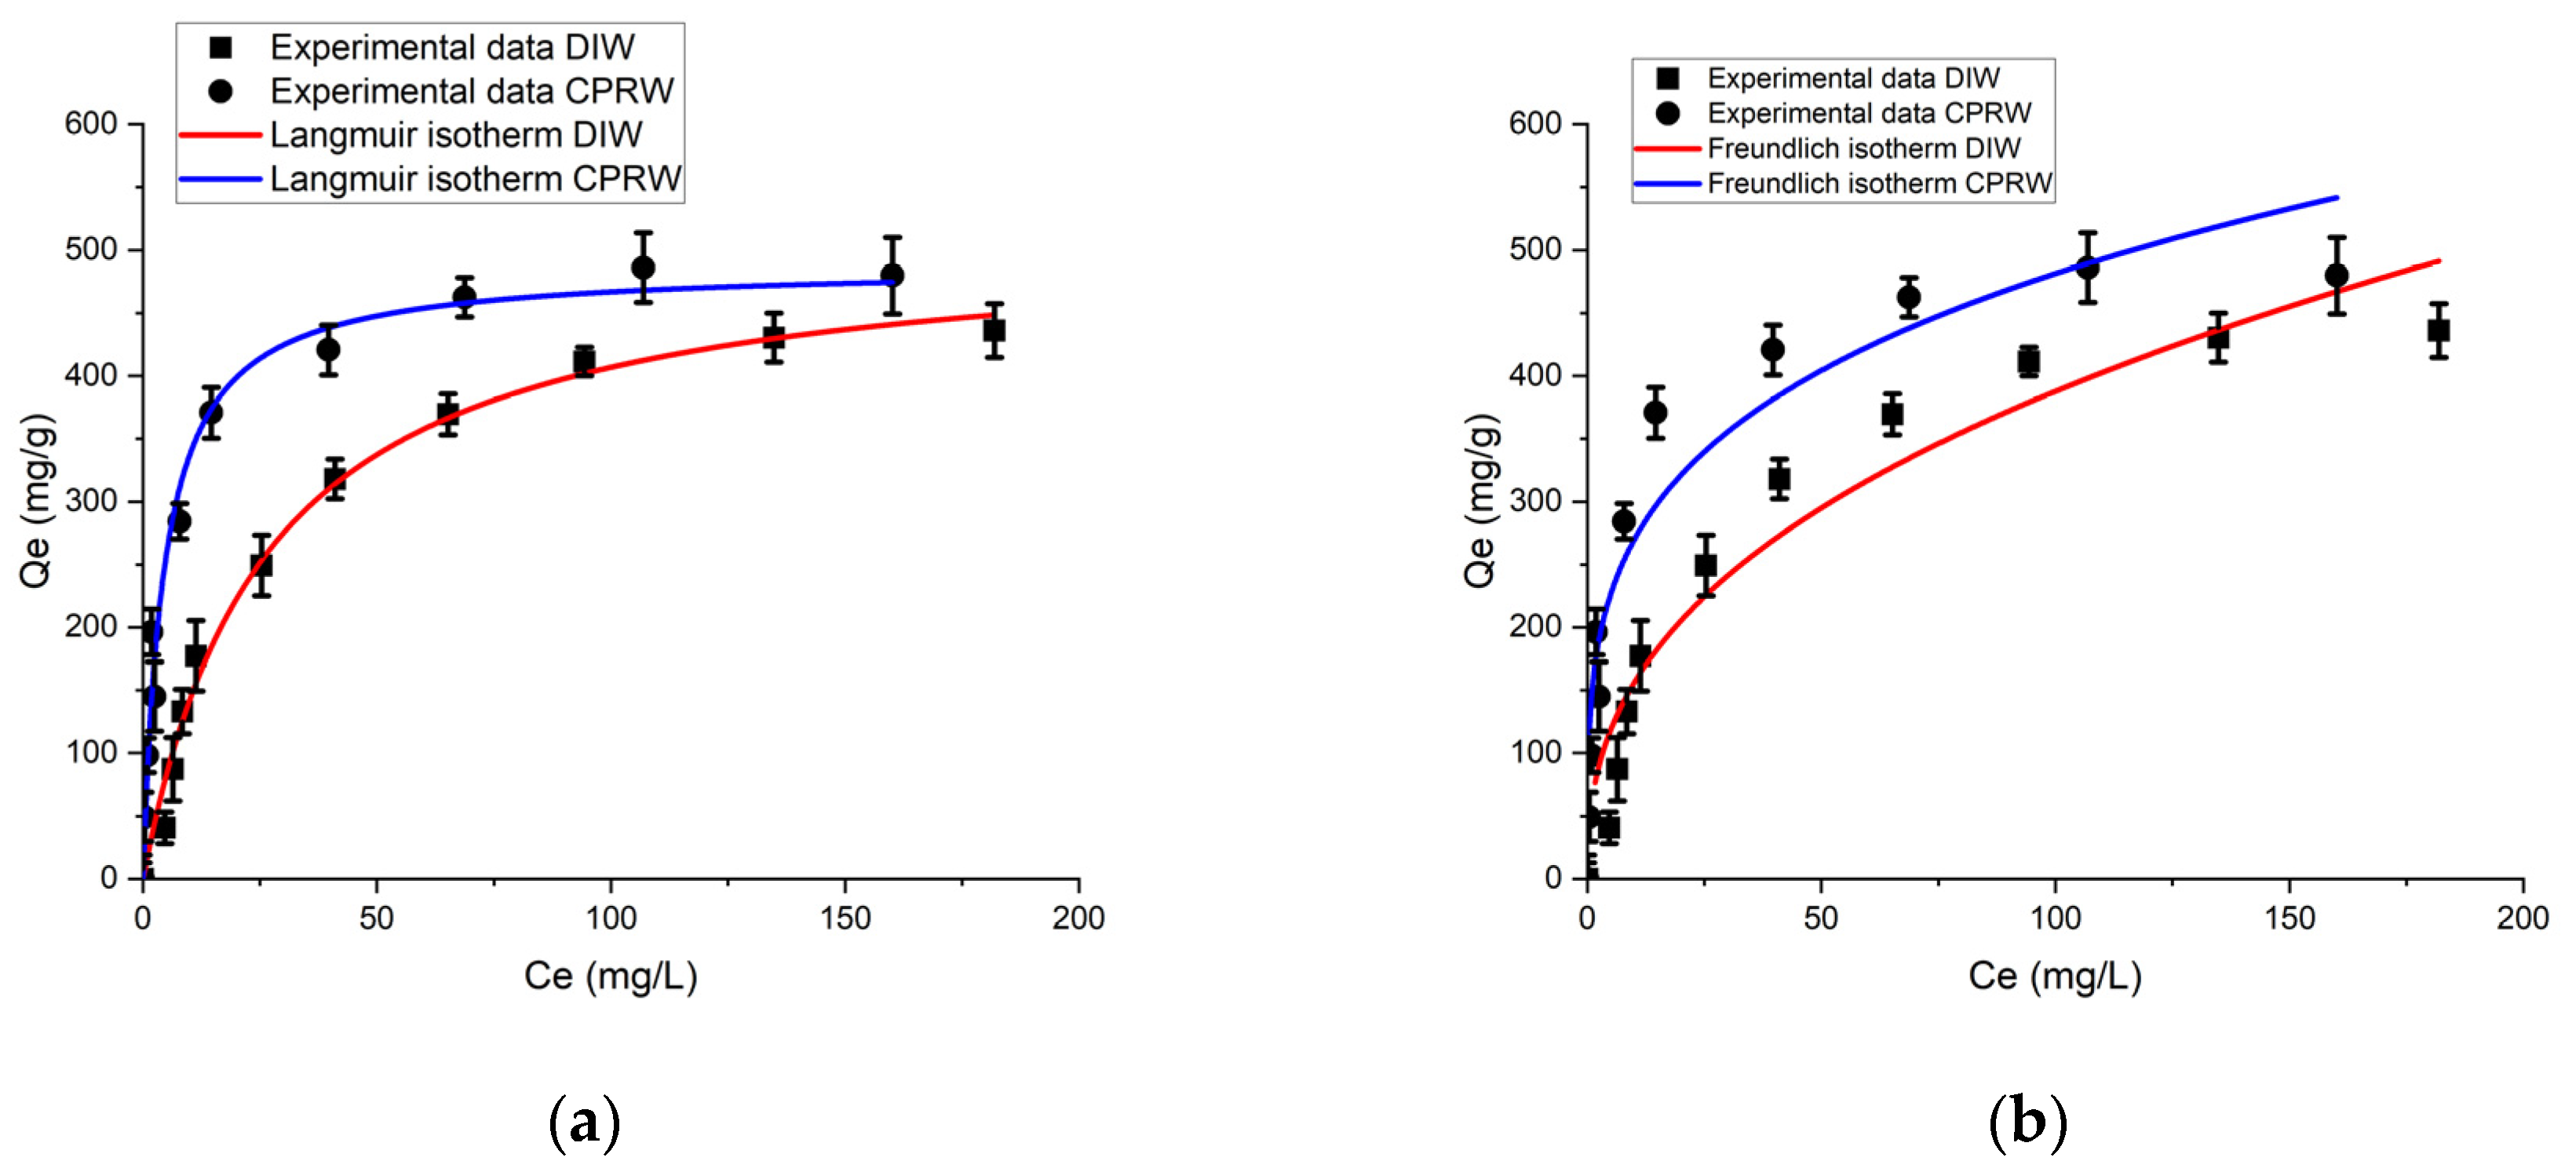
3.6.1. Langmuir Isotherm (LIM) and Freundlich Isotherm (FIM) Analysis

The LIM demonstrated in Figure 10a predicts a slightly higher qm in CPRW (512.49 mg/g) compared to DIW (487.68 mg/g), suggesting that the existence of NOM in CPRW improves the ACP of plasma-treated GAC for PFOA. The R2 value of 0.982 shows that the experimental data in CPRW is well fitting with the LIM, and although it is slightly lower than the R2 value for DIW, it still indicates a reasonable relationship between the predicted and observed values in CPRW. The KL value of 0.038 (L/mg) in DIW is significantly lower than that in CPRW. This implies that the presence of NOM enhances the affinity between PFOA and the GAC surface [76] because of cooperative interactions between PFOA and NOM molecules on the GAC surface.
In this current study, the FIM, as shown in Figure 10b, was found to provide a reasonably effective fit, with an R2 value of 0.813 for DIW and 0.816 for CPRW, indicating a good correlation within the range of 0 < R2 < 1 [77]. However, the LIM provided a better fit to the PFOA adsorption isotherms, based on the higher R2 values (Table 5), indicating that the monolayer adsorption is the primary mechanism. The plasma-treated GAC can adsorb only one layer of PFOA molecules and does not have significant interactions with additional layers. This mechanism is advantageous in reducing the competition between NOM and PFOA for adsorption onto the GAC surface. Based on the LIM, PFOA molecules adsorb at certain homogenous sites on the surface of the adsorbent [78], suggesting that PFOA molecules do not transfer into other regions of the adsorbent. Despite the introduction of additional adsorption sites by NOM on the GAC surface, the LIM remains a good fit due to the equal affinity and energy of these sites [79]. Additionally, the findings indicate that the ACP for the CPRW case is higher than the DIW one. This can be ascribed to the hydrophobic C–F chains of PFOA, which have a greater chance of forming micelles and hemi-micelles on the first layer of GAC molecules in CPRW.

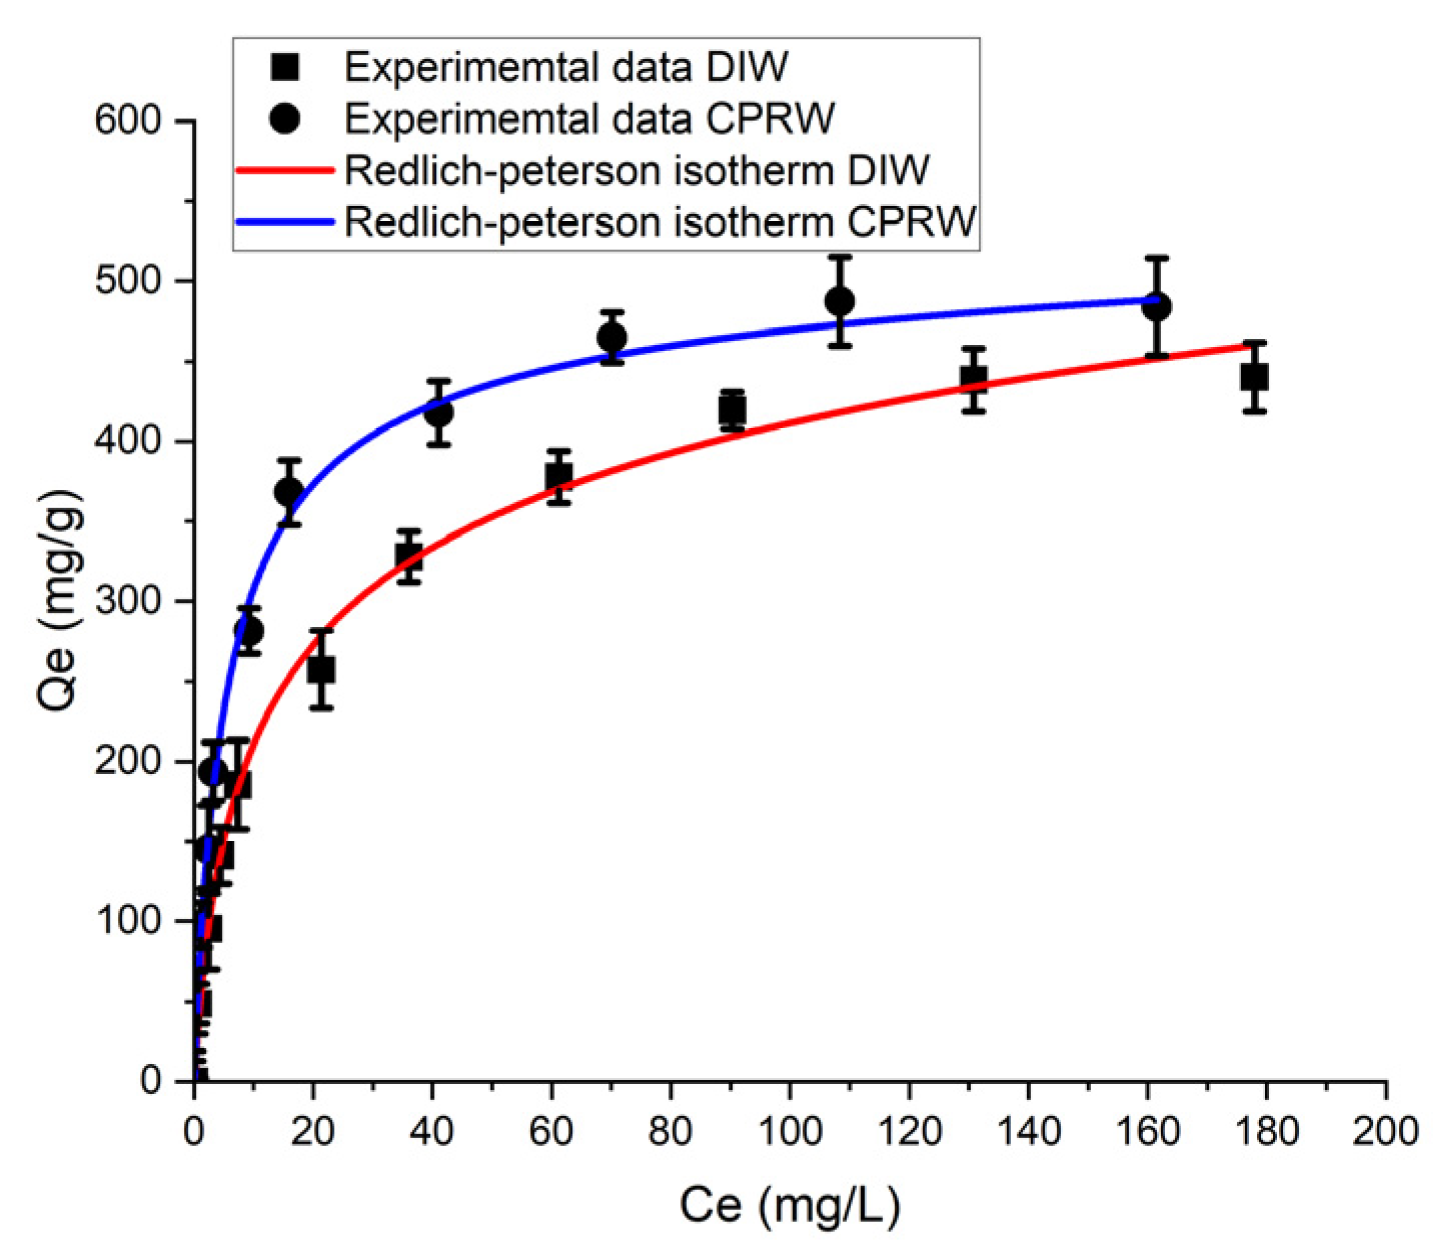
3.6.2. Redlich–Peterson (R–P) Isotherm Model Analysis

Modeling the R–P isotherm (Figure 11) revealed the R–P constants (KRP) of 100.92 for CPRW and 65.91 for DIW, as presented in Table 6, which are related to the ACP of PFOA onto the plasma-treated GAC. This implies that CPRW has a greater maximum PFOA adsorption capability onto GAC than DIW. A higher KRP value indicates a greater availability of adsorption sites or a stronger affinity between PFOA and GAC in the existence of NOM [80].
The difference in KRP values between CPRW and DIW could be ascribed to the existence of NOM. The NOM in CPRW may provide additional adsorption sites or facilitate PFOA adsorption through interactions with GAC. NOM compounds can have diverse FGs that can form complex interactions with PFOA and the GAC surface [74].
The α RP for PFOA adsorption onto GAC is 0.256 for DIW and 0.332 for CPRW. The higher α RP value for CPRW suggests a greater degree of heterogeneity compared to DIW [81]. The existence of NOM in river water can contribute to the increased heterogeneity of the adsorption system [7]. NOM compounds possess diverse FGs, as illustrated in Figure 6, which can interact with both PFOA and the GAC surface, leading to varied adsorption strengths and affinity distributions.
The R2 value for the R–P isotherm is 0.99452 and 0.99418 for CPRW and DIW, respectively. These high R2 values indicate that the R–P isotherms for both CPRW and DIW experimental data were well fitted.

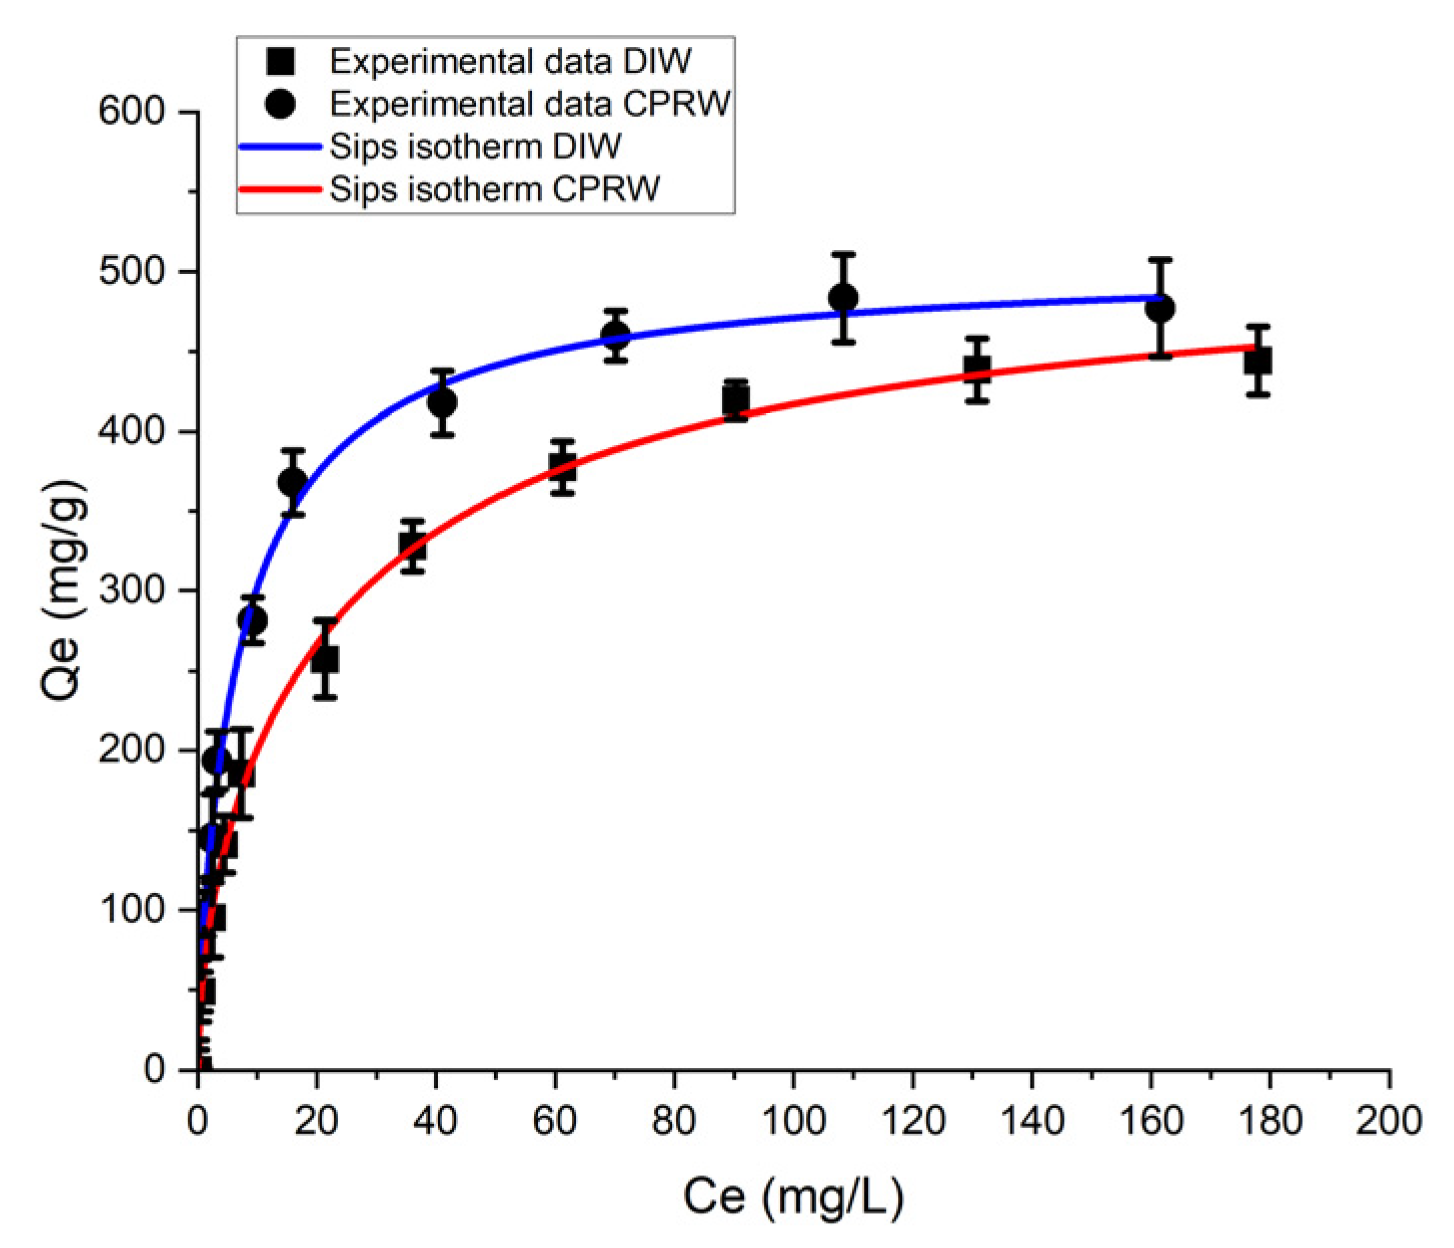
3.6.3. Sips Isotherm Model (SIM) Analysis

The SIM, as shown in Figure 12 is capable of describing both monolayer and multilayer adsorption [82]. qmax of PFOA onto GAC according to the SIM is 520.44 mg/g for CPRW and 506.35 mg/g for DIW (Table 7). These values are relatively high, suggesting that a substantial amount of PFOA can be accommodated on the accessible adsorption sites of the adsorbent, approaching the formation of a monolayer. In monolayer adsorption, the adsorbate molecules (PFOA) fill the available adsorption sites on the adsorbent surface until the surface becomes saturated [83].
The Sips ACP constant (KS) value for CPRW is 0.091, while the KS value for DIW is 0.020. The existence of NOM in CPRW can influence the adsorption behavior by introducing additional FGs and organic compounds. These components can interact with the GAC surface and PFOA, affecting the overall adsorption energy. The higher KS value for CPRW suggests that the existence of NOM increases the adsorption energy, indicating a stronger affinity between PFOA and GAC in the existence of NOM [81]. The composition of the solution, particularly the existence or absence of dissolved organic matter and ions, can affect the adsorption behavior [75].
CPRW typically has a more complex composition compared to DIW as supported by the n value for CPRW of 0.796, while the n value for DIW is 0.431. NOM compounds can introduce a variety of FGs and organic matter, leading to a more heterogeneous adsorption system. The higher n value for CPRW suggests that the adsorption energies are distributed across a wider range on the GAC surface, indicating a more heterogeneous system [84]. In contrast, DIW lacks additional interactions, resulting in a relatively lower degree of heterogeneity (lower n value). The characteristics of the GAC’s surface, including its surface FGs and morphology, can also contribute to the adsorption system heterogeneity [84]. The interaction occurring on the surface of GAC and the PFOA can vary across different regions of the surface, resulting in a more heterogeneous adsorption behavior.

3.7. Thermodynamic Analysis

According to the data presented in Table 8, at a temperature of 298 K, the calculated value of ΔG is −5.42 kJ/mol. At 318 K, ΔG is calculated as −7.29 kJ/mol, still indicating a favorable adsorption process with a higher magnitude compared to 298 K. At 338 K, ΔG is calculated as −8.48 kJ/mol, indicating an even more favorable adsorption process at this higher temperature. More negative ΔG values indicate a thermodynamically favorable process, suggesting that the adsorption occurs spontaneously [85].
ΔH represents the change in enthalpy and provides insights into the heat transfer while the adsorption process is ongoing [86]. ΔH is calculated as 17.458 kJ/mol, suggesting that the adsorption process is endothermic, meaning heat is absorbed during the process [86]. ΔS is given as 0.08 kJ/mol·K, which suggests a small increase in disorder throughout the process of adsorption [22].

4. Conclusions

A comprehensive investigation of the kinetic, equilibrium, and thermodynamic aspects of PFOA adsorption in the presence of NOM using GAC modified by DBD plasma was presented. FTIR results demonstrated an increase in the intensity of absorption peaks in the PA-activated DBD plasma-treated GAC compared to the untreated sample, indicating the existence of OCFGs on the treated GAC surface. The study found a PTT of 20 min and 100 W of PDP to be the optimal condition, resulting in approximately 92 ± 3.21% and 97 ± 0.74% removal efficiency of PFOA in DIW and CPRW, respectively. The existence of NOM in CPRW typically increased the ACP of plasma-treated GAC. The OCFGs on the treated GAC surface led to a decreased NOM loading on the surface, which further enhanced the PFOA adsorption. The findings from the adsorption kinetic models, indicated that the ACP and rate constant varied with plasma treatment time and the existence of NOM. The presence of NOM in CPRW slightly hindered the adsorption kinetics at the initial adsorption but improved the ACP of PFOA by the generation of new adsorption sites. Upon analyzing the R2 values derived from each adsorption kinetic model, the PSOM was shown to have the highest R2 values, indicating the best fit for both DIW and CPRW conditions. In the analysis of adsorption isotherm models, LIM provided a more reasonably good fit compared to the FIM, indicating the monolayer adsorption of PFOA onto the plasma-treated GAC surface is the prevailing mechanism. The R–P isotherm model revealed a higher ACP and greater heterogeneity in the adsorption system in CPRW compared to DIW. The SIM suggested the possibility of monolayer adsorption, with higher ACP in CPRW. However, based on the R2 values derived from the adsorption isotherm models for both DIW and CPRW, the SIM demonstrated the highest R2, which indicates the best-fitted isotherm model. The thermodynamic analysis demonstrated that PFOA was adsorbed spontaneously onto plasma-treated GAC and a thermodynamically favorable process. The presence of negative values of ΔG demonstrated the spontaneity of the adsorption, while the positive value of ΔH indicated an endothermic adsorption process. It should be noted that in order to have an insight on the bonding mechanism of this adsorption process at the atomistic level, the DFT or a similar theoretical approach should be further investigated.

Supplementary Materials

The following supporting information can be downloaded at: https://www.mdpi.com/article/10.3390/w16111499/s1, Figure S1: Map of CPRW sample collection location. Figure S2: Plot of ln(K) vs 1/T for experimental data used to determine thermodynamics parameters.

Author Contributions

Conceptualization, D.W.; Methodology, D.W.; Investigation, T.S. and D.W.; Resources, D.W.; Writing—original draft, T.S. and D.W.; Writing—review & editing, D.W., K.N., W.K., P.H. and S.A.; Supervision, D.W. and S.A.; Funding acquisition, D.W. All authors have read and agreed to the published version of the manuscript.

Funding

This project is funded by the Second Century Fund (C2F) of Chulalongkorn University and the NSRF via the Program Management Unit from the Human Resources & Institutional Development, Research and Innovation (Grant number B05F640085).

Data Availability Statement

The data presented in this study are available on request from the corresponding author. The data are not publicly available due to privacy or ethical restrictions.

Conflicts of Interest

There are no competing interests to declare.

References

  1. Wang, X.; Wang, P.; Liu, X.; Hu, L.; Wang, Q.; Xu, P.; Zhang, G. Enhanced degradation of PFOA in water by dielectric barrier discharge plasma in a coaxial cylindrical structure with the assistance of peroxymonosulfate. Chem. Eng. J. 2020, 389, 124381. [Google Scholar] [CrossRef]
  2. Yang, K.-H.; Lin, Y.-C.; Fang, M.-D.; Wu, C.-H.; Panchangam, S.C.; Hong, P.-K.A.; Lin, C.-F. Sorption of Perfluorooctanoic Acid (PFOA) onto Sediment in the Presence of Dissolved Natural Organics. Sep. Sci. Technol. 2013, 48, 1473–1478. [Google Scholar] [CrossRef]
  3. Vierke, L.; Staude, C.; Biegel-Engler, A.; Drost, W.; Schulte, C. Perfluorooctanoic acid (PFOA)—Main concerns and regulatory developments in Europe from an environmental point of view. Environ. Sci. Eur. 2012, 24, 16. [Google Scholar] [CrossRef]
  4. Fagbayigbo, B.O.; Opeolu, B.O.; Fatoki, O.S.; Akenga, T.A.; Olatunji, O.S. Removal of PFOA and PFOS from aqueous solutions using activated carbon produced from Vitis vinifera leaf litter. Environ. Sci. Pollut. Res. Int. 2017, 24, 13107–13120. [Google Scholar] [CrossRef] [PubMed]
  5. Kannan, K.; Corsolini, S.; Falandysz, J.; Fillmann, G.; Kumar, K.S.; Loganathan, B.G.; Mohd, M.A.; Olivero, J.; Van Wouwe, N.; Yang, J.H.; et al. Perfluorooctanesulfonate and related fluorochemicals in human blood from several countries. Environ. Sci. Technol. 2004, 38, 4489–4495. [Google Scholar] [CrossRef] [PubMed]
  6. Ahn, S.K.; Park, K.Y.; Song, W.J.; Park, Y.M.; Kweon, J.H. Adsorption mechanisms on perfluorooctanoic acid by FeCl(3) modified granular activated carbon in aqueous solutions. Chemosphere 2022, 303 Pt 2, 134965. [Google Scholar] [CrossRef]
  7. Levchuk, I.; Rueda Marquez, J.J.; Sillanpaa, M. Removal of natural organic matter (NOM) from water by ion exchange—A review. Chemosphere 2018, 192, 90–104. [Google Scholar] [CrossRef] [PubMed]
  8. Liu, W.-X.; He, W.; Wu, J.-Y.; Wu, W.-J.; Xu, F.-L. Effects of fluorescent dissolved organic matters (FDOMs) on perfluoroalkyl acids (PFAAs) in lake and river water. Sci. Total Environ. 2019, 666, 598–607. [Google Scholar] [CrossRef] [PubMed]
  9. Shimizu, Y.; Ateia, M.; Yoshimura, C. Natural organic matter undergoes different molecular sieving by adsorption on activated carbon and carbon nanotubes. Chemosphere 2018, 203, 345–352. [Google Scholar] [CrossRef] [PubMed]
  10. Bjelopavlic, M.; Newcombe, G.; Hayes, R. Adsorption of NOM onto Activated Carbon: Effect of Surface Charge, Ionic Strength, and Pore Volume Distribution. J. Colloid Interface Sci. 1999, 210, 271–280. [Google Scholar] [CrossRef]
  11. Cheng, W.; Dastgheib, S.A.; Karanfil, T. Adsorption of dissolved natural organic matter by modified activated carbons. Water Res. 2005, 39, 2281–2290. [Google Scholar] [CrossRef] [PubMed]
  12. Dai, Y.; Sun, Q.; Wang, W.; Lu, L.; Liu, M.; Li, J.; Yang, S.; Sun, Y.; Zhang, K.; Xu, J.; et al. Utilizations of agricultural waste as adsorbent for the removal of contaminants: A review. Chemosphere 2018, 211, 235–253. [Google Scholar] [CrossRef] [PubMed]
  13. Vidic, R.D.; Suidan, M.T. Role of dissolved oxygen on the adsorptive capacity of activated carbon for synthetic and natural organic matter. Environ. Sci. Technol. 1991, 25, 1612–1618. [Google Scholar] [CrossRef]
  14. Yu, J.; Lv, L.; Lan, P.; Zhang, S.; Pan, B.; Zhang, W. Effect of effluent organic matter on the adsorption of perfluorinated compounds onto activated carbon. J. Hazard. Mater. 2012, 225–226, 99–106. [Google Scholar] [CrossRef] [PubMed]
  15. Villota, S.M.; Lei, H.; Villota, E.; Qian, M.; Lavarias, J.; Taylan, V.; Agulto, I.; Mateo, W.; Valentin, M.; Denson, M. Microwave-Assisted Activation of Waste Cocoa Pod Husk by H3PO4 and KOH—Comparative Insight into Textural Properties and Pore Development. ACS Omega 2019, 4, 7088–7095. [Google Scholar] [CrossRef]
  16. Vanraes, P.; Nikiforov, A.Y.; Leys, C. Electrical Discharge in Water Treatment Technology for Micropollutant Decomposition. In Plasma Science and Technology—Progress in Physical States and Chemical Reactions; IntechOpen: Rijeka, Croatia, 2016. [Google Scholar] [CrossRef]
  17. Takaki, K.; Shimizu, M.; Mukaigawa, S.; Fujiwara, T. Effect of Electrode Shape in Dielectric Barrier Discharge Plasma Reactor for NOx Removal. IEEE Trans. Plasma Sci. 2004, 32, 32–38. [Google Scholar] [CrossRef]
  18. Duan, S.; Liu, X.; Wang, Y.; Meng, Y.; Alsaedi, A.; Hayat, T.; Li, J. Plasma surface modification of materials and their entrapment of water contaminant: A review. Plasma Process. Polym. 2017, 14, 1600218. [Google Scholar] [CrossRef]
  19. Yang, S.; Okada, N.; Nagatsu, M. The highly effective removal of Cs⁺ by low turbidity chitosan-grafted magnetic bentonite. J. Hazard Mater. 2016, 301, 8–16. [Google Scholar] [CrossRef] [PubMed]
  20. Yavuz, Ö.; Saka, C. Surface modification with cold plasma application on kaolin and its effects on the adsorption of methylene blue. Appl. Clay Sci. 2013, 85, 96–102. [Google Scholar] [CrossRef]
  21. Naseh, M.V.; Khodadadi, A.A.; Mortazavi, Y.; Pourfayaz, F.; Alizadeh, O.; Maghrebi, M. Fast and clean functionalization of carbon nanotubes by dielectric barrier discharge plasma in air compared to acid treatment. Carbon 2010, 48, 1369–1379. [Google Scholar] [CrossRef]
  22. Monte Blanco, S.P.D.; Scheufele, F.B.; Módenes, A.N.; Espinoza-Quiñones, F.R.; Marin, P.; Kroumov, A.D.; Borba, C.E. Kinetic, equilibrium and thermodynamic phenomenological modeling of reactive dye adsorption onto polymeric adsorbent. Chem. Eng. J. 2017, 307, 466–475. [Google Scholar] [CrossRef]
  23. Ta, A.T.; Babel, S. Microplastic contamination on the lower Chao Phraya: Abundance, characteristic and interaction with heavy metals. Chemosphere 2020, 257, 127234. [Google Scholar] [CrossRef] [PubMed]
  24. Molle, F. Scales and power in river basin management: The Chao Phraya River in Thailand 1. Geogr. J. 2007, 173, 358–373. [Google Scholar] [CrossRef]
  25. Shih, K.; Wang, F. Adsorption Behavior of Perfluorochemicals (PFCs) on Boehmite: Influence of Solution Chemistry. Procedia Environ. Sci. 2013, 18, 106–113. [Google Scholar] [CrossRef]
  26. Koc, M.; Donten, M.A.; Musijowski, J.; Guo, X.; Fauland, A.; Lankmayr, E.; Trojanowicz, M. Application of gas chromatography to determination of Total Organic Fluorine after defluorination of perfluorooctanoic acid as a model compound. Croat. Chem. Acta 2011, 84, 399–406. [Google Scholar] [CrossRef]
  27. Lagergren, S. About the theory of so-called adsorption of soluble substances. K. Sven. Vetenskapsakademiens Handlingar. 1898, 24, 1–39. [Google Scholar]
  28. Ho, Y.; Wase, D.A.J.; CF Forster, C. Removal of lead ions from aqueous solution using sphagnum moss peat as adsorbent. Water SA 1996, 22, 219–224. [Google Scholar]
  29. El-Khaiary, M.I.; Malash, G.F.; Ho, Y.-S. On the use of linearized pseudo-second-order kinetic equations for modeling adsorption systems. Desalination 2010, 257, 93–101. [Google Scholar] [CrossRef]
  30. Plazinski, W.; Rudzinski, W.; Plazinska, A. Theoretical models of sorption kinetics including a surface reaction mechanism: A review. Adv. Colloid Interface Sci. 2009, 152, 2–13. [Google Scholar] [CrossRef]
  31. Wu, F.-C.; Tseng, R.-L.; Juang, R.-S. Characteristics of Elovich equation used for the analysis of adsorption kinetics in dye-chitosan systems. Chem. Eng. J. 2009, 150, 366–373. [Google Scholar] [CrossRef]
  32. Elovich, S.Y.; Larinov, O. Theory of adsorption from solutions of non electrolytes on solid (I) equation adsorption from solutions and the analysis of its simplest form,(II) verification of the equation of adsorption isotherm from solutions. Izv. Akad. Nauk. SSSR Otd. Khim. Nauk 1962, 2, 209–216. [Google Scholar]
  33. Ho, Y.S. Isotherms for the sorption of lead onto peat: Comparison of linear and non-linear methods. Pol. J. Environ. Stud. 2006, 15, 81–86. [Google Scholar]
  34. Ho, Y.-S. Review of second-order models for adsorption systems. J. Hazard. Mater. 2006, 136, 681–689. [Google Scholar] [CrossRef]
  35. Chien, S.H.; Clayton, W.R. Application of Elovich Equation to the Kinetics of Phosphate Release and Sorption in Soils. Soil Sci. Soc. Am. J. 1980, 44, 265–268. [Google Scholar] [CrossRef]
  36. Largitte, L.; Pasquier, R. A review of the kinetics adsorption models and their application to the adsorption of lead by an activated carbon. Chem. Eng. Res. Des. 2016, 109, 495–504. [Google Scholar] [CrossRef]
  37. Al-Ghouti, M.A.; Da’ana, D.A. Guidelines for the use and interpretation of adsorption isotherm models: A review. J. Hazard. Mater. 2020, 393, 122383. [Google Scholar] [CrossRef]
  38. Freundlich, H. Über die adsorption in lösungen. Z. Für Phys. Chem. 1907, 57, 385–470. [Google Scholar] [CrossRef]
  39. Khayyun, T.S.; Mseer, A.H. Comparison of the experimental results with the Langmuir and Freundlich models for copper removal on limestone adsorbent. Appl. Water Sci. 2019, 9, 170. [Google Scholar] [CrossRef]
  40. Langmuir, I. The constitution and fundamental properties of solids and liquids. Part i. Solids. J. Am. Chem. Soc. 1916, 38, 2221–2295. [Google Scholar] [CrossRef]
  41. Langmuir, I. The adsorption of gases on plane surfaces of glass, mica and platinum. J. Am. Chem. Soc. 1918, 40, 1361–1403. [Google Scholar] [CrossRef]
  42. Weber, T.W.; Chakravorti, R.K. Pore and solid diffusion models for fixed-bed adsorbers. AIChE J. 1974, 20, 228–238. [Google Scholar] [CrossRef]
  43. Latour, R.A. The Langmuir isotherm: A commonly applied but misleading approach for the analysis of protein adsorption behavior. J. Biomed. Mater. Res. Part A 2015, 103, 949–958. [Google Scholar] [CrossRef]
  44. Redlich, O.; Peterson, D.L. A useful adsorption isotherm. J. Phys. Chem. 1959, 63, 1024. [Google Scholar] [CrossRef]
  45. Sips, R. On the Structure of a Catalyst Surface. J. Chem. Phys. 2004, 16, 490–495. [Google Scholar] [CrossRef]
  46. Saadi, R.; Saadi, Z.; Fazaeli, R.; Fard, N.E. Monolayer and multilayer adsorption isotherm models for sorption from aqueous media. Korean J. Chem. Eng. 2015, 32, 787–799. [Google Scholar] [CrossRef]
  47. Huang, H.; Li, R.; Lyu, Z.; Cheng, Y.; Zhao, B.; Jiang, Z.; Zhang, Y.; Xiong, F. Comparative study of methane adsorption of Middle-Upper Ordovician marine shales in the western Ordos Basin, NW China: Insights into impacts of moisture on thermodynamics and kinetics of adsorption. Chem. Eng. J. 2022, 446, 137411. [Google Scholar] [CrossRef]
  48. Saha, P.; Chowdhury, S. Insight into adsorption thermodynamics. Thermodynamics 2011, 16, 349–364. [Google Scholar]
  49. Adane, B.; Siraj, K.; Meka, N. Kinetic, equilibrium and thermodynamic study of 2-chlorophenol adsorption onto Ricinus communis pericarp activated carbon from aqueous solutions. Green Chem. Lett. Rev. 2015, 8, 1–12. [Google Scholar] [CrossRef]
  50. Tian, H.; Li, T.; Zhang, T.; Xiao, X. Characterization of methane adsorption on overmature Lower Silurian–Upper Ordovician shales in Sichuan Basin, southwest China: Experimental results and geological implications. Int. J. Coal Geol. 2016, 156, 36–49. [Google Scholar] [CrossRef]
  51. Lawtae, P.; Tangsathitkulchai, C. The Use of High Surface Area Mesoporous-Activated Carbon from Longan Seed Biomass for Increasing Capacity and Kinetics of Methylene Blue Adsorption from Aqueous Solution. Molecules 2021, 26, 6521. [Google Scholar] [CrossRef]
  52. Guo, X.Y.; Liang, S.; Tian, Q.H. Removal of Heavy Metal Ions from Aqueous Solutions by Adsorption Using Modified Orange Peel as Adsorbent. Adv. Mater. Res. 2011, 236–238, 237–240. [Google Scholar] [CrossRef]
  53. Cichosz, S.; Masek, A. Cellulose Fibers Hydrophobization via a Hybrid Chemical Modification. Polymers 2019, 11, 1174. [Google Scholar] [CrossRef] [PubMed]
  54. Navarro-Pardo, F.; Martínez-Barrera, G.; Martínez-Hernández, A.L.; Castaño, V.M.; Rivera-Armenta, J.L.; Medellín-Rodríguez, F.; Velasco-Santos, C. Effects on the Thermo-Mechanical and Crystallinity Properties of Nylon 6,6 Electrospun Fibres Reinforced with One Dimensional (1D) and Two Dimensional (2D) Carbon. Materials 2013, 6, 3494–3513. [Google Scholar] [CrossRef] [PubMed]
  55. Zhang, C.; Peng, Y.; Ning, K.; Niu, X.; Tan, S.; Su, P. Remediation of perfluoroalkyl substances in landfill leachates by electrocoagulation. CLEAN Soil Air Water 2014, 42, 1740–1743. [Google Scholar] [CrossRef]
  56. Cui, J.; Deng, Y. Hydrated Electron Degradation of PFOA Laden on Ion-Exchange Resins in the Presence of Natural Organic Matter. ACS ES&T Eng. 2022, 3, 86–93. [Google Scholar]
  57. Schütze, A.; Jeong, J.Y.; Babayan, S.E.; Park, J.; Selwyn, G.S.; Hicks, R.F. The atmospheric-pressure plasma jet: A review and comparison to other plasma sources. IEEE Trans. Plasma Sci. 1998, 26, 1685–1694. [Google Scholar] [CrossRef]
  58. Tao, X.; Liu, D.; Song, J.; Ye, Q.; Xu, D. Plasma modification of ZnMgAl-LDHs for adsorption property improvement. J. Taiwan Inst. Chem. Eng. 2017, 74, 281–288. [Google Scholar] [CrossRef]
  59. Sazali, N.; Harun, Z.; Sazali, N. A review on batch and column adsorption of various adsorbent towards the removal of heavy metal. J. Adv. Res. Fluid Mech. Therm. Sci. 2020, 67, 66–88. [Google Scholar]
  60. Kancharla, S.; Alexandridis, P.; Tsianou, M. Sequestration of per-and polyfluoroalkyl substances (PFAS) by adsorption: Surfactant and surface aspects. Curr. Opin. Colloid Interface Sci. 2022, 58, 101571. [Google Scholar] [CrossRef]
  61. Abdulla, H.A.N.; Minor, E.C.; Dias, R.F.; Hatcher, P.G. Changes in the compound classes of dissolved organic matter along an estuarine transect: A study using FTIR and 13C NMR. Geochim. Cosmochim. Acta 2010, 74, 3815–3838. [Google Scholar] [CrossRef]
  62. Socrates, G. Infrared and Raman Characteristic Group Frequencies: Tables and Charts; John Wiley & Sons: Hoboken, NJ, USA, 2004. [Google Scholar]
  63. Wang, X.; Wang, W.; Liu, Y.; Ren, M.; Xiao, H.; Liu, X. Characterization of Conformation and Locations of C–F Bonds in Graphene Derivative by Polarized ATR-FTIR. Anal. Chem. 2016, 88, 3926–3934. [Google Scholar] [CrossRef] [PubMed]
  64. Sahara, T.; Wongsawaeng, D.; Ngaosuwan, K.; Kiatkittipong, W.; Hosemann, P.; Assabumrungrat, S. Highly effective removal of perfluorooctanoic acid (PFOA) in water with DBD-plasma-enhanced rice husks. Sci. Rep. 2023, 13, 13210. [Google Scholar] [CrossRef] [PubMed]
  65. Du, Z.; Deng, S.; Bei, Y.; Huang, Q.; Wang, B.; Huang, J.; Yu, G. Adsorption behavior and mechanism of perfluorinated compounds on various adsorbents—A review. J. Hazard. Mater. 2014, 274, 443–454. [Google Scholar] [CrossRef] [PubMed]
  66. Grythe, K.F.; Hansen, F.K. Surface modification of EPDM rubber by plasma treatment. Langmuir 2006, 22, 6109–6124. [Google Scholar] [CrossRef] [PubMed]
  67. Somashekara, D.; Mulky, L. Sequestration of Contaminants from Wastewater: A Review of Adsorption Processes. ChemBioEng Rev. 2023, 10, 491–509. [Google Scholar] [CrossRef]
  68. Back, D.; Shaffer, B.T.; Loper, J.E.; Philmus, B. Untargeted Identification of Alkyne-Containing Natural Products Using Ruthenium-Catalyzed Azide Alkyne Cycloaddition Reactions Coupled to LC-MS/MS. J. Nat. Prod. 2022, 85, 105–114. [Google Scholar] [CrossRef] [PubMed]
  69. Rao, Y.; Inwati, G.K.; Singh, M. Green synthesis of capped gold nanoparticles and their effect on Gram-positive and Gram-negative bacteria. Future Sci. OA 2017, 3, FSO239. [Google Scholar] [CrossRef] [PubMed]
  70. Pelekani, C.; Snoeyink, V.L. Competitive adsorption in natural water: Role of activated carbon pore size. Water Res. 1999, 33, 1209–1219. [Google Scholar] [CrossRef]
  71. Chen, W.; Duan, L.; Zhu, D. Adsorption of Polar and Nonpolar Organic Chemicals to Carbon Nanotubes. Environ. Sci. Technol. 2007, 41, 8295–8300. [Google Scholar] [CrossRef]
  72. Maibaum, L.; Dinner, A.R.; Chandler, D. Micelle Formation and the Hydrophobic Effect. J. Phys. Chem. B 2004, 108, 6778–6781. [Google Scholar] [CrossRef]
  73. Sunderland, E.M.; Hu, X.C.; Dassuncao, C.; Tokranov, A.K.; Wagner, C.C.; Allen, J.G. A review of the pathways of human exposure to poly- and perfluoroalkyl substances (PFASs) and present understanding of health effects. J. Expo. Sci. Environ. Epidemiol. 2019, 29, 131–147. [Google Scholar] [CrossRef] [PubMed]
  74. Jacangelo, J.G.; DeMarco, J.; Owen, D.M.; Randtke, S.J. Selected processes for removing NOM: An overview. J. Am. Water Work. Assoc. 1995, 87, 64–77. [Google Scholar] [CrossRef]
  75. Bhatnagar, A.; Sillanpää, M. Removal of natural organic matter (NOM) and its constituents from water by adsorption—A review. Chemosphere 2017, 166, 497–510. [Google Scholar] [CrossRef] [PubMed]
  76. Anah, L.; Astrini, N. Isotherm adsorption studies of Ni (II) ion removal from aqueous solutions by modified carboxymethyl cellulose hydrogel. IOP Conf. Ser. Earth Environ. Sci. 2018, 160, 012017. [Google Scholar] [CrossRef]
  77. Edet, U.A.; Ifelebuegu, A.O. Kinetics, Isotherms, and Thermodynamic Modeling of the Adsorption of Phosphates from Model Wastewater Using Recycled Brick Waste. Processes 2020, 8, 665. [Google Scholar] [CrossRef]
  78. Choy, K.K.; Porter, J.F.; McKay, G. Langmuir isotherm models applied to the multicomponent sorption of acid dyes from effluent onto activated carbon. J. Chem. Eng. Data 2000, 45, 575–584. [Google Scholar] [CrossRef]
  79. Li, X.-J.; Yan, C.-J.; Luo, W.-J.; Gao, Q.; Zhou, Q.; Liu, C.; Zhou, S. Exceptional cerium(III) adsorption performance of poly(acrylic acid) brushes-decorated attapulgite with abundant and highly accessible binding sites. Chem. Eng. J. 2016, 284, 333–342. [Google Scholar] [CrossRef]
  80. Wu, F.-C.; Liu, B.-L.; Wu, K.-T.; Tseng, R.-L. A new linear form analysis of Redlich–Peterson isotherm equation for the adsorptions of dyes. Chem. Eng. J. 2010, 162, 21–27. [Google Scholar] [CrossRef]
  81. Girish, C. Various isotherm models for multicomponent adsorption: A review. Int. J. Civ. Eng. Technol. 2017, 8, 80–86. [Google Scholar]
  82. Tzabar, N.; ter Brake, H.J.M. Adsorption isotherms and Sips models of nitrogen, methane, ethane, and propane on commercial activated carbons and polyvinylidene chloride. Adsorption 2016, 22, 901–914. [Google Scholar] [CrossRef]
  83. Song, X.; Zhang, Y.; Yan, C.; Jiang, W.; Chang, C. The Langmuir monolayer adsorption model of organic matter into effective pores in activated carbon. J. Colloid Interface Sci. 2013, 389, 213–219. [Google Scholar] [CrossRef] [PubMed]
  84. Ahmed, M.J.; Dhedan, S.K. Equilibrium isotherms and kinetics modeling of methylene blue adsorption on agricultural wastes-based activated carbons. Fluid Phase Equilibria 2012, 317, 9–14. [Google Scholar] [CrossRef]
  85. Wei, M.; Marrakchi, F.; Yuan, C.; Cheng, X.; Jiang, D.; Zafar, F.F.; Fu, Y.; Wang, S. Adsorption modeling, thermodynamics, and DFT simulation of tetracycline onto mesoporous and high-surface-area NaOH-activated macroalgae carbon. J. Hazard. Mater. 2022, 425, 127887. [Google Scholar] [CrossRef] [PubMed]
  86. Myers, A. Thermodynamics of adsorption in porous materials. AIChE J. 2002, 48, 145–160. [Google Scholar] [CrossRef]
Figure 1. FTIR spectra of GAC: (a) Variations of PTT (100 W PDP) and (b) variations of PDP (20 min PTT).
Water 16 01499 g001
Figure 2. Effect of PTT on PFOA removal efficiency (100 W of PDP) for 24 h adsorption of a 100 mL solution and 100 mg/L PFOA starting concentration.
Water 16 01499 g002
Figure 3. Effect of PDP on PFOA removal effectiveness (20 min of PTT) for 24 h adsorption of a 100 mL solution and 100 mg/L PFOA starting concentration.
Water 16 01499 g003
Figure 4. FTIR spectra of plasma-treated GAC (20 min of PTT and 100 of W PDP): (a) before adsorption, (b) after 1 h adsorption of PFOA in CPRW, and (c) after 24 h adsorption of PFOA in CPRW solution.
Water 16 01499 g004
Figure 5. SEM micrographs of PA-activated plasma-treated GAC (20 min of PTT and 100 W of PDP): (a) before adsorption, (b) after 1 h adsorption of PFOA in CPRW, and (c) after 24 h adsorption of PFOA in CPRW solution.
Water 16 01499 g005
Figure 6. FTIR spectra of CPRW in the form of (a) NOM-TS and (b) NOM-TSS.
Water 16 01499 g006
Figure 7. PFOM fitted to PFOA adsorption data by plasma-treated GAC in (a) DIW and (b) CPRW.
Water 16 01499 g007
Figure 8. PSOM fitted to PFOA adsorption data by plasma-treated GAC in (a) DIW and (b) CPRW.
Water 16 01499 g008
Figure 9. EM fitted to PFOA adsorption data by plasma-treated GAC in (a) DIW and (b) CPRW.
Water 16 01499 g009
Figure 10. Adsorption isotherms of PFOA adsorption for DIW and CPRW were investigated using (a) LIM and (b) FIM.
Water 16 01499 g010
Figure 11. R–P isotherms of PFOA adsorption for DIW and CPRW.
Water 16 01499 g011
Figure 12. SIM of PFOA adsorption for DIW and CPRW.
Water 16 01499 g012
Table 1. The operational settings employed for adsorption experiments.
Operational ConditionAdsorption KineticsAdsorption IsothermThermodynamics
Temperature (°C)252525–65
Contact time (h)0–242424
Stirring speed (rpm)300300300
Adsorbent mass (g)0.050.050.05
Initial PFOA concentration (mg/L)10050–400100
Solution volume (mL)100100100
Table 2. PFOM parameters for PFOA adsorption onto plasma-treated GAC with the variation of PTT.
PTT (min)PFOM Parameter for DIWPFOM Parameter for CPRW
qe (mg/g)k1 (1/h)R2qe (mg/g)k1 (1/h)R2
10131.450.002270.972163.975.02 × 10−40.965
20185.930.29830.982211.560.00130.975
30107.620.54820.952153.480.001970.959
Table 3. PSOM parameters for PFOA adsorption onto plasma-treated GAC with the variation of PTT.
PTT (min)PSOM Parameter for DIWPSOM Parameter for CPRW
qe (mg/g)k2 (g/mg·h)R2qe (mg/g)k2 (g/mg·h)R2
10139.570.00180.975154.680.1370.994
20184.860.2540.987191.430.3110.995
30111.370.0710.977140.590.0780.962
Table 4. EM parameters for PFOA adsorption onto plasma-treated GAC with the variation of PTT.
PTT (min)EM Parameter for DIWEM Parameter for CPRW
α (mg/g·s)β (g/mg)R2α (mg/g·s)β (g/mg)R2
1036.650.02260.90858.16 0.0140.951
20126.0380.0170.90595.910.0190.924
3014.5850.0100.97512.550.00930.968
Table 5. LIM and FIM parameters for PFOA adsorption onto plasma-treated GAC for DIW and CPRW samples.
SolutionLIM ParametersFIM Parameters
qm (mg/g)KL (L/mg)R2KF (L/mg)1/nR2
DIW487.680.038 0.99062.880.3950.813
CPRW512.490.224 0.982151.130.2510.816
Table 6. R–P isotherm model parameters for PFOA adsorption onto plasma-treated GAC for DIW and CPRW samples.
SolutionR–P Model Parameters
KRP (L/mg) α R2
DIW65.910.2560.994
CPRW100.920.3320.995
Table 7. SIM parameters for PFOA adsorption onto plasma-treated GAC for DIW and CPRW samples.
SolutionSips Model Parameter
qmax (mg/g)KSnR2
DIW506.350.0200.4310.996
CPRW520.440.0910.7960.997
Table 8. Values of thermodynamic parameters for PFOA adsorption on plasma-treated GAC.
Temp. (K)ΔG° (kJ/mol)ΔH° (kJ/mol)ΔS° (kJ/mol·K)
298−5.42 ± 2.0717.460.08
318−7.29 ± 1.88
338−8.48 ± 2.68
Disclaimer/Publisher’s Note: The statements, opinions and data contained in all publications are solely those of the individual author(s) and contributor(s) and not of MDPI and/or the editor(s). MDPI and/or the editor(s) disclaim responsibility for any injury to people or property resulting from any ideas, methods, instructions or products referred to in the content.

