
Soil Hydrothermal Dynamics in the Hengduan Mountains of Southeast Tibet and Associated Influencing Factors

Abstract
1. Introduction
2. Data and Methodology
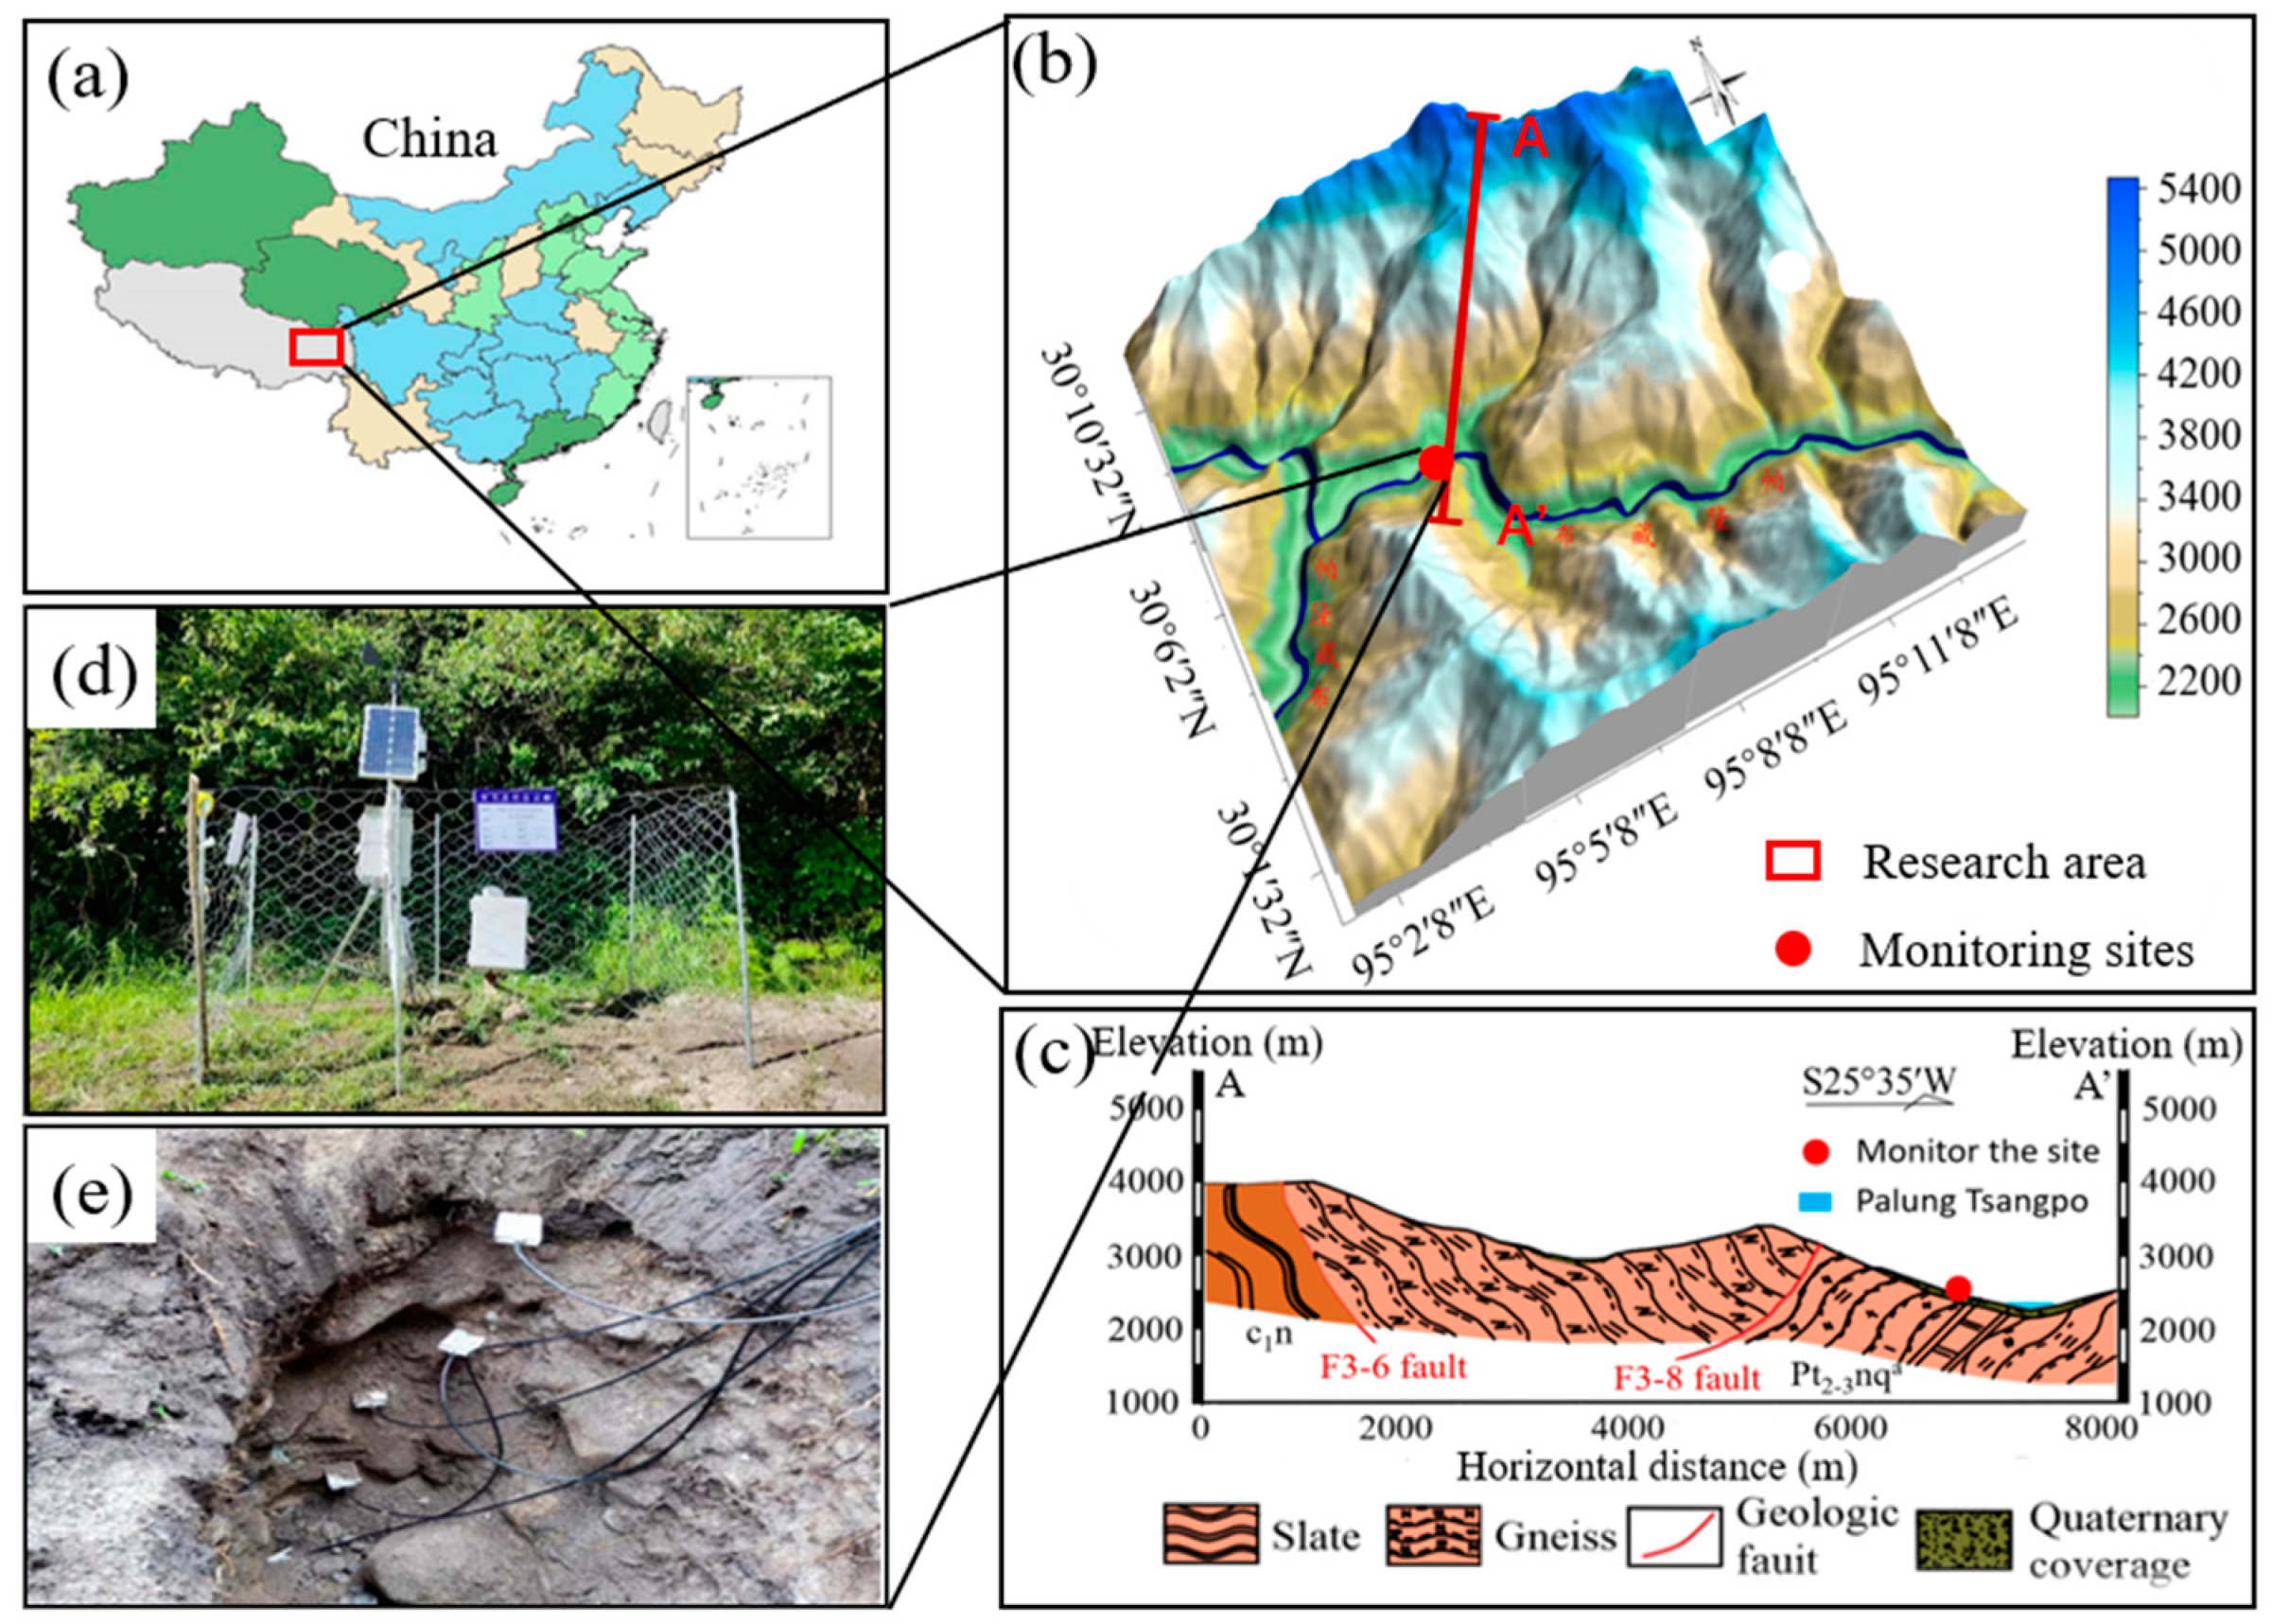
2.1. Overview of the Study Area
2.2. Sites and Data Acquisition
3. Test Results
3.1. Dynamic in Meteorological Factors
3.2. Dynamic of Groundwater, SWC, and TS
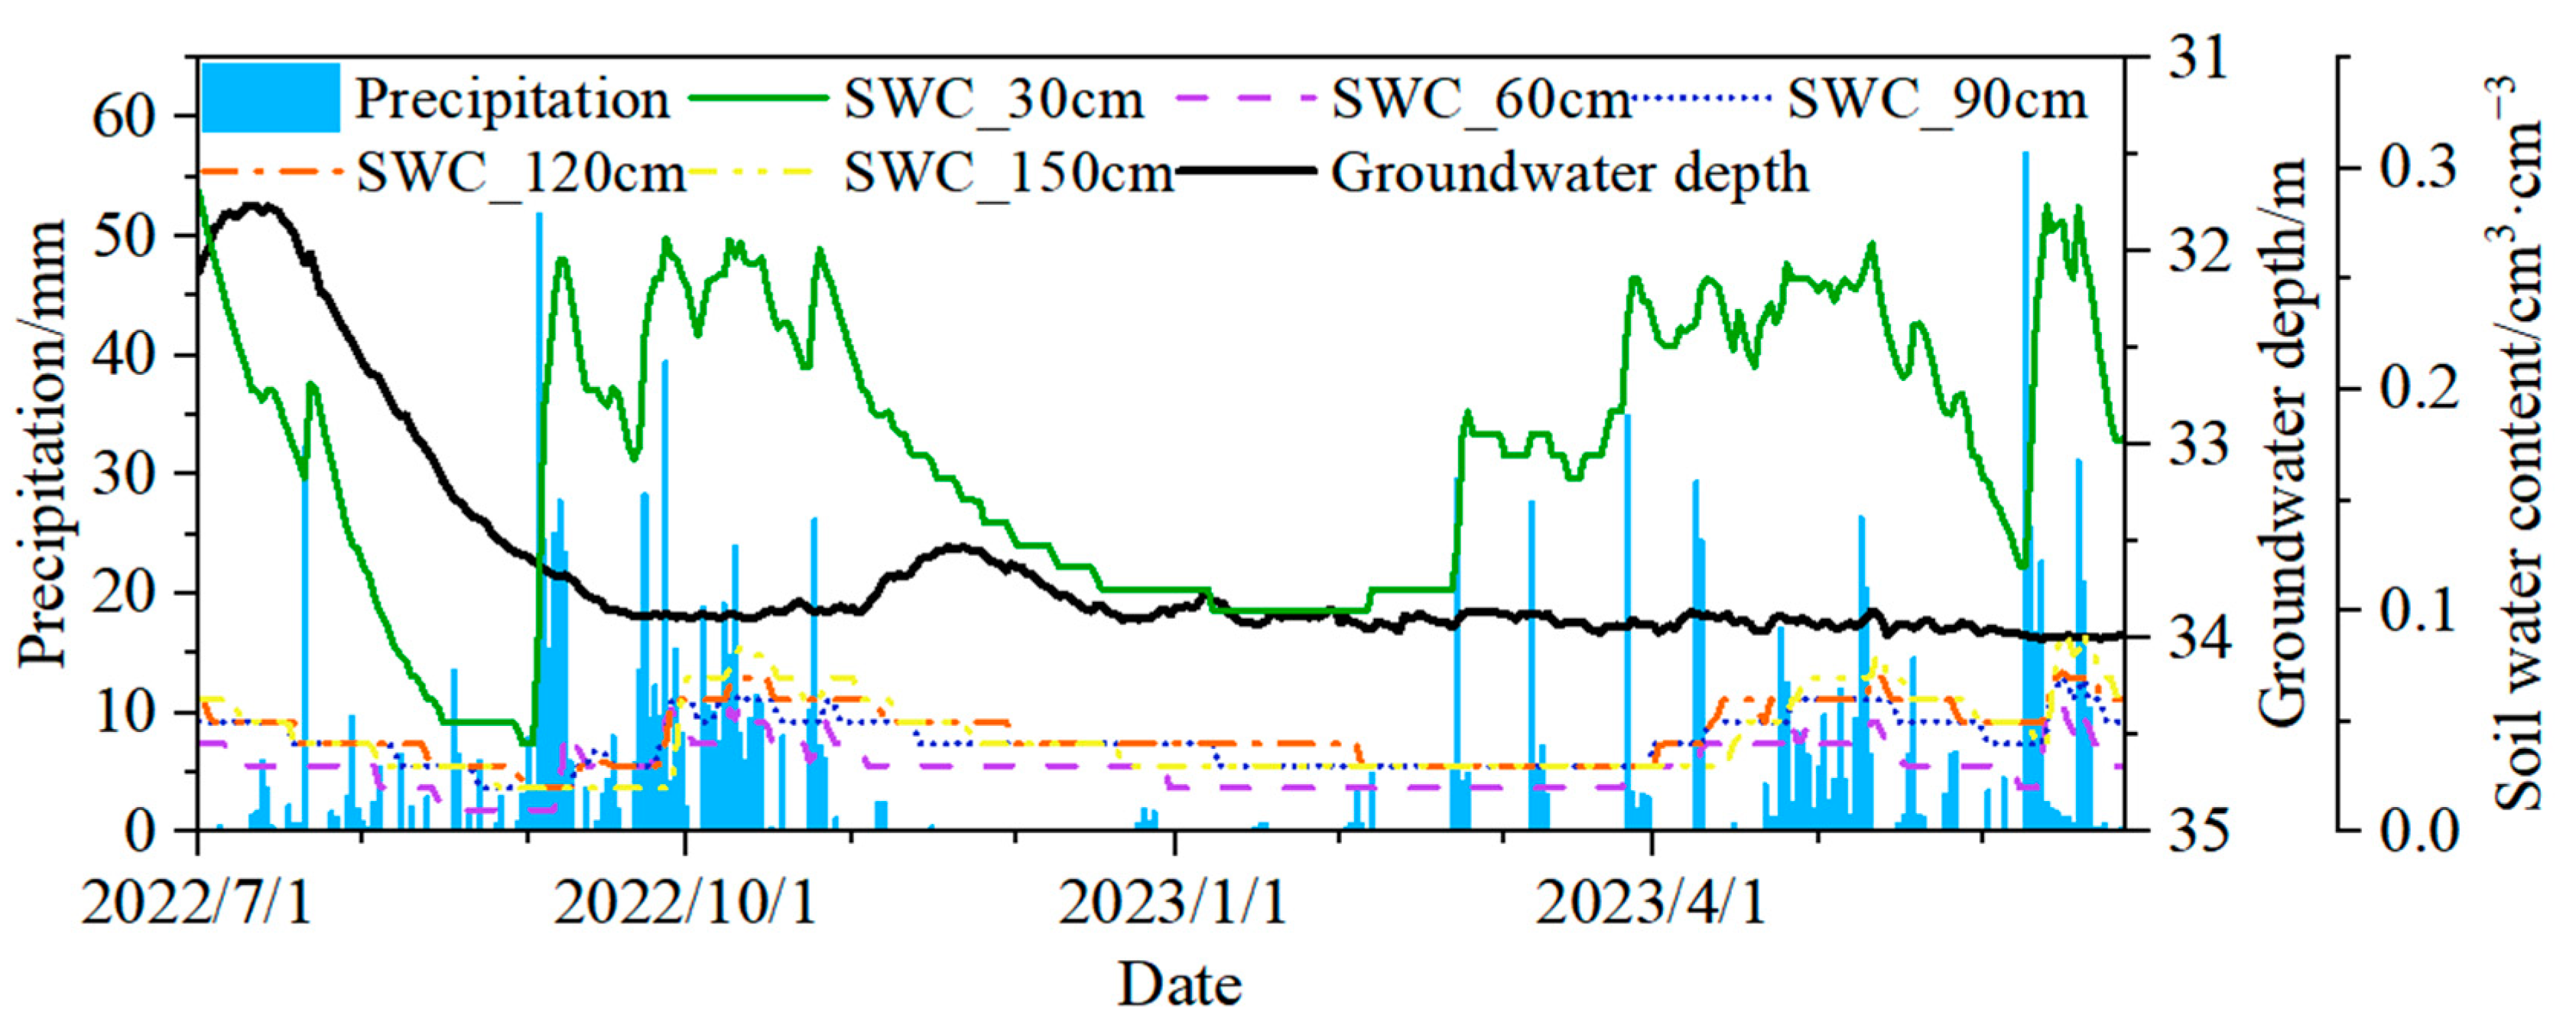
3.2.1. Groundwater Dynamics
3.2.2. SWC Dynamics
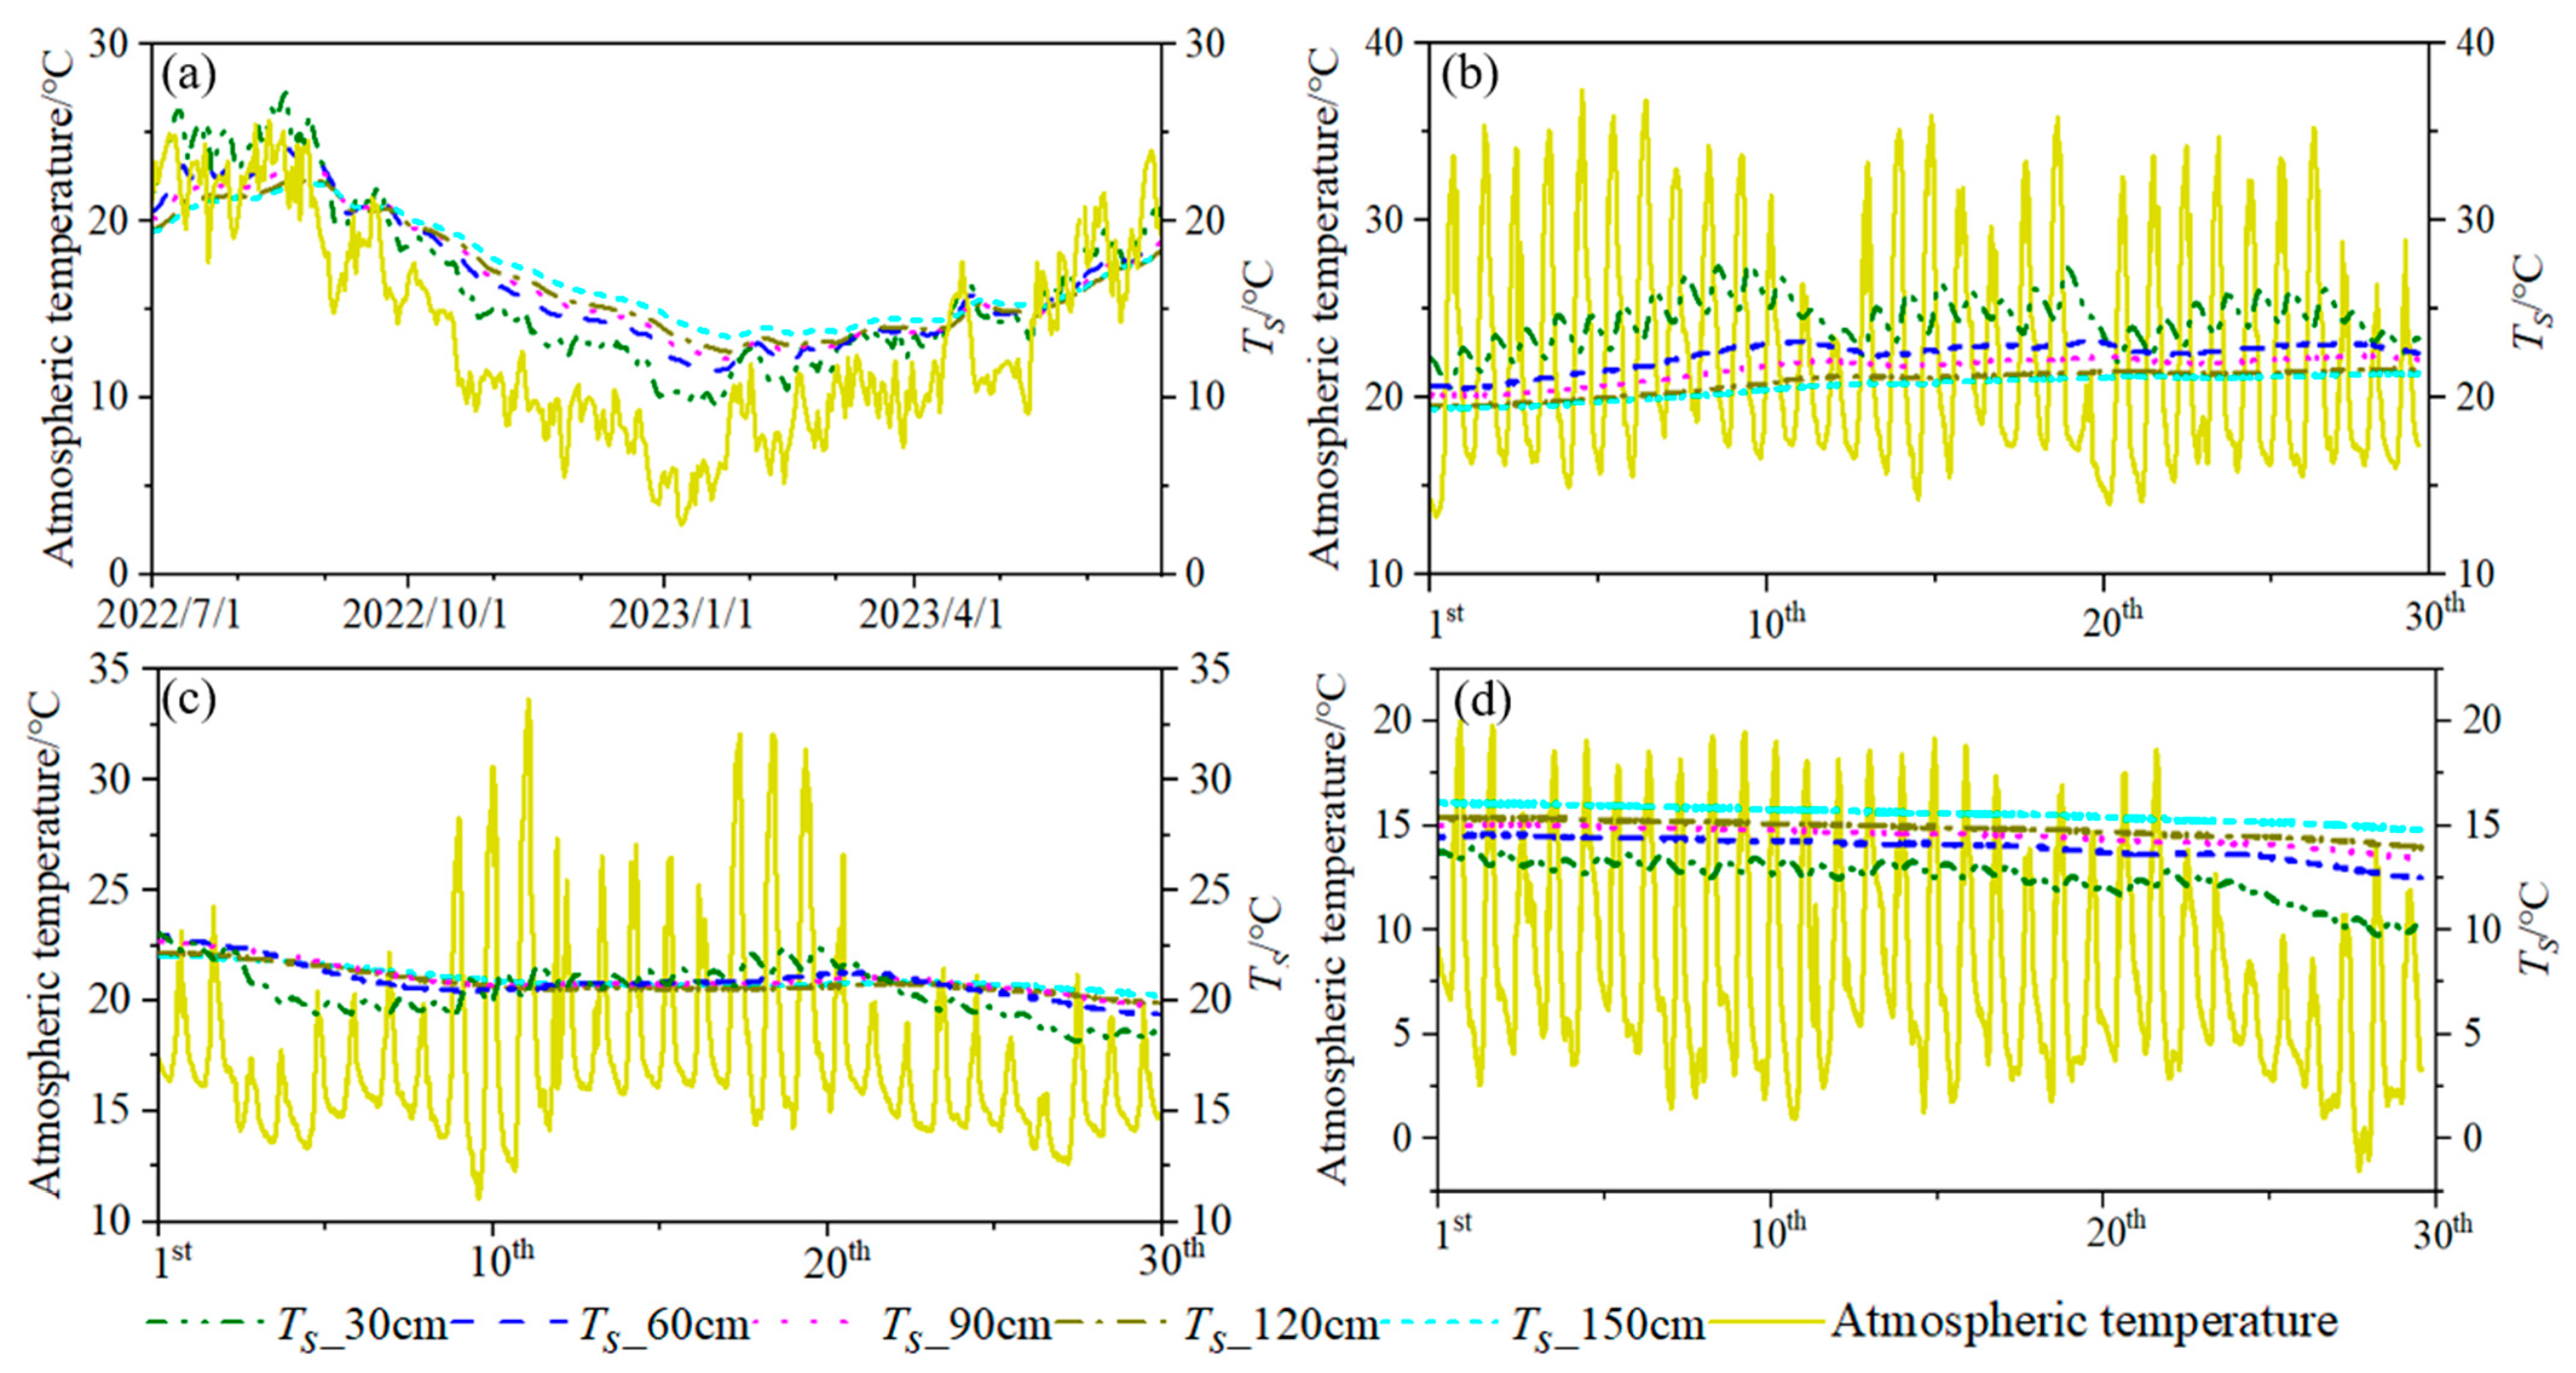
3.2.3. TS Dynamics
4. Analysis and Discussions
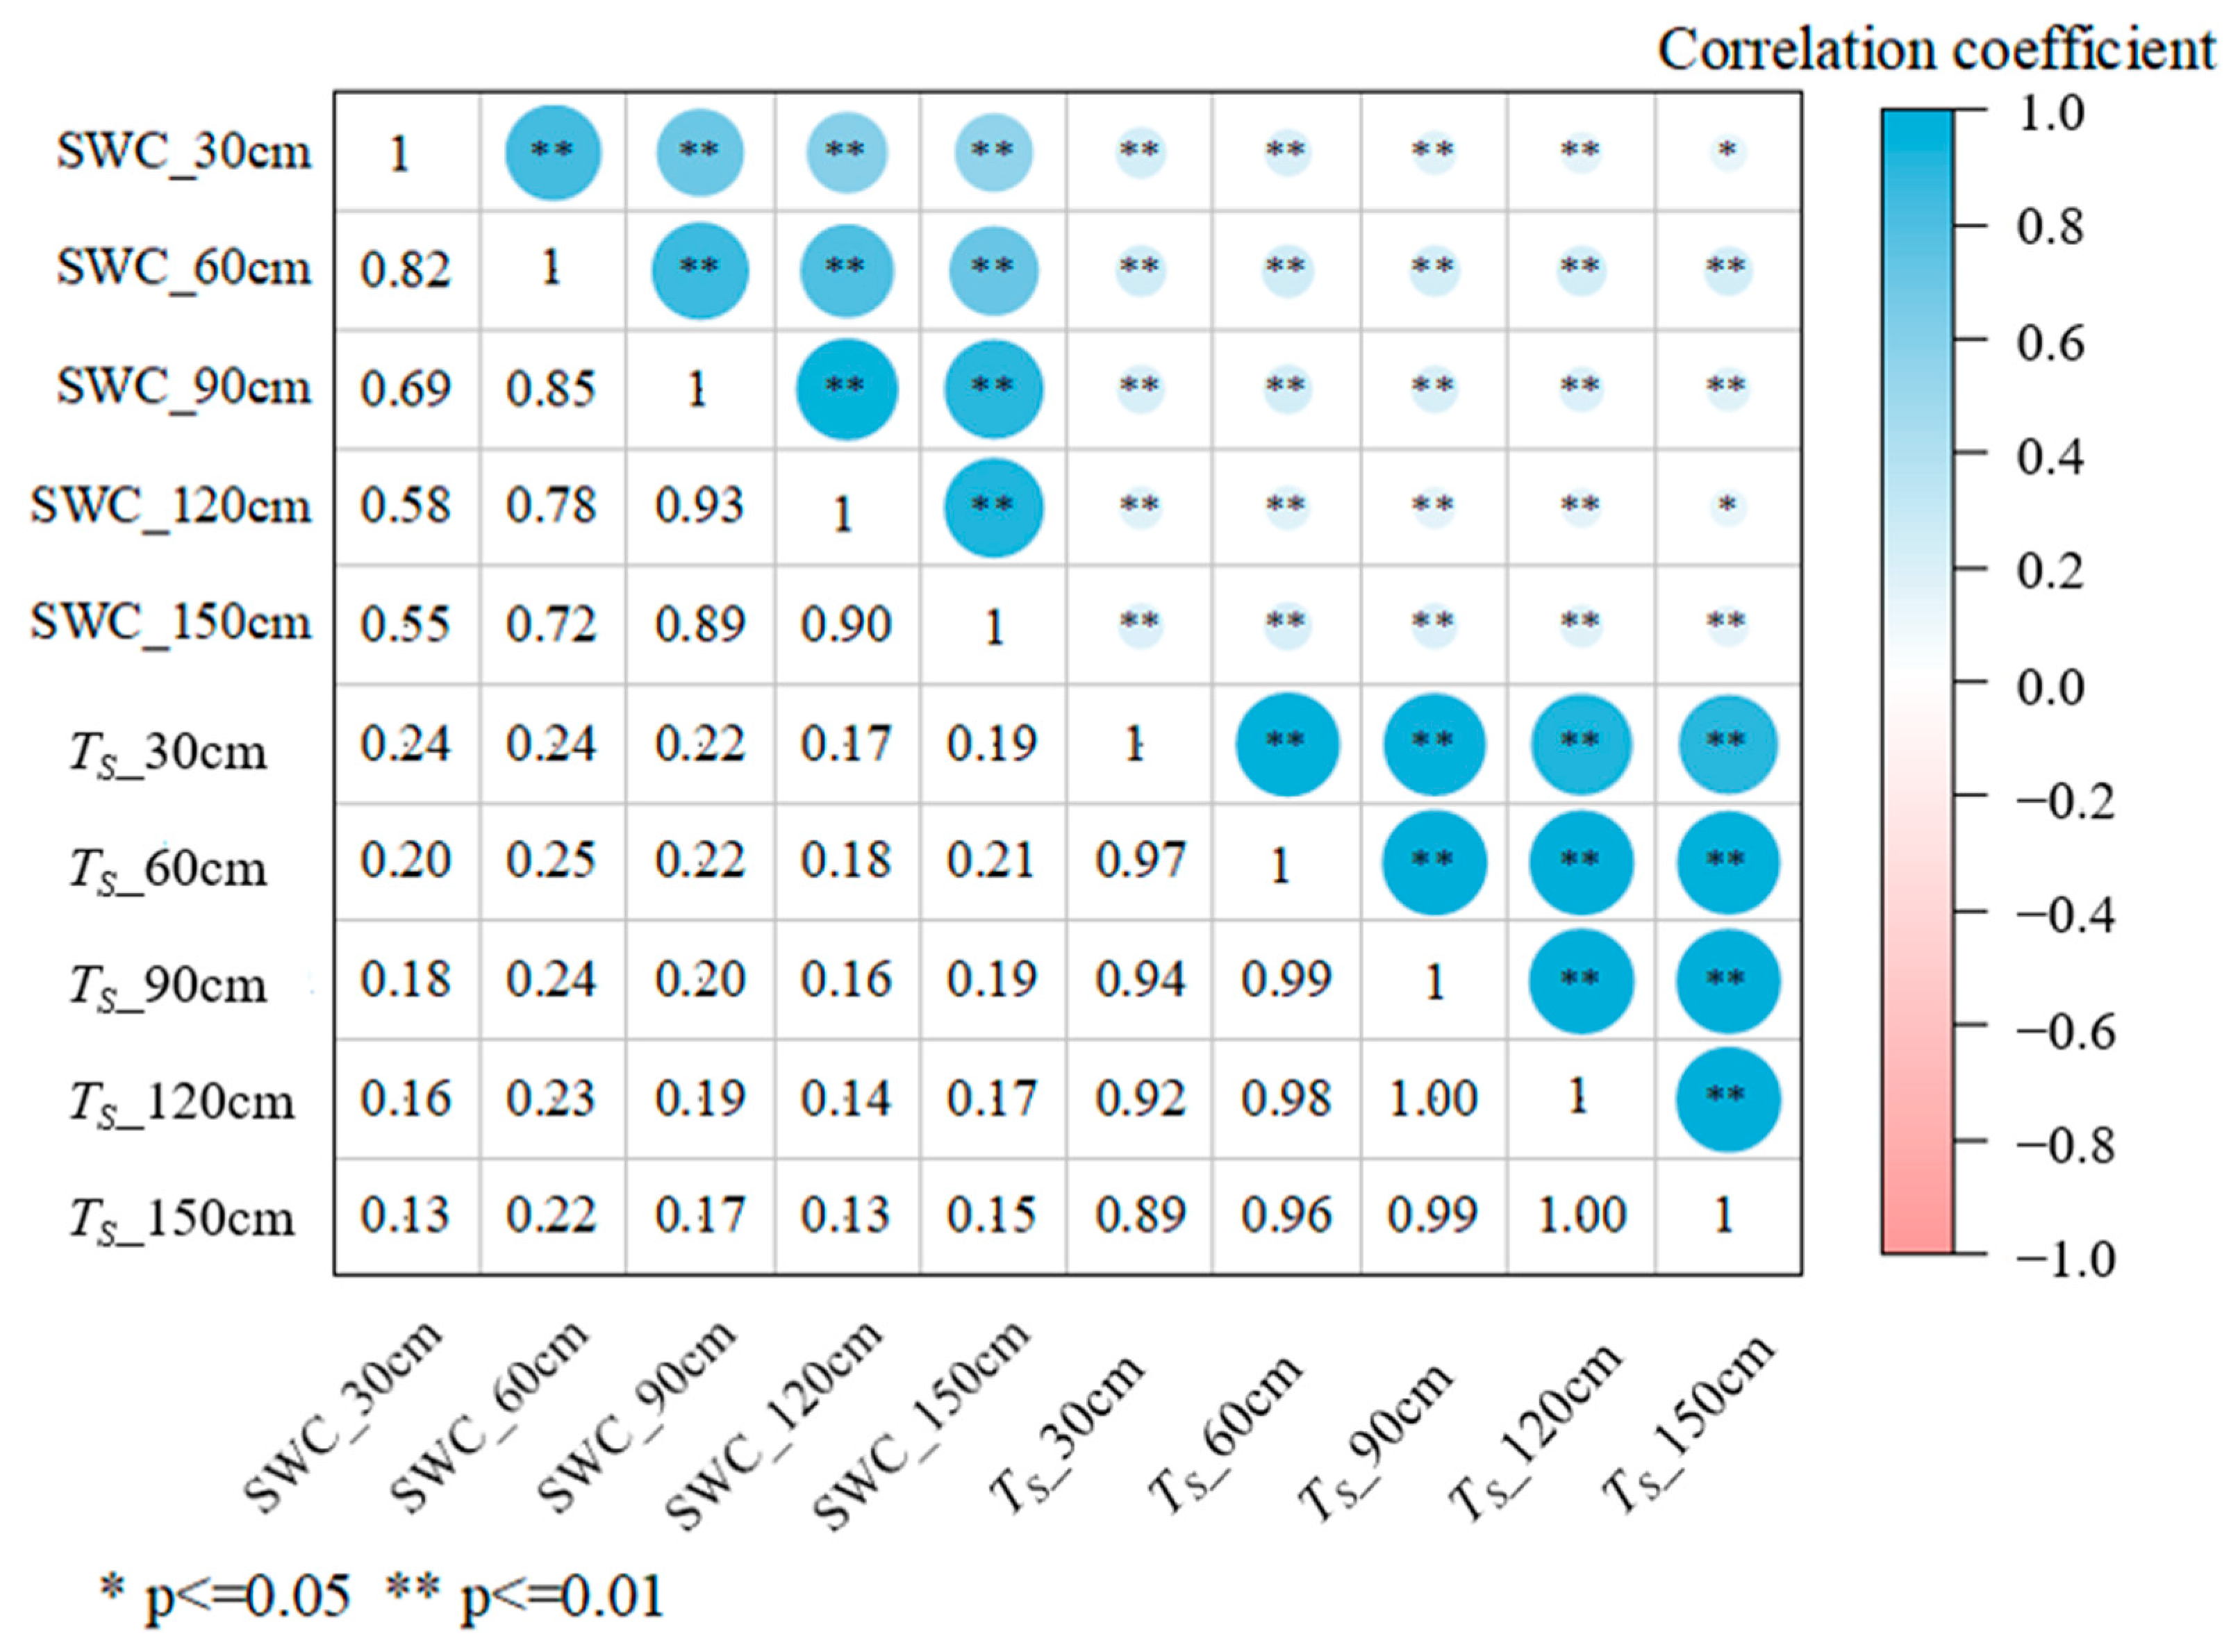
4.1. Correlation Analysis
4.1.1. Soil Hydrothermal Correlation
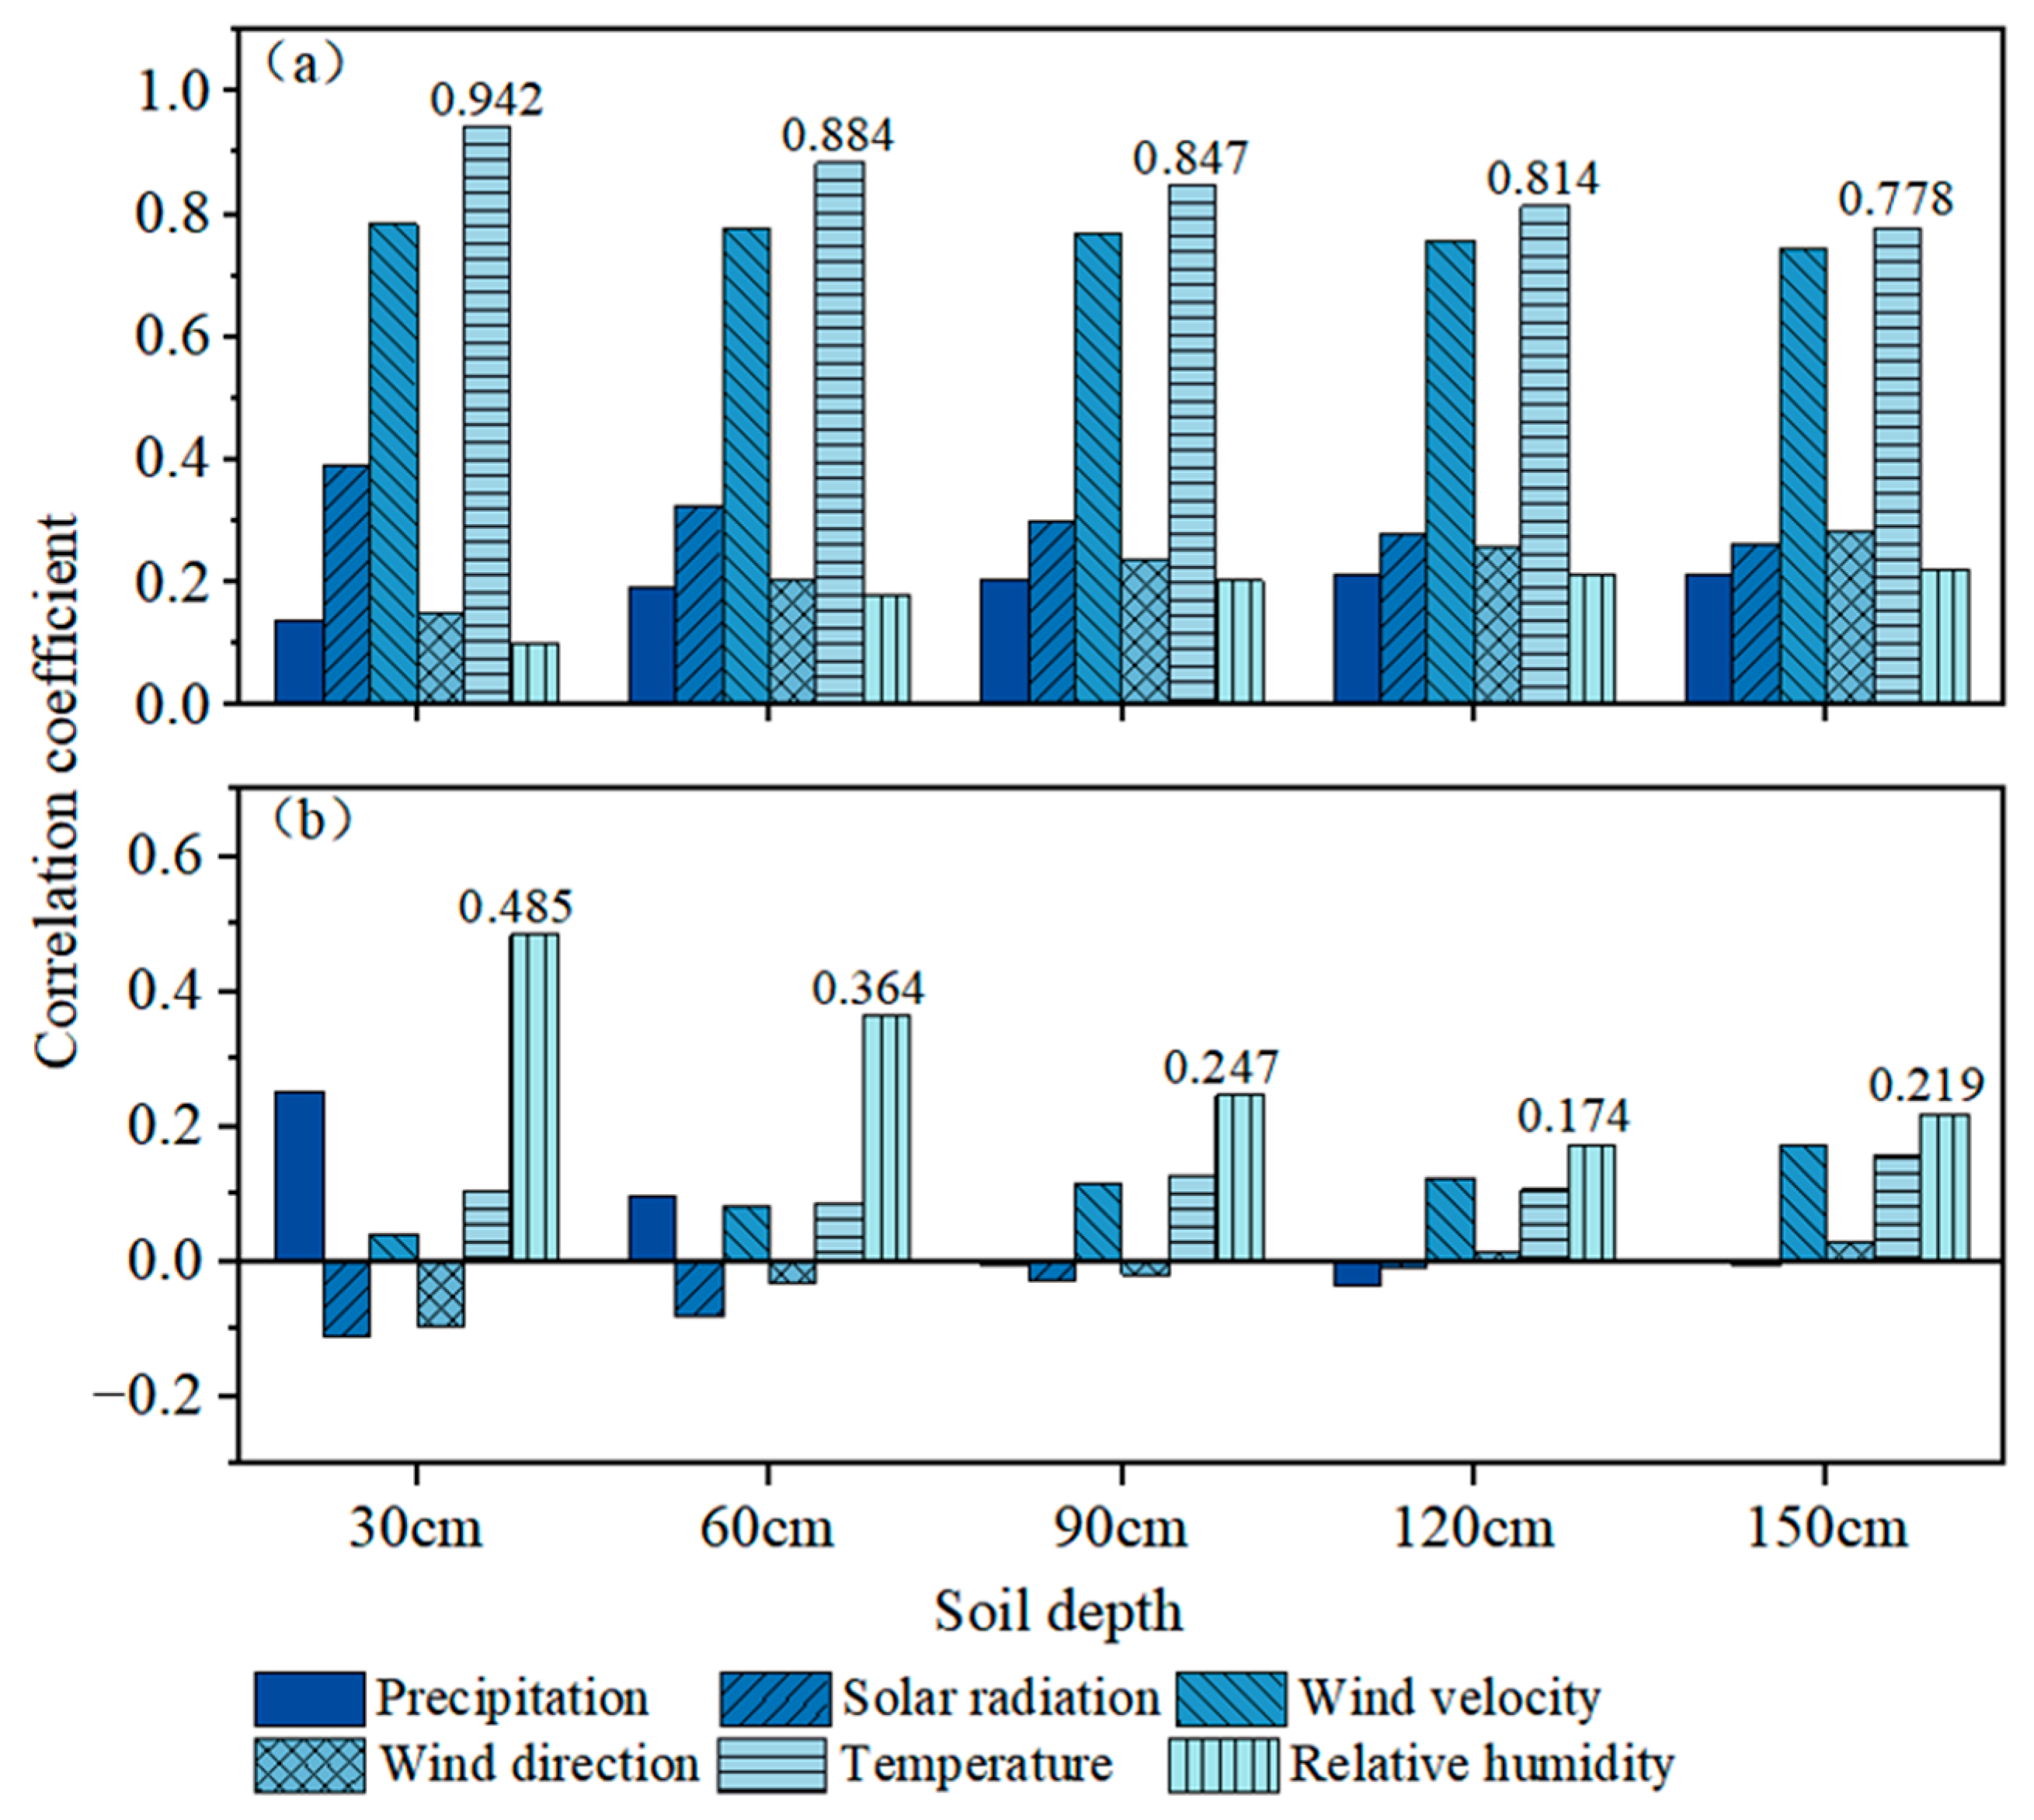
4.1.2. Correlation between Soil Hydrothermal and Meteorological Factors
4.2. Effect of Meteorological Factors on Soil Hydrothermal
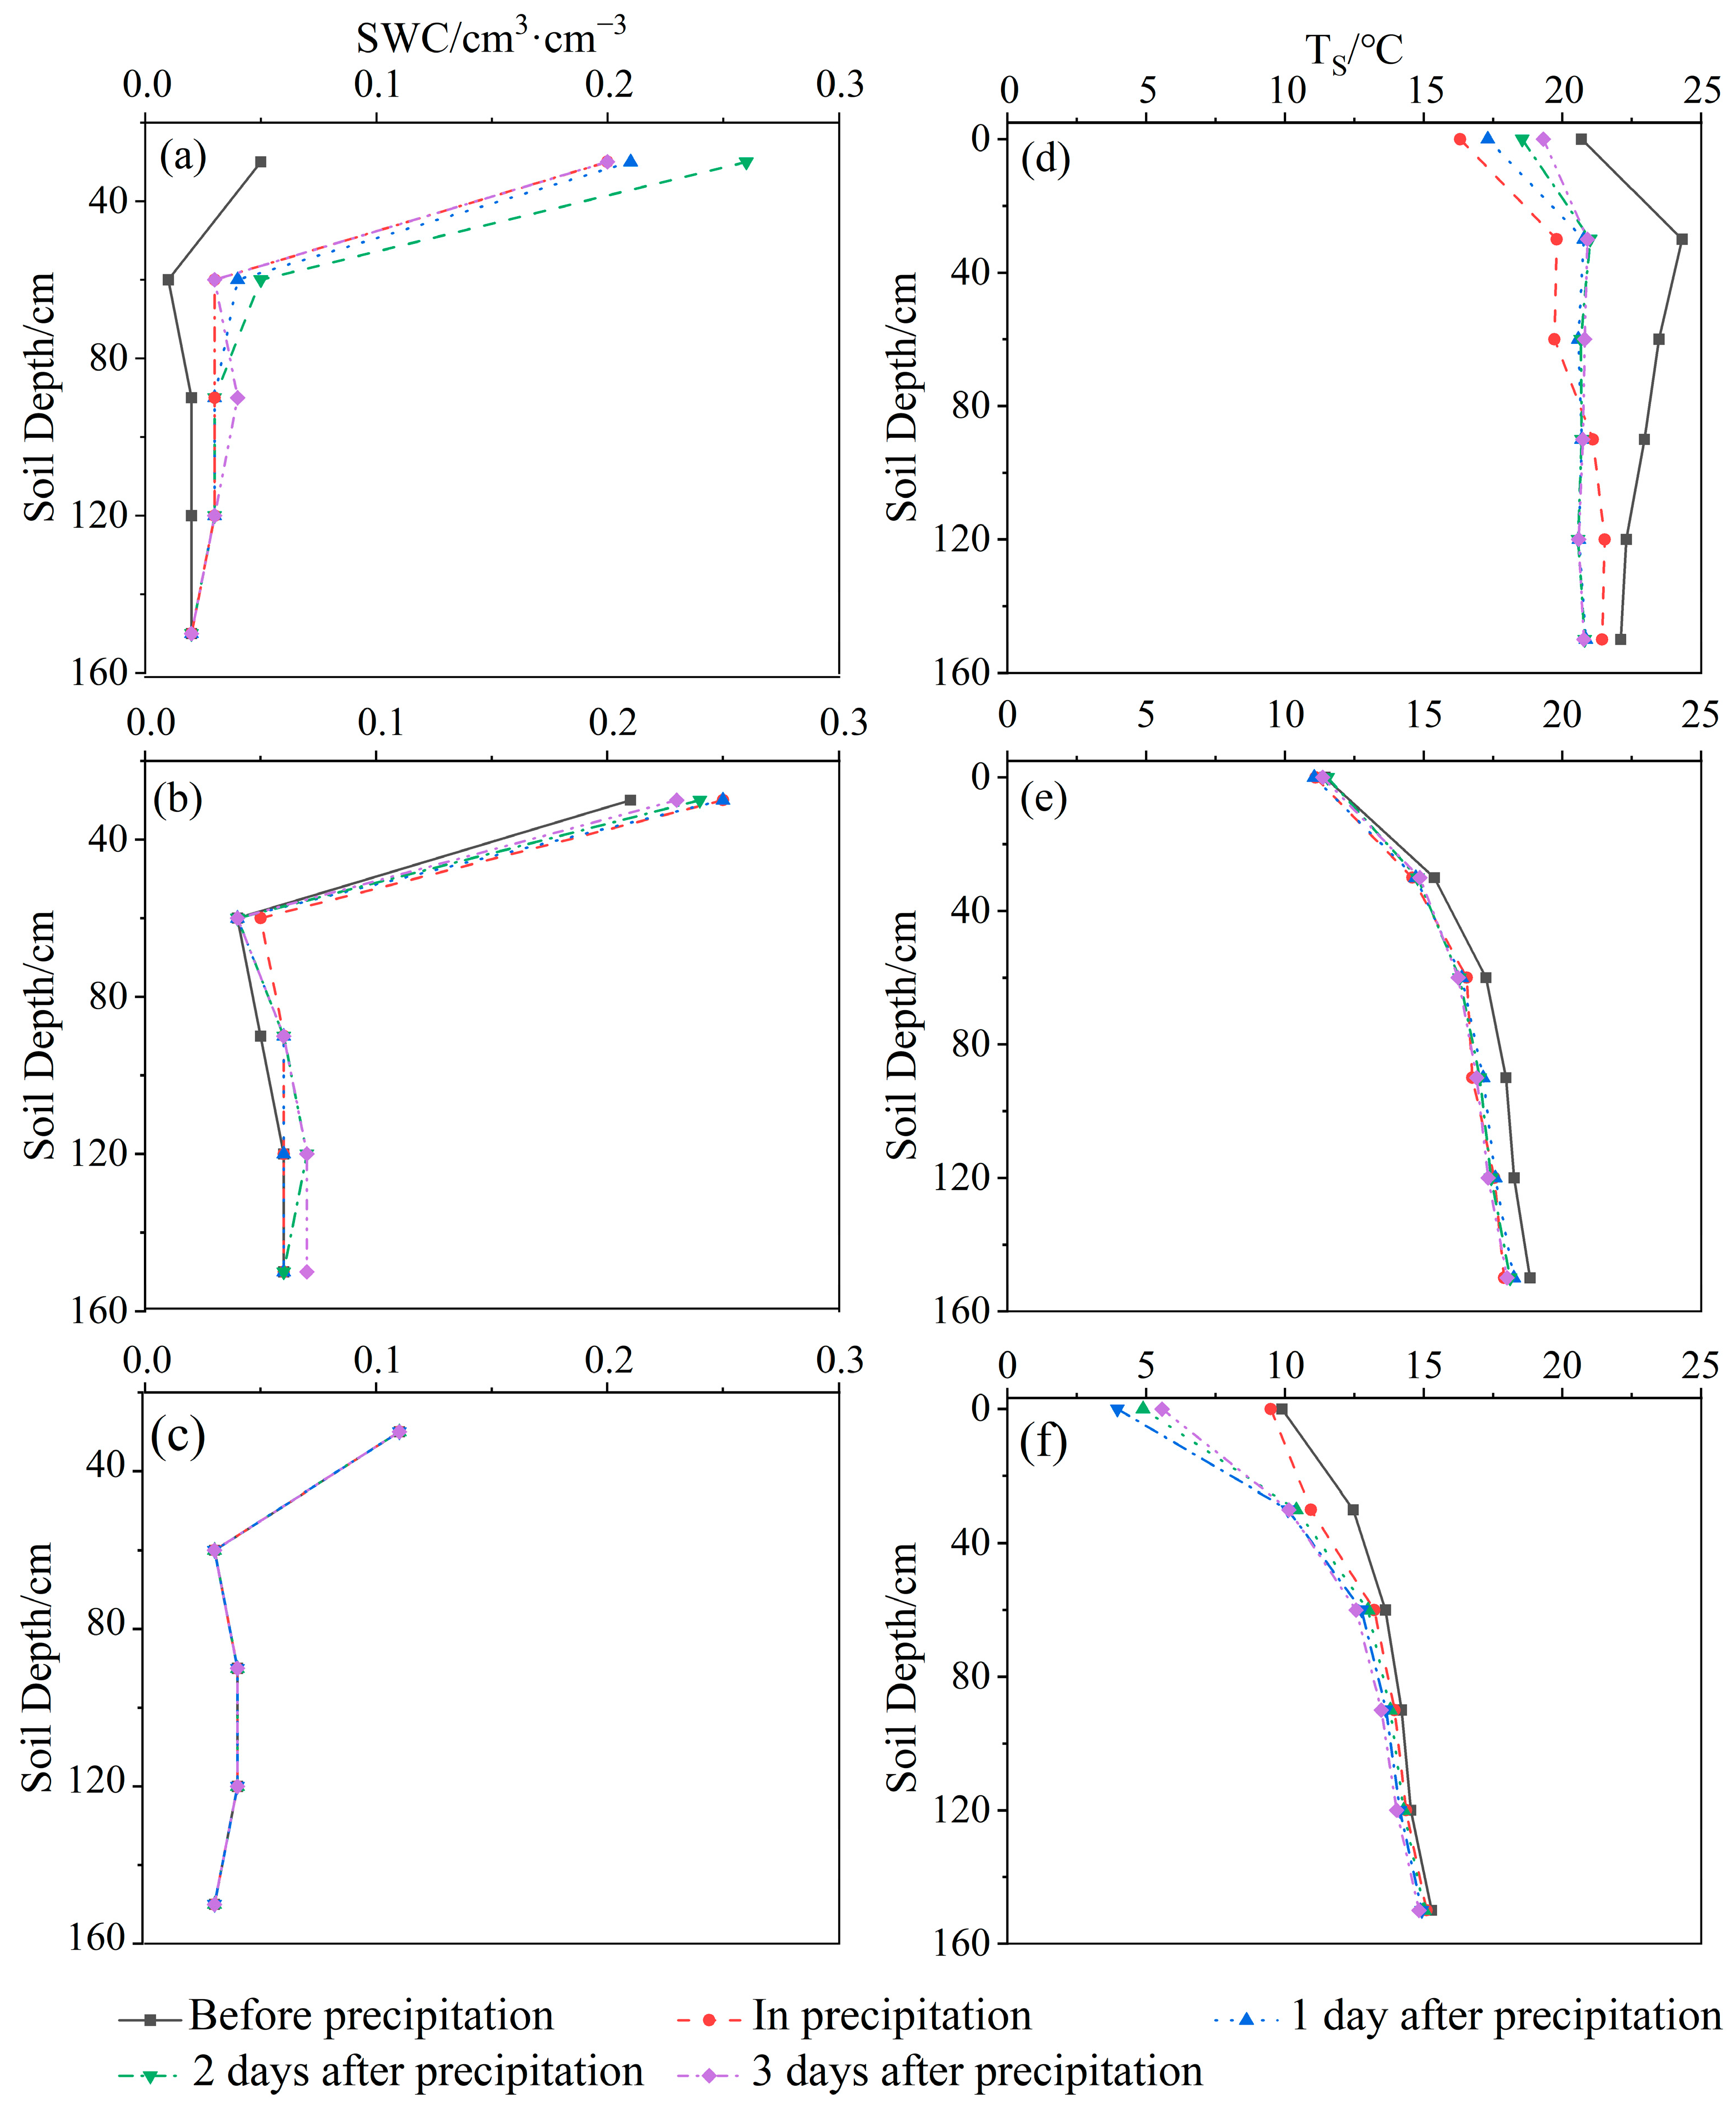
4.2.1. Temporal Changes in Soil Hydrothermal
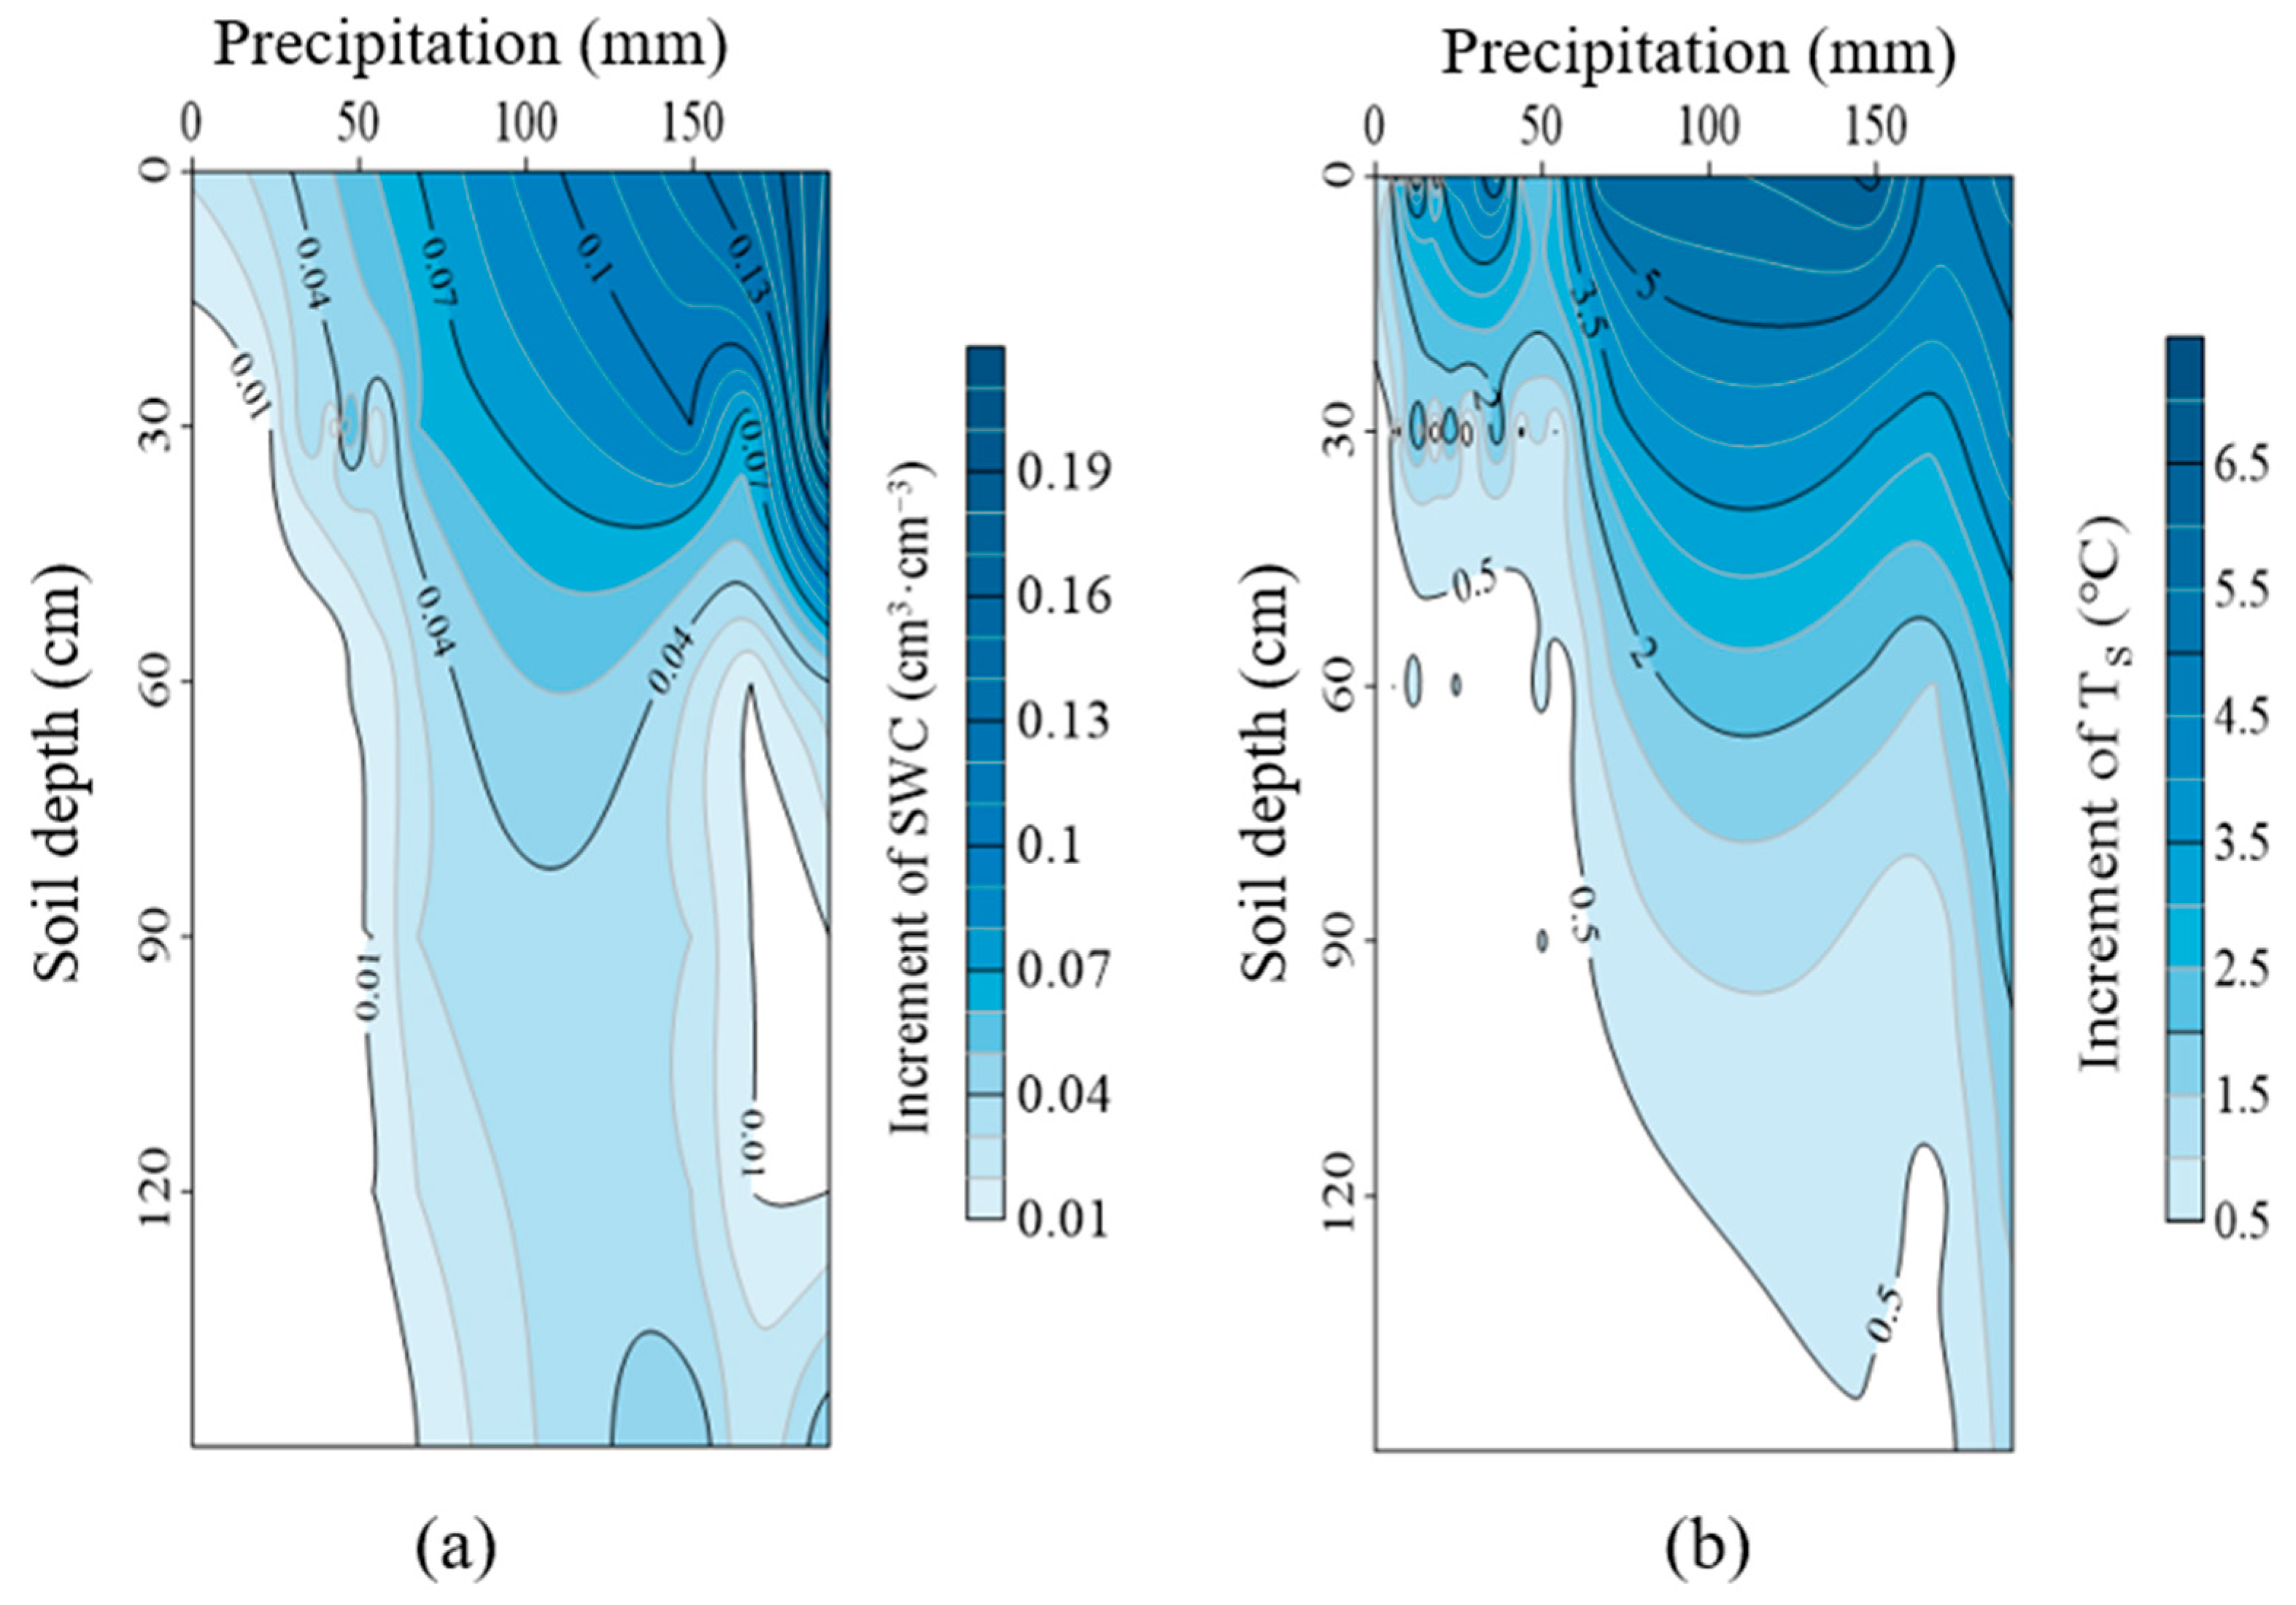
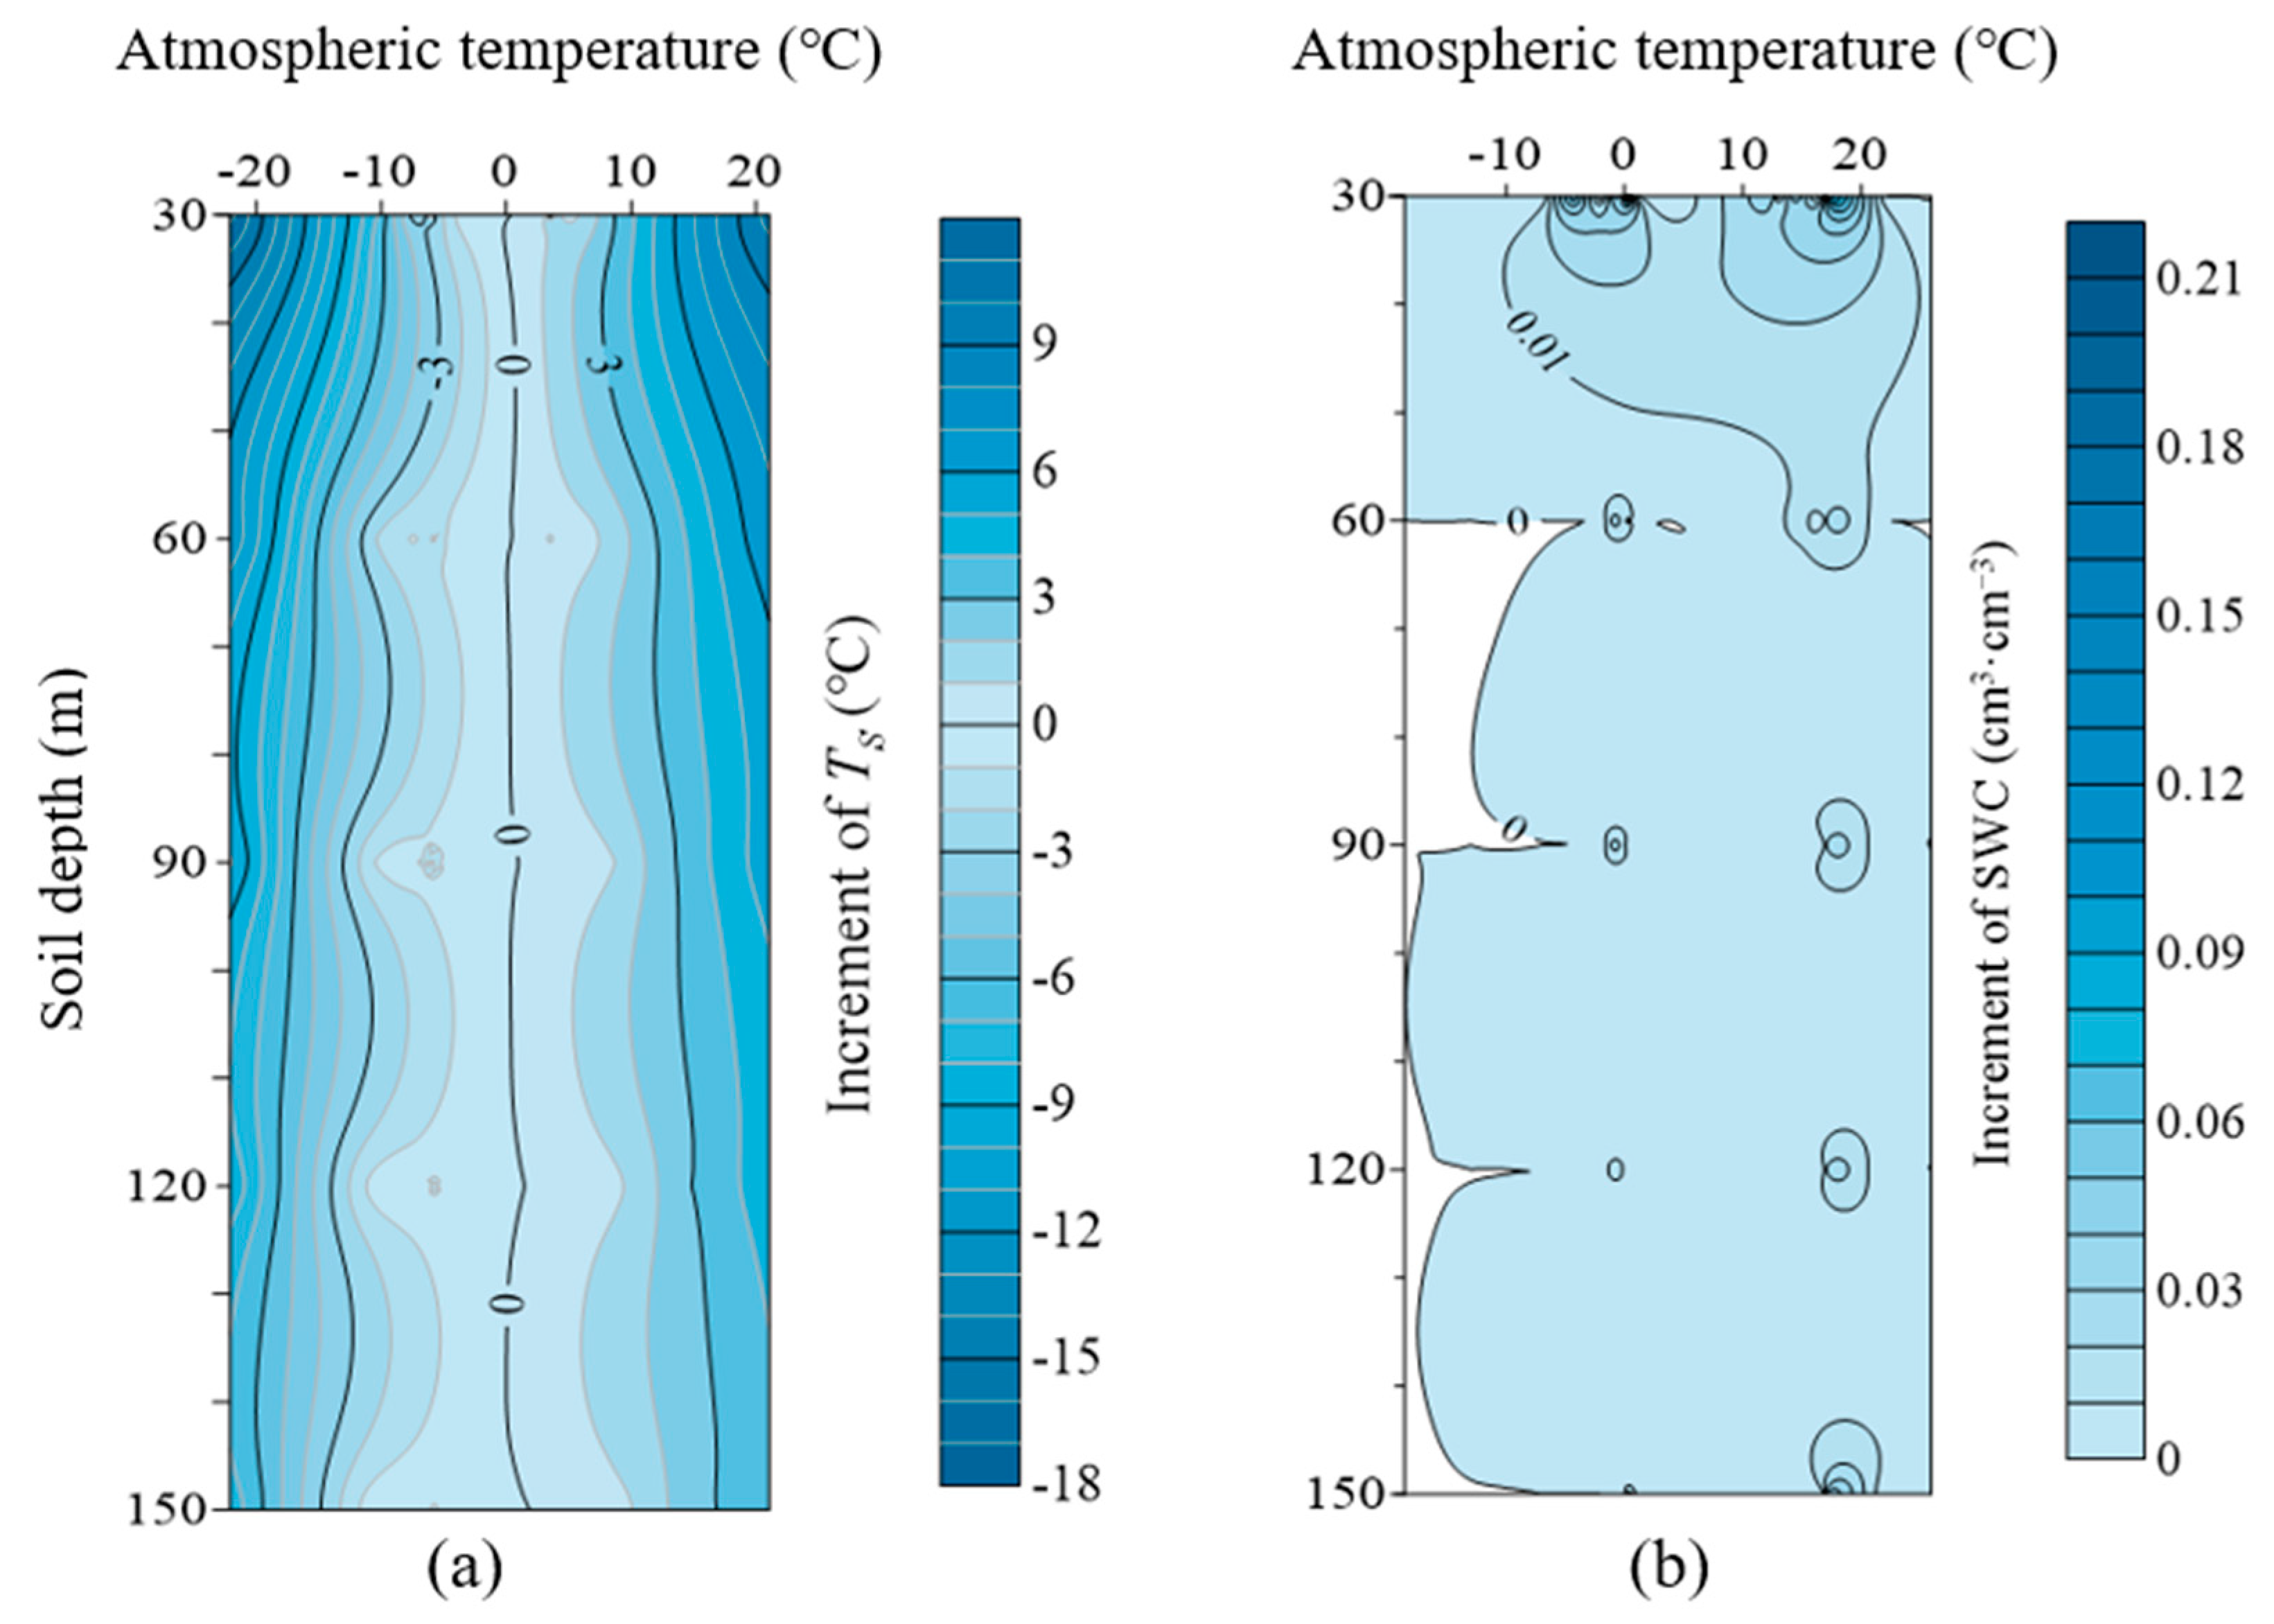
4.2.2. Spatial Variation in Soil Hydrothermal
5. Conclusions
Author Contributions
Funding
Data Availability Statement
Conflicts of Interest
References
- Seneviratne, S.I.; Corti, T.; Davin, E.L.; Hirschi, M.; Jaeger, E.B.; Lehner, I.; Orlowsky, B.; Teuling, A.J. Investigating soil moisture-climate interactions in a changing climate: A review. Earth-Sci. Rev. 2010, 99, 125–161. [Google Scholar] [CrossRef]
- Koster, R.D.; Mahanama, S.P.P.; Yamada, T.J.; Balsamo, G.; Berg, A.A.; Boisserie, M.; Dirmeyer, P.A.; Doblas-Reyes, F.J.; Drewitt, G.; Gordon, C.T.; et al. The Second Phase of the Global Land-Atmosphere Coupling Experiment: Soil Moisture Contributions to Subseasonal Forecast Skill. J. Hydrometeorol. 2011, 12, 805–822. [Google Scholar] [CrossRef]
- Robertson, J.A.; Gazis, C.A. An oxygen isotope study of seasonal trends in soil water fluxes at two sites along a climate gradient in Washington state (USA). J. Hydrol. 2006, 328, 375–387. [Google Scholar] [CrossRef]
- Sun, J.; Sun, X.; Wang, G.; Dong, W.; Hu, Z.; Sun, S.; Wang, F.; Song, C.; Lin, S. Soil water components control plant water uptake along a subalpine elevation gradient on the Eastern Qinghai-Tibet Plateau. Agric. For. Meteorol. 2024, 345, 109827. [Google Scholar] [CrossRef]
- Ricks, K.D.; Yannarell, A.C. Soil moisture incidentally selects for microbes that facilitate locally adaptive plant response. Proc. R. Soc. B. 2023, 290, 20230469. [Google Scholar] [CrossRef] [PubMed]
- Dougill, A.J.; Heathwaite, A.L.; Thomas, D.S.G. Soil water movement and nutrient cycling in semi-arid rangeland: Vegetation change and system resilience. Hydrol. Process. 1998, 12, 443–459. [Google Scholar]
- Zhan, M.-j.; Xia, L.; Zhan, L.; Wang, Y. Recognition of Changes in Air and Soil Temperatures at a Station Typical of China’s Subtropical Monsoon Region (1961–2018). Adv. Meteorol. 2019, 2019, 6927045. [Google Scholar] [CrossRef]
- Pu, H.; Song, W.; Wu, J. Using Soil Water Stable Isotopes to Investigate Soil Water Movement in a Water Conservation Forest in Hani Terrace. Water 2020, 12, 3520. [Google Scholar] [CrossRef]
- Song, Y.; Huang, A.; Chen, H. The Storage of Antecedent Precipitation and Air Temperature Signals in Soil Temperature over China. J. Hydrometeorol. 2022, 23, 377–388. [Google Scholar] [CrossRef]
- Elmi, A.; Anwar, S.A.; Al-Dashti, H. Measurements and Regional Climate Modeling of Soil Temperature with and without Bias Correction Method under Arid Environment: Can Soil Temperature Outperform Air Temperature as a Climate Change Indicator? Environ. Model. Assess. 2023, 29, 279–289. [Google Scholar] [CrossRef]
- Yang, Y.; Wu, Z.; He, H.; Du, H.; Wang, L.; Guo, X.; Zhao, W. Differences of the changes in soil temperature of cold and mid-temperate zones, Northeast China. Theor. Appl. Climatol. 2018, 134, 633–643. [Google Scholar] [CrossRef]
- Lozano-Parra, J.; Pulido, M.; Lozano-Fondon, C.; Schnabel, S. How do Soil Moisture and Vegetation Covers Influence Soil Temperature in Drylands of Mediterranean Regions? Water 2018, 10, 1747. [Google Scholar] [CrossRef]
- Zhang, S.-Y.; Li, X.-Y. Soil moisture and temperature dynamics in typical alpine ecosystems: A continuous multi-depth measurements-based analysis from the Qinghai-Tibet Plateau, China. Hydrol. Res. 2018, 49, 194–209. [Google Scholar] [CrossRef]
- Grillakis, M.G.; Koutroulis, A.G.; Papadimitriou, L.V.; Daliakopoulos, I.N.; Tsanis, I.K. Climate-Induced Shifts in Global Soil Temperature Regimes. Soil Sci. 2016, 181, 264–272. [Google Scholar] [CrossRef]
- Ceccon, C.; Panzacchi, P.; Scandellari, F.; Prandi, L.; Ventura, M.; Russo, B.; Millard, P.; Tagliavini, M. Spatial and temporal effects of soil temperature and moisture and the relation to fine root density on root and soil respiration in a mature apple orchard. Plant Soil 2011, 342, 195–206. [Google Scholar] [CrossRef]
- Wundram, D.; Pape, R.; Loeffler, J. Alpine Soil Temperature Variability at Multiple Scales. Arct. Antarct. Alp. Res. 2010, 42, 117–128. [Google Scholar] [CrossRef]
- Zhu, X.; Liu, H.; Li, Y.; Liang, B. Quantifying the role of soil in local precipitation redistribution to vegetation growth. Ecol. Indic. 2021, 124, 107355. [Google Scholar] [CrossRef]
- Meng, F.; Luo, M.; Sa, C.; Wang, M.; Bao, Y. Quantitative assessment of the effects of climate, vegetation, soil and groundwater on soil moisture spatiotemporal variability in the Mongolian Plateau. Sci. Total Environ. 2022, 809, 152198. [Google Scholar] [CrossRef]
- Cho, E.; Choi, M. Regional scale spatio-temporal variability of soil moisture and its relationship with meteorological factors over the Korean peninsula. J. Hydrol. 2014, 516, 317–329. [Google Scholar] [CrossRef]
- Fan, K.; Zhang, Q.; Sun, P.; Song, C.; Zhu, X.; Yu, H.; Shen, Z. Variation, causes and future estimation of surface soil moisture on the Tibetan Plateau. Acta Geogr. Sin. 2019, 74, 520–533. [Google Scholar]
- Wang, T.; Franz, T.E.; Li, R.; You, J.; Shulski, M.D.; Ray, C. Evaluating climate and soil effects on regional soil moisture spatial variability using EOFs. Water Resour. Res. 2017, 53, 4022–4035. [Google Scholar] [CrossRef]
- Chou, M.-L.; Tseng, H.-Y.; Wang, C.-H.; Hseu, Z.-Y. Identification of the water source and groundwater recharge in a paddy field using stable hydrogen and oxygen isotopes. Water Supply 2022, 22, 6443–6457. [Google Scholar] [CrossRef]
- Lyu, S. Variability of δ2H and δ18O in Soil Water and Its Linkage to Precipitation in an East Asian Monsoon Subtropical Forest Plantation. Water 2021, 13, 2930. [Google Scholar] [CrossRef]
- Chen, K.; Liu, G.; Xia, C.; Meng, Y.; Tetzlaff, D.; Zhong, Q.; Chang, J. Water cycling and partitioning through the soil-plant-atmosphere continuum in a subtropical, urban woodland inferred by water stable isotopes. Hydrol. Process. 2022, 36, e14746. [Google Scholar] [CrossRef]
- Song, Y.; Lu, Y.; Guo, Z.; Xu, X.; Liu, T.; Wang, J.; Wang, W.; Hao, W.; Wang, J. Variations in Soil Water Content and Evapotranspiration in Relation to Precipitation Pulses within Desert Steppe in Inner Mongolia, China. Water 2019, 11, 198. [Google Scholar] [CrossRef]
- Zhou, T.; Han, C.; Qiao, L.; Ren, C.; Wen, T.; Zhao, C. Seasonal dynamics of soil water content in the typical vegetation and its response to precipitation in a semi-arid area of Chinese Loess Plateau. J. Arid Land 2021, 13, 1015–1025. [Google Scholar] [CrossRef]
- Liang, J.; Xing, X.; Gao, Y. A modified physical-based water-retention model for continuous soil moisture estimation during infiltration: Experiments on saline and non-saline soils. Arch. Agron. Soil Sci. 2020, 66, 1344–1357. [Google Scholar] [CrossRef]
- Kader, M.A.; Nakamura, K.; Senge, M.; Mojid, M.A. Two-dimensional numerical simulations of soil-water and heat flow in a rainfed soybean field under plastic mulching. Water Supply 2021, 21, 2615–2632. [Google Scholar] [CrossRef]
- Maria Dominguez-Nino, J.; Arbat, G.; Raij-Hoffman, I.; Kisekka, I.; Girona, J.; Casadesus, J. Parameterization of Soil Hydraulic Parameters for HYDRUS-3D Simulation of Soil Water Dynamics in a Drip-Irrigated Orchard. Water 2020, 12, 1858. [Google Scholar] [CrossRef]
- Njoku, E.G.; Entekhabi, D. Passive microwave remote sensing of soil moisture. J. Hydrol. 1996, 184, 101–129. [Google Scholar] [CrossRef]
- Lakhankar, T.; Ghedira, H.; Temimi, M.; Sengupta, M.; Khanbilvardi, R.; Blake, R. Non-parametric Methods for Soil Moisture Retrieval from Satellite Remote Sensing Data. Remote Sens. 2009, 1, 3–21. [Google Scholar] [CrossRef]
- Ma, Y.; Ma, W.; Zhong, L.; Hu, Z.; Li, M.; Zhu, Z.; Han, C.; Wang, B.; Liu, X. Monitoring and Modeling the Tibetan Plateau’s climate system and its impact on East Asia. Sci. Rep. 2017, 7, 44574. [Google Scholar] [CrossRef] [PubMed]
- Zhou, X.; Zhao, P.; Chen, J.; Chen, L.; Li, W. Impacts of thermodynamic processes over the Tibetan Plateau on the Northern Hemispheric climate. Sci. China Ser. D-Earth Sci. 2009, 52, 1679–1693. [Google Scholar] [CrossRef]
- Shen, Y.; Chen, Y. Global perspective on hydrology, water balance, and water resources management in arid basins. Hydrol. Process. 2010, 24, 129–135. [Google Scholar] [CrossRef]
- Liu, W.; Xu, B.; Tang, P.; Li, Z. Research progress on models of soil water and heat and root water uptake and prospect in Tibet. J. Water Resour. Water Eng. 2019, 30, 254–260. [Google Scholar]
- Guo, D.; Li, D.; Liu, G. Simulated change in soil temperature on the Tibetan plateau from 1901 to 2010. Quat. Sci. 2017, 37, 1102–1110. [Google Scholar]
- Shi, L.; Du, J.; Zhou, K.; Zhuo, G. The temporal-spatial variations of soil moisture over the Tibetan Plateau during 1980–2012. J. Glaciol. Geocryol. 2016, 38, 1241–1248. [Google Scholar]
- Jiang, H.; Zheng, G.; Yi, Y.; Chen, D.; Zhang, W.; Yang, K.; Miller, C.E. Progress and Challenges in Studying Regional Permafrost in the Tibetan Plateau Using Satellite Remote Sensing and Models. Front. Earth Sci. 2020, 8, 560403. [Google Scholar] [CrossRef]
- Qin, X.; Chen, Q.; Meng, W.; Zhang, C.; Sun, D.; Yang, Y.; Chen, H.; Li, R. Determination of the current in-situ stress field of the Tongmai-Bomi section in the northern margin of the eastern Himalayan syntaxis. Acta Geol. Sin. 2023, 97, 2126–2140. [Google Scholar]
- Lou, X.; Fu, H.; Li, H. The Late Palaeozoic stratigraphic sequences and basin evolution in the Bomi region, Xizang. Sediment. Geol. Tethyan Geol. 2003, 23, 54–59. [Google Scholar]
- Yang, R.; Ding, Y.; Liu, Y.; Liu, Y.; Tian, L.; Wang, L. Soil Moisture and Temperature in Cherry Orchard:Variation Characteristics and Response to Meteorological Factors. Chin. Agric. Sci. Bull. 2020, 36, 67–72. [Google Scholar]
- Ni, J.; Cheng, Y.; Wang, Q.; Ng, C.W.W.; Garg, A. Effects of vegetation on soil temperature and water content: Field monitoring and numerical modelling. J. Hydrol. 2019, 571, 494–502. [Google Scholar] [CrossRef]
- Huang, L.; Bao, W.; Hu, H.; Nkrumah, D.T.; Li, F. Rock fragment content alters spatiotemporal patterns of soil water content and temperature: Evidence from a field experiment. Geoderma 2023, 438, 116613. [Google Scholar] [CrossRef]
- Rui, W.; Quan, S.U.N.; Xiang-wei, W.U. The Spatial Dynamics of the Soil Moisture under Different Terrain Conditions in the Southeast Edge of Tengger Desert. Acta Agric. Univ. Jiangxiensis 2009, 31, 756–759. [Google Scholar]
- Han, S.; Ahn, J.; Kim, S. The Stochastic Behavior of Soil Water and the Impact of Climate Change on Soil Water. J. Korea Water Resour. Assoc. 2009, 42, 433–443. [Google Scholar] [CrossRef]
- Yang, K.; Zhang, J. Spatiotemporal characteristics of soil temperature memory in China from observation. Theor. Appl. Climatol. 2016, 126, 739–749. [Google Scholar] [CrossRef]
- Hu, A.; Fu, W.; Chen, Y.; Yan, L.; Ai, M.; Chen, R.; Shi, C.; Liu, X. Soil Moisture Dynamics and Its Response to Precipitation in Different Cover Types of the Mu Us Sandy Land. Res. Soil Water Conserv. 2023, 30, 133–142. [Google Scholar]
- Li, X.; Zhang, Z.; Huang, L.; Wang, X. Review of the ecohydrological processes and feedback mechanisms controlling sand-binding vegetation systems in sandy desert regions of China. Chin. Sci. Bull. 2013, 58, 1483–1496. [Google Scholar] [CrossRef]
- Li, X.-Y.; Zhang, S.-Y.; Peng, H.-Y.; Hu, X.; Ma, Y.-J. Soil water and temperature dynamics in shrub-encroached grasslands and climatic implications: Results from Inner Mongolia steppe ecosystem of north China. Agric. For. Meteorol. 2013, 171, 20–30. [Google Scholar] [CrossRef]
- Marsh, P.; Bartlett, P.; MacKay, M.; Pohl, S.; Lantz, T. Snowmelt energetics at a shrub tundra site in the western Canadian Arctic. Hydrol. Process. 2010, 24, 3603–3620. [Google Scholar] [CrossRef]


| Category | Precipitation (mm) |
|---|---|
| light rain | 0–9.9 |
| moderate rain | 10–24.9 |
| heavy rain | 25–49.9 |
| rainstorm | 50–99.9 |
| heavy rainstorm | 100–199.9 |
| very heavy rainstorm | >200 |
Disclaimer/Publisher’s Note: The statements, opinions and data contained in all publications are solely those of the individual author(s) and contributor(s) and not of MDPI and/or the editor(s). MDPI and/or the editor(s) disclaim responsibility for any injury to people or property resulting from any ideas, methods, instructions or products referred to in the content. |
© 2024 by the authors. Licensee MDPI, Basel, Switzerland. This article is an open access article distributed under the terms and conditions of the Creative Commons Attribution (CC BY) license (https://creativecommons.org/licenses/by/4.0/).
Share and Cite
Meng, L.; Li, Z.; Zhang, Q.; Zhang, X. Soil Hydrothermal Dynamics in the Hengduan Mountains of Southeast Tibet and Associated Influencing Factors. Water 2024, 16, 1495. https://doi.org/10.3390/w16111495
Meng L, Li Z, Zhang Q, Zhang X. Soil Hydrothermal Dynamics in the Hengduan Mountains of Southeast Tibet and Associated Influencing Factors. Water. 2024; 16(11):1495. https://doi.org/10.3390/w16111495
Chicago/Turabian StyleMeng, Lingling, Zhaofeng Li, Qiang Zhang, and Xinpeng Zhang. 2024. "Soil Hydrothermal Dynamics in the Hengduan Mountains of Southeast Tibet and Associated Influencing Factors" Water 16, no. 11: 1495. https://doi.org/10.3390/w16111495
APA StyleMeng, L., Li, Z., Zhang, Q., & Zhang, X. (2024). Soil Hydrothermal Dynamics in the Hengduan Mountains of Southeast Tibet and Associated Influencing Factors. Water, 16(11), 1495. https://doi.org/10.3390/w16111495