Abstract
Capturing the criticality of a water distribution network (WDN) is difficult because of its many constituent factors. In terms of operation, the arrangement of demand nodes and how they connect have a significant influence. This study aims to integrate hydraulic and topologic aspects into a single criticality measure by adapting the structural hole influence matrix concept. This method applies the nodal demand to the corresponding pipes to construct a weighted network. The matrix stores each node’s local and global connection information, and the criticality value is then assigned based on the adjacency information. The criticality value can reveal the locations in terms of nodes or pipes that are vital for maintaining a network’s level of service. By analyzing pipe-failure scenarios, the criticality value can be related to the loss of performance. Assessing the nodal criticality change behavior under an increased stress scenario can help uncover the impacted areas. The metric for district metered area (DMA) creation demonstrates its potential as a weighting to be considered. This unified criticality metric enables the evaluation of nodes and pipes in a WDN, thereby enabling resilient and sustainable development planning.
1. Introduction
Urban communities rely on essential infrastructure to ensure a functioning society and economy. Maintaining the resilience of these infrastructures is crucial to prolonging their lifetimes and reducing the magnitude of service losses. Water distribution networks (WDNs) are critical for ensuring water supply to users in domestic and industrial areas. A WDN is a complex network because of its interacting components, making it difficult to assess its vulnerability [1]. Owing to their interconnectedness, several aspects must be considered in an assessment, such as hydraulic and topological factors [2].
A criticality analysis is conducted to evaluate the impacts of a loss on services and facilities [3]. The structure of a WDN consists primarily of pipes that carry drinking water to users. Hence, it is typically the object of critical analysis. Criticality analysis of distribution pipes can be used to measure the effects of pipe breakage in terms of reliability, cost, and repair effort [4]. In addition to the direct effect on the pipe, pipe breakage can affect the network by reducing the nodal pressure and degrading the water age [5]. The criticality of WDN assets can also be identified using economic consequences, as demonstrated by Lee et al. [6]. Other factors, such as the response time to pipeline failure, can also be considered to determine the criticality of the pipeline [7]. Understanding the criticality of these components is important for prioritizing maintenance, protection, and replacement to ensure resilient functionality [8,9].
Aside from assessing the hydraulic aspect of the network, the topologic, or more specifically, connectivity factors should also be considered, as these can influence the network response to abnormal events [10]. Instead of hydraulic performance, connectivity becomes particularly significant when evaluating the risk of service interruption [11]. WDNs exist in various topological configurations; however, they are all in the form of links and nodes, which can be described using graph theory [12]. Torres et al. [13] found a correlation between graph theory metrics and network performance. Several studies have been conducted on connectivity. Using a directed and weighted network graph model, Yazdani and Jeffrey [14] analyzed the robustness and vulnerability of WDNs. Graph spectral techniques were applied in the research of Di Nardo et al. [15] to improve the operation and management of the WDN by relying on topological and geometric information. Vulnerability can also be quantified when a network experiences connectivity losses during consequent failures [16]. In a population development study, Zischg et al. [17] developed a methodology for creating future WDNs by connecting and disconnecting WDN parts. Fractal theory has been used for criticality analysis based on the impact of link failure on system resilience [18,19].
When analyzing WDN resilience and vulnerability, it is vital to consider both hydraulic performance and connectivity. Considering both factors allows for a comprehensive criticality assessment to identify the essential components for hydraulic efficiency and network integrity; however, studies have typically considered these factors separately rather than concurrently. The sustainability index developed by Aydin et al. [20] identified a reduction in connectivity based on hydraulic performance parameters, such as pressure and water age. Another study used the reflected effect of connectivity loss at the pressure level to evaluate the nodal vulnerability [16]. Hernandez and Ormsbee [21] included nodal connectivity, pressure, and water age in their robustness analyses. Santonastoso et al. [22] uncovered the relationship between flow entropy and topological metrics such as link density and average path length.
The behavior of the elements in a WDN, such as the amount of flow, flow direction, and pressure, is driven by users or, more specifically, their demands. To better quantify the robustness of hydraulics and connectivity, the distribution of demands must be included, as they will affect the network’s level of service. Yang and Faust [23] adapted a structural hole influence matrix to quantify the criticality of nodes in terms of connectivity. Criticality reflects the topological location of the node and population values, which can then be used to evaluate the shift in the population.
Previous research tried to relate the hydraulic aspects to connectivity aspects or vice versa. However, these approaches fall short of capturing the interdependencies between hydraulic performance and network topology. By employing a connectivity-based algorithm that can consider hydraulic factors, this study proposes the hydraulic connectiveness criticality (HCC) to quantify the hydraulic and connectivity factors of network elements (junctions and pipes) in a single metric. The proposed HCC considers the intricate hydraulic behavior of the network, such as the demand represented by the pipes and the connectivity of each demand node following the flow direction. This index can provide unified information that is useful for decision-making, especially for identifying key vulnerabilities that can be overlooked by conventional methods. The index was applied to two WDNs, the correlation was tested for pipe failure, and the effect of community development was assessed. Additional analysis showed the index’s ability to group critical areas when creating district metered areas (DMAs). A limitation of this study is that the index was applied to medium-sized networks without additional network elements such as tanks and pumps.
2. Materials and Methods
This study adopted the structural hole influence matrix developed by Zhu et al. [24] and applied it to a WDN by Yang and Faust [23]. The structural hole theory offers a holistic perspective by considering both the degree of a node and its relationships with neighboring nodes in the network. Based on the node degrees, the structural holes’ influence matrix encompasses local and global information regarding the nodes. In view of the WDN, this metric considers the demand nodes and their connections (by pipes) on local (adjacent) and global (network) scales.
2.1. Hydraulic Weighting of Nodes
The first step, crucial for accurate HCC calculations, is the development of a weighted network. The weight of each link represents its significance within a network. In modeling the WDN, demands are assigned to nodes, reflecting the actual demand withdrawn along the links. The importance of a pipe is precisely determined by the demand withdrawn from it and the flow it carries to other withdrawal points.
To weigh pipes, a hydraulic simulation must first be conducted to determine the flow in the pipe. Next, the demand from the pipes is calculated by imparting the nodal degree-divided demands from the connected nodes. Finally, the pipe weight is obtained as the product of the pipe demand and carried flow ratio, as visualized in Figure 1.
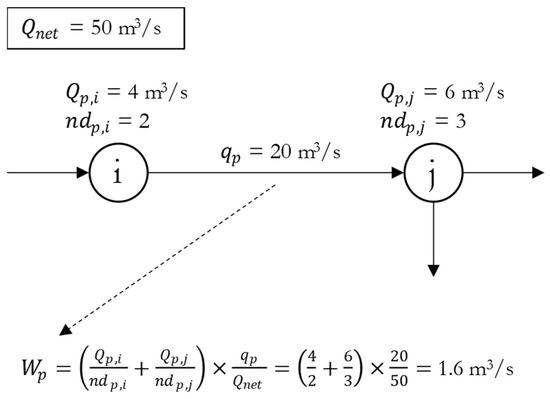
Figure 1.
Pipe weight calculation.
Here, for a specific pipe, is the pipe weight; and are the nodal demands for the start and end nodes, respectively; and are the nodal degrees for the start and end nodes, respectively; is the amount of flow in the pipe; and is the total network demand.
2.2. Closeness Centrality of WDN
Closeness centrality is a well-known measure of a node in a network based on its distance from other nodes [25]. It is described as the inverse of the distance from one node to the other. The normalized closeness centrality is given by Equation (1).
where is the closeness centrality of node ; is the total number of nodes in the network; and is the distance from node to node .
To capture the behavior of a WDN, the pipe direction must be considered. A single node in a WDN is not always connected to every other node in the network, and because of the pipe flow, each node has a set of reachable nodes. Adapting the concept of demand centrality from Zarghami and Gunawan [26], the centrality of node should be reduced to the shortest path between the source and demand nodes that contain node , as shown in Figure 2 (the shortest paths are highlighted with bold lines).
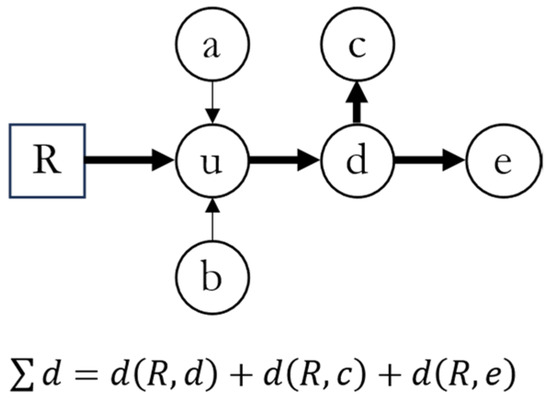
Figure 2.
Shortest path considering the centrality of the node.
Because not all parts of the network are reachable from a node, an improved closeness centrality formula from Wasserman and Faust [27] was used by adding the ratio of reachable nodes to the number of nodes in the network, as described in Equation (2).
where is the modified closeness centrality for node , and is the reachable node from node .
2.3. HCC Calculations
The closeness centrality serves as the node’s global information; the nodal influence value requires local information in the form of a constraint coefficient. The constraint coefficient describes the interconnectedness of a node. Nodes with high constraint values signify that they are connected to other nodes with common connections or, in the WDN, indicate a loop. A low constraint value signifies that the node bridges the connections between different sections of the network. The constraint coefficient is calculated using Equations (3) and (4).
where is the constraint coefficient for node ; is the node adjacent to node ; is the common neighbor to node and node ; is the total effort required to maintain a connection (0 if node and node are not connected); and is the pipe weight for the pipe connecting nodes and .
The node impact factor matrix is created by combining the adjacency matrix with the closeness centrality, as shown in Equation (5).
The structural hole influence matrix is the product of the impact factor matrix and constraint coefficient, as described in Equation (6).
The HCC for a node is then represented by the mean value of the influence of all neighboring nodes and the inverse of its constraint coefficient. This calculation is expressed in Equation (7).
where is the HCC value of node , and is the number of nodes adjacent to node .
Following the above equations, HCC represents the criticality of the node in terms of its own constraint coefficient and the magnitude of the centrality and constraint coefficient of adjacent nodes. The HCC value of each node in the network served as a criticality comparison within the network, where a higher HCC signified a higher criticality.
2.4. Modeling Resources
Calculations and modeling were performed using Python 3 [28] and the water network tool for resilience (WNTR) 1.1.0 Python package [29]. The HCC was applied to two WDNs: the ZhiJiang network [30] and a network cut set in South Korea, IH61. For simplicity, both are referred to as Net-A and Net-B, respectively. The details of the networks are shown in Figure 3, and Table 1 lists the network characteristics.
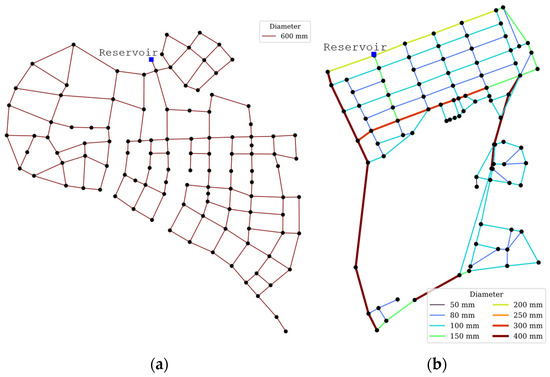
Figure 3.
Layout for (a) Net-A and (b) Net-B.

Table 1.
Network characteristics.
3. Applications
3.1. Nodal HCC Result
Weights were assigned to the pipes of both networks based on the nodal demand and flow in the pipes. The HCC values served as a comparison of the criticality between nodes in the network. Following the calculation, the results are presented in Figure 4 and Figure 5 for the comparison of HCC values between nodes and the top and bottom 5% percentile locations (indicated by red and blue markers, respectively).
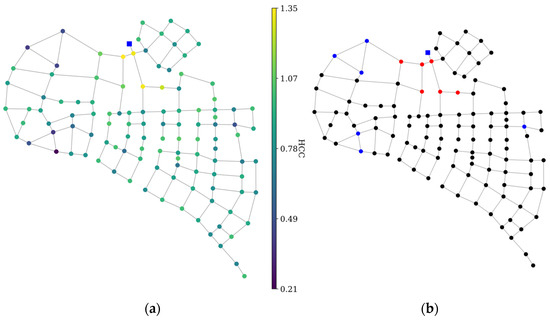
Figure 4.
(a) HCC values and (b) top and bottom 5% percentile locations for Net-A.
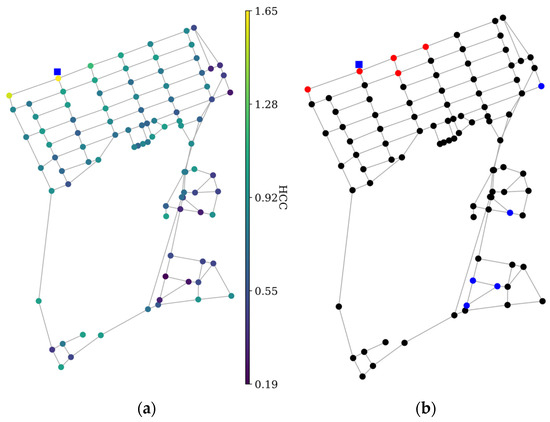
Figure 5.
(a) HCC values and (b) top and bottom 5% percentile locations for Net-B.
From these observations, the location that tends to have the highest HCC values is near the reservoir. This is because the pipes closer to the source tend to carry higher flows (higher weight) and have more connections to downstream nodes (higher centrality). In the downstream areas, where the flow ratio is more even, the HCC can highlight which node or area is more important than its vicinity.
The HCC for Net-A ranges from 0.21 to 1.35, with a mean of 0.86 and a standard deviation of 0.18. Figure 4 directly shows that the nodes that are directly downstream of the reservoir exhibit a high HCC value (except for the right side). Although the source-connected node exhibited a high HCC value, it was not the highest in the network. The HCC value considers global and local importance by averaging the influence from adjacent nodes; the right-side node has a low influence value, thereby lowering the HCC value of the source-connected node. The highest HCC value belongs to the node to the left of the source-connected node as more flows pass through the path, supplying the left and bottom parts of the network, signifying its importance. The HCC manages to identify the left-side node as being more critical than the bottom-side node. As the bottom section of the network has more extensive areas, it is expected that the bottom-side node receives more flow; however, in actuality, most of the flow goes through the left-side node first. The right-side node has a low HCC because of its low centrality, as it only supplies a small section of the network.
The HCC calculations in the Net-B results are in the range of 0.19–1.65, with a mean of 0.75 and a standard deviation of 0.25. As shown in Figure 5, critical nodes were similarly located near the reservoir. In this situation, the source-connected node is the most critical because it is adjacent to other nodes with high influence values. The left-side node of the source-connected node is the second most critical because it is the starting point of the mainline pipe and is responsible for carrying most of the network flow compared with the other two nodes adjacent to the source-connected node. The bottom left section of the network has a middling criticality value owing to several high-demand nodes and sparse connections compared with the bottom right section. Less critical nodes are exhibited by nodes with low demand values and those in a loop. The results show that the nodal HCC value can capture demand distribution and network flow behavior while considering connectivity.
3.2. Link HCC Result: Correlation to Hydraulic and Connectivity Measurement
A common issue in WDNs is pipe breakage, which affects network pressure and connectivity. To assess whether locations with high HCC can be related to a loss of quality of service, several pipe breakage scenarios were simulated. Before conducting the simulation, the link HCC was calculated by averaging the nodal HCC values tied to each pipe. Each simulation entailed sequentially closing individual pipes and calculating the resulting mean network pressure and closeness centrality. Pressure and centrality were normalized, averaged, and compared with the normalized HCC values. Pearson’s correlation test was used to determine correlations. In this simulation, the disconnection of pipes that caused the isolation of the network (bridge connections) was not conducted. The results are shown in Figure 6 and Figure 7.
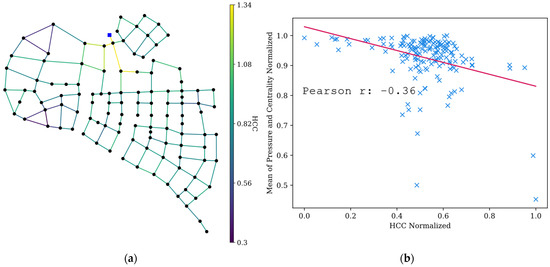
Figure 6.
(a) Link HCC and (b) correlation analysis for Net-A.
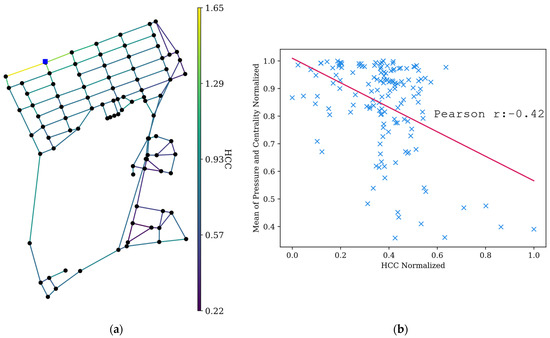
Figure 7.
(a) Link HCC and (b) correlation analysis for Net-B.
Correlation analysis showed a weak correlation (−0.36) for Net-A and a moderate correlation (−0.42) for Net-B. Despite the low correlation value, the HCC captured the expected pipe breakage effects at both ends. When a pipe with a low HCC breaks, the impact should be minimal in terms of pressure reduction and efficient delivery of flow to nodes in the network. Both Figure 6b and Figure 7b show that in the low-HCC section, the impacts are minimal, while the impact is more severe for high-HCC pipes. The pipes in the middle of the HCC section lack a discernible trend. This is likely due to the combination of two factors, each making a different contribution to the overall criticality and, hence, the scattered results. Based on this analysis, emphasizing the high and low HCC locations is better.
3.3. Assessing Impacts of Local Development
Pipe flow in the network drives the HCC value. Urban development, such as an increase in population, increases the demand in the network, changing the current flow profile. It is crucial for management to know what types of changes will occur in the network and plan accordingly. The impact of the development scenarios can be simulated using HCC. By examining the before-and-after HCC values, actions can be taken to ensure sustainable management. A population increase scenario was tested on Net-A, where 10% water demand was increased in one of the most critical nodes (green circled stripes in the figure), as shown in Figure 8 (HCC increase is in red, and HCC decrease is depicted in blue).
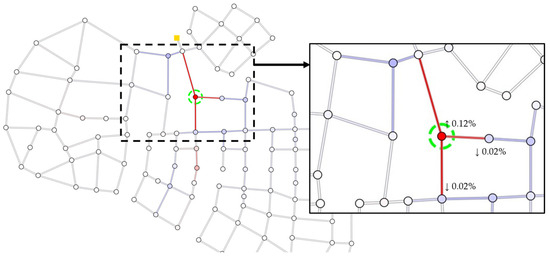
Figure 8.
Effect of population (=water consumption) increase to other locations.
The 10% increase in demand did not result in a significant increase in a specific node; instead, the HCC increased by 0.12% (from 1.3286 to 1.3302). However, the impact on other locations can be observed from the changes in HCC. The increased demand for a specific node raised the HCC for the node but decreased the HCC of adjacent nodes. Increased demand places more weight on connected pipes, directly increasing the corresponding node influence. As the total network demand increased while the amount of flow delivered by some pipes remained the same, the carried flow ratio decreased, causing some nodes to decrease in the HCC. The increase in HCC of other nodes and pipes (middle-bottom part) is caused by the change in pipe flow behavior, where, previously, there was less flow going through the path. However, owing to the increased demand, more flow was rerouted to the previously less critical pipe, thereby increasing stress. Using this information, planning can be conducted to reduce its impact.
One way of decreasing the impact of increased demand is the addition of a new connection path. In the following example, an additional path is provided to demand-increasing nodes. A new pipe was added with similar specifications to the other pipes, which are 600 mm and 130 for its diameter and Hazen-Williams roughness coefficient, respectively. The length is approximated to be 690 m based on the length of the pipe positioned in parallel. Another simulation was conducted, and the difference in HCC from the previous situation is shown in Figure 9.
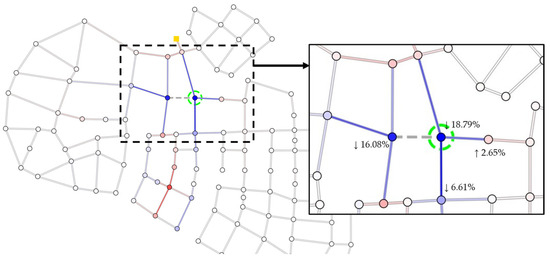
Figure 9.
Addition of pipe to reduce criticality.
Compared to the previous condition, the demand-increased node HCC decreased by 18.79% (from 1.3302 to 1.0803). The additional pipe (shown as gray stripped lines) connected the demand-increased node to the node on its left side, which also helped decrease the HCC of the node. In contrast to the decreased criticality of the surrounding areas in the previous case, several nodes and pipes that had previously experienced a decrease in HCC had increased values. The added pipe increased the redundancy while decreasing the HCC of the connected nodes. The influence is then shifted to the other nodes, thereby increasing their criticality. Despite the increase in HCC in some locations, the average change in HCC is −0.35% for the network, which shows improvement. This additional path was not optimized for the connection location. The examples in this section demonstrate the capability of the HCC to uncover the influence of an event in one location of the network on other parts of the network.
3.4. Potential Usage for District Metered Area Creation
A DMA in a WDN is an isolated section that can be monitored and controlled separately. The creation of a DMA can promote pressure control, making it more uniform and reducing leakage. Net-B was used for this demonstration, and the DMA creation method employed a community structure algorithm [31] for group nodes with similar characteristics. Three different factors were used for DMA clustering: HCC, nodal pressure, and node elevation. The three configurations were then compared using multicriteria decision analysis (MCDA) and weighting: (1) Todini’s resilience index [32], (2) pressure uniformity (PU) index [33] as the hydraulic indices, and (3) centrality as the connectivity index (MCDA weight = [0.3, 0.3, 0.4]). The weighting was decided based on the objective of the research, which was to combine hydraulic and connectivity factors. The hydraulic aspect especially considers the importance of network robustness and leakage reduction. Hence, it was decided to use two hydraulic factors with lower weighting compared to the connectivity factor. The three configurations of the DMA separation are presented in Figure 10, and Table 2 lists the normalized MCDA results.
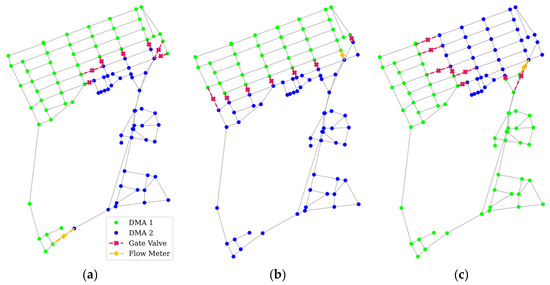
Figure 10.
DMA configuration using (a) HCC, (b) pressure, and (c) elevation.

Table 2.
MCDA results.
From the observations of the three different configurations, the behavior can be inferred as follows: In the case of the HCC-based DMA configuration (Figure 10a), the algorithm successfully grouped nodes with similar HCCs, whereas DMA 2 mainly consists of nodes with low HCCs. Thus, it can be said that DMA 2 is a less critical area. The pressure-based DMA configuration (Figure 10b) splits the network into upstream and downstream towns. The network topology features a higher elevation on the right side; hence, the elevation-based DMA configuration (Figure 10c) divides the network accordingly.
From the MCDA results, the HCC-based DMA configuration provided the best results in terms of the Todini index and centrality and was overall the best configuration among the three. The higher Todini index results from the flow meter location on the bottom left part of the network, making the section before it almost unaffected by pressure loss from valve closure and leaving the less critical section of the network to have less pressure. This ensures that high-demand or critical nodes receive adequate pressure. The closure of valves in the pressure- and elevation-based configurations has a more drastic effect because larger sections are affected by valve closure. The PU index shows that the elevation-based configuration is the best performer, primarily because of the lower overall network pressure, as this metric should have an inverse relationship with the Todini index. As the HCC-based DMA configuration is built on connectivity considerations, it exhibits the best performance in terms of centrality, indicating that the network can distribute demand more efficiently. In this demonstration, the HCC-based configuration performed the best compared to the others, proving that it can be considered a clustering criterion when creating DMAs for a WDN.
4. Discussion and Conclusions
Criticality in a WDN is an essential measurement as it can help management in decision-making to maintain the level of service. Criticality itself can have various definitions, as there are several factors to consider regarding the functionality of WDNs. This study proposes HCC as a criticality metric encompassing hydraulic and connectivity factors in assessing WDN. The metric adapts the concept of the structural hole influence matrix to capture hydraulic aspects such as nodal demand and pipe flow, as well as the connectivity aspect of centrality. To adapt the concept to WDN, important hydraulic elements are added, such as the nodal demand, pipe flow, and flow directions. HCC represents both aspects as a unified measurement.
By applying this methodology to the two WDNs, the HCC can identify critical elements or areas. Considering the pipe flow, the HCC successfully identified the most critical areas in the locations, such as those near the reservoir. On the downstream side, where the flows are more evenly distributed, HCC can identify important connection points. Less critical nodes have lower demand and are in a loop. In contrast, more critical nodes are often connected to many demands and are frequently included in the path to deliver water to other nodes. The correlation of pipe HCC with mean network pressure and centrality was found to be moderate; however, the low and high ends of the HCC represented pipes with low and high impact, respectively. In a development scenario, the HCC can identify how an increased demand will affect part of the network and how the flow behavior changes. An additional analysis conducted to test the viability of HCC in creating DMAs found that HCC can be considered a reference factor when sectorizing the network. The DMAs were created by considering the HCC as a weight managed to group locations with similar criticality, making resource management more efficient. Considering the findings of this study, the HCC managed to capture the hydraulic and connectivity characteristics into a unified metric. It provides valuable information on the critical locations in the WDN, which can be considered in planning and management by water utilities.
Because this study focused on incorporating hydraulic and connectivity aspects into a single metric, there are some limitations that should be addressed in future studies. The scalability of the methodology should be tested because it was only applied to two medium-sized networks; thus, the behavior of more extensive networks requires further investigation. Only single reservoirs, junctions, and pipes were considered in this study. Interactions with other network elements, such as multiple reservoirs, tanks, and valves, should be incorporated into future studies. The consideration of scalability and additional elements could result in some interactions and challenges previously not considered in the simpler network, such as the pipe weight adjustment when there are multiple sources and how to formulate the tank during filling and draining. The applicability aspects of the HCC should also be further tested in cases such as economic planning and emergency responses.
Author Contributions
Conceptualization, M.S.M. and D.K.; methodology, M.S.M.; software, M.S.M.; validation, M.S.M.; formal analysis, M.S.M.; investigation M.S.M.; writing—original draft preparation, M.S.M.; writing—review and editing, D.K.; visualization, M.S.M.; supervision, D.K.; project administration, D.K.; funding acquisition, D.K. All authors have read and agreed to the published version of the manuscript.
Funding
This work was supported by the Korea Environmental Industry & Technology Institute (KEITI) through the Water Management Program for Drought, funded by the Korea Ministry of Environment (MOE), grant number RS-2023-0023194.
Data Availability Statement
Data is contained in the article.
Conflicts of Interest
The authors declare no conflicts of interest.
References
- Yazdani, A.; Jeffrey, P. Complex network analysis of water distribution systems. Chaos 2011, 21, 016111. [Google Scholar] [CrossRef] [PubMed]
- Jung, D.; Kim, J.H. Water distribution system design to minimize costs and maximize topological and hydraulic reliability. J. Water Resour. Plan. Manag. 2018, 144, 06018005. [Google Scholar] [CrossRef]
- Theoharidou, M.; Kotzanikolaou, P.; Gritza-Lis, D. Risk-based criticality analysis. IFIP Adv. Inf. Commun. Technol. 2009, 311, 35–49. [Google Scholar] [CrossRef] [PubMed]
- Piratla, K.R.; Ariaratnam, S.T. Criticality analysis of water distribution pipelines. J. Pipeline Syst. Eng. Pract. 2011, 2, 91–101. [Google Scholar] [CrossRef]
- Marlim, M.S.; Jeong, G.; Kang, D. Identification of critical pipes using a criticality index in water distribution networks. Appl. Sci. 2019, 9, 4052. [Google Scholar] [CrossRef]
- Lee, S.; Shin, S.; Judi, D.R.; McPherson, T.; Burian, S.J. Criticality Analysis of a water distribution system considering both economic consequences and hydraulic loss using modern portfolio theory. Water 2019, 11, 1222. [Google Scholar] [CrossRef]
- Jin, H.; Piratla, K.R. A resilience-based prioritization scheme for water main rehabilitation. J. Water Supply Res. Technol. AQUA 2016, 65, 307–321. [Google Scholar] [CrossRef]
- Ayala-Cabrera, D.; Piller, O.; Herrera, M.; Gilbert, D.; Deuerlein, J. Absorptive resilience phase assessment based on criticality performance indicators for water distribution networks. J. Water Resour. Plan. Manag. 2019, 145, 04019037. [Google Scholar] [CrossRef]
- He, X.; Yuan, Y. A framework of identifying critical water distribution pipelines from recovery resilience. Water Res. Manag. 2019, 33, 3691–3706. [Google Scholar] [CrossRef]
- Marsili, V.; Alvisi, S.; Maietta, F.; Capponi, C.; Meniconi, S.; Brunone, B.; Franchini, M. Extending the application of connectivity metrics for characterizing the dynamic behavior of water distribution networks. Water Resour. Res. 2023, 59, e2023WR035031. [Google Scholar] [CrossRef]
- Jung, D.; Lee, S.; Kim, J.H. Robustness and water distribution system: State-of-the-art review. Water 2019, 11, 974. [Google Scholar] [CrossRef]
- Giudicianni, C.; Di Nardo, A.; Di Natale, M. Topological taxonomy of water distribution networks. Water 2018, 10, 444. [Google Scholar] [CrossRef]
- Torres, J.M.; Duenas-Osorio, L.; Li, Q.; Yazdani, A. Exploring topological effects on water distribution system performance using graph theory and statistical models. J. Water Resour. Plan. Manag. 2017, 143, 04016068. [Google Scholar] [CrossRef]
- Yazdani, A.; Jeffrey, P. Water distribution system vulnerability analysis using weighted and directed network models. Water Resour. Res. 2012, 48, 6517. [Google Scholar] [CrossRef]
- Di Nardo, A.; Giudicianni, C.; Greco, R.; Herrera, M.; Santonastaso, G.F. Applications of graph spectral techniques to water distribution network management. Water 2018, 10, 45. [Google Scholar] [CrossRef]
- Shuang, Q.; Zhang, M.; Yuan, Y. Node vulnerability of water distribution networks under cascading failures. Reliab. Eng. Syst. Saf. 2014, 124, 132–141. [Google Scholar] [CrossRef]
- Zischg, J.; Rauch, W.; Sitzenfrei, R. Morphogenesis of urban water distribution networks: A spatiotemporal planning approach for cost-efficient and reliable supply. Entropy 2018, 20, 708. [Google Scholar] [CrossRef] [PubMed]
- Di Nardo, A.; Di Natale, M.; Giudicianni, C.; Greco, R.; Santonastaso, G.F. Complex network and fractal theory for the assessment of water distribution network resilience to pipe failures. Water Sci. Technol. Water Supply 2018, 18, 767–777. [Google Scholar] [CrossRef]
- Giudicianni, C.; Di Nardo, A.; Greco, R.; Scala, A. A community-structure-based method for estimating the fractal dimension, and its application to water networks for the assessment of vulnerability to disasters. Water Resour. Manag. 2021, 35, 1197–1210. [Google Scholar] [CrossRef]
- Aydin, N.Y.; Mays, L.; Schmitt, T. Sustainability assessment of urban water distribution systems. Water Resour. Manag. 2014, 28, 4373–4384. [Google Scholar] [CrossRef]
- Hernandez, E.; Ormsbee, L. Application of segment based robustness assessment for water distribution networks: (031). In Proceedings of the WDSA/CCWI Joint Conference Proceedings, Kingston, ON, Canada, 14 July 2018. [Google Scholar]
- Santonastaso, G.F.; Di Nardo, A.; Di Natale, M.; Giudicianni, C.; Greco, R. Scaling-laws of flow entropy with topological metrics of water distribution networks. Entropy 2018, 20, 95. [Google Scholar] [CrossRef] [PubMed]
- Faust, K.M.; Yang, E. Quantifying the impact of population dynamics on the structural robustness of water infrastructure using a structural hole influence matrix approach. ACS EST Water 2022, 2, 1161–1173. [Google Scholar] [CrossRef]
- Zhu, C.; Wang, X.; Zhu, L. A novel method of evaluating key nodes in complex networks. Chaos Solitons Fractals 2017, 96, 43–50. [Google Scholar] [CrossRef]
- Freeman, L.C. Centrality in social networks conceptual clarification. Soc. Netw. 1978, 1, 215–239. [Google Scholar] [CrossRef]
- Zarghami, S.A.; Gunawan, I. A Domain-specific measure of centrality for water distribution Networks. Eng. Const. Archit. Manag. 2020, 27, 341–355. [Google Scholar] [CrossRef]
- Wasserman, S.; Faust, K. Social Network Analysis: Methods and Applications; Cambridge University Press: Cambridge, UK, 1994. [Google Scholar]
- Van Rossum, G.; Drake, F.L., Jr. Python Tutorial; Centrum voor Wiskunde en Informatica: Amsterdam, The Netherlands, 1995. [Google Scholar]
- Klise, K.; Hart, D.; Moriarty, D.; Bynum, M.; Murray, R. Water Network Tool for Resilience (WNTR) User Manual; U.S. Environmental Protection Agency: Washington, DC, USA, 2017. [Google Scholar]
- Dandy, G. “06 Zhi Jiang”. International Systems. 2016. Available online: https://uknowledge.uky.edu/wdst_international/6/ (accessed on 8 December 2023).
- Clauset, A.; Newman, M.E.J.; Moore, C. Finding community structure in very large networks. Phys. Rev. E Stat. Phys. Plasmas Fluids Relat. Interdiscip. Top. 2004, 70, 6. [Google Scholar] [CrossRef]
- Todini, E. Looped water distribution networks design using a resilience index based heuristic approach. Urban. Water 2000, 2, 115–122. [Google Scholar] [CrossRef]
- Al-Hemairi, H.A.; Shakir, R.H. Minimizing leakage rates in water distribution networks through optimal valves settings. In Proceedings of the World Environmental and Water Resources Congress: Examining the Confluence of Environmental and Water Concerns, Omaha, NE, USA, 21–25 May 2006. [Google Scholar] [CrossRef]
Disclaimer/Publisher’s Note: The statements, opinions and data contained in all publications are solely those of the individual author(s) and contributor(s) and not of MDPI and/or the editor(s). MDPI and/or the editor(s) disclaim responsibility for any injury to people or property resulting from any ideas, methods, instructions or products referred to in the content. |
© 2024 by the authors. Licensee MDPI, Basel, Switzerland. This article is an open access article distributed under the terms and conditions of the Creative Commons Attribution (CC BY) license (https://creativecommons.org/licenses/by/4.0/).