Article

Spatial Distribution Patterns of Phytoplankton and Their Relationship with Environmental Factors in the Jinjiang River, China

1
Fujian Province Key Laboratory for the Development of Bioactive Material from Marine Algae, College of Resources and Environmental Sciences, Quanzhou Normal University, Quanzhou 362000, China
2
Guangdong Provincial Engineering Research Center of Intelligent Low-Carbon Pollution Prevention and Digital Technology, South China Normal University, Guangzhou 510006, China
3
SCNU (NAN’AN) Green and Low-Carbon Innovation Center, Nan’an SCNU Institute of Green and Low-Carbon Research, Quanzhou 362300, China
4
Estuarine and Coastal Zone Research Institute, Quanzhou Normal University, Quanzhou 362000, China
*
Author to whom correspondence should be addressed.
Water 2024, 16(11), 1497; https://doi.org/10.3390/w16111497
Submission received: 17 April 2024 / Revised: 18 May 2024 / Accepted: 20 May 2024 / Published: 24 May 2024

Abstract

:
Our study aims to investigate the water quality and distribution patterns of phytoplankton communities in the Jinjiang River Basin in Quanzhou, as well as their relationship with environmental factors. We integrated data from the national water quality databases of the two main tributaries of the West and East Jinjiang Rivers between 2020 and 2023, supplemented by field surveys. Redundancy analysis was used to explore the effect of environmental factors on phytoplankton communities. Our findings revealed that the West Jinjiang River experienced a significant influence from excessive fertilizer use in tea cultivation, leading to an increase in TN concentrations compared to the East Jinjiang River. The abundance of phytoplankton in the Jinjiang River Basin was 105 cells·L−1, with phytoplankton being dominated by Chlorophyta, Cyanphyta, and diatoms, accounting for an average of 50%, 20%, and 19% of the total phytoplankton abundance, respectively. Redundancy analysis indicated that temperature, pH, and nutrient concentrations were important factors influencing the phytoplankton communities. With increasing temperature and nutrients concentrations, the abundance of Chlorophyta and Dinophyta significantly increased. This study provides a solid foundation for the regular “health diagnosis” of crucial rivers and lakes in Quanzhou and supports the establishment of a health guarantee system for rivers and lakes.

1. Introduction

Phytoplankton play a crucial role in the material cycling and energy flow of aquatic ecosystems. The abundance and community structure of phytoplankton are highly responsive to fluctuations in environmental factors in aquatic environments [1]. Meanwhile, the quality of water is closely linked to changes in phytoplankton abundance and compositions. Water bodies with different trophic levels exhibit distinct characteristics in terms of phytoplankton species, abundances, and diversity indices [2]. These characteristics serve as important indicators for assessing the nutrient status of rivers, reservoirs, and other water bodies. Rivers, being significant subjects in watershed ecology, are heavily impacted by human activities, including changes in flow caused by dam construction, changes in land use types on both sides of the riverbank, as well as agricultural point and non-point source pollution [3,4]. According to the most recent annual report of “The Fifth Global Environment Outlook (GEO-5)” by the United Nations Environment Program, over 40% of water bodies worldwide are experiencing moderate to severe eutrophication. Eutrophication has emerged as a significant global and local issue due to its economic and ecological impacts, including the frequent occurrence of algal blooms that jeopardize the availability of safe drinking water [5,6,7]. Over half of the rivers in nearly 300 major river systems on Earth have been impacted to varying degrees by ongoing intensified human activities [8,9]. Most water bodies show a trend of increasing nitrogen-to-phosphorus ratios [10,11], with Chinese rivers being the most significantly affected typical river systems in the world today [12]. For instance, the nitrogen and phosphorus transport fluxes in the Yangtze River have increased by 17 times and 6.6 times, respectively, over the past 100 years [13], leading to a significant rise in nitrogen-to-phosphorus ratios compared to the past. Over the past 50 years, there has been a significant decrease in the number of river systems, leading to notable changes in the morphology of river channels in the Taihu Region, with channels becoming wider and straighter. Additionally, the structure of phytoplankton communities has tended to simplify due to population urbanization [14]. Consequently, a key characteristic of contemporary rivers is the increased flux and proportion of terrestrial nitrogen and phosphorus pollutants being transported to the sea. The excessive influx of nutrients alters the abundance and community structure of phytoplankton, thereby impacting the structure and function of the watershed [15,16].
Numerous studies have examined the community structure of phytoplankton in river basins and their influence factors. Previous studies have demonstrated that environmental factors such as nutrient concentrations, dissolved oxygen, water temperature, light intensity, and hydrological processes play a significant role in shaping phytoplankton communities in rivers [4,17,18,19]. Cyanobacteria have been associated with high water temperatures, while diatoms typically thrive in conditions with low water temperatures [20]. The seasonal variations of phytoplankton abundance and community are related with changes in water temperature. The growth of phytoplankton is also supported by the nutrients in the water; phytoplankton compositions have different needs for nutrients such as phosphorus and nitrogen [21]. Phytoplankton biomass and compositions vary in rivers with different nutrient forms [22], reflecting the trophic status of the water [23]. For instance, as human activities intensify in the rivers of Guizhou Province, phytoplankton biomasses increase, and communities shift from diatoms to Cyanophytes [22]. Variations of hydrological conditions such as water levels and residence times influence the availability of nutrients, and then affect phytoplankton growth and proliferation. Research by Liu has shown that nutrient changes drive variations in phytoplankton communities under high-flow velocity conditions, while dissolved organic matter plays a key role under low-flow velocity conditions [21]. Therefore, changes in the phytoplankton abundance and community structure can indicate changes in environmental factors and hydrological conditions [21]. Additionally, zooplankton grazing has a top-down control on phytoplankton [24,25]. Ecosystems reach equilibrium under specific conditions, and disruptions to this equilibrium caused by changes in certain factors may contribute to the occurrence of algal blooms. Understanding the distribution patterns of phytoplankton community structure and their relationships with environmental factors can provide insights into the ecological response of river ecosystems.
The Jinjiang River, an important source of water for the southeastern coastal region of Fujian, is located in the southeastern part of Fujian Province and consists of two major tributaries, namely, the East and West Jinjiang Rivers. Previous studies have mainly focused on the hydrological characteristics [26], water quality, non-point source pollution simulation, heavy metal pollution, and distribution patterns of plankton in the Jinjiang River [26,27,28,29,30]. These studies have elucidated the hydrochemical characteristics, spatial evolutions, and driving forces in the Jinjiang River basin [31], and found that variations in the water chemistry in the West Jinjiang River were primarily due to pollution from mines, domestic sources, and tea plantations, and pollution along the East Jinjiang River was from domestic sources. Changes in water chemistry occurred after the confluence of the West and East Jinjiang Rivers, primarily influenced by human activities and urban sewage. Additionally, variations in pH and nutrient concentrations in the Jinjiang River were observed [31], and the pollutants were mainly CODMn, NH3-N, and TP [31]. Furthermore, Chen has investigated the distributions of zooplankton in the Jinjiang River during normal, flood, and drought periods [27]. Their results show that the average abundance of zooplankton was 1644.3 ind L−1. The highest peak occurred in autumn, followed by winter, and the lowest abundance was observed in the spring. Protozoa and rotifers were the dominant groups in the Jinjiang River, accounting for 61.6% and 35.7% of the total zooplankton abundance in all seasons, respectively. Phytoplankton abundances ranged from 1.71 × 10⁵ ind L−1 to 3.57 × 10⁵ ind L−1, and phytoplankton were dominated with Bacillariophyta. Wu investigated the seasonal and spatial variations in the phytoplankton community structure in the Jinjiang River Estuary in the dry and rainy seasons [28]. They identified a total of 138 phytoplankton species, predominantly Chlorophyta, Bacillariophyta, and Cryptophyta in the dry season; however, in the rainy season, only Bacillariophyta were present. The species evenness and biodiversity index were higher in the rainy season, while species diversity was higher in the dry season in the Jinjiang River Estuary [28]. However, current studies were mainly limited to investigating the distribution patterns of plankton, and factors influencing the distribution of phytoplankton communities in the Jinjiang River have not been clarified.
Many studies have demonstrated the propensity for algal blooms to occur in river ecosystems during the spring season [32,33]. For instance, research has identified a high-risk period for algal bloom occurrence in the Hanjiang River extending from mid-February to early March [32]. The dinoflagellate and diatoms blooms in the tributaries of the Three Gorges reservoir have been observed in the early spring, coinciding with rising temperatures and ample sunlight [33]. Algal blooms of Peridiniopsis penardii have been documented in the Jiulong River [19,34]. However, in the early spring, with the increase of water temperature, it is not clear whether algal blooms will occur in the Jinjiang River Basin, and the distribution patterns of phytoplankton abundance and community structure and its relationship with environmental factors have not been well elucidated. Therefore, based on the integration and analyses of existing national water quality data from the Jinjiang River Basin, as well as field sampling investigations in the two main tributaries of the East and West Jinjiang Rivers in the early spring, this study aims to explore the differences in water quality in the two main tributaries of the Jinjiang River due to the different pollutions, to describe the distribution patterns of phytoplankton abundance and communities, and to analyze their relationships with environmental factors, which further provide basic data and evidence for the ecological protection and high-quality development of the Jinjiang River Basin.

2. Materials and Methods

2.1. Study Area

This research was conducted at the Jinjiang River, which is located in Quanzhou City, Fujian Province, with coordinates ranging from 117.733° E to 118.783° E longitude and 24.517° N to 25.533° N latitude. It is formed by the convergence of two major tributaries, the west and east rivers. The West Jinjiang River has a basin area of 3101 km2 and a river length of approximately 152 km. It flows through Yongchun, Anxi, and Nan’an City before joining the main stream of Jinjiang at Shuangxi Mouth. The East Jinjiang River originates from Jiandou Township in Yongchun County, with a total length of 120 km and a basin area of 1917 km2. The Jinjiang River basin has a subtropical marine monsoon climate with significant seasonal variations in precipitation and temperature. The average annual temperature ranges from 17 to 21 °C, and the average annual precipitation ranges from 1200 to 1900 mm. In this study, data on temperature, pH, dissolved oxygen (DO), conductivity, total phosphorus (TP), and total nitrogen (TN) were collected from the national water quality data on the two main tributaries, west (Luonei Bridge, Anxi, Jinjiang River) and east rivers (Kangmei Bridge, Nan’an, Jinjiang River) from 17 December 2020 to 17 November 2023. Sampling points were selected based on the distribution of the Jinjiang water system to obtain representative environmental and biological information.

2.2. Sample Collection and Analysis

The investigation of the East Jinjiang River was conducted on 28 February 2023, at four stations (R1, R3, R4, and R5), from northwest to southeast. The investigation of the West Jinjiang River, as the main stream of the Jinjiang River, was conducted on 22 March 2023, at nine stations (R8, R9, R10, R11, R12, R13, R13 tributary, R14, and R15) in total. Two stations (R16 and R17) were selected in the main stream of the Jinjiang River (Figure 1). In the Jinjiang River Basin, field sampling was conducted by recording the latitude and longitude of the survey section using GPS software (web.gpstool.com, format: accessed on 22 March 2023). On-site indicators such as water temperature, conductivity, pH, and dissolved oxygen (DO) were measured using the portable multi-parameter water quality analyzer HQ440d (HACH, Colorado, USA). Multiple measurements were taken, and the average values were recorded. Water samples were collected using a water sampler and stored in a portable freezer sampling box for transportation back to the laboratory. Nutrient samples were filtered using a vacuum pump and a Whatman GF/F membrane, which had been treated at a high temperature of 450 °C for 6 h. The filtrate was then stored in polyethylene bottles that had been soaked in a 0.1 mol·L−1 HCl solution for 24 h, rinsed, and dried. The samples were immediately frozen and stored in a −20 °C freezer. The parameters of nutrients were determined using the QuAAtro39 Continuous segmented flow analyzer(SEAL, Germany). The detection limits for dissolved reactive phosphorus (DRP), nitrate nitrogen (NO3-N), nitrous nitrogen (NO2-N), and dissolved silicate (DSi) were 0.0006 mg·L−1, 0.0004 mg·L−1, 0.0001 mg·L−1, and 0.0011 mg·L−1, respectively. The concentration of NOX-N is the sum of nitrate nitrogen and nitrous nitrogen.
The phytoplankton samples were collected, processed, and analyzed following the guidelines outlined in the National Environmental Standards of the People’s Republic of China, specifically the “Determination of Phytoplankton in Water-Microscopic Counting Method with 0.1 mL Counting Chamber” (HJ 1216-2021) [35]. To obtain quantitative samples, 0.5 L of water sample was collected in the field and treated with 1% Lugol’s reagent for fixation. After allowing the phytoplankton to settle for at least 48 h, the samples were taken to the laboratory for microscopic examination. The samples were concentrated to 30 mL for determination. For counting, 0.1 mL of concentrated sample was placed onto a 0.1 mL (20 mm × 20 mm) counting chamber and enumerated in an optical microscope (400 × magnification, Jiang’nan, China) with three replicates. The seven microalgae groups included Dinophyta, Diatoms, Cyanophyta, Chlorophyta, Euglenophyta, Cryptophyta, and others. The phytoplankton abundances (cells L−1) were calculated by using Equation (1):
N = A A c   ×   V 1 V 0   ×   n V   ×   1000
where N is microalgae abundance per liter of the water sample (cells·L−1), A and Ac refer to the area of counting chamber (mm2) and the counting area (mm2), respectively, V0 and V1 represent water sample volume and concentrated sample volume (mL), respectively, V refers to the volume (0.1 mL) of counting chamber, and n is the number of phytoplankton within the counting area (cells).

2.3. Data Analysis

In this study, we removed outliers from the data collected from the national water quality dataset at the West and East Jinjiang River monitoring points from 17 December 2020 to 17 November 2023. We calculated the monthly average values to explore variations in environmental factors over multiple years in the Jinjiang River Basin. We used R software version 4.2.1 (R Development Core Team, 2022 [36]) for data processing and plotting. To analyze the relationship between phytoplankton groups such as Dinophyta, diatoms, Cyanophyta, Chlorophyta, Euglenophyta, Cryptophyta, and others, and environmental factors including temperature, NOX-N, DRP, DSi, pH, and DO, the redundancy analysis (RDA) was conducted using the “Vegan” package in R software.

3. Results

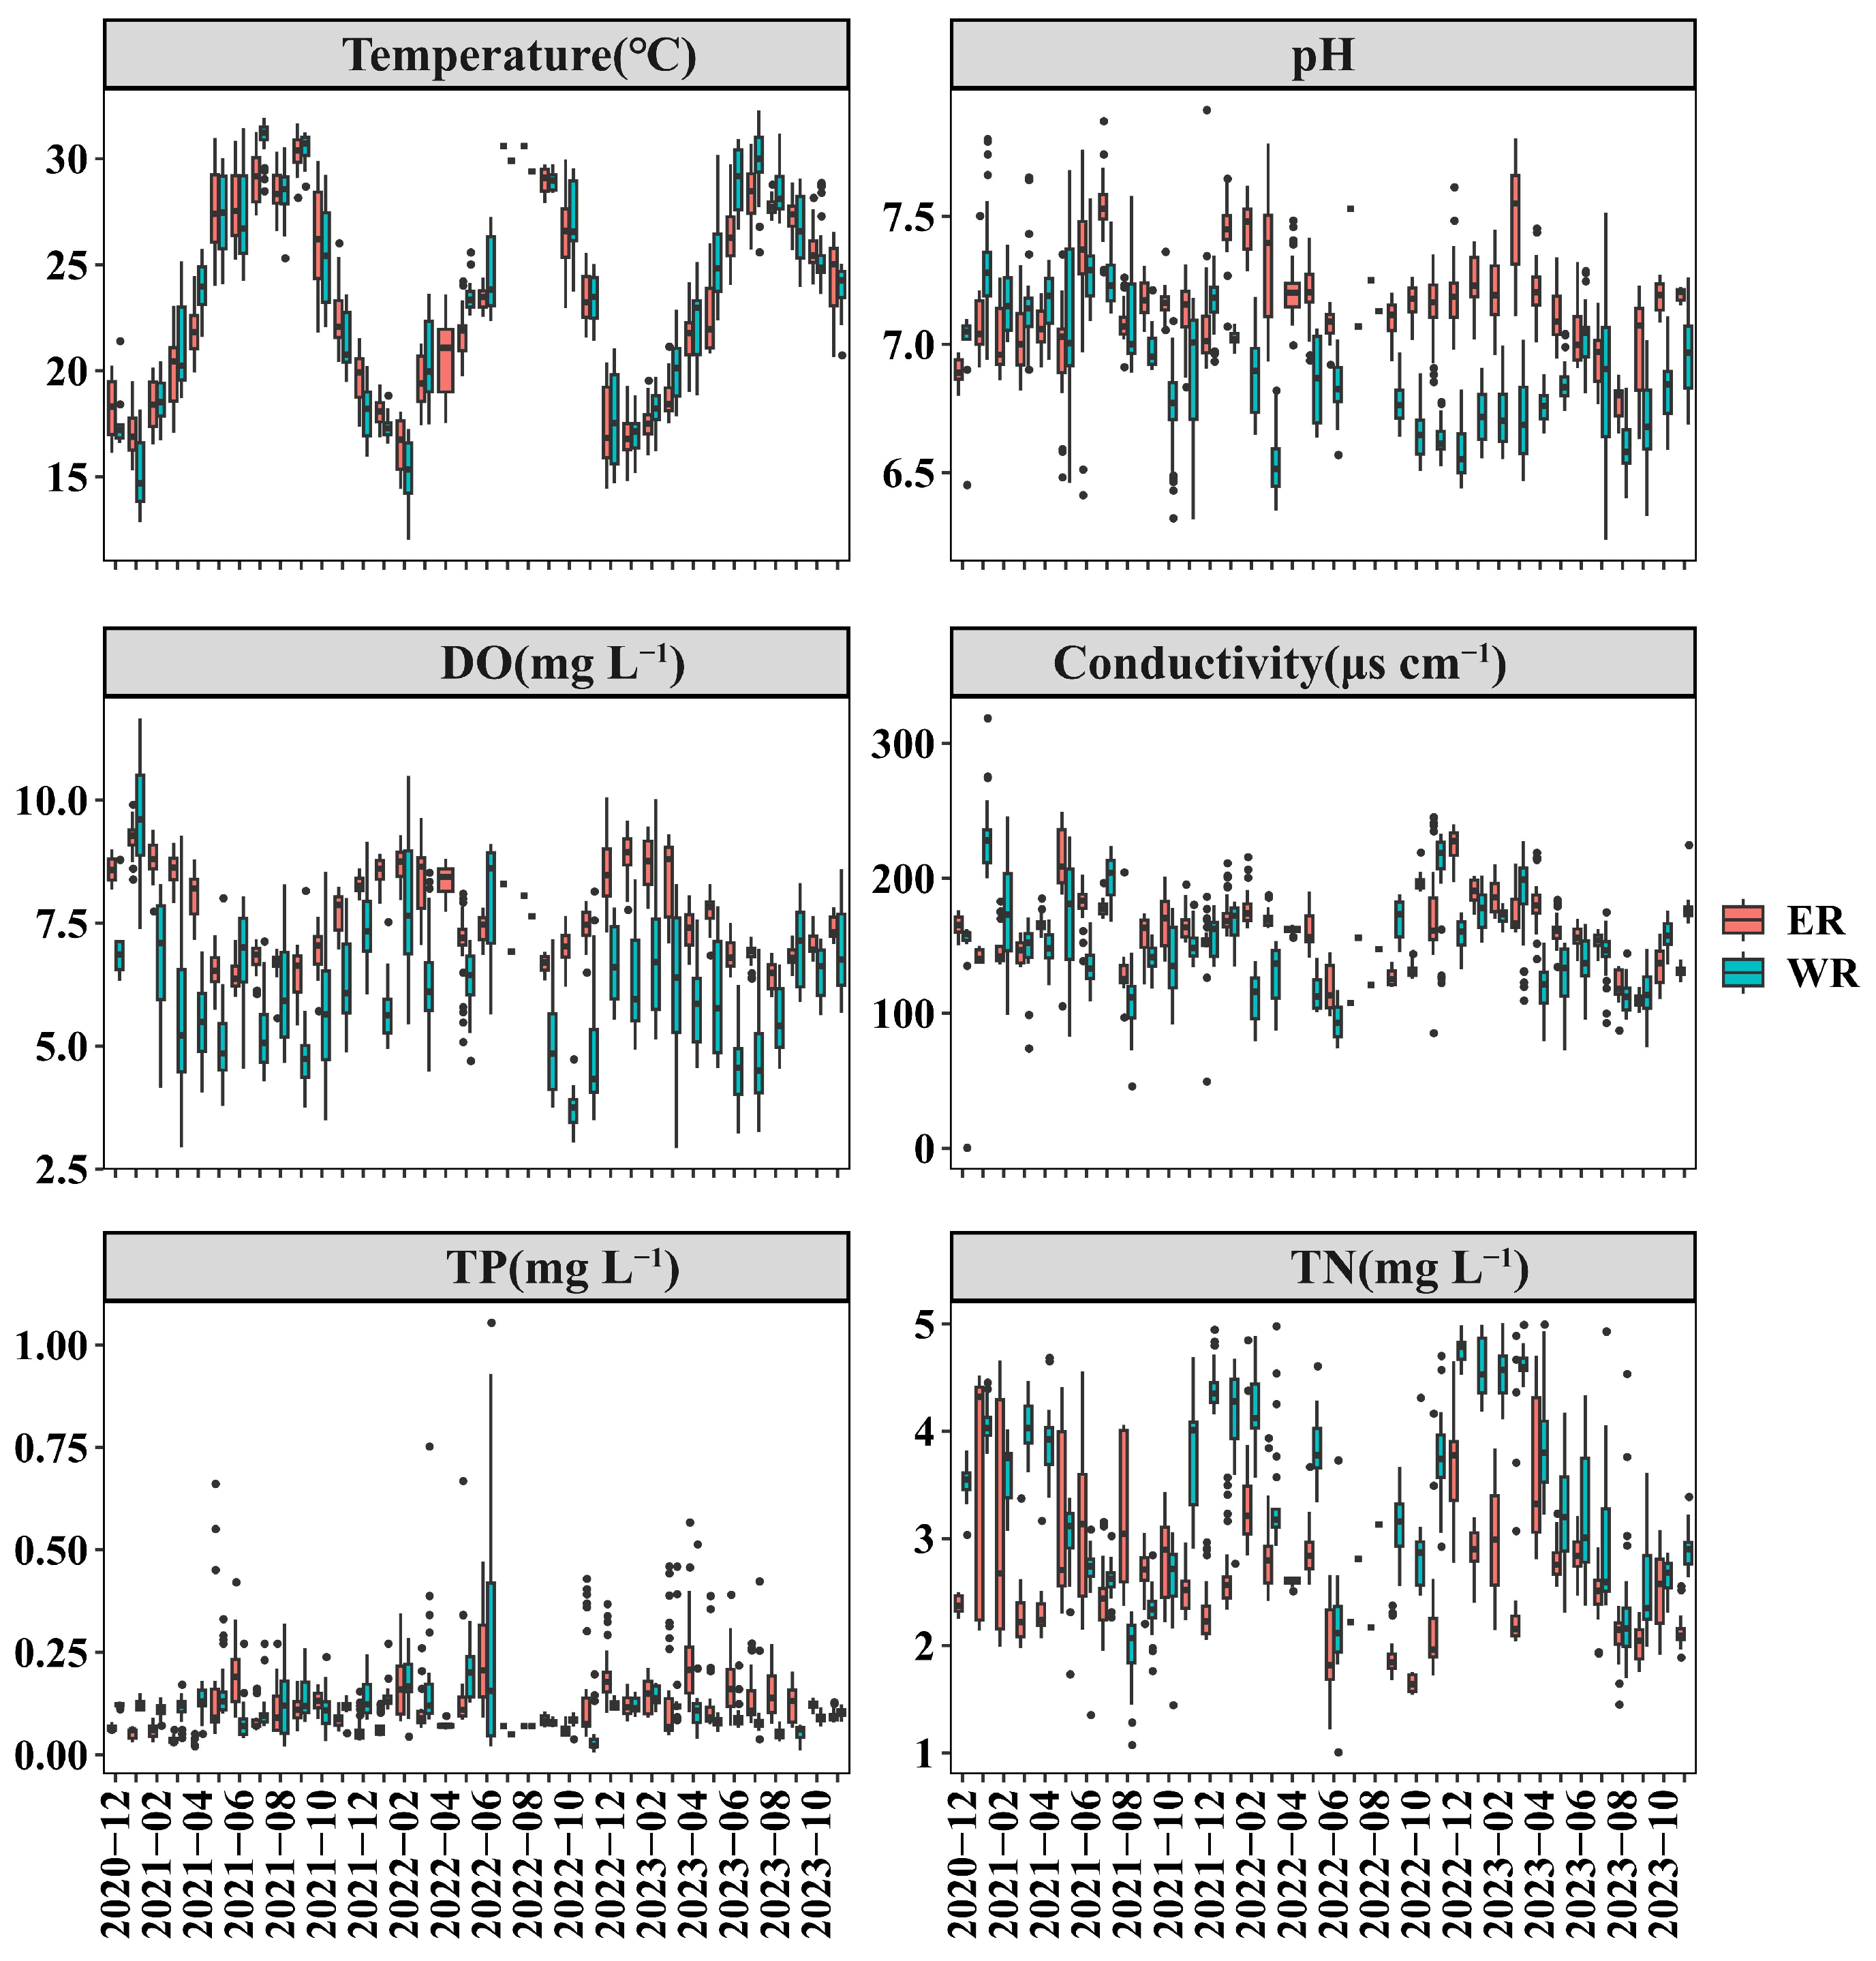
3.1. Seasonal Variations of Environmental Factors in the Jinjiang River

In order to gain a deeper understanding of the variations and disparities in environmental factors between the two primary tributaries of the Jinjiang River, data from the national water quality dataset at the Luonei Bridge in the West Jinjiang River and the Kangmei Bridge in the East Jinjiang River was collected and analyzed from 17 December 2020 to 17 November 2023. Temperature in the Jinjiang River Basin ranged from 12.02 to 32.28 °C (mean ± standard deviation: 23.14 ± 3.97 °C). Both the West and East Jinjiang Rivers experienced similar seasonal variations in temperature, with higher temperatures in summer and lower temperatures in winter (Figure 2). However, pH and DO levels in the West Jinjiang River were significantly lower than those in the East Jinjiang River (Wilcox test, p < 0.05). pH in the West Jinjiang River ranged from 6.23 to 7.80, while in the East Jinjiang River, it ranged from 6.41 to 7.91, showing significant seasonal variations with higher values in the spring. Conversely, seasonal variations of DO (6.91 ± 2.83 mg·L−1) and conductivity (156.67 ± 64.31 μS·cm−1) were opposite to that of temperature, with lower values in summer and higher values in winter. The average concentration of TP in the Jinjiang River Basin was 0.117 mg·L−1, and there was no significant difference in TP concentrations between the West and East Jinjiang Rivers (Wilcox test, p > 0.05), with the highest TP concentrations (1.05 mg·L−1) having occurred in the West Jinjiang River on 10 June 2022. However, TN concentrations in the Jinjiang River Basin ranged from 1.00 to 5.00 mg·L−1, with higher TN concentrations in West Jinjiang River (3.38 ± 1.61 mg·L−1) compared to East Jinjiang River (2.68 ± 1.17 mg·L−1) (Wilcox test, p < 0.05; Figure 2).

3.2. Physicochemical Characteristics in the Jinjiang River in the Early Spring of 2023

Our field surveys in the early spring of 2023 revealed the following findings: Water temperature in the Jinjiang River Basin ranged from 17.40 to 34.10 °C (23.03 ± 4.68 °C). The value of pH ranged from 7.75 to 9.46 (8.32 ± 0.41). DO ranged from 7.18 to 13.09 mg·L−1 (8.64 ± 1.56 mg·L−1). Conductivity varied from 28.50 to 578 μS·cm−1, with an average conductivity of 209.8 μS·cm−1.
In the early spring of 2023, we also measured the concentrations of NOX, DRP, and DSi in the Jinjiang River Basin (Figure 3). Nitrate nitrogen concentrations ranged from 0.539 to 2.504 mg·L−1. DRP concentrations ranged from 0.003 to 0.131 mg·L−1. DSi concentrations ranged from 1.775 to 11.905 mg·L−1. Comparing the East Jinjiang River with mean NOx concentration of 1.882 mg·L−1 and DRP concentration of 0.068 mg·L−1, we found that NOX (mean ± standard deviation: 1.177 ± 0.488 mg·L−1) and DRP concentrations (mean ± standard deviation: 0.016 ± 0.012 mg·L−1) were significantly lower in the East Jinjiang River. In contrast, there was no difference in the silicate concentration between the two main tributaries of the Jinjiang River.

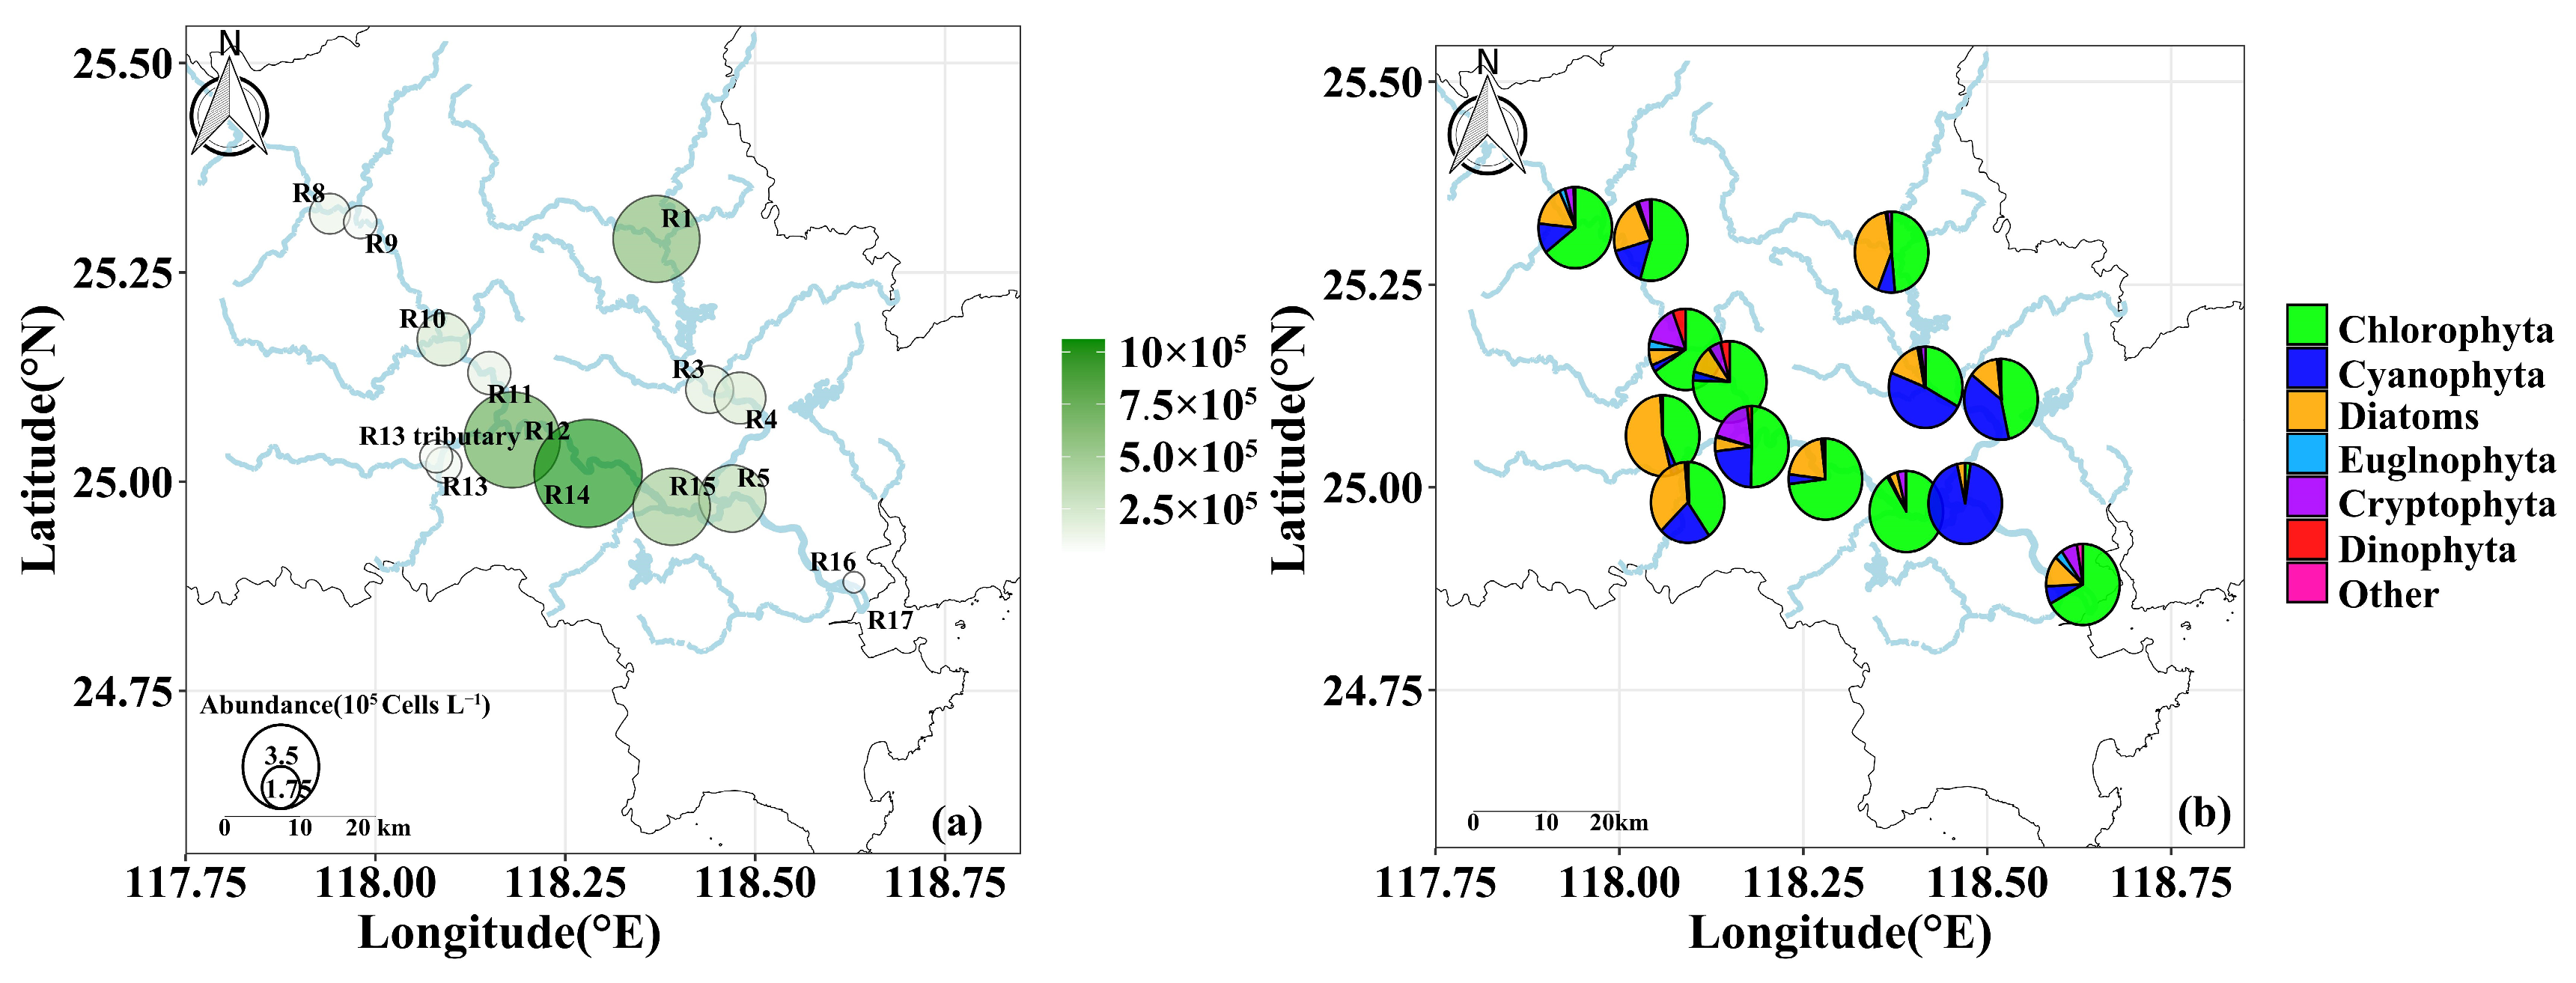
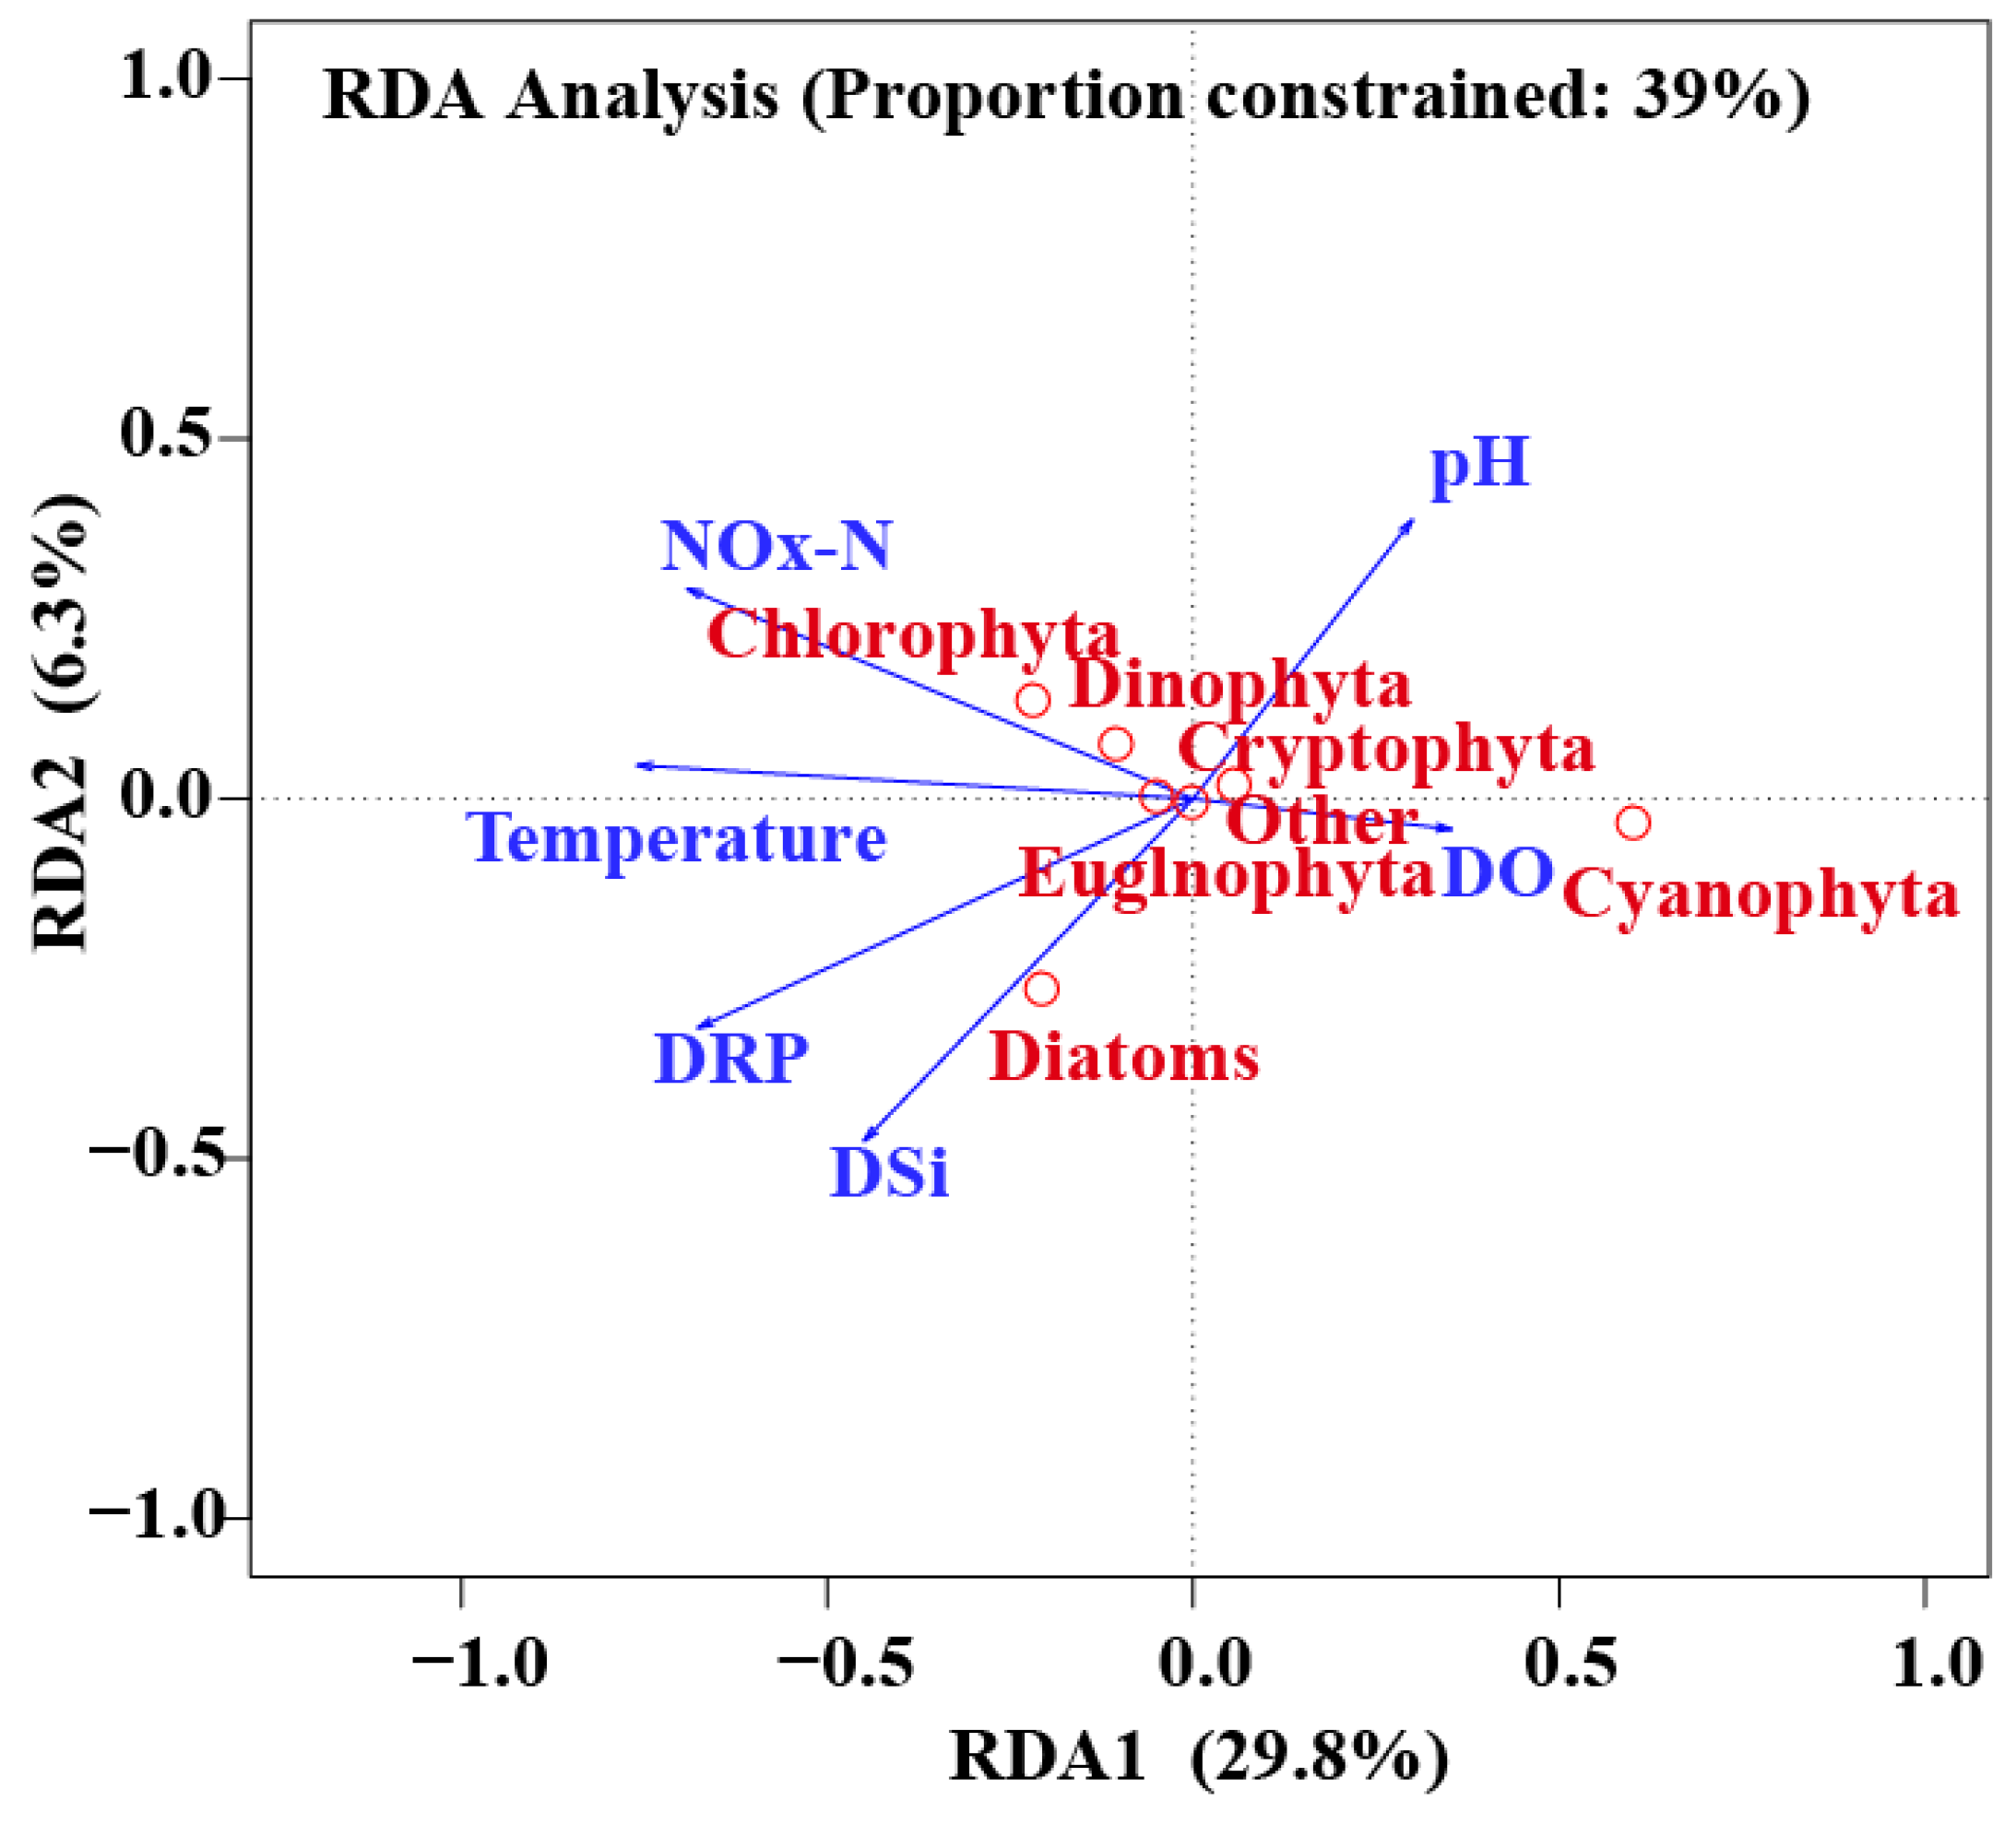
3.3. Distribution Patterns of Phytoplankton Communities and Their Influencing Factors in the Jinjiang River during the Early Spring of 2023

In the early spring of 2023, the abundance of phytoplankton ranged from 2.55 × 10⁴ cells·L−1 to 7.41 × 10⁵ cells·L−1 (Figure 4a). The dominant groups of the phytoplankton community were Chlorophyta, Cyanophyta, and diatoms, which accounted for approximately 50%, 20%, and 19% of the total phytoplankton abundance, respectively. At specific sampling sites, such as R15, Chlorophyta were the most abundant group, representing 91% of the total phytoplankton abundance. Conversely, at R5, Cyanophyta dominated and accounted for 94% of the total phytoplankton abundance. The dominant genera within Chlorophyta were Chlamydomonas, Scenedesmus, Staurastrum, and Cosmarium, while within Cyanobacphyta, they were Microcystis, Oscillatoria, and Anabaena. Diatoms accounted for 4%–53% of the total phytoplankton abundance, with dominant genera including Cyclotella, Fragilaria, and Navicula. Cryptophyta, represented by Cryptomonas and Cryptophyceae, accounted for up to 16% of the total phytoplankton abundance (Figure 4b).
The redundancy analysis (RDA) was conducted to examine the relationship between phytoplankton compositions and environmental parameters such as water temperature, pH, DO, and nutrient concentrations (Figure 5). The environmental parameters accounted for 39% of variations in phytoplankton in the Jinjiang River Basin. The first and second axes of RDA explained 29.8% and 6.3% of the total variances, respectively. Cyanophyta were found on the right side of the first RDA axis and were positively correlated with pH and DO. On the other hand, Chlorophyta, diatoms, and Dinophyta were located on the left side of the first RDA axis and were more influenced by temperature and nutrient concentrations. Chlorophyta and Dinophyta showed clear positive correlations with temperature and NOX-N, while diatoms exhibited a positive correlation with DSi. Cryptophyta, Euglnophyta, and other groups were positioned in the middle of the RDA plot, indicating their lower abundance and lesser susceptibility to environmental changes in the Jinjiang River.

4. Discussion

Based on the national water quality data and field investigations conducted in the East and West Jinjiang Rivers between 2020 and 2023, it was observed that the pH and DO values in the East Jinjiang River were significantly higher than those in the West Jinjiang River, while the nutrient concentrations showed the opposite trend. These findings aligned with the results obtained by Zhu et al. (2024) [31]. The differences in pH values between the West and East Jinjiang Rivers may be attributed to variations in water chemistry in the two watersheds, which showed that the water chemistry in the East Jinjiang River was dominated with an abundance of HCO3 Ca type, and the water in the West Jinjiang River was rich in SO42− [31]. Furthermore, the relatively high nutrient concentrations in the West Jinjiang River could be linked to the extensive use of fertilizers in the tea plantations surrounding the river, as well as domestic and mine pollution [31]. TN and TP concentrations in the Jinjiang River, during early spring, often exceeded eutrophication thresholds. Comparing to other river systems, such as the Han River, with TN ranging from 1.6 to 2.6 mg·L−1 and TP ranging from 0.06 to 0.30 mg·L−1 [37], and the Jiulong River, with TN varing from 0.10 to 7.0 mg·L−1 and TP ranging from 0.03 to 0.99 mg·L−1, the nutrient concentrations in the Jinjiang River were found to be similar.
The abundance and compositions of phytoplankton in aquatic environments were highly sensitive to the environmental changes, and strongly linked to water health. Phytoplankton serve as indicators to assess water quality. In the early spring of 2023, in the Jinjiang River Basin, phytoplankton abundance ranged from 104 cells·L−1 to 105 cells·L−1, which was lower than the algal blooms with algal abundance exceeding 107 cells·L−1 [32]. Variations in phytoplankton abundance were observed among different sampling stations (Figure 4). These differences may be attributed to water pollution levels and hydrological conditions in the Jinjiang River. Despite the presence of abundant nutrients in the Jinjiang River, relatively low phytoplankton abundances were also observed. Studies have indicated that while excess nutrients are necessary for algal blooms, they may not be the primary limiting factor in most river algal bloom events [38]. This may be attributed to the hydrologic conditions in the Jinjiang River. Furthermore, in the Jingjiang River, the dominant phytoplankton groups included diatoms, Chlorophyta and Cyanphyta, and their dominant species of phytoplankton, including Synedra acus, Melosira granulate, Chamydomonas sp., Microcystis sp., and pseudoanabaena, indicate the β-mesopolluted water. These findings suggested that the water quality in the Jinjiang River Basin is poor and heavily polluted.
Phytoplankton communities in the Jinjiang River were influenced by water temperature, pH, and nutrient concentrations. Changes in environmental conditions due to pollution were identified as the main factors driving shifts in phytoplankton communities in river and lake ecosystems, leading to distinct variations in community structures among different water bodies. Various studies have examined the phytoplankton community structure in specific rivers. For instance, Dai et al. (2021) conducted a study investigating the phytoplankton community structure in three rivers with varying nutrient levels in Guizhou Province. Their findings revealed that the Jinjiang River exhibited mesotrophic characteristics, with diatoms as the predominant phytoplankton group. In contrast, the Xiangjiang River also showed mesotrophic conditions, with Cyanophyta, Chlorophyta, and diatoms dominating the phytoplankton community [22]. The Nan’ming River, on the other hand, was characterized as eutrophic, with Cyanophyta comprising the majority of the algal density. The RDA analysis in our study showed that temperature, pH, and nutrient concentrations were important factors that affect the phytoplankton compositions. Cyanophyta have a negative correlation with nutrient parameters, which is consistent with the findings of Hou et al. (2022), and have a positively relationship with pH [39]. This finding was consistent with the conditions in the West Jinjiang River, with a higher pH and Cyanophyta abundance. Previous studies have shown that it is difficult for Cyanophyta to form blooms in acidic water bodies, and even in mildly acidic waters, whereas an alkaline environment would favor the growth of Cyanophyta and induce the formations of cyanobacterial bloom [40]. Moreover, certain species of Cyanophyta, like Microcystis aeruginosa, were K-strategist species. These species tend to dominate when nitrogen concentrations and the nitrogen-to-phosphorus ratio are low [41], which explains why Cyanophyta dominated in the East Jinjiang River. Chlorophyta and Dinophyta, on the other hand, showed a significant positive correlation with temperature and NOX-N, indicating that their abundances would increase with an increase in temperature. However, as temperature increases, Dinophyta are unable to outcompete Chlorophyta [19], possibly due to the fast growth of Chlorophyta and their efficient nutrient absorptions [42]. The concentration of dissolved silicate was closely related to diatoms, suggesting their reliance on silicate for synthesizing their siliceous shells. Furthermore, diatoms have a good adaptability to high disturbance environments [19], which explained the high abundances in the rivers. Cryptophyta, euglnophyta, and other groups are close to the middle of the RDA plot, which was associated with a low abundance in the Jinjiang River. Additionally, although this study did not consider hydrological processes such as water levels and flow velocity, they are known to impact the abundance and composition of phytoplankton [36,43]. For instance, an algae bloom in the Han River was associated with water levels [36]. In the upper reaches of the Pearl River, Chlorophyta dominated the phytoplankton community during dry periods, while Cyanophyta prevailed during flood periods, transitioning to a community of diatoms and Cyanophyta downstream [44]. These findings underscore the significant relationship between phytoplankton community structure and the trophic status of water bodies, suggesting that differences in nutrient levels may account for variations in phytoplankton composition. This highlights the importance of considering hydrological processes, such as river water levels, in addressing algae blooms.
In summary, the environmental factors in the East and West Jinjiang Rivers exhibited differences, inflected by variations in pH, DO, and nutrient levels, and resulting in shifts in phytoplankton biomass and community composition. Effective management of river water quality is crucial for ensuring safe drinking water and sustainable water resource utilization. The Jinjiang River, particularly the west section, is characterized by the abundant nutrient concentrations attributed to pollution sources such as from mines, domestic sources, and tea plantations. To address this issue, it is essential to enhance wastewater treatment, reduce sewage discharge, and adopt more sustainable practices for chemical fertilizer use along the Jinjiang River. Therefore, the strategies of decreasing the exogenous input of nutrients, especially nitrogen, into the Jinjiang River should be considered for controlling the eutrophication. Furthermore, long-term ecological monitoring of the Jinjiang River is essential for effective management and conservation efforts.

5. Conclusions

Based on the integration of the national water quality data from the East and West Jinjiang Rivers, along with field surveys, it was evident that the nutrient concentrations in the West Jinjiang River were significantly higher than that in the East Jinjiang River. In early spring, the water quality in the Jinjiang River Basin was categorized as β-moderately polluted, with a phytoplankton abundance of 104–105 cells·L−1. The dominant phytoplankton groups in the West Jinjiang River were Cyanophyta, Chlorophyta, and diatoms, while in the East Jinjiang River, the dominant groups were Chlorophyta and diatoms. The main factors influencing the composition of the phytoplankton community in the river basin were temperature, pH, and nutrient concentrations. According to the current states of phytoplankton communities and water environment research in the Jinjiang River Basin, it is crucial to regulate the inflow of external nutrients like nitrogen and phosphorus, enhance aquatic ecological monitoring, investigate the influencing factors, analyze the evolution patterns of the aquatic ecosystem in the Jinjiang River Basin, and mitigate aquatic ecological risks. These efforts are essential for protecting the water environment in the Jinjiang River Basin.

Author Contributions

Conceptualization, Y.Z. and M.C.; methodology, Y.Z. and S.Z.; software, Y.Z.; formal analysis, X.C., S.W. and Z.C.; investigation, M.C., J.C. and X.C.; data curation, X.C. and Y.Z.; writing—original draft preparation, S.Z.; writing—review and editing, J.C., Y.Z. and S.Z.; funding acquisition, Y.Z. and S.Z. All authors have read and agreed to the published version of the manuscript.

Funding

This work was supported by the Natural Science Foundation of Fujian province, China (2022J05225; 2022J05226), and funded by the Research Fund Program of Guangdong Provincial Engineering Research Center of Intelligent Low-Carbon Pollution Prevention and Digital Technology/ SCNU (NAN’AN) Green and Low-Carbon Innovation Center (2024K13).

Data Availability Statement

The processed data have doi: 10.17605/OSF.IO/4U2PM and can be obtained from https://osf.io/4u2pm/files/osfstorage.

Acknowledgments

We appreciate the captains and crew of the R/V Shanmei for their assistance with collecting our samples. We would also like to thank the researchers for their assistance with the sample analysis.

Conflicts of Interest

The authors declare no conflicts of interest.

References

  1. Yang, W.; Zheng, Z.; Zheng, C.; Lu, K.; Ding, D.; Zhu, J. Temporal variations in a phytoplankton community in a subtropical reservoir: An interplay of extrinsic and intrinsic community effects. Sci. Total Environ. 2018, 612, 720–727. [Google Scholar] [CrossRef] [PubMed]
  2. Umi, W.A.D.; Yusoff, F.M.; Balia Yusof, Z.N.; Ramli, N.M.; Sinev, A.Y.; Toda, T. Composition, Distribution, and Biodiversity of Zooplanktons in Tropical Lentic Ecosystems with Different Environmental Conditions. Arthropoda 2024, 2, 33–54. [Google Scholar] [CrossRef]
  3. Van Meter, K.; Thompson, S.E.; Basu, N.B. Human impacts on stream hydrology and water quality. In Stream Ecosystems in a Changing Environment; Academic Press: Cambridge, MA, USA, 2016; pp. 441–490. [Google Scholar]
  4. Zhou, Y.J.; Zhang, Y.Y.; Liang, T.; Wang, L.Q. Shifting of phytoplankton assemblages in a regulated Chinese river basin after streamflow and water quality changes. Sci. Total Environ. 2019, 654, 948–959. [Google Scholar] [CrossRef]
  5. Le, C.; Zha, Y.; Li, Y.; Sun, D.; Lu, H.; Yin, B. Eutrophication of Lake Waters in China: Cost, Causes, and Control. Environ. Manag. 2010, 45, 662–668. [Google Scholar] [CrossRef]
  6. Xia, R.; Zhang, Y.; Critto, A.; Wu, J.; Fan, J.; Zheng, Z.; Zhang, Y. The Potential Impacts of Climate Change Factors on Freshwater Eutrophication: Implications for Research and Countermeasures of Water Management in China. Sustainability 2016, 8, 229. [Google Scholar] [CrossRef]
  7. Akinnawo, S. Eutrophication: Causes, consequences, physical, chemical and biological techniques for mitigation strategies. Environ. Chall. 2023, 12, 100733. [Google Scholar] [CrossRef]
  8. Lehner, B.; Liermann, C.R.; Revenga, C.; Vörösmarty, C.; Fekete, B.; Crouzet, P.; Döll, P.; Endejan, M.; Frenken, K.; Magome, J.; et al. High-resolution mapping of the world’s reservoirs and dams for sustainable river-flow management. Front. Ecol. Environ. 2011, 9, 494–502. [Google Scholar] [CrossRef]
  9. Howarth, R.; Swaney, D.; Billen, G.; Garnier, J.; Hong, B.; Humborg, C.; Johnes, P.; Mörth, C.-M.; Marino, R. Nitrogen fluxes from the landscape are controlled by net anthropogenic nitrogen inputs and by climate. Front. Ecol. Environ. 2012, 10, 37–43. [Google Scholar] [CrossRef] [PubMed]
  10. Beusen, A.; Bouwman, A.; Van Beek, L.; Mogollón, J.; Middelburg, J. Global riverine N and P transport to ocean increased during the 20th century despite increased retention along the aquatic continuum. Biogeosciences 2016, 13, 2441–2451. [Google Scholar] [CrossRef]
  11. Du, E.; Terrer, C.; Pellegrini, A.; Ahlström, A.; Lissa, C.; Zhao, X.; Xia, N.; Wu, X.; Jackson, B. Global patterns of terrestrial nitrogen and phosphorus limitation. Nat. Geosci. 2020, 13, 221–226. [Google Scholar] [CrossRef]
  12. Li, L.; Ni, J.; Chang, F.; Yue, Y.; Frolova, N.; Magritsky, D.; Borthwick, A.; Ciais, P.; Wang, Y.; Zheng, C.; et al. Global trends in water and sediment fluxes of the world’s large rivers. Sci. Bull. 2019, 65, 62–69. [Google Scholar] [CrossRef] [PubMed]
  13. Liu, X.; Beusen, A.; Van Beek, L.; Mogollón, J.; Ran, X.; Bouwman, A. Exploring spatiotemporal changes of the Yangtze River (Changjiang) nitrogen and phosphorus sources, retention and export to the East China Sea and Yellow Sea. Water Res. 2018, 142, 246–255. [Google Scholar] [CrossRef] [PubMed]
  14. Deng, X.; Xu, Y.; Han, L.; Song, S.; Yang, L.; Li, G.; Wang, Y. Impacts of Urbanization on River Systems in the Taihu Region, China. Water 2015, 7, 1340–1358. [Google Scholar] [CrossRef]
  15. Yang, H.; Flower, R.J.; Thompson, J.R. Sustaining China’s water resources. Science 2013, 339, 141. [Google Scholar] [CrossRef] [PubMed]
  16. Peng, X.; Zhang, L.; Li, Y.; Lin, Q.; He, C.; Huang, S.; Wu, Z. The changing characteristics of phytoplankton community and biomass in subtropical shallow lakes: Coupling effects of land use patterns and lake morphology. Water Res. 2021, 200, 117235. [Google Scholar] [CrossRef]
  17. Bowes, M.J.; Gozzard, E.; Johnson, A.C.; Scarlett, P.M.; Roberts, C.; Read, D.S.; Armstrong, L.K.; Harman, S.A.; Wickham, H.D. Spatial and temporal changes in chlorophyll-a concentrations in the River Thames basin, UK: Are phosphorus concentrations beginning to limit phytoplankton biomass? Sci. Total Environ. 2012, 426, 45–55. [Google Scholar] [CrossRef] [PubMed]
  18. Scofield, A.E.; Watkins, J.M.; Osantowski, E.; Rudstam, L.G. Deep chlorophyll maxima across a trophic state gradient: A case study in the Laurentian Great Lakes. Limnol. Oceanogr. 2020, 65, 2460–2484. [Google Scholar] [CrossRef] [PubMed]
  19. Zhong, Y.; Su, Y.; Zhang, D.; She, C.; Chen, N.; Chen, J.; Yang, H.; Balaji-Prasath, B. The spatiotemporal variations in microalgae communities in vertical waters of a subtropical reservoir. J. Environ. Manag. 2022, 317, 115379. [Google Scholar] [CrossRef] [PubMed]
  20. Jeong, K.S.; Recknagel, F.; Joo, G.J. Prediction and elucidation of population dynamics of the blue-green algae Microcystis aeruginosa and the diatom Stephanodiscus hantzschii in the Nakdong River-Reservoir System (South Korea) by a recurrent artificial neural network. In Ecological Informatics; Springer: Berlin/Heidelberg, Germany, 2006. [Google Scholar]
  21. Liu, Q.; Jiang, Y.; Huang, X.; Liu, Y.; Guan, M.X.; Tian, Y.L. Hydrological conditions can change the effects of major nutrients and dissolved organic matter on phytoplankton community dynamics in a eutrophic river. J. Hydrol. 2024, 628, 130503. [Google Scholar] [CrossRef]
  22. Dai, L.L.; Lü, J.C.; Zhou, W.C.; Liu, C.H.; Hu, X.J.; Yuan, G. Phytoplankton’s community structure and its relationships with environmental factors in three rivers with different nutrition levels. Acta Ecol. Sin. 2021, 41, 1242–1250, (In Chinese with English abstract). [Google Scholar]
  23. Yang, J.; Chan, K.M.; Gong, J. Seasonal variation and the distribution of endocrine-disrupting chemicals in various matrices affected by algae in the eutrophic water environment of the pearl river delta China. Environ. Pollut. 2020, 263, 114462. [Google Scholar] [CrossRef] [PubMed]
  24. Lofton, M.E.; Leach, T.H.; Beisner, B.E.; Carey, C.C. Relative importance of top-down vs. bottom-up control of lake phytoplankton vertical distributions varies among fluorescence-based spectral groups. Limnol. Oceanogr. 2020; 65, 2485–2501. [Google Scholar]
  25. Rodríguez-Gálvez, S.; Macías, D.; Prieto, L.; Ruiz, J. Top-down and bottom-up control of phytoplankton in a mid-latitude continental shelf ecosystem. Prog. Oceanogr. 2023, 217, 103083. [Google Scholar] [CrossRef]
  26. Chen, H.; Teng, Y.; Yue, W.; Song, L. Characterization and source apportionment of water pollution in Jinjiang River, China. Environ. Monit. Assess. 2013, 185, 9639–9650. [Google Scholar] [CrossRef] [PubMed]
  27. Chen, Z.Y.; Xie, J.J.; Lu, H.S.; Dai, C.J.; Huang, Z.Y.; Yuan, J.J.; Chen, H.Y. A Survey of the Phytoplankton and Evaluation of Water Quality in Jinjiang River. Environ. Monit. China 2006, 5, 82–84, (In Chinese with English abstract). [Google Scholar]
  28. Wu, Y.; Guo, P.; Su, H.T.; Zhang, Y.X.; Deng, J.; Wang, M.X.; Sun, Y.S.; Li, Y.Q.; Zhang, X.Y. Seasonal and spatial variations in the phytoplankton community and their correlation with environmental factors in the Jinjiang River Estuary in Quanzhou, China. Environ. Monit. Assess. 2022, 194, 44. [Google Scholar] [CrossRef]
  29. Alahuhta, J.; Kanninen, A.; Hellsten, S.; Vuori, K.M.; Kuoppala, M.; Hämäläinen, H. Environmental and spatial correlates of community composition, richness and status of boreal lake macrophytes. Ecol. Indic. 2023, 32, 172–181. [Google Scholar] [CrossRef]
  30. Li, D.; Yan, J.; Lu, Z.; Chu, T.; Li, J.; Chu, T. Use of δ13C and δ15N as Indicators to Evaluate the Influence of Sewage on Organic Matter in the Zhangjiang Mangrove–Estuary Ecosystem, Southeastern China. Water 2023, 15, 3660. [Google Scholar] [CrossRef]
  31. Zhu, Y.; Yang, H.; Xiao, Y.; Hao, Q.; Li, Y.; Liu, J.; Wang, J. Identification of Hydrochemical characteristics, spatial evolution, and driving forces of river water in Jinjiang watershed, China. Water 2023, 16, 45. [Google Scholar] [CrossRef]
  32. Cheng, B.; Xia, R.; Zhang, Y.; Yang, Z.; Hu, S.; Guo, F.; Ma, S. Characterization and causes analysis for algae blooms in large river system. Sustain. Cities Soc. 2019, 51, 101707. [Google Scholar] [CrossRef]
  33. Zhang, J.; Ye, D.; Zhu, H.; Hu, S.; Wang, Y.; Tang, J.; Zhou, Z. Characteristics of spring algal blooms under different impounded levels in tributaries of the Three Gorges Reservoir. Acta Hydrobiol. Sin. 2019, 43, 884–891, (In Chinese with English abstract). [Google Scholar]
  34. Li, Y.; Cao, W.; Su, C.; Hong, H. Nutrient sources and composition of recent algal blooms and eutrophication in the northern Jiulong River, Southeast China. Mar. Pollut. Bull. 2011, 63, 249–254. [Google Scholar] [CrossRef]
  35. HJ 1216-2021; National Environmental Standards of the People’s Republic of China, specifically the “Determination of Phytoplankton in Water-Microscopic Counting Method with 0.1 mL Counting Chamber”. Ministry of Ecology and Environment of the People’s Republic of China: Beijing, China, 2021.
  36. Core, T.R. A language and environment for statistical computing, R foundation for statistical computing 2022, Vienna, Austria.
  37. Xia, R.; Wang, G.; Zhang, Y.; Yang, P.; Yang, Z.; Ding, S.; Jia, X.; Yang, C.; Liu, C.; Ma, S.; et al. River algal blooms are well predicted by antecedent environmental conditions. Water Res. 2020, 185, 116221. [Google Scholar] [CrossRef]
  38. Yang, J.; Lv, H.; Isabwe, A.; Liu, L.; Yu, X.; Chen, H.; Yang, J. Disturbance-induced phytoplankton regime shifts and recovery of cyanobacteria dominance in two subtropical reservoirs. Water Res. 2017, 120, 52–63. [Google Scholar] [CrossRef]
  39. Hou, Y.; Li, X.; Bai, L.; Bai, Y.J.; Zhang, S.R.; Wang, S.R.; Zheng, L.; Ding, A.Z. Characteristics of phytoplankton community structure in rivers recharged by different water sources and its relationship with environmental factors. Environ. Sci. 2022, 43, 5616–5626. [Google Scholar]
  40. Fang, F.; Gao, Y.; Gan, L.; He, X.Y.; Yang, L.Y. Effects of different initial pH and irradiance levels on cyanobacterial colonies from Lake Taihu, China. J. Appl. Phycol. 2018, 30, 1777–1793. [Google Scholar] [CrossRef]
  41. Qin, B.; Zhou, J.; Elser, J.J.; Gardner, W.S.; Deng, J.; Brookes, J.D. Water depth underpins the relative roles and fates of nitrogen and phosphorus in lakes. Environ. Sci. Technol. 2020, 54, 3191–3198. [Google Scholar] [CrossRef] [PubMed]
  42. Jensen, J.P.; Jeppesen, E.; Olrik, K.; Kristensen, P. Impact of nutrients and physical factors on the shift from cyanobacterial to chlorophyte dominance in shallow Danish lakes. Can. J. Fish. Aquat. Sci. 1994, 51, 1692–1699. [Google Scholar] [CrossRef]
  43. Bai, H.F.; Wang, Y.R.; Song, J.X.; Huang, P.; Xu, W.J.; Yin, X.W.; Liu, G.; Li, H.J. Spatio-temporal characteristics and influencing factors of phytoplankton community structure in the Shaanxi Section of Weihe River, China. Acta Sci. Circumstantiae 2021, 41, 3290–3301, (In Chinese with English abstract). [Google Scholar]
  44. Chen, L.D.; Zhan, J.P.; Wang, Q. Community structure of phytoplankton and their indicative effect on water quality of Pearl River. South China Fish. Sci. 2023, 19, 1–10, (In Chinese with English abstract). [Google Scholar]
Figure 1. Sampling sites in the Jinjiang River in February–March 2023.
Water 16 01497 g001
Figure 2. The variations in temperature, pH, dissolved oxygen (DO), conductivity, total phosphorus (TP), and total nitrogen (TN) at the national monitoring points of the East Jinjiang River (ER, Kangmei Bridge, Nan’an) and West Jinjiang River (WR, Luonei Bridge, Anxi) from December 2020 to November 2023.
Water 16 01497 g002
Figure 3. Distributions in NOx (a), DRP (b), and DSi (c) in the East and West Jinjiang Rivers in the early spring of 2023.
Water 16 01497 g003
Figure 4. Distributions of phytoplankton abundance ((a), cells·L−1) and compositions (b) in the East and West Jinjiang Rivers in the early spring of 2023.
Water 16 01497 g004
Figure 5. RDA analysis of phytoplankton and environmental parameters in the Jinjiang River.
Water 16 01497 g005
Disclaimer/Publisher’s Note: The statements, opinions and data contained in all publications are solely those of the individual author(s) and contributor(s) and not of MDPI and/or the editor(s). MDPI and/or the editor(s) disclaim responsibility for any injury to people or property resulting from any ideas, methods, instructions or products referred to in the content.

