Article

Research and Application of the Mine 3D DC Resistivity Method for Detecting Grouting in the Floor of an Ultrawide Working Face, Taking the Yongmei Xinqiao Coal Mine in Henan Province as an Example

1
Xinqiao Coal Mine, Yongmei Group Co., Ltd., Yongcheng 476600, China
2
School of Resources and Geosciences, China University of Mining and Technology, Xuzhou 221116, China
*
Author to whom correspondence should be addressed.
Water 2024, 16(11), 1491; https://doi.org/10.3390/w16111491
Submission received: 24 April 2024 / Revised: 20 May 2024 / Accepted: 21 May 2024 / Published: 23 May 2024
(This article belongs to the Special Issue Mine Water Safety and Environment, 2nd Edition)

Abstract

:
Generally, ground grouting is used to treat confined water areas before mining at the working face, but there is a lack of testing methods for determining the effectiveness of such a grouting treatment on the floor of ultrawide working faces. Therefore, we propose a 3D DC resistivity method for mines and apply it to the detection of the effect of grouting on the mine floor. This study took the Yongmei Xinqiao Coal Mine in Henan Province as the research object and used a combination of theoretical analysis, numerical simulation, and measured data analysis to study the effect of the 3D resistivity method on detecting the effect of grouting on the floor of an ultrawide working face in the mine. The research results indicated that compared with the 2D observation mode of same-side power supply and reception, the 3D observation mode of opposite-side power supply and reception using the tunnels on both sides of the working face was more sensitive to the response of the water-rich area 60 m below the coal seam’s floor. Regarding the model’s set-up in this article, when traditional apparent resistivity calculations were used, the apparent resistivity obtained by the 3D observation mode was opposite to the model’s setting, and accurate electrical information of anomalous bodies must be obtained through 3D inversion. The measured data showed that although the ground grouting treatment effectively reduced the water volume in the floor, the treatment’s result was affected by human factors, and the water in the floor was redistributed.

1. Introduction

Although the use of ultrawide working faces has a series of advantages, such as less equipment use, easier management of equipment, fewer operators, and relatively simple production systems [1], the corresponding roadway layout results in new challenges to the detection of water-rich areas in the working face’s floor, especially in mining areas at risk of confined water hazards on the floor. To reduce the threat of floor-confined water in mining faces, ground grouting is used for the regional treatment of confined water in the floor of the working faces. However, there is a lack of methods available for detecting the effectiveness of floor grouting treatments in ultrawide working faces. Usually, in high-gas mines, in addition to the upper and lower roadways used for mining, there is a roadway located above or below the working face parallel to the working face’s direction for drainage of gas [2]. Conventional geophysical methods adopted in mines can meet the requirements of detecting water damage on the floor and the effect of grouting. However, for low-gas mines, the layout design of one mining working face with three roadways undoubtedly increases the costs and reduces the work efficiency. Therefore, most low-gas mines are designed by adopting a single mining working face with two roadways as an approach.
The commonly used methods for detecting geological structures inside mining working faces and roofs and floors include wireless electromagnetic wave analysis [3,4], in-seam seismic exploration [5,6,7], the mine transient electromagnetic method (TEM) [8,9,10], and the mine direct current (DC) resistivity method [11,12]. Wireless electromagnetic wave perspective technology uses high-frequency electromagnetic waves to detect geological isomers inside the working face. Its penetrative ability is dependent on the frequency, and the commonly used frequencies of 0.3 MHz, 0.5 MHz, and 1.5 MHz have limited penetration distances [13], making it difficult to effectively detect geological structures at working faces with widths exceeding 300 m. In-seam seismic exploration has advantages such as high resolution, but its construction efficiency is low and its labor intensity is high. Its application in some high-gas mines is limited, and its response to water bodies is not very sensitive. Therefore, it is limited in its effect when used at ultrawide working faces and in water-rich areas of roofs and floors. Due to the constraints of underground space, the effective detection distance of the mine TEM is usually less than 100 m. Therefore, when conducting TEM detection in ultrawide mining working faces, there are blind spots of detection inside the working face and on the roof and floor. The mine DC resistivity method achieves measurements at large depths based on the distance between the transmitting and receiving electrodes [14], so it can be applied to the detection of ultrawide mining working faces.
The DC resistivity methods can be roughly divided into two categories: mine DC resistivity sounding measurements with same-side transmission and reception, and mine DC resistivity measurements with opposite-side transmission and reception. The source and receiver of the opposite-side transmission and reception mode are not on the same measurement line, so it can be regarded as a three-dimensional (3D) observation mode. Some experts and scholars have developed corresponding 3D inversion techniques for this mode [11,15,
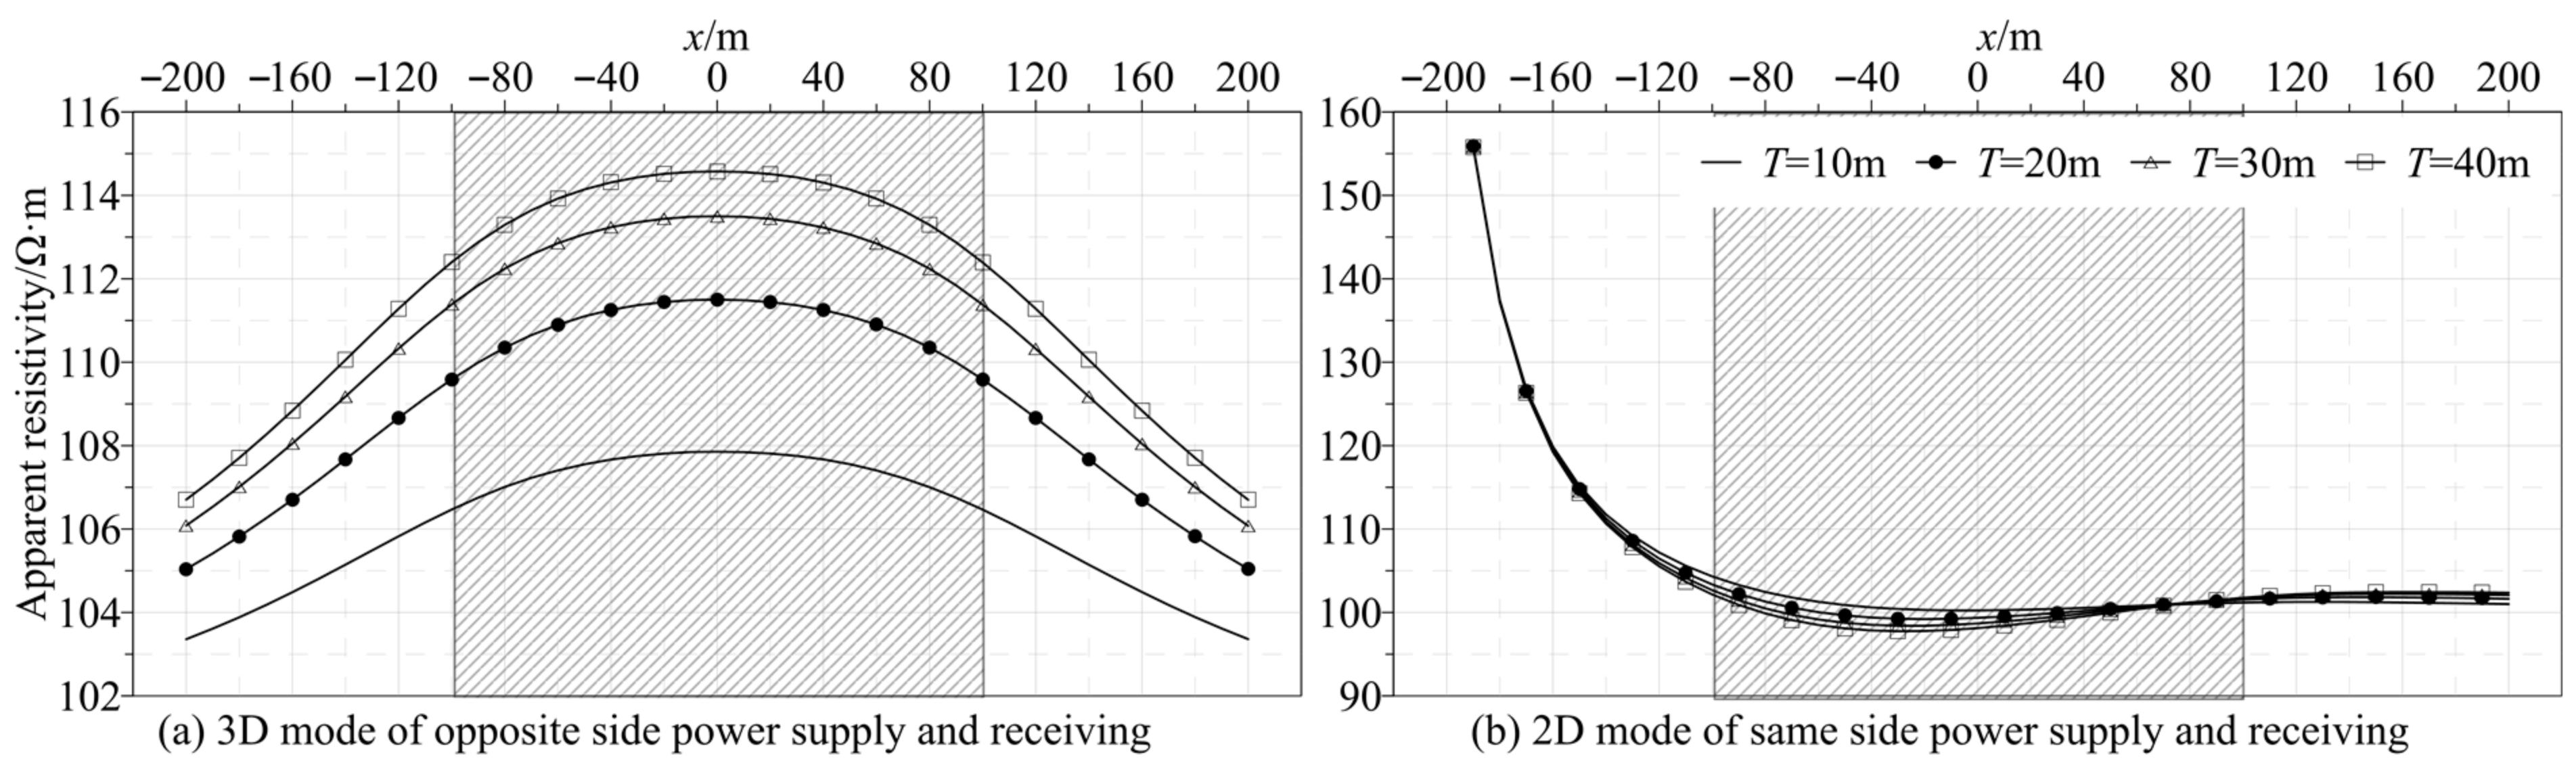
16]. Therefore, we propose applying the mine 3D DC resistivity method to detect the effect of grouting in areas with confined water in the mine floor of an ultrawide mining working face. To provide better guidance for actual construction, we used numerical simulation to compare and study the ability of the 3D observation mode of opposite-side transmission and reception, and the two-dimensional (2D) observation mode of same-side transmission and reception to detect the water-rich area of the working face’s floor in detail. The measured data were processed and analyzed to verify the ability of the mine 3D DC resistivity method to detect the effect of grouting in the water-rich area of the floor.

2. Basic Principles of the Mine 3D DC Resistivity Method

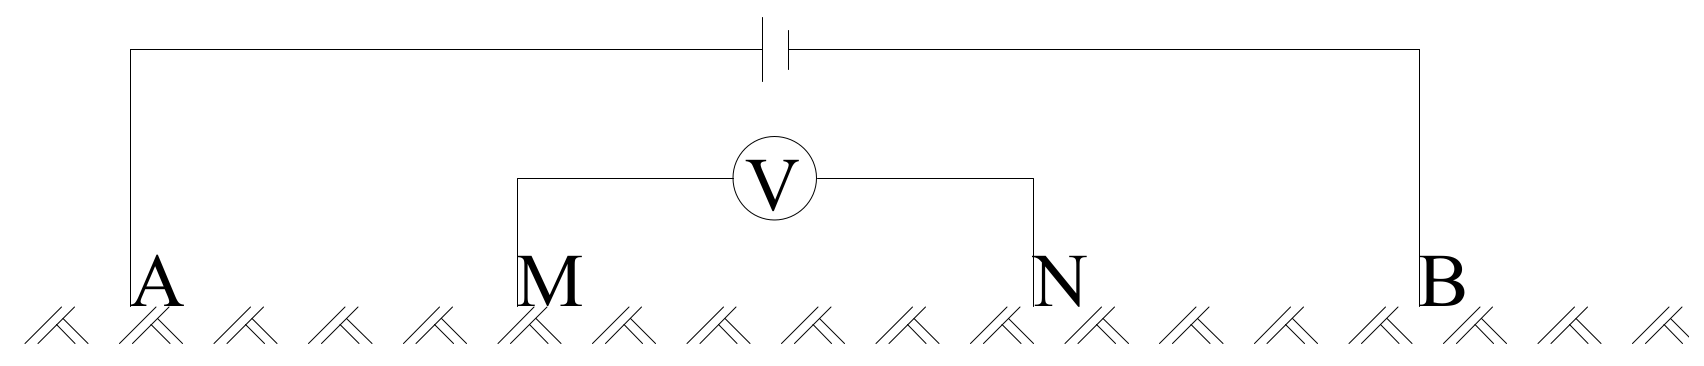
The mine 3D DC resistivity method uses DC to detect the resistivity of a medium. Its basic principle is the same as that of the resistance testing method in physics. By supplying a stable current to a circuit, the potential V and current I are measured on both sides of the resistance R. The resistance law can be used to calculate the resistivity of the resistance in the circuit. The DC resistivity law uses the earth as the conductive medium for detection. To form a DC circuit, the power supply needs to be directly connected to the earth through a wire, as shown in Figure 1 [17]. In Figure 1, A and B are the power supply electrodes connected to the power source and the earth medium, respectively, while M and N are the potential electrodes, which are mainly used to measure the potential difference between M and N, also known as the receiving electrode.
According to the relative position between the power supply electrodes and the receiving electrodes, conventional DC resistivity methods can be divided into those with dipole–dipole devices, dipole–pole devices, and pole–pole devices. Initially, due to limitations of computer technology, in addition to using 1D and 2D inversion methods [18,19,20], the methods of interpreting the DC resistivity method focused on calculating the apparent resistivity, that is, Equation (1) [21], based on the calculated apparent resistivity for geological interpretation.
ρ S = K Δ U MN I
where ρ S is the apparent resistivity, which is the comprehensive response of the resistivity of the underground medium; I is the power supply current, which is automatically recorded during data collection; Δ U MN is the potential difference between the receiving electrodes M and N; and K is the coefficient of the relationship between the power supply electrodes and the receiving electrodes. For pole–pole devices, K = 4 π A M , where AM is the distance between the power supply point and the receiving point.
With the development of computer and electronic technology, including but not limited to the abovementioned types of devices, an increasing number of instruments are being developed for 3D observation systems [
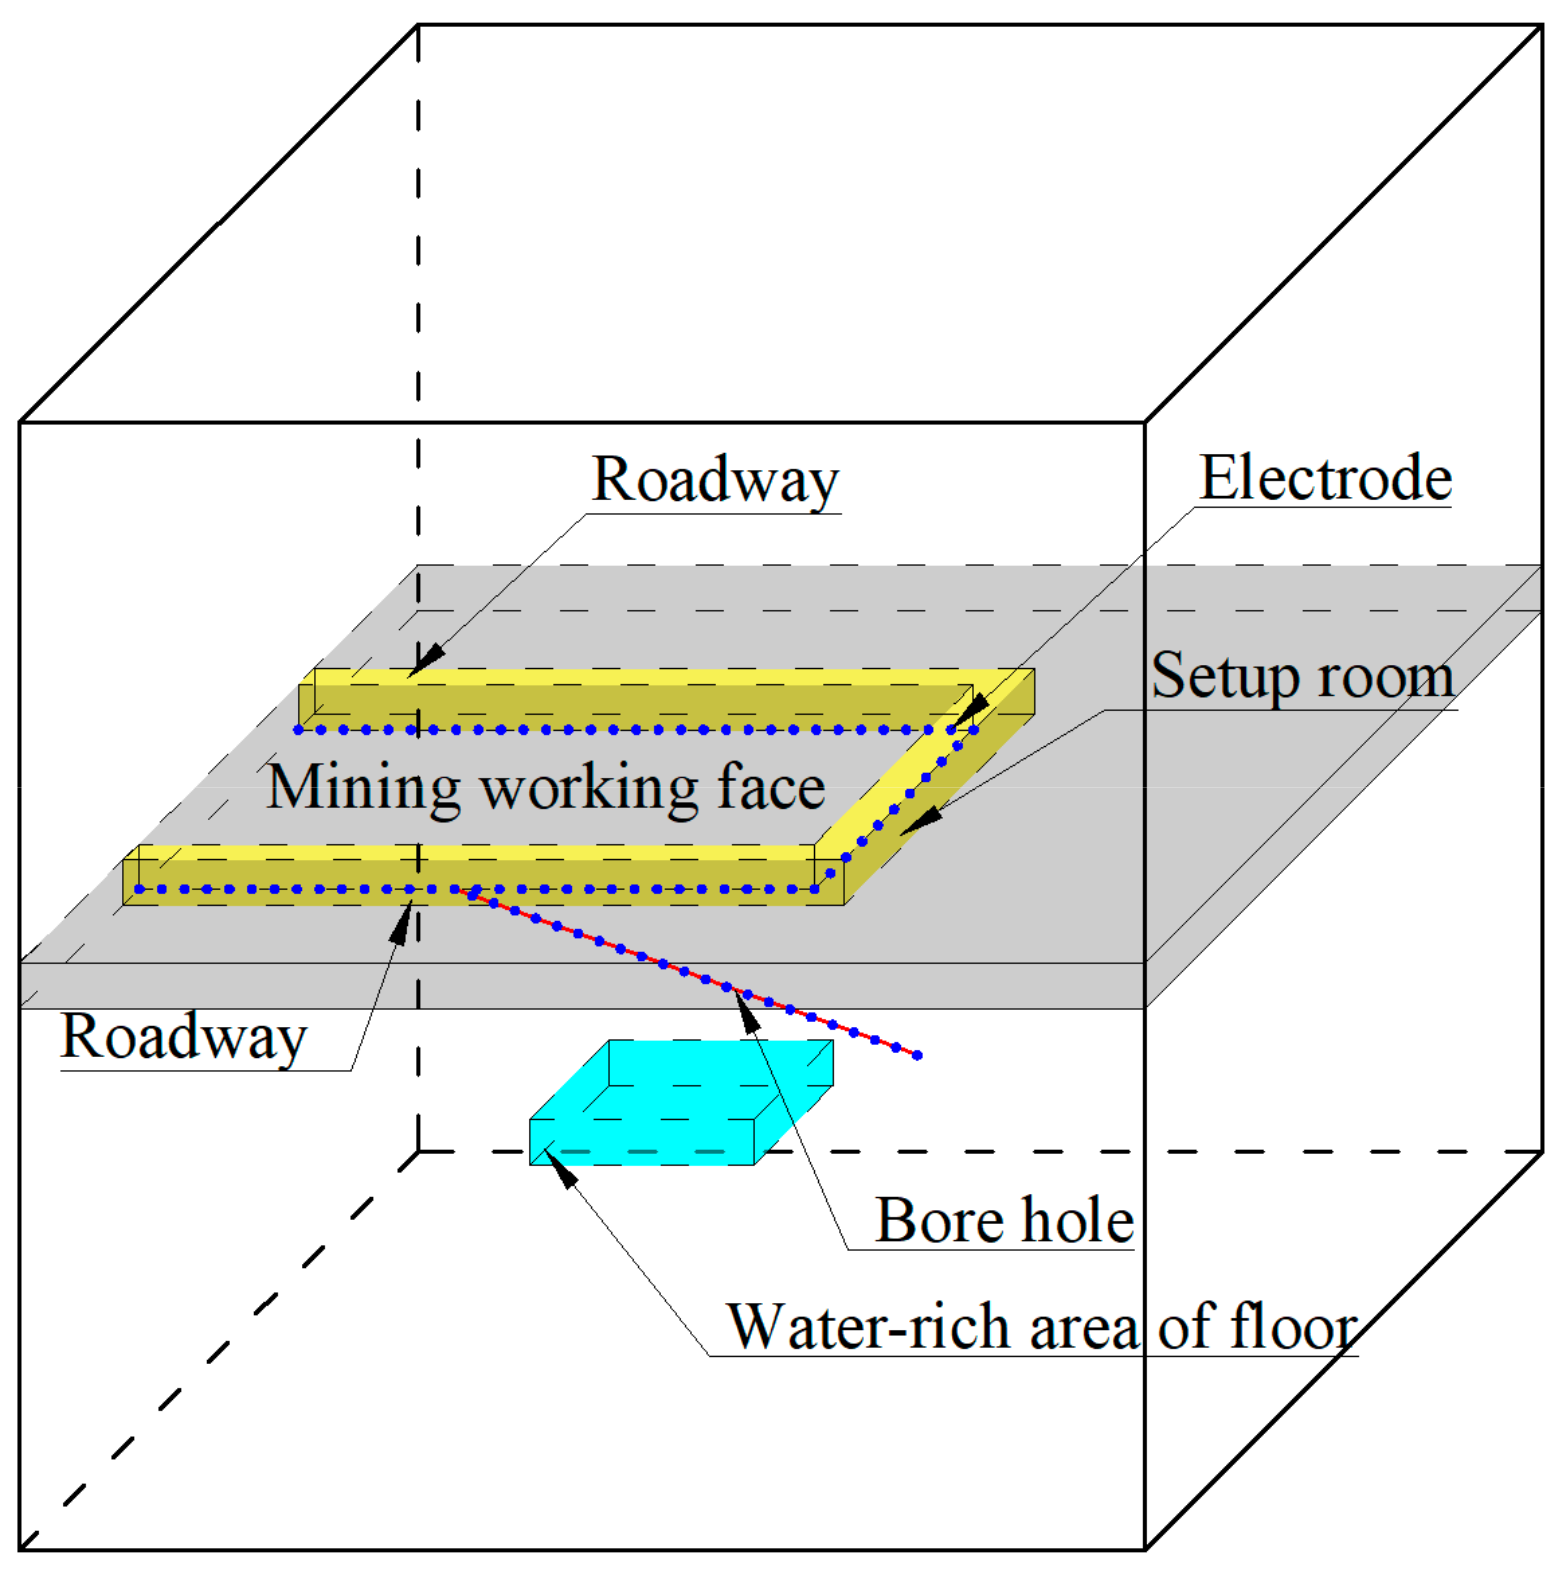
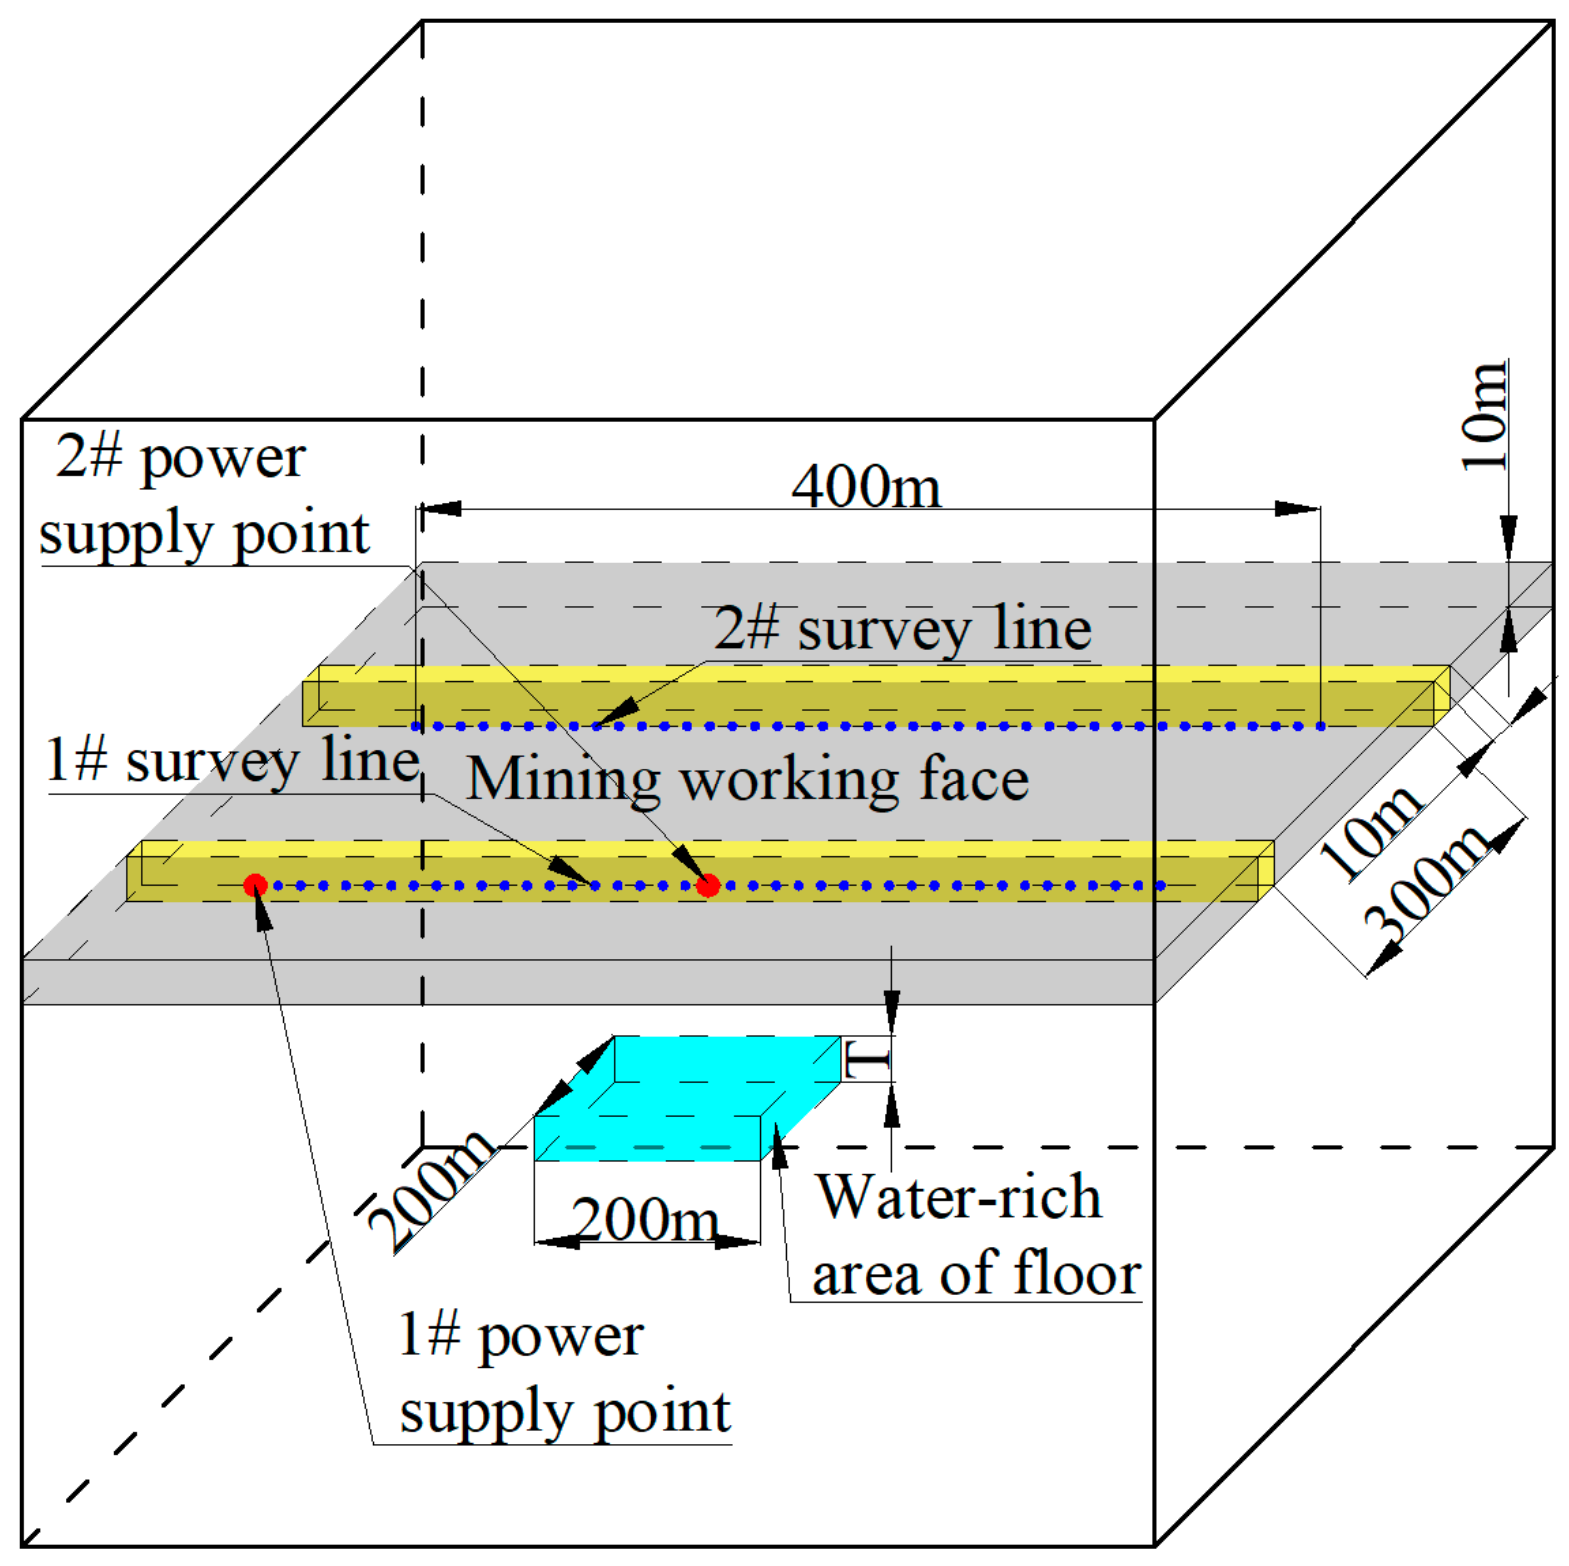
22]. The mine 3D DC resistivity method utilizes all the available space in the mining face via the arrangement of electrodes in the upper and lower roadways, setup room, drilling holes, and other spaces of the working face, ignoring the constraints of traditional DC resistivity method devices. The mine 3D DC resistivity method uses a single electrode for power supply and all the other electrodes for reception (pole–pole or dipole–pole), combined with the information on the position of the power supply and reception electrodes for interpretation via joint inversion to detect information in the roof and floor of the working face, as shown in Figure 2. The blue dots in Figure 2 represent the positions of the electrodes. When detecting geological information in the coal seam’s roof, the electrodes can be placed on the roadway’s roof. When detecting geological information in the floor, the electrodes need to be placed on the roadway’s floor. When one or two electrodes are used as power supply electrodes, all the other electrodes can be used as receiving electrodes, and the receiving points are not in the same line as the power supply points, thus achieving a 3D observation system.
However, due to limitations in terms of the number of channels for DC electrical instruments, the power supply’s current, the construction space, and underground safety, during actual construction, power can be supplied from only one side of the roadway of the working face and received from the opposite roadway, thus achieving 3D observation.

3. Numerical Simulations of the Mine 3D DC Resistivity Method for Detecting the Grouting of a Mining Working Face’s Floor

There are significant safety hazards in coal mines due to the influence of confined limestone water in the floor. Grouting is usually used to treat local water-rich areas of the working face’s floor. Due to the influence of gravity, pressure, and other factors, the water-rich areas gradually became thinner during treatment. Therefore, this section simulated the water-rich zone under different states of grouting by establishing thin horizontal plates with fixed depths and different thicknesses.

3.1. Design of the Model

Based on the 3D observation mode of opposite-side power supply and reception, and the 2D observation mode of same-side power supply and reception, a geoelectric model of a 300 m wide mining working face was established, based on the Xinqiao Coal Mine of the Yongmei Group in Henan Province, China. Numerical simulations were conducted with different thicknesses of water-rich areas 60 m below the floor to analyze the ability of the 3D DC resistivity method with opposite-side power supply and reception to detect the process of grouting in the water-rich area of the floor of an ultrawide mining working face. The model’s design is shown in Figure 3. The yellow bar in the figure represents the space of the roadway, with a width and height of 10 m. The resistivity was set to 10–8 Ω·m. Each roadway was equipped with a 400 m long measurement line, which included Line #1 and Line #2. The red dots represent the power supply points. When Point #1 is powered, the potential of each point on measurement Line #1 is calculated to simulate the detection ability of the 2D observation mode with same-side power supply and reception. When Point #2 is powered, the potential of each point on measurement Line #2 is calculated to simulate the detection ability of the 3D observation mode with opposite-side power supply and reception. The gray shaded area represents the coal seam, with a thickness of 10 m and a resistivity of 1000 Ω·m. The light blue plate-like body below the coal seam’s floor is a simulated low-resistivity and water-rich area with a length and width of 200 m. The top interface is 60 m from the coal seam’s floor; the thickness T is set to 10 m, 20 m, 30 m, or 40 m; and the resistivity is set to 10 Ω·m.

3.2. Analysis of the Results of Numerical Simulation

Due to the fact that the designed model included coal seams, water-rich areas, and roadways, analytical formulas could not be used to calculate the potential of each measurement point. Therefore, we used the full-space three-dimensional electrical finite element method [11] for numerical calculations. The detailed algorithm will not be elaborated on here.

3.2.1. Characteristics of the Background’s Apparent Resistivity

To provide an explanatory basis for the measured data, first, we analyzed the characteristics of the apparent resistivity in the presence of only coal seams and tunnels without anomalies, as shown in Figure 4. The horizontal axis represents the positions of the measurement points along the direction of the roadway, and the vertical axis represents the apparent resistivity calculated using Equation (1). When power was supplied and received on the same side (Point #1 was powered, measurement Line #1 received, and the power supply point was located at the x = −200 m position), as the distance from the power supply point increased, the apparent resistivity gradually decreased and tended to reach the roof’s or floor’s resistivity of 100 Ω·m. This was mainly caused by the depth of detection determined by the DC resistivity method and the distance between the electrodes. The potential near the power supply point was mainly affected by the coal seam and the roadway, while the potential far from the power supply point was mainly influenced by the electrical properties of the roof’s and floor’s rock layers. The apparent resistivity of the 3D observation mode (powered by Point #2 and received by Line #2) was approximately 100 Ω·m, mainly because the minimum distance between the source of emission (Point #2) and Line #2 was 300 m, which could not effectively reflect the electrical information of shallow coal seams and roadways.

3.2.2. Influence of the Variation in Thickness in Water-Rich Areas on Apparent Resistivity

Subsequently, numerical simulations were conducted on water-rich areas with different grouting states located 60 m below the floor of the mine’s working face. The results of the simulation are shown in Figure 5, where the shaded area represents the location of the water-rich area along the measurement line. Figure 5a shows the apparent resistivity curves calculated by the 3D mode with opposite-side power supply and reception. The shapes of the apparent resistivity curves calculated by all models were the same, and the corresponding positions in the low-resistivity and water-rich areas showed a phenomenon of high resistivity, which was opposite to the model’s setting; as the thickness of the water-rich zone decreased, the values of apparent resistivity calculated along Line #2 gradually decreased as well.
Figure 5b shows the apparent resistivity curves calculated by the 2D mode with same-side power supply and reception. As the distance from the power supply point (x = −200 m) increased, the apparent resistivity first decreased, then increased, then decreased, and finally approached the background resistivity. That is, the resistivity at the abnormal corresponding position close to the power supply point was lower than the background resistivity, and the resistivity at the anomaly far from the power supply point was greater than the background value. As the thickness of the water-rich zone decreased, the apparent resistivity gradually tended toward the background value.

3.2.3. Characteristics of the Rate of Change in the Apparent Resistivity

The apparent resistivity curves could analyze only the impact of different grouting states on the observation data and could not analyze their degree of influence. Therefore, the detection ability of 2D and 3D observation modes was analyzed on the basis of the rate of change in the apparent resistivity. The curves of the rate of change in apparent resistivity are shown in Figure 6. The vertical axis in the figure represents the calculation formula for the rate of change in apparent resistivity, where ρ a is the apparent resistivity calculated by the models with different grouting states in the water-rich zone in Figure 5, and ρ b is the background’s apparent resistivity calculated by the model without water-rich zones in Figure 4. Figure 6a shows the curves of the rate of change in the apparent resistivity obtained from the 3D observation mode with opposite-side power supply and reception. The rate of change in apparent resistivity ranged from 3% to 14%, and the rate of change in apparent resistivity of all models had a part that was greater than 5%. Due to the influence of free current and errors in the electrodes’ position during actual construction, observation data usually contain 3% to 5% random noise [23]. Therefore, the 3D mode with opposite-side power supply and reception could effectively detect water-rich areas with thicknesses greater than 10 m. Figure 6b shows the curves of the rate of change in the apparent resistivity obtained from the 2D observation mode with same-side power supply and reception, with the rate of change in apparent resistivity ranging from −5% to 3%. Regardless of the thickness of the water-rich area, in these models, no areas with rates of change in apparent resistivity were greater than 5%, indicating that the 2D observation model could not effectively detect the water-rich area of the size set in this article.
According to the numerical simulation of grouting via the mine 3D DC resistivity method at the floor of the mine’s working face, the 3D observation mode with opposite-side power supply and reception had a greater ability to recognize the water-rich area of the floor. However, with the opposite-side power supply and reception mode, the apparent resistivity calculated by the model in this article was opposite to the electrical properties of the anomalous body. Therefore, we used 3D inversion to obtain the true electrical properties of the underground target body from the measured data.

4. Engineering Examples

To verify the ability of detecting the grouting effect of the floor of the mine’s working face through the 3D mode with opposite-side power supply and reception, mine 3D DC resistivity detection tests were conducted before and after grouting at the Working Face 21106 of the Xinqiao Coal Mine, Henan Yongmei Group, China.

4.1. Overview of the Experimental Area

The length of the track roadway in the fully mechanized mining Face 21106 is 954 m, and the length of the belt roadway is 931 m. The inclined length of the working face of mining is 326 m, and the elevation is −328.1 to −548.8 m. The upper section of the Taiyuan Formation consists of six layers of limestone from L12 to L7, with an average thickness of 27.51 m; the karst fissures are developed. The aquifer of L12–L7 is an indirect water-filling aquifer in Working Face 21106, with an average distance of 57 m from the floor of the working face. The mine’s Working Face 21106 is separated from the limestone by weakly permeable mudstone and sandy mudstone, which can provide good water resistance. During the process of mining the working face, damage to the floor easily is communicated to the limestone aquifer through faults or collapse columns, which poses a safety hazard in the mine’s working face. Therefore, in front of the mining face, the Xinqiao Coal Mine carried out regional management of the floor’s limestone aquifer. Twenty-five grouting boreholes were designed in Working Face 21106. As of 2 January 2023, 10 have been completed, with a drilling depth of 5394.81 m and 49,940 t of cement injected. As of 8 May 2023, the ground’s grouting work was basically completed. To compare and analyze the effect of grouting, the 3D DC resistivity of the initial exploration and secondary exploration were conducted on the track roadway and belt roadway of the mine’s Working Face 21106 from 4 January to 7 January 2023 and from 8 May to 10 May 2023 to study the detection ability of the 3D observation mode with opposite-side power supply and reception on the floor.

4.2. Instrumentation and Layout of Measurement Points

4.2.1. Instrumentation

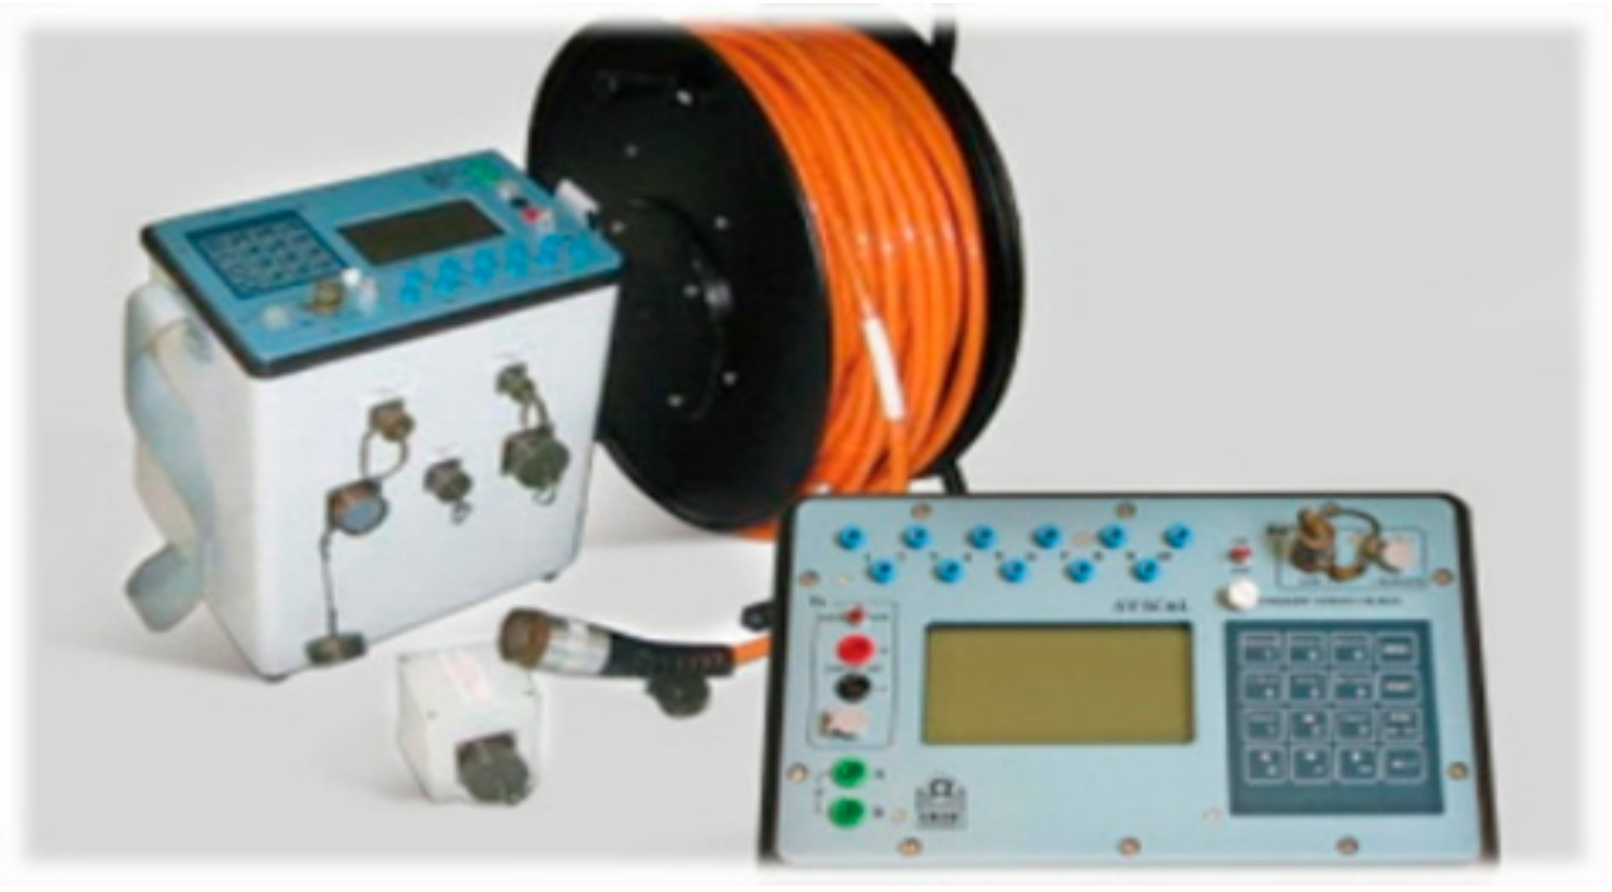
The on-site experiment of the 3D observation mode with opposite-side power supply and reception adopted the internationally advanced Syscal Pro (France) DC resistivity instrument (Figure 7), which can recognize both strong and weak signals while retaining its stability.

4.2.2. Layout of Measurement Points

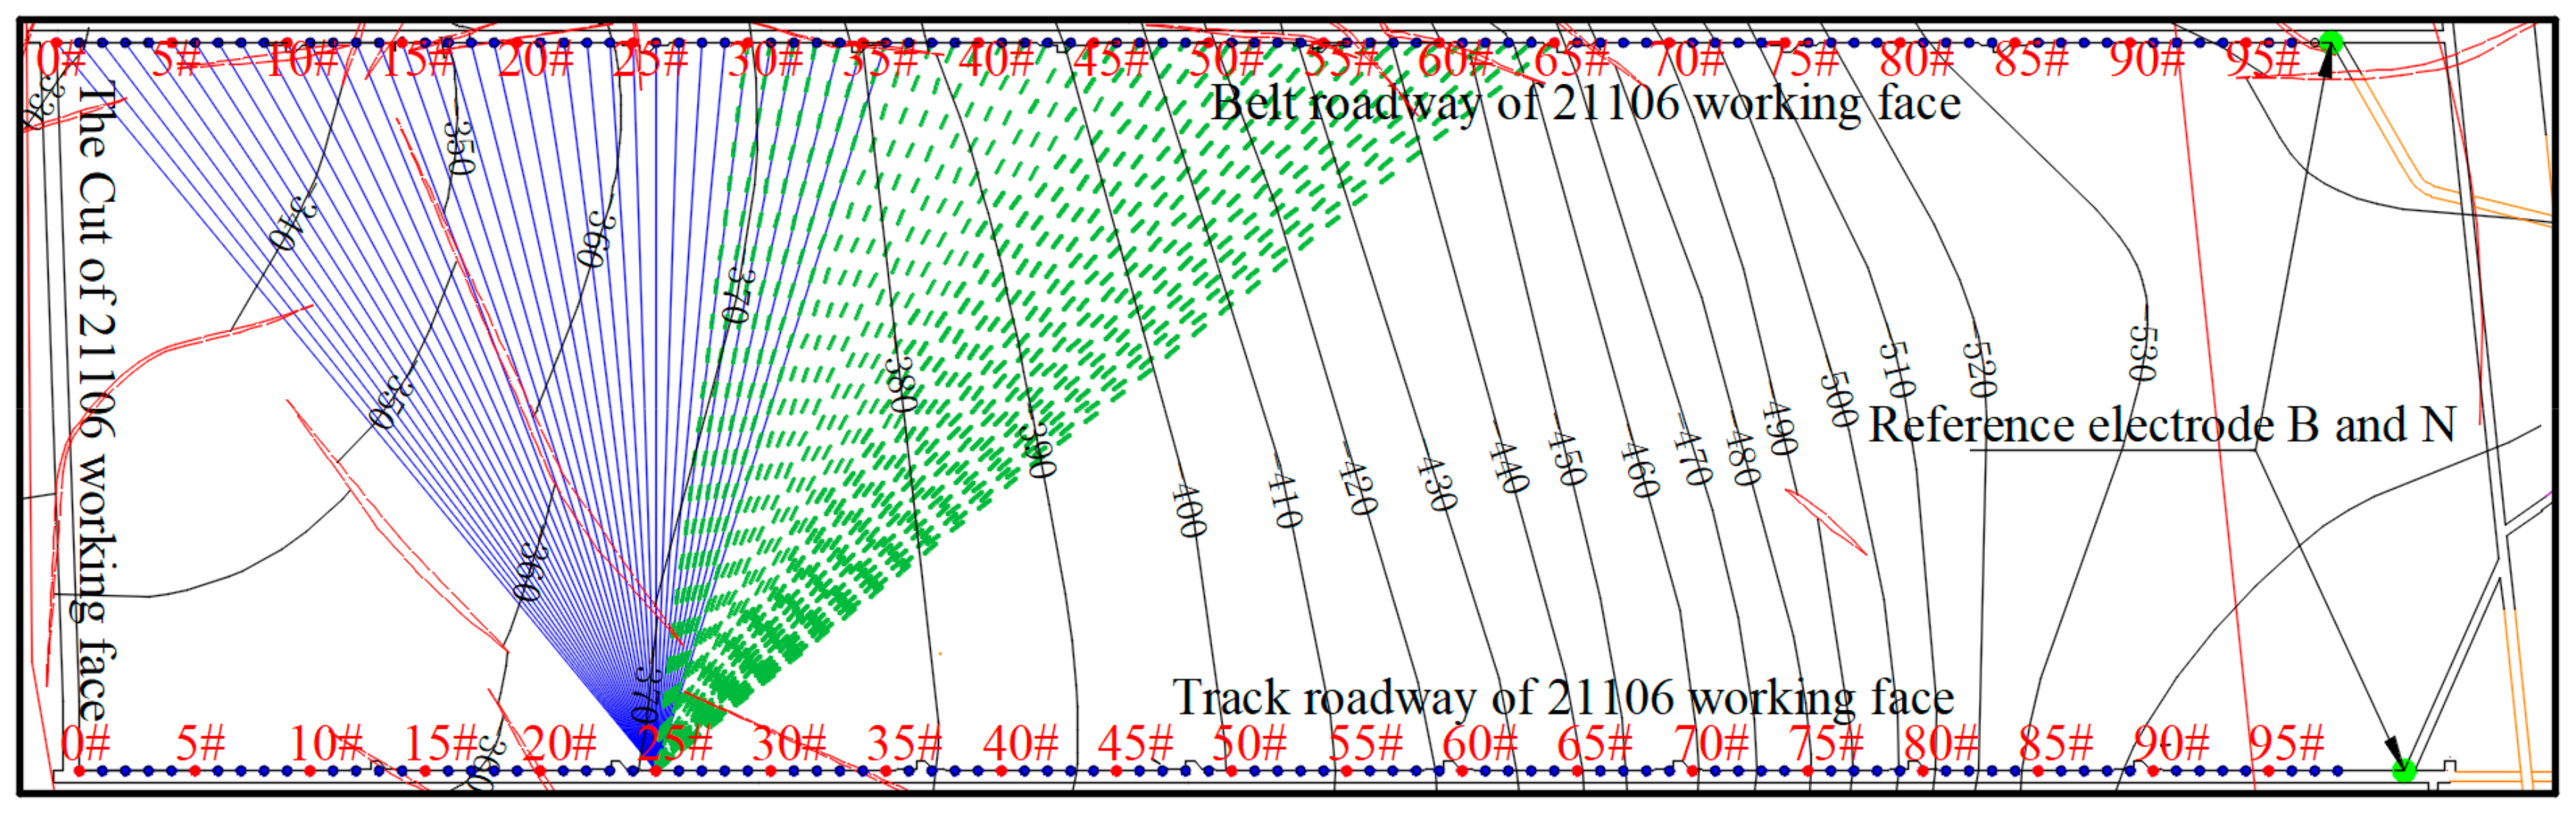
During the initial exploration and secondary exploration, a total of 99 electrode points were laid along the track roadway of Working Face 21106, and 98 electrode points were laid along the belt roadway. The electrodes’ spacing was 10 m, and a positive power supply electrode was supplied every 50 m. In Figure 8, the red circles represent the power supply points, and the blue circles represent the receiving points. Due to the limited number of the instrument’s channels, only 36 channels of data, or 350 m, could be received in one transmission. As shown in Figure 8, the power supply was provided at Point #25 of the track roadway, and the receivers were located at Points #0–35 of the belt roadway. In addition, the electrodes at Positions #0–35 received the potential generated by the power supply electrodes at Points #0, #5… #40 in the track roadway. After the power supply was completed at Point #40 of the corresponding track roadway for Points #0–#35 of the belt roadway, the receiving cable of the belt roadway moved to Points #30–#65, corresponding to the electrodes at Points #25, #30… #70 in the track roadway, and power was supplied. Each time the cable moved 300 m, the process was repeated to analyze the stability of the data.

4.3. Processing and Interpretation of the Experimental Data

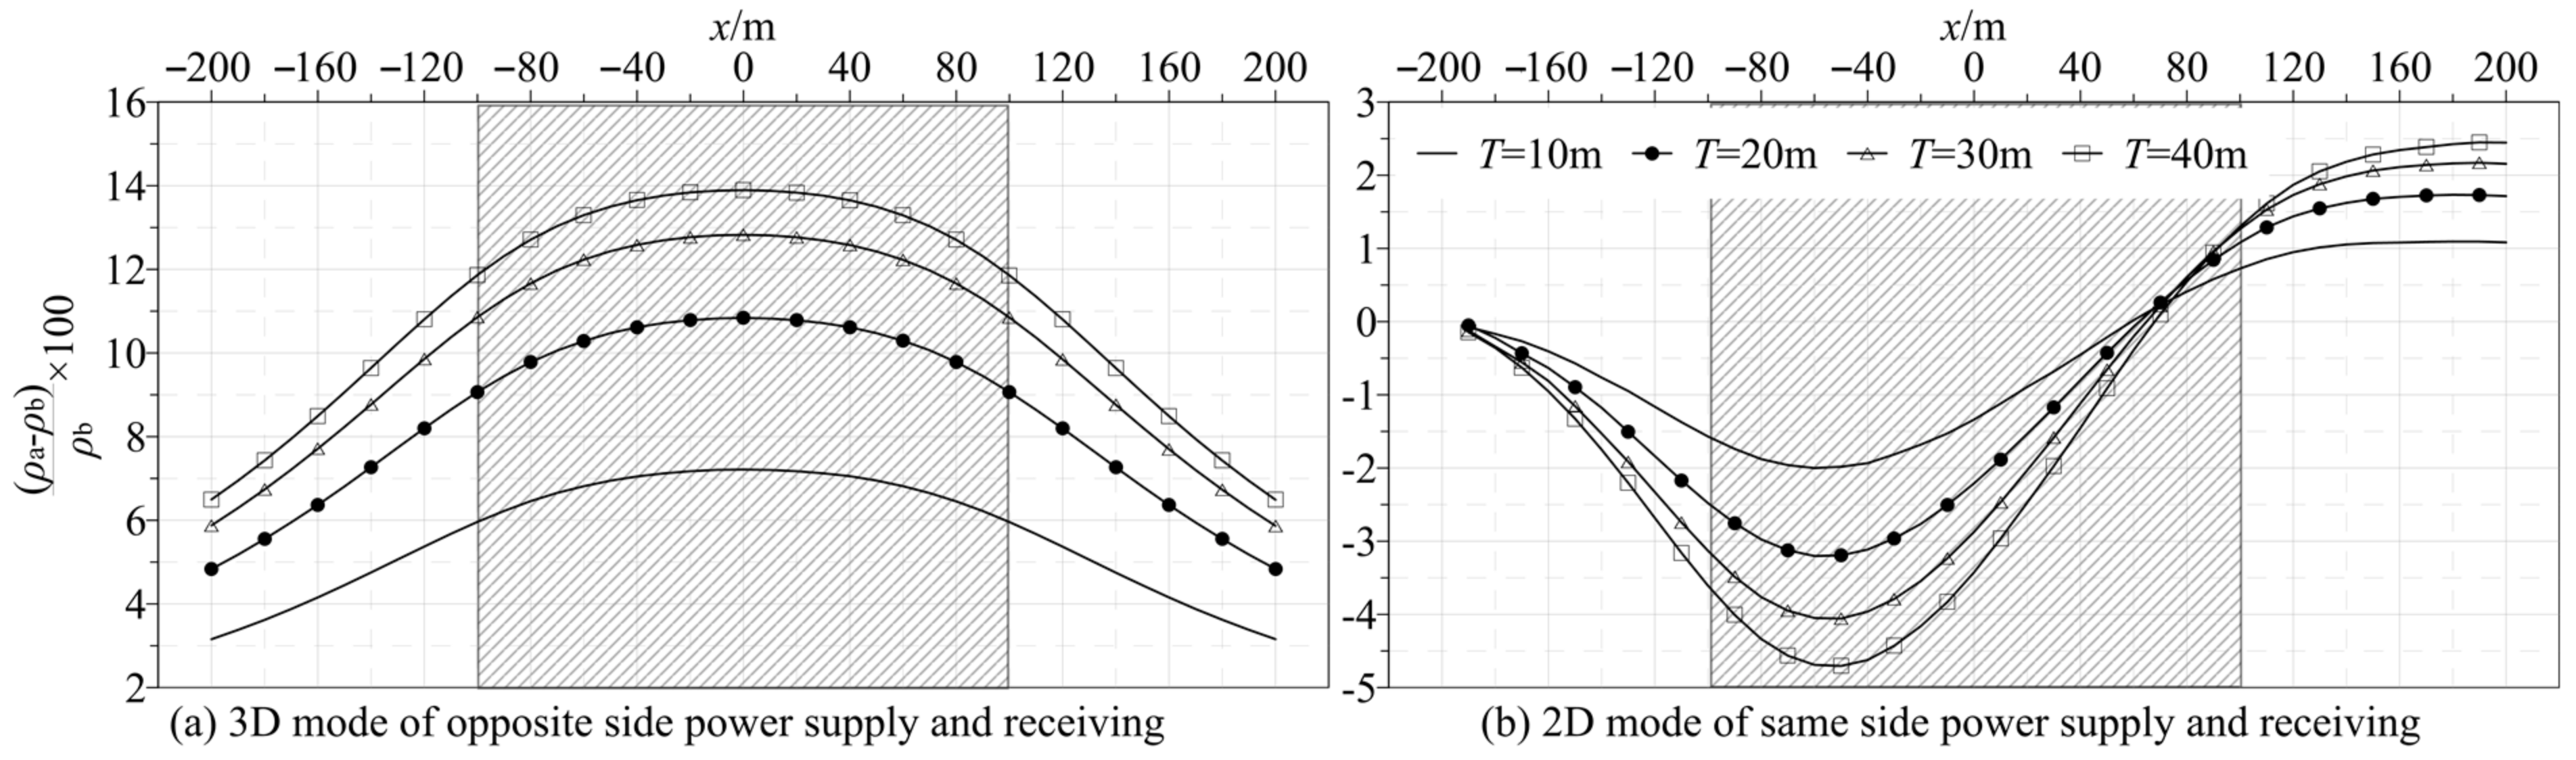
When we constructed the opposite-side power supply and reception system, the power supply and reception points were located on both sides of the working face, which was a type of 3D DC resistivity exploration. Furthermore, the numerical simulations indicated that there was an opposite phenomenon between the calculated apparent resistivity and the electrical properties of the target body during 3D observations. Therefore, 3D DC resistivity inversion technology could obtain more accurate interpretations of the results than can directly calculating the apparent resistivity.

4.3.1. Evaluation of the Results of Inversion

The intersection between the measured initial and secondary exploration data at the mine’s Working Face 21106 and the 3D inversion data is shown in Figure 9.
The blue dots in the figure are the intersection points of the initial exploration, and the red dots are the intersection points of the secondary exploration. When the intersection point completely coincides with the black solid line in the figure, the measured data are consistent with the inverted data. Due to the influence of free current and displacement of the electrodes in the roadway during actual work, there was some interference with the measured data. It is difficult for the results of inversion to be completely consistent with the measured data. When the intersection point between the measured value and the inversion simulation value is roughly on the diagonal of the diagram, the results of inversion can be considered to be reliable. As shown in the figure, the intersection points between the initial exploration and secondary exploration are roughly located on the diagonal, indicating that the inverted results of the initial exploration and secondary exploration are relatively reliable, and that the results of the inversion model can accurately represent the geological situation of the working face’s floor.

4.3.2. Analysis of the Results of the Initial Exploration

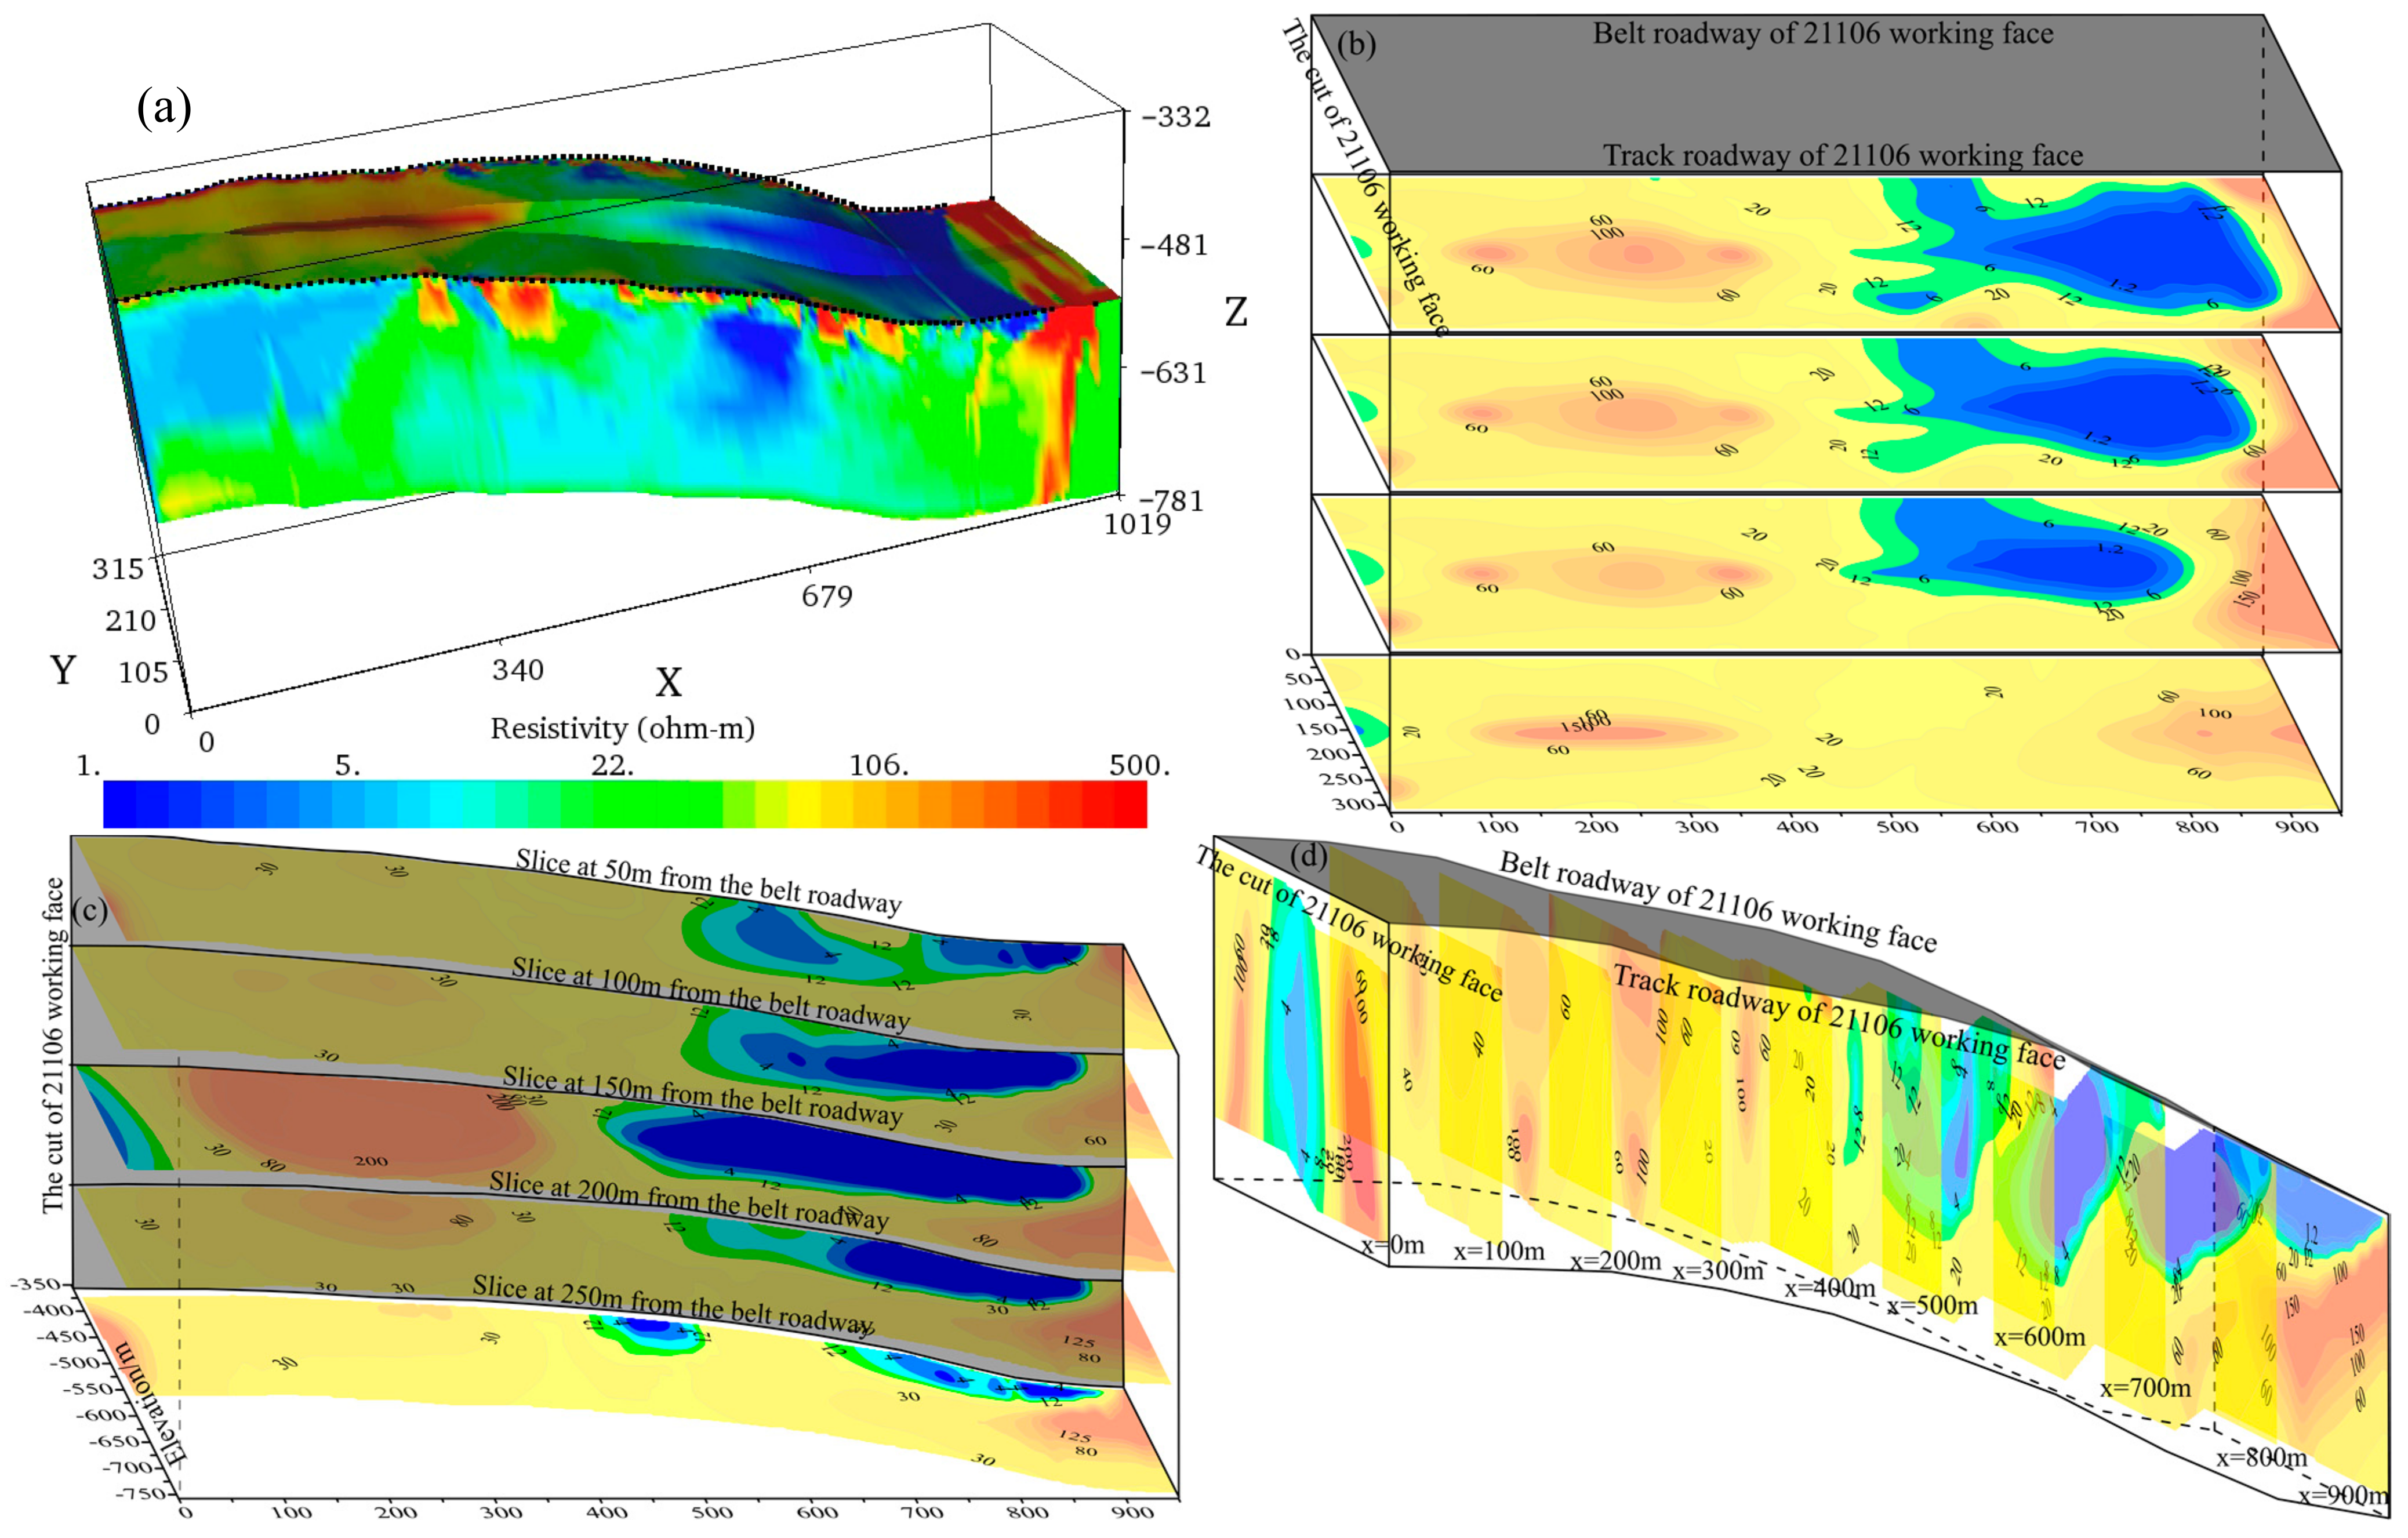
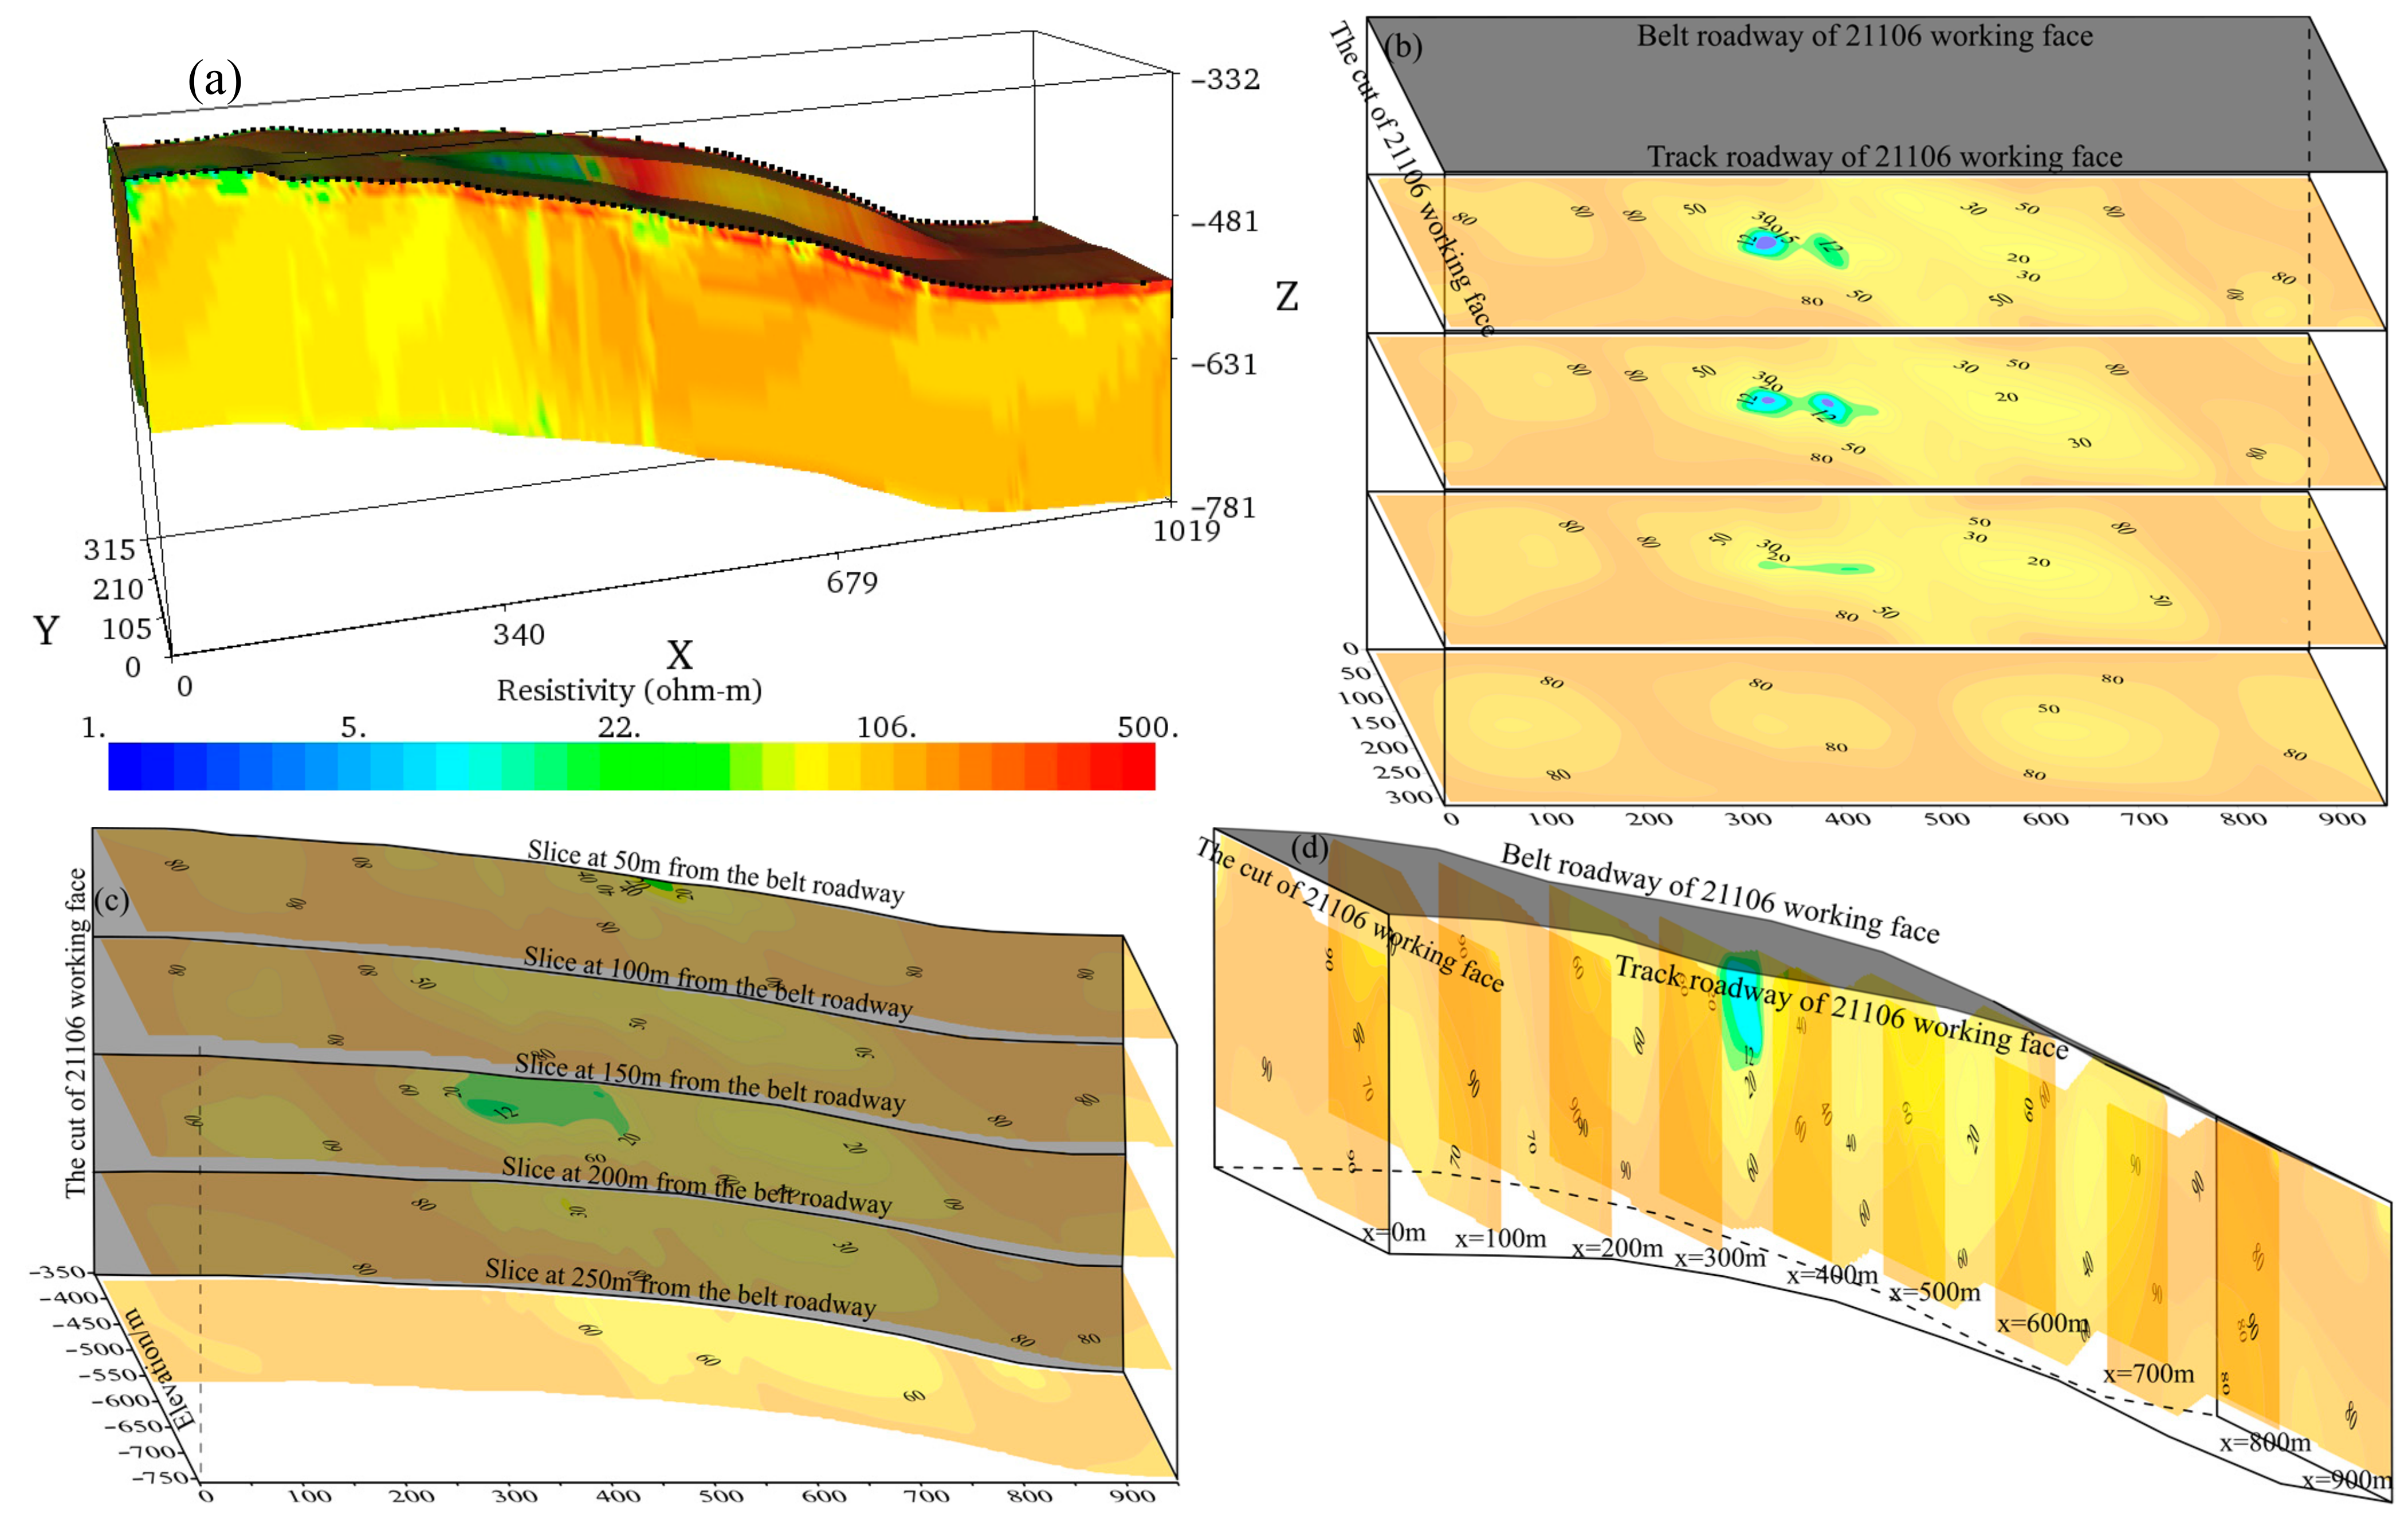
The results of inversion of the 3D observation mode detection data from 4 to 7 January 2023 are shown in Figure 10. Figure 10a shows the results of 3D inversion, and most of the resistivity in the inverted results is less than 20 Ω·m. Due to the difficulty in directly visualizing the internal information of the working face’s bottom plate through 3D displays, data were extracted from different planes to construct the 2D contour maps for analysis. Figure 10b shows the distribution of resistivity at different depths below the floor in the body of 3D resistivity inversion data. The origin of the resistivity contour map is the intersection point of the belt roadway and the setup room, and the low-resistivity area is represented by blue. The darker the color is, the stronger the amplitude of the anomaly. The change in the electrical resistivity of the bottom plate of the working face was relatively small. To ensure that there were no missed areas in the detection of the mine floor, based on the mine’s water and an electrical resistivity rate of 1–12 Ω·m, the area with a resistivity lower than 12 Ω·m was considered to be a low-resistivity anomalous area. There were two areas with a resistivity less than 12 Ω·m at the position of the setup room and within a distance of 450–900 m from the setup room (the green to blue areas in Figure 10b).
Figure 10c shows the x–z plane profiles at distances of 50 m, 100 m, 150 m, 200 m, and 250 m from the belt roadway in the volume of the 3D resistivity inversion data. Figure 10d shows the y–z plane profiles extracted from the volume of the 3D resistivity inversion data at distances of 0 m, 50 m, 100 m, and 150–900 m from the setup room. According to Figure 10b,c, the center of the anomaly is located 40–60 m below the coal seam. According to the drilling data provided by the Xinqiao Coal Mine, the low-resistivity anomaly at the setup room is caused by the accumulation of water in the floor. The water inflow from the drilling hole within a range of 450–900 m from the setup room reaches 128 m3/h, which is caused by the water content in the large-scale cracks of the Taiyuan Formation limestone on the floor of the mine’s working face.

4.3.3. Analysis of the Results of Secondary Exploration

Figure 11 shows the inverted results of the 3D detection data with the opposite-side power supply and reception mode from 8 to 10 May 2023. Figure 11a shows the results of 3D inversion. Most of the resistivity determined via inversion was greater than 20 Ω·m, and only local areas had a resistivity less than 20 Ω·m. As shown in the figure, the resistivity determined via the inversion of the secondary exploration data was greater than that of the initial exploration data and was basically greater than 12 Ω·m, indicating that grouting had significantly treated the water-rich area of the floor. To ensure that there were no issues in the detection of the effect of grouting on the mine floor, the area with a secondary exploration result less than 15 Ω·m was considered to be an area of relatively abnormally low resistivity. There was an area with a resistivity less than 15 Ω·m within the range of 330–450 m from the setup room (green to light blue area in the figure), suggesting that this area of relatively abnormally low resistivity was the main water-rich area of the current limestone floor. The area of abnormally low resistivity was close to the P5 drilling field of the belt roadway. After verification by drilling Holes 5–5 in the P5 drilling field, the water-rich area was found to be considerable at a position 48 m below the coal seam of the area, and the inflow of drilling water reached 53 m3/h. It is speculated that during the process of grouting, the limestone water in the original area of abnormally low resistivity was squeezed into the area of abnormally low resistivity determined according to the results of the secondary exploration.
We used the mine 3D DC resistivity method based on a pole–pole device to detect the effectiveness of grouting treatment on the ground area of Working Face 21106. The results of detection indicated that using the roadways on both sides of the ultrawide working face could increase the detection depth of the mine 3D DC resistivity method, compensate for the shortcomings of traditional geophysical methods in effectively detecting the interior and bottom of the ultrawide working face of the mine, and detect the water-rich area of the ultrawide working face’s bottom. The results of detection were consistent with the results of verification by drilling.

5. Conclusions

This study used a comparative analysis of numerical simulation results and measured data to verify the feasibility of the 3D DC resistivity method for detecting floor grouting in mines. The following conclusions are drawn.
(1)
The mine 3D DC resistivity method based on the steady-state electrical method could effectively detect a water-rich area with a thickness of 10 m at a depth of 60 m below a 300 m wide working face of a mine when using a pole–pole data acquisition device.
(2)
The pole–pole device’s data showed that the opposite-side power supply and reception mode often deviated from the actual model’s electrical properties when calculating the apparent resistivity. The electric field’s distribution was more complex due to the influence of full-space media, so the results of conventional apparent resistivity cannot be used for interpretation. It was necessary to invert the data to accurately obtain underground electrical information.
(3)
The preliminary exploration and secondary exploration of the Working Face 21106 in the Xinqiao Coal Mine, Yongmei Group, Henan Province, China, were divided into two areas of abnormally low resistivity. After the ground grouting treatment, the resistivity of the areas of abnormally low resistivity during the initial exploration significantly increased during the secondary exploration, but there was a new area with relatively low resistivity within the range of 330–450 m from the setup room. According to verification via drilling at the fifth drilling site of the mine’s Working Face 21106, this area is considerably rich in water, caused by the redistribution of groundwater during the process of the ground grouting treatment.

6. Discussion

The mine 3D DC resistivity method has high horizontal resolution and applicability for detecting water-rich areas in the floors of ultrawide working faces of mines. However, due to the limitations of the roadway space, the minimum spacing for collecting 3D resistivity data via the opposite-side power supply and reception mode is the width of the mine’s working face, resulting in a lack of shallow geological information and an inability to accurately obtain the top and bottom boundaries of the water-rich area. In view of this, research on the 3D DC resistivity method based on the full-range layout of boreholes and roadways can be carried out to compensate for the defect that the mine 3D DC resistivity method implemented on only two roadways cannot accurately distinguish the top and bottom boundaries of water-rich areas.

Author Contributions

Conceptualization, M.L., N.L. and X.T.; methodology, M.L.; software, X.W.; formal analysis, M.L.; investigation, R.S.; data curation, M.L.; writing—original draft preparation, N.L.; writing—review and editing, X.W.; supervision, M.L. and X.T.; project administration, R.S. All authors have read and agreed to the published version of the manuscript.

Funding

This research was funded by the National Natural Science Foundation of China (No. 42204139) and the Key Projects of National Natural Science Foundation of China (No. 42230811).

Data Availability Statement

The data presented in this study are available on request from the corresponding author.

Conflicts of Interest

Ning Li, Xuhong Wang and Ruosong Sun are employed by Xinqiao Coal Mine, Yongmei Group Co., Ltd. The remaining authors declare that the research was conducted in the absence of any commercial or financial relationships that could be construed as a potential conflict of interest.

References

  1. Li, Y.J.; Chen, S.T. Practice on mining high-efficiency mining faces of high mining height in Yongcheng coal mine. Coal Technol. 2019, 38, 15–17. [Google Scholar]
  2. Li, J.B.; Miao, W.; Li, Z.H.; Han, J.F.; Xu, H.T.; Li, P. Influence of roadway under coal seam floor on the water resistance of coal seam floor strata with far field stresses and the optimization of control technology. J. China Coal Soc. 2023, 48, 3336–3346. [Google Scholar]
  3. Zhang, J. Research on radio electromagnetic wave perspective detection method through borehole-roadway in mine. J. China Coal Soc. 2020, 45, 2856–2864. [Google Scholar]
  4. Jiao, X.F.; Jiang, Z.H.; Liu, S.C. Exceptional response characters of radio wave perspective in coal thining zone. J. Min. Saf. Eng. 2014, 31, 1001–1004. [Google Scholar]
  5. Yang, S.T.; Wei, J.C.; Cheng, J.L.; Shi, L.Q.; Wen, Z.J. Numerical simulations of full-wave fi elds and analysis of channel wave characteristics in 3-D coal mine roadway models. Appl. Geophys. 2016, 13, 621–630. [Google Scholar] [CrossRef]
  6. Liu, Q.; Hu, J.W.; Wwang, P. Analogue modeling of Love type channel wave and its response to faults. Coal Geol. Explor. 2023, 51, 116–122. [Google Scholar]
  7. Ji, G.Z.; Li, H.; Wei, J.C.; Yang, S.T. Preliminary study on wave field and dispersion characteristics of channel waves in VTI coal seam media. Acta Geophys. 2019, 67, 1379–1390. [Google Scholar] [CrossRef]
  8. Wang, J.; Cheng, J.L.; Huang, Z.Z.; Dong, Y.; Li, Z.G.; Yang, S.J. Mine transient electromagnetic method in detecting the water abundance of rock strata with low resistance in roof. Min. Saf. Environ. Prot. 2023, 50, 76–81. [Google Scholar]
  9. Chang, J.H.; Su, B.Y.; Malekian, R.; Xing, X.J. Detection of water-filled mining goaf using mining transient electromagnetic method. IEEE Trans. Ind. Inform. 2020, 16, 2977–2984. [Google Scholar] [CrossRef]
  10. Su, B.Y.; Yu, J.C.; Sheng, C.X.; Zhang, Y.L. Maxwell-equations based on mining transient electromagnetic method for coal mine-disaster water detection. Elektron. Elektrotech. 2017, 23, 20–23. [Google Scholar] [CrossRef]
  11. Li, M.F.; Liu, S.C.; Jiang, Z.H.; Su, B.Y.; Chen, S.S. Detecting floor geological information by mine DC perspective and 3D inversion. J. China Coal Soc. 2022, 47, 2708–2721. [Google Scholar]
  12. Yue, J.H.; Zhang, H.R.; Yang, H.Y.; Li, F.P. Electrical prospecting method for advance detection progress, problems, and prospects in Chinese coal mine. IEEE Geosci. Remote Sens. Mag. 2019, 7, 94–106. [Google Scholar] [CrossRef]
  13. Yuan, Y.B.; Yi, H.C. Detection test of coal seam hydraulic fracturing range based on multi-frequency synchronous electromagnetic wave CT technology. Ind. Mine Autom. 2020, 46, 51–57. [Google Scholar]
  14. Kaufman, A.A. Geophysical Field Theory and Method, Part A: Gravitational, Electric, and Magnetic Field; Academic Press: New York, NY, USA; Harcourt Brace Jovanovich Publishers: New York, NY, USA, 1992; pp. 200–396. [Google Scholar]
  15. Rao, R.F.; Su, B.Y. Direct current resistivity method and the transparency of mining face. Geophys. Geochem. Explor. 2022, 46, 563–569. [Google Scholar]
  16. Liu, B.B.; Guo, C.; Yang, H.T. Research on the integrated electric exploration system for coal mines and its application. Coal Geol. Explor. 2021, 49, 247–252. [Google Scholar]
  17. Dahlin, T. The development of DC resistivity imaging techniques. Comput. Geosci. 2001, 27, 1019–1029. [Google Scholar] [CrossRef]
  18. Shaw, R.; Srivastava, S. Particle swarm optimization: A new tool to invert geophysical data. Geophysics 2007, 72, F75–F83. [Google Scholar] [CrossRef]
  19. Hauck, C.; Vonder Muhll, D.; Maurer, H. Using DC resistivity tomography to detect and characterize mountain permafrost. Geophys. Prospect. 2003, 51, 273–284. [Google Scholar] [CrossRef]
  20. Kalscheuer, T.; Juanatey, M.D.G.; Meqbel, N.; Pedersen, L.B. Non-linear model error and resolution properties from two-dimensional single and joint inversions of direct current resistivity and radiomagnetotelluric data. Geophys. J. Int. 2010, 182, 1174–1188. [Google Scholar] [CrossRef]
  21. Hunt, P.; Powell, N.; Watson, K.A. Limiting apparent-resistivity values for dipping-bed earth models. Geophys. Prospect. 2001, 49, 577–597. [Google Scholar] [CrossRef]
  22. Liu, S.-D.; Wu, R.-X.; Zhang, P.-S.; Cao, Y. Three-dimensional parallel electric surveying and its application in water disaster exploration in coal mines. J. China Coal Soc. 2009, 34, 927–932. [Google Scholar]
  23. Huang, J.G.; Wang, J.L.; Ruan, B.Y. A study on advanced detection using DC resistivity method in tunnel. Chin. J. Geophys. 2006, 49, 1529–1538. [Google Scholar]
Figure 1. Diagram of the DC resistivity method.
Water 16 01491 g001
Figure 2. Layout diagram of the electrodes of the mine 3D DC resistivity method.
Water 16 01491 g002
Figure 3. Schematic diagram of models with different thicknesses.
Water 16 01491 g003
Figure 4. Curves of the background’s apparent resistivity.
Water 16 01491 g004
Figure 5. Apparent resistivity curves for various thicknesses of the water-rich zone.
Water 16 01491 g005
Figure 6. Curves of the rate of change in apparent resistivity.
Water 16 01491 g006
Figure 7. The Syscal Pro DC resistivity instrument.
Water 16 01491 g007
Figure 8. Schematic diagram of the layout of construction using the 3D resistivity method in mines.
Water 16 01491 g008
Figure 9. Intersection diagram of the simulated and measured results.
Water 16 01491 g009
Figure 10. Inverted results of the initial exploration of the mine 3D DC resistivity method. (a) The volume of the 3D resistivity inversion data; (b) x-y plane profiles at different distances from the bottom of working face 21106; (c) x-z plane profiles at different distances from the belt roadway; (d) y-z plane profiles at different distances from the cut of working face 21106.
Water 16 01491 g010
Figure 11. Inverted results of the secondary exploration of the mine 3D DC resistivity method. (a) The volume of the 3D resistivity inversion data; (b) x-y plane profiles at different distances from the bottom of working face 21106; (c) x-z plane profiles at different distances from the belt roadway; (d) y-z plane profiles at different distances from the cut of working face 21106.
Water 16 01491 g011
Disclaimer/Publisher’s Note: The statements, opinions and data contained in all publications are solely those of the individual author(s) and contributor(s) and not of MDPI and/or the editor(s). MDPI and/or the editor(s) disclaim responsibility for any injury to people or property resulting from any ideas, methods, instructions or products referred to in the content.

