Article

Optimization of Injection Methods in the Microbially Induced Calcite Precipitation Process by Using a Field Scale Numerical Model

1
Department of Hydraulic Engineering, College of Civil Engineering, Tongji University, Shanghai 200092, China
2
Department of Geotechnical Engineering, College of Civil Engineering, Tongji University, Shanghai 200092, China
3
Key Laboratory of Geotechnical and Underground Engineering of the Ministry of Education, Tongji University, Shanghai 200092, China
*
Authors to whom correspondence should be addressed.
Water 2024, 16(1), 82; https://doi.org/10.3390/w16010082
Submission received: 7 November 2023 / Revised: 13 December 2023 / Accepted: 22 December 2023 / Published: 25 December 2023

Abstract

:
Microbially induced calcite precipitation (MICP) is a promising, more eco-friendly alternative method for landslide prevention and foundation reinforcement. In this study, we investigated the optimization of injection methods within the MICP process in porous media to enhance calcite mass and consolidation effect. The results demonstrated that staged injections with considerable advantages significantly improved precipitated calcite mass by 23.55 % compared with continuous injection methods. However, extended retention times in staged injections reduced reinforcement effects. Moreover, setting the additional time in all injection methods can improve the consolidation area and effect without added injections. Apart from the injection methods, the changes in porosity and substance concentration also directly affected calcite masses and the reinforcement effect. Both the total calcite mass and the reinforcement effect should be taken into account when selecting appropriate injection methods. In terms of influencing factors on the total calcite mass, substance concentration ≫ average porosity ≫ additional time > retention time in staged injection. For the consolidation effect, substance concentration ≫ retention time in staged injection > average porosity ≫ additional time. The 5 h retention time in staged injections was recommended as the optimum injection method in the geotechnical conditions for average porosity from 0.25 to 0.45 , with the changes in different reactant concentrations.

1. Introduction

In recent years, frequent weather extremes and extensive human activities in the field of engineering have aggravated the risk of landslide geohazards. As a result, landslides have risen to become the fourth most serious natural hazard worldwide, which has presented substantial challenges in the field of geotechnical engineering [1,2,3,4,5]. These geological disasters lead to loss of life and economy and enormous environmental damage [6,7,8]. Physical methods, such as anchor cables, pile-anchor structures (PAS), and membrane structures, are widely adapted and implemented. These methods can enhance slope stability and mitigate landslides [5,9,10]. Moreover, chemical stabilizers (soil agents) such as cement, lime, and fly ash are applied to modify soil properties, in which the strength and stiffness are improved to prevent soil erosion [11,12,13]. However, these prevention methods of landslides have high energy costs and sometimes fail under extreme conditions. Additionally, some of them increase soil pH and produce high carbon emissions to harm the atmosphere, which are environmentally unfriendly and unsuitable for large-scale applications [14,15,16,17,18].
In comparison with conventional methods, biological methods, e.g., microbially induced calcite precipitation (MICP), have recently gained significant attention in disaster prevention and have been extensively studied [19,20,21]. MICP is a promising, more eco-friendly, more sustainable alternative method in soil treatment that has wide applicability for reinforcing foundations, resisting erosion, and stabilizing slopes [22,23,24,25,26,27,28,29]. In MICP reaction, the bacteria (typically Sporosarcina pasteurii) catalyze the hydrolysis of urea to produce ammonium ( N H 4 + ) and carbonate ( C O 3 2 ). Subsequently, carbonate reacts with calcium sources (e.g., C a C l 2 ) to precipitate calcite ( C a C O 3 ). The whole MICP process can be given in Equation (1) [30,31].
C O N H 2 2 + 2 H 2 O + C a 2 + S . pasteurii 2 N H 4 + + C a C O 3
Reference [32] first applied the MICP method to improve soil strength without soil disturbance under laboratory conditions. Recently, this method has been implemented for slope stabilization in the field scale.
While applying the MICP technology in field engineering, the precipitated calcite mass and consolidation effect are a matter of particular concern [33,34]. The increase in calcite amounts directly correlates with an increase in the strength and stiffness of treated solid particles and a decrease in permeability [35,36,37]. In terms of landslide prevention, more precipitated calcite contributes to slope stabilization and soil reinforcement, which reduces landslide risk [13,38]. Apart from the factors such as bacterial species [39,40], calcium sources [41,42], soil intrinsic characteristics [43,44], and the surrounding environment [45,46], the injection strategy also significantly affects the amount of precipitated calcite [47,48,49]. The application of suitable injection strategies in the engineering of landslide prevention can produce more precipitated calcite and reduce economic costs.
To obtain a deeper understanding of the effect of injection strategies on the amount of precipitated calcite, many experimental and numerical studies have been carried out. The mixture of bacterial and cementation solutions was directly injected into the soil samples, which caused calcite to be rapidly generated near the injection point, resulting in the blockage of mass transport [50,51]. Whiffin et al. [52] first proposed a two-phase injection method, i.e., staged injection method, with retention times to effectively avoid clogging near the injection point and have wide adaptability. Thus, the staged injection strategy was widely applied in current research and engineering [51,53]. In the staged injection, the loss of urease activity can be supplied in time during the reaction due to multiple additions of bacterial solutions [23,54,55]. In short, multiple supplies in the phased injection stimulate the bacteria activity in the process, extend the reaction continuity, significantly increase the calcite content, and form homogeneous distributions [56,57]. However, the limitations, such as the increase in injection time, the high cost of large-scale field tests, and the limited number of variables, make the experimental studies difficult to carry out comprehensively [47].
Apart from experimental studies, the effect of injection strategies on precipitated calcite masses is studied by numerical simulations. Faeli et al. [58] changed the injection number and retention time in the simulations of the MICP process. During the various simulations, it was observed that with the increase in injection numbers from 9 to 39, the average calcite content increased by 8 % , and the heterogeneity of precipitation decreased by 1.8 % . At sufficient retention time, low bacterial concentrations result in a slower urease rate, which contributes to generating more uniform calcite distributions [23,47,59]. Under the same injection method, soil types, bacterial concentrations, and cementation concentrations interact and also combine together to influence the calcite amount [43,48]. These simulation investigations have demonstrated the potential of staged injection. However, how to maximize these advantages, i.e., the optimization of the injection method, still requires further research.
To investigate the optimization of the injection method, we apply the Darcy-scale mathematical model to simulate the MICP processes under different injection scenarios and compare the calcite mass and consolidation effect. This proposed model based on our previous numerical work has been validated. In this study, the injection scenarios contain the changes in injection methods, soil types, and bacteria and cementation concentrations. The paper is structured as follows: In Section 2, the details of the numerical model concept are described. We investigate the effect of injection methods (in Section 3.1) and the interactions for multifactors (in Section 3.2 and Section 3.3) on the MICP processes. We apply the orthogonal experiments to analyze the significance of each factor in the whole reaction (in Section 3.4). Finally, the summary and conclusions are written in Section 4.

2. Model Concept

2.1. Model Assumptions

In practice, the complex MICP process is affected by multiple factors [47,60,61]. It is difficult to take all factors into account in modeling. To efficiently simulate the MICP reaction process in the field scale, the numerical model in the study is built based on the following assumptions.
  • The flow in porous media is fully saturated and incompressible, with constant viscosity. Additionally, simulations of unsaturated flow are not taken into account.
  • The reaction process is only divided into two phases: the liquid phase and the solid phase. In the liquid phase, the metabolism of suspended bacteria and ureolysis take place, while in the solid phase, the attached bacteria metabolism and precipitation occur.
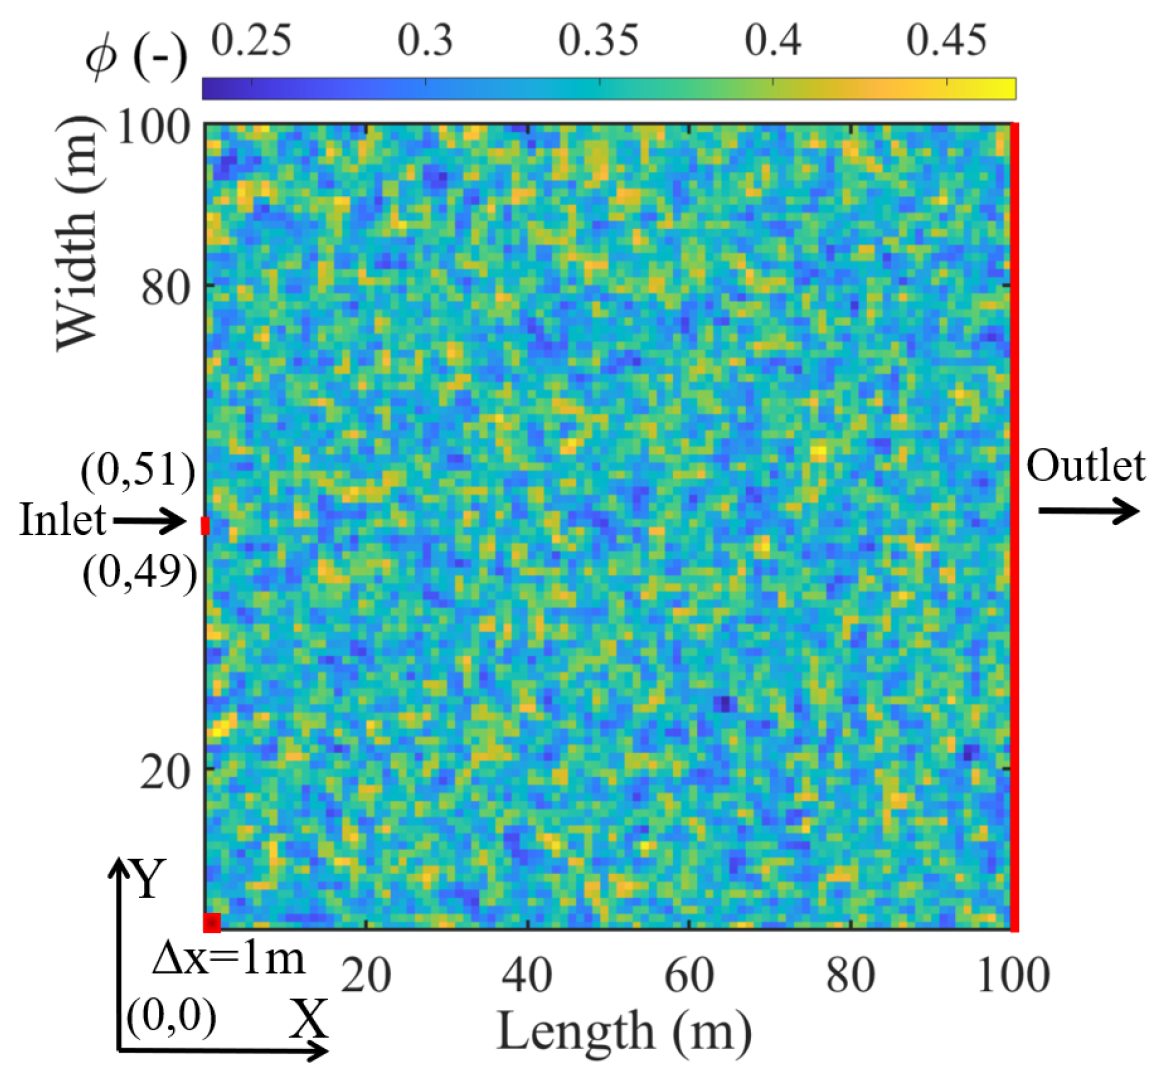
  • To effectively investigate the influence of injection strategies, the initial pH and temperature are the same in the following simulated tests. The initial pH is 7, and the temperature is 25 °C [43]. The influence of pH, temperature, and gravity on the reaction process is not considered. The porous media are quantified by porosity in heterogeneity.
  • There is an abundant supply of calcium source. When bacteria and reactant solutions come into contact, they will react immediately [49,62].

2.2. Flow Model

Based on the above assumptions, the MICP process at the field scale is simulated. To simulate slow flow in porous media, the governing equation for fluid flow in porous media is mathematically described by Darcy’s law. The Darcy-scale model can effectively simulate the slow injection process, which is consistent with the engineering practice. The flow velocity as represented by the Darcian velocity q [ L T 1 ] is given by
q = k μ l p + ρ l g
where k [ L 2 ] and μ l [ L 1 M T 1 ] refer to the instinct permeability of the porous media and kinematic viscosity of the liquid, respectively. The flow velocity is limited by the hydraulic gradient h [ M L 1 T 2 ] , which is composed of the gradient of the flow pressure p, and the gravity force ρ g . ρ [ M L 3 ] and g [ L T 2 ] denote the fluid density and gravity vector.
Changes in porosity and permeability
Numerous experimental studies have shown that the flow velocity and pore spaces gradually decrease due to the increase in precipitated calcite [25,63]. Therefore, it is considered that the decrease in pore space volume is equal to the increase in the volume of produced calcite. The decrease rate of porosity ϕ [ ] over time is expressed as
ϕ t + C C a C O 3 t ρ C a C O 3 = 0
where C C a C O 3 and ρ C a C O 3 [ M L 3 ] present the precipitated calcite concentration at the last time interval and the bulk density of precipitated calcite, respectively. The current permeability k n [ L 2 ] in pore at time intervals is given by the traditional Kozeny–Carman (KC) equation [64],
k n = k 0 ( ϕ n ) 3 ( 1 ϕ n ) 2 ( 1 ϕ 0 ) 2 ( ϕ 0 ) 3
where ϕ n and ϕ 0 [ ] refer to the current porosity at time intervals and the original effective porosity, respectively. k 0 [ ] denotes the initial permeability, as a given parameter [49].

2.3. Mass Transport and Biochemical Reaction Model

The mass transport of bacteria and chemical components in both the liquid and solid phases is mathematically described by a set of advection–diffusion–reaction (ADR) equations, derived from the macroscopic mass balance. The present transport model is developed based on [49], in which we also consider bacterial growth and its effects. The liquid phase includes suspended bacteria, urea, calcium, ammonium, and carbonate, while the solid phase contains attached bacteria and precipitated calcite. Due to the immobile solid substances, the substances in the solid phase only make reactions. In the liquid phase, the advection and diffusion of substances are also considered. The mathematical expressions are described in detail later.
Liquid phase
The mass balance of substances in the liquid phase is governed by the ADR equation. Its general expression reads,
ϕ C i t = · ϕ D · C i · q C i + Ω i
where C [ N L 3 ] is the key variable, which denotes the concentration of each substance. D [ L 2 T 1 ] and Ω [ N L 3 T 1 ] refer to the diffusion–dispersion tensor and sink/source term produced by reactions, respectively. Index “i” is used to refer to suspended bacteria ( s u s B a c t ), urea, C a 2 + , N H 4 + , C O 3 2 , attached bacteria ( a t t B a c ), and C a C O 3 . For simplicity, we apply the optical density at 600 nm as a unit of the bacterial concentration.
The reaction term of suspended bacteria Ω s u s B a c t is composed of their attachment Ω a t t and growth Ω a t t processes. The attachment process denotes that suspended bacteria migrate to the solid surface and immobilize as attached bacteria. This process also includes the straining mechanism, in which some suspended bacteria become trapped in cracks and narrow pore throats [49]. These processes are all irreversible. Ω s u s B a c t [ O D 600 T 1 ] reads,
Ω s u s B a c t = Ω a t t + Ω g r o
Ω s u s B a c t = ϕ ( r a t t U a t t + r s t r ) S a t t C s u s B a c t + ϕ r g r o S a t t C s u s B a c t
In Equation (7), r a t t , r s t r , and r g r o [ T 1 ] are rate constants of the attachment, straining, and growth processes, respectively. In these reactions, the parameters U a t t and S a t t [ ] for the velocity dependence and neighbor attachment cells are also applied.
Urea is hydrolyzed and consumed under the influence of urease. The microbe-catalyzed reactions can be defined by modifying the Monod equation. In addition to urea concentration, we also consider the effects of ammonium inhibition and bacterial concentration on the ureolysis reaction. The reaction term of urea Ω u r e a [ N L 3 T 1 ] can be further given by
Ω u r e a = Ω u r e o = ϕ C B a c t r u r e o C u r e a R m + C u r e a R N H 4 + R N H 4 + + C N H 4 +
C B a c t = C s u s B a c t + C a t t B a c t
where r u r e o [ T 1 ] denotes the ureolysis rate. R m and R N H 4 + [ N L 3 ] present ureolysis constants for the half saturation and the ammonium inhibition, respectively.
The calcium source is continuously consumed due to the formation of precipitated calcite. The precipitation reaction Ω p r e c depends on the minimum concentrations of produced carbonate and calcium. Therefore, the sink term of calcium Ω C a 2 + [ N L 3 T 1 ] is written as
Ω C a 2 + = Ω p r e c = ϕ r p r e c min ( C C a 2 + , C C 0 3 2 )
where r p r e c [ T 1 ] is the precipitation rate.
Two moles of ammonium and one mole of carbonate are produced with each of the consumed mole of urea. The source term for the ammonium reads,
Ω N H 4 + = 2 Ω u r e o = 2 ϕ C B a c t r u r e o C u r e a R m + C u r e a R N H 4 + R N H 4 + + C N H 4 +
Carbonate is produced by the ureolysis reaction Ω u r e o and consumed by the precipitation reaction Ω p r e c . The reaction term of carbonate Ω C O 3 2 [ N L 3 T 1 ] is expressed as
Ω C O 3 2 = Ω u r e o Ω p r e c
Ω C O 3 2 = ϕ C B a c t r u r e o C u r e a R m + C u r e a R N H 4 + R N H 4 + + C N H 4 + ϕ r p r e c min ( C C a 2 + , C C 0 3 2 )
Solid phase
The bacteria attached to the particle surface and the precipitated calcite are considered immobile. The governing equation for solid substances removes the advection and diffusion terms, retaining only the reaction term. Thus, the governing equations for attached bacteria and calcite ( C a C O 3 ) read,
ϕ C a t t B a c t = Ω a t t B a c = Ω a t t + Ω g r o C a t t B a c C C a C O 3 R e n c a
Ω g r o = ϕ r g r o S a t t C a t t B a c
C C a C O 3 t = Ω C a C O 3 = Ω p r e c M W C a C O 3
For attached bacteria, the source term, including the attachment and growth reactions, and the sink term, accounting for the encapsulation reaction, are combined in Equation (14). Some of the attached bacteria become inactivated and die in the encapsulation process. For calcite precipitation, R e n c a [ M L 3 T 1 ] and M W C a C O 3 [ M N 1 ] refer to the constants of the encapsulation rate and the calcite molecular weight, respectively. The transport process for each substance and its mathematical expressions are presented in Figure 1.

2.4. Numerical Simulation Scheme

In this simulation, we model two processes: flow process and mass transport, and solve the corresponding equations (Equations (2)–(4) and Equations (5)–(16)), which have been mathematically described in detail in Section 2.2 and Section 2.3. These processes are simulated by using the open-source finite element code OpenGeoSys (OGS) [65]. The substance reactions are mathematically solved by the integrated reaction solver, namely, PHREEQC [66,67]. In every time interval, the concentration of each substance is iteratively calculated between the mass transport and the reaction process. The changes in substance concentration can affect the amount of precipitated calcite and porosity in porous media. In total, we utilize the OGS (6.4.4) and PHREEQC with the operator-splitting method (OSM) [68] to simulate the whole MICP process. The coupled concept in the model is illustrated in Figure 2.

3. Results

In this section, we first investigate the effect of injection methods on the MICP processes and the effect of soil types and substance concentrations under different injection methods by the Darcy-scale numerical model based on our previous study. This numerical model has been validated and could well reproduce the experimental data [69]. Its relative parameters are written in Appendix A. Finally, we analyze which factors impact the participated calcite mass and consolidation effect the most by the orthogonal experiments [70,71] and optimize the injection methods.
Model setup
To simulate the two-dimensional MICP processes, we apply the validated numerical model to carry out in a 100 × 100 m 2 computational domain. Initially, the whole domain is filled with 0.05 M C a C l 2 as the fixation fluid [69]. Next, bacteria ( C s u s B a c t = 1.538 O D 600 ) and cementation solutions ( C u r e a / C a 2 + = 1.1 M ) are injected from the middle of the left boundary and flow out through the right boundary, as shown in Figure 3. The boundary conditions follow the experimental setup [69]. In the flow equation, constant velocity is set at the inlet and constant pressure at the outlet. For the mass transport, we apply given fluxes and zero-gradient concentrations for substances at the respective boundaries. Based on the particle size in experiments [72,73], we select the coarse sand with the initial average porosity ( ϕ ) as 0.35 to simulate, in which the average particle diameter is 1.82 mm with randomly heterogeneous distributions. More information in terms of model parameters and boundary conditions is listed in Appendix A.

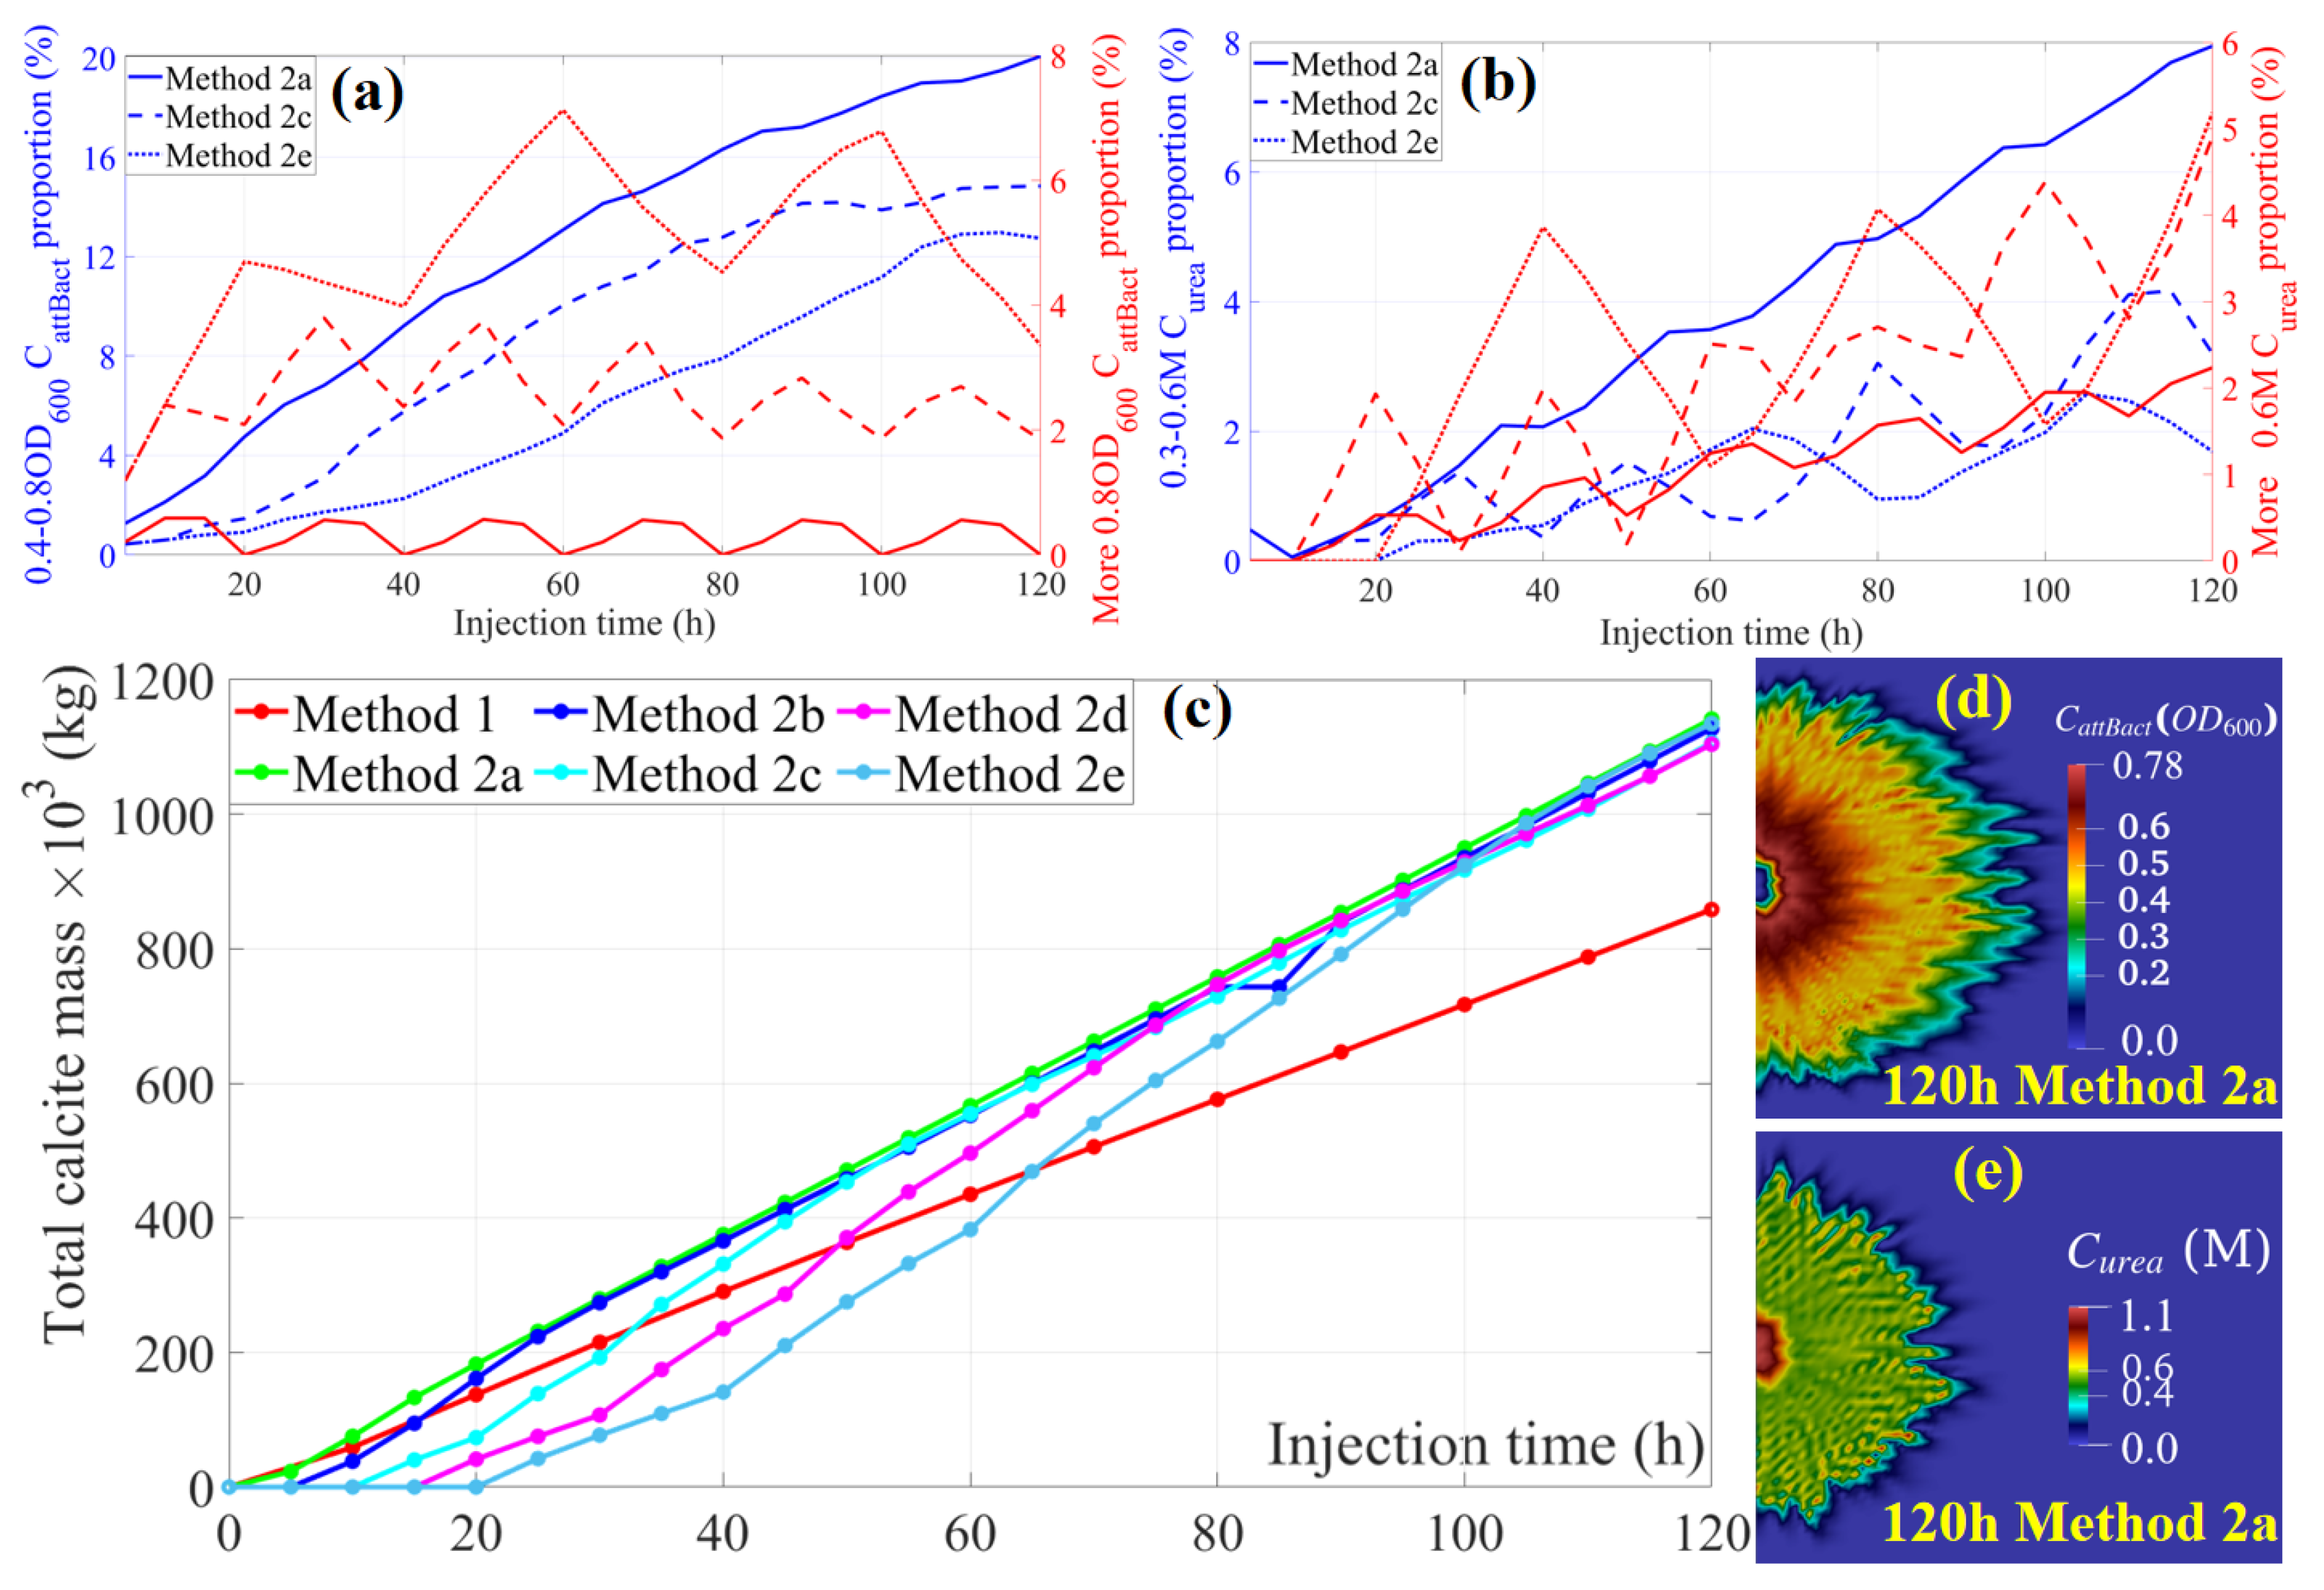
3.1. Effect of Injection Methods (Case 1)

As the changes in retention time during the staged injections directly impact bacteria distribution, we vary the retention time to investigate the effect of injection methods on the MICP process. At the same injected substance amounts, the injection methods are divided based on the difference in retention times, as shown in Table 1. For staged injection, the bacterial solution is first injected, followed by the cementation solution, and repeated in turn, while bacterial and cementation solutions are together injected during the continuous injection. Additionally, after the injection stops, the reaction still continues for a long time; thus, we set an additional time ( 30 h ) to wait for the remaining reaction to complete.
The simulated concentration proportions for bacteria and urea vary over time, as presented in Figure 4a,b. All staged injection methods and some of the same obtained conclusions are compared. To avoid repeated descriptions and better observe the influence of retention times, only Methods 2a, 2c, and 2e are shown and analyzed. We find that high concentration profiles (more than 0.8 O D 600 C a t t B a c t and 0.6 M C u r e a ) show multiple peaks, since the substances are added in terms of different retention times stage by stage. The changes in high bacteria concentration proportions present downward trends due to the excessive effects of decay and encapsulation, and the proportions with medium concentrations ( 0.4 0.8 O D 600 ) transformed by high concentrations continuously increase. Although the continuous ureolysis reaction causes urea amounts to decrease, the urea concentration proportions of all groups gradually increase due to supplementation in time. Furthermore, we observe that the consumed cementation amounts translate into the precipitated calcite mass. It means that greater consumed cementation amounts represent more precipitated calcite mass, and the changes in the total calcite mass can indirectly influence the reinforcement effects. Due to metabolism, the bacterial concentration from the inlet to the outlet gradually decreases. Thus, the concentration distributions of bacteria and urea differ after the end of total injections (120 h), especially in the conditions with short retention times (like Method 2a), as shown in Figure 4d,e. Due to the constant flow velocity and few reaction times, the distribution areas of bacteria and cementation solutions under continuous injections are smaller under staged injections. Under continuous injections, the cementation concentration in the distribution area is almost constant.
The change of the precipitated calcite mass under different injection methods over time is illustrated in Figure 4c. During the injection phase, calcite mass steadily increases. Additionally, the total calcite mass under staged injections is much more than that under continuous injections. Combined with Table 2, the precipitated calcite mass is increased by an average of 23.55 % under staged injections. This is due to the high reactant utilization under the staged injections. As a remark, these precipitated calcite amounts under staged injections with different retention times are almost the same, with a maximum difference of 3.28 % . It means that with the same reactant amounts, variations in retention time hardly affect the total precipitated calcite mass. However, as the retention time increases, the proportions of each concentration gradient vary due to the intensification of nonuniform bacteria distributions. The proportion of calcite concentration exceeding 0.9 kg/L drops by a maximum of 26.70 % . This reduction in proportion can result in the diminishing of the reinforcement effect and no obvious improvement in soil strength and stability.
Simulation results of total calcite mass with and without the additional time are also listed in Table 2. The simulation results demonstrate that it is important to set the additional time to wait for the MICP process to fully complete. Without the added supply of bacteria and reactants, the total precipitated calcite mass in all cases considering the additional time rises, with an average increase of 6.33 % , and its consolidation effect also increases. However, due to self-metabolism, the residual bacteria continuously reduce until there is no ureolysis reaction. Thus, the increased rate of precipitated calcite mass gradually decreases with time.
After considering the additional time, the calcite mass in Method 2b is slightly less than that in Method 2a, yet its proportion of high-concentration calcite exceeds that in Method 2a, with more convenient operation. Finally, Method 2b (the staged injection with retention times of 5 h) is the optimum injection method under this condition.

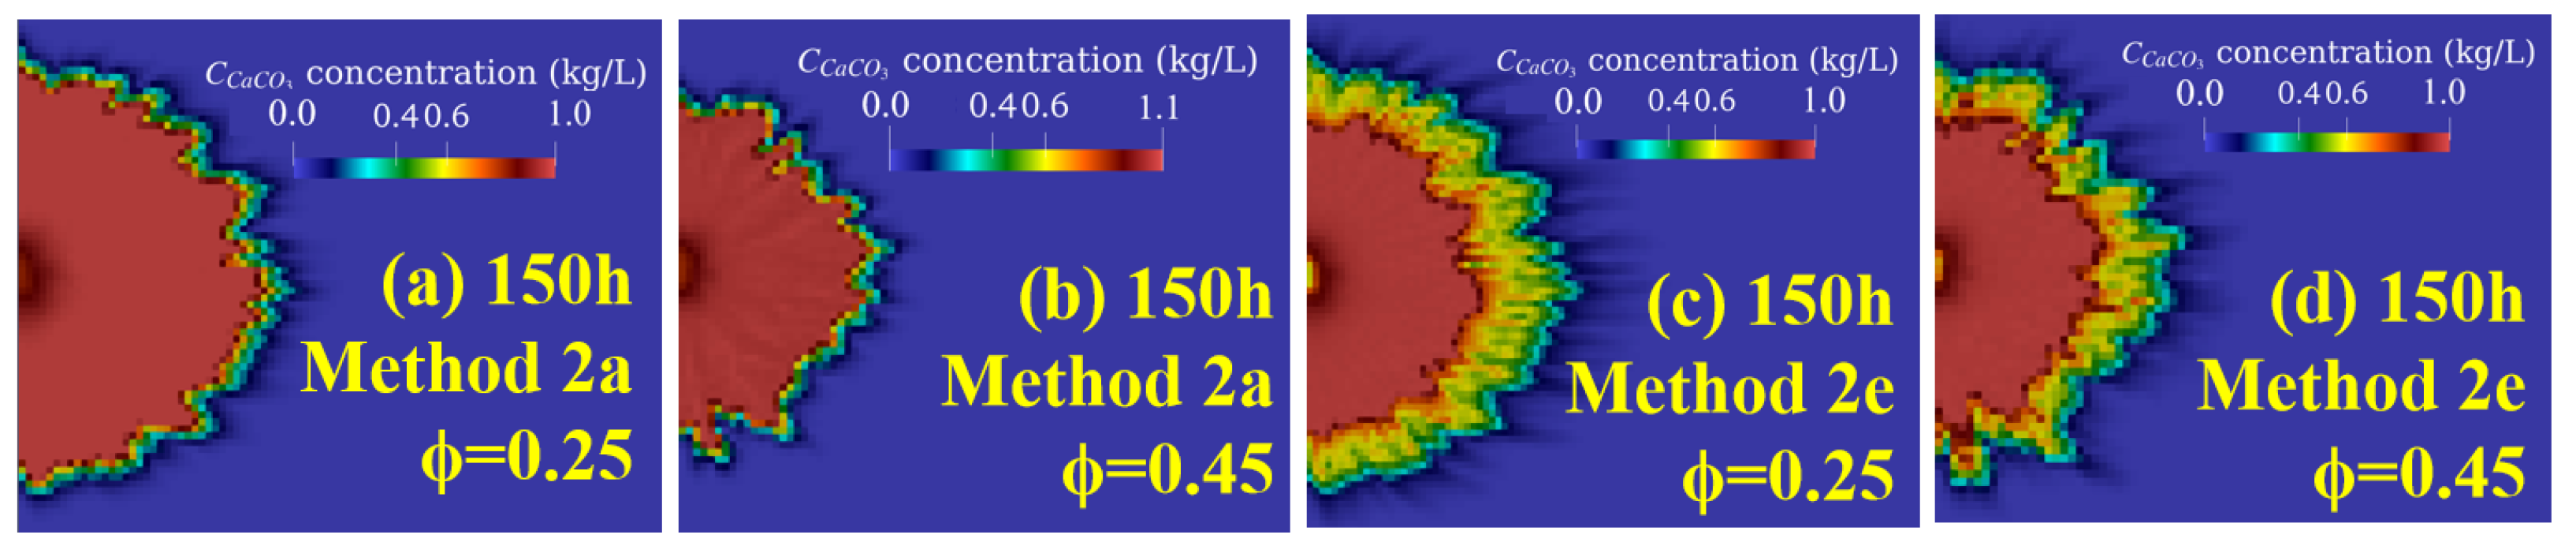
3.2. Effect of Soil Types under Different Injection Methods (Case 2)

To gain a deep insight into the effects of soil types under different injection methods on total calcite masses and reinforcement effect, we simulate the MICP process with the changes in average porosity. In terms of soil types, we control the changes in the soil parameters, namely, the average porosity and correlation length. It can be extended to different types of soils and geological conditions. In the simulation, we create three heterogeneous pore distributions (Figure 5), with average porosities of 0.25 , 0.35 , and 0.45 , respectively.
The comparisons of total calcite mass and the proportion of high-concentration calcite for changes in average porosity under different injection methods are illustrated in Figure 6. It is observed that the total calcite mass and its high-concentration proportion gradually decrease with the increase in average porosity in all cases. This indicates that the consolidation area and its mechanical strength are influenced and continuously decline due to the flow velocity reduction. Compared with continuous injections, the precipitated calcite mass under staged injections is much larger, with better consolidation effects in general. Its difference can reach approximately 400 × 10 3 kg . As shown in Figure 6a, we further calculate the falling rate with the increase in porosity under different injection methods. The increase in average porosity from 0.25 to 0.45 resulted in a reduction in calcite mass of about 28 % and 22 % , respectively. The reduction rates of all groups have little difference, which denotes that the change of calcite amounts with the porosity is unaffected by retention time in staged injections. However, the retention time in staged injections remarkably affects the calcite concentration distribution (Figure 6b). Combined with Figure 7, it is noted that excessive retention times aggravate the decrease in consolidation effects. By decreasing the retention time, the uniform bacterial distribution improves its proportion of high concentration, which contributes to improving the mechanical strength in consolidation areas. However, frequent injections result in the slowing down or even plateauing of the reinforcement effect.
Apart from the effect of average porosity, different pore distributions at the same porosity are considered. Through simulations, it is noticed that the random heterogeneous distribution under the same average porosity has no influence on both the precipitated calcite mass and its proportion of each concentration, and only varies the consolidation distribution. Specifically, it results in heterogeneous calcite precipitation and influences the soil stiffness and strength in local areas. In areas with higher porosity, there are more available spaces for the cementation solution to flow and precipitate calcite. The strength of the consolidated soil can vary across the formation due to the heterogeneous calcite distribution. Regions with higher calcite concentration show greater shear strength and stability. An increase in retention time in injection methods results in poor consolidation and intensifies the heterogeneous distribution of calcite concentration.
We select the average porosity from 0.25 to 0.45 to investigate. In this range of average porosity, the soil types are fine and coarse sands and generally widely applied in engineering. In this geotechnical condition, Methods 2a, 2b, and 2c demonstrate significant and favorable outcomes in the total calcite mass and reinforcement effect in the consolidation area. Specifically, with the increase in retention time from 2 h to 10 h , the precipitated calcite mass and consolidation effect are all significant and only have little difference. In addition to these aspects, Method 2c stands out as it offers the advantage of simpler operational procedures and lower costs for labor, equipment, and maintenance. Thus, Method 2c is recommended; however, other injection methods can be considered in practical works, according to the specific requirements.

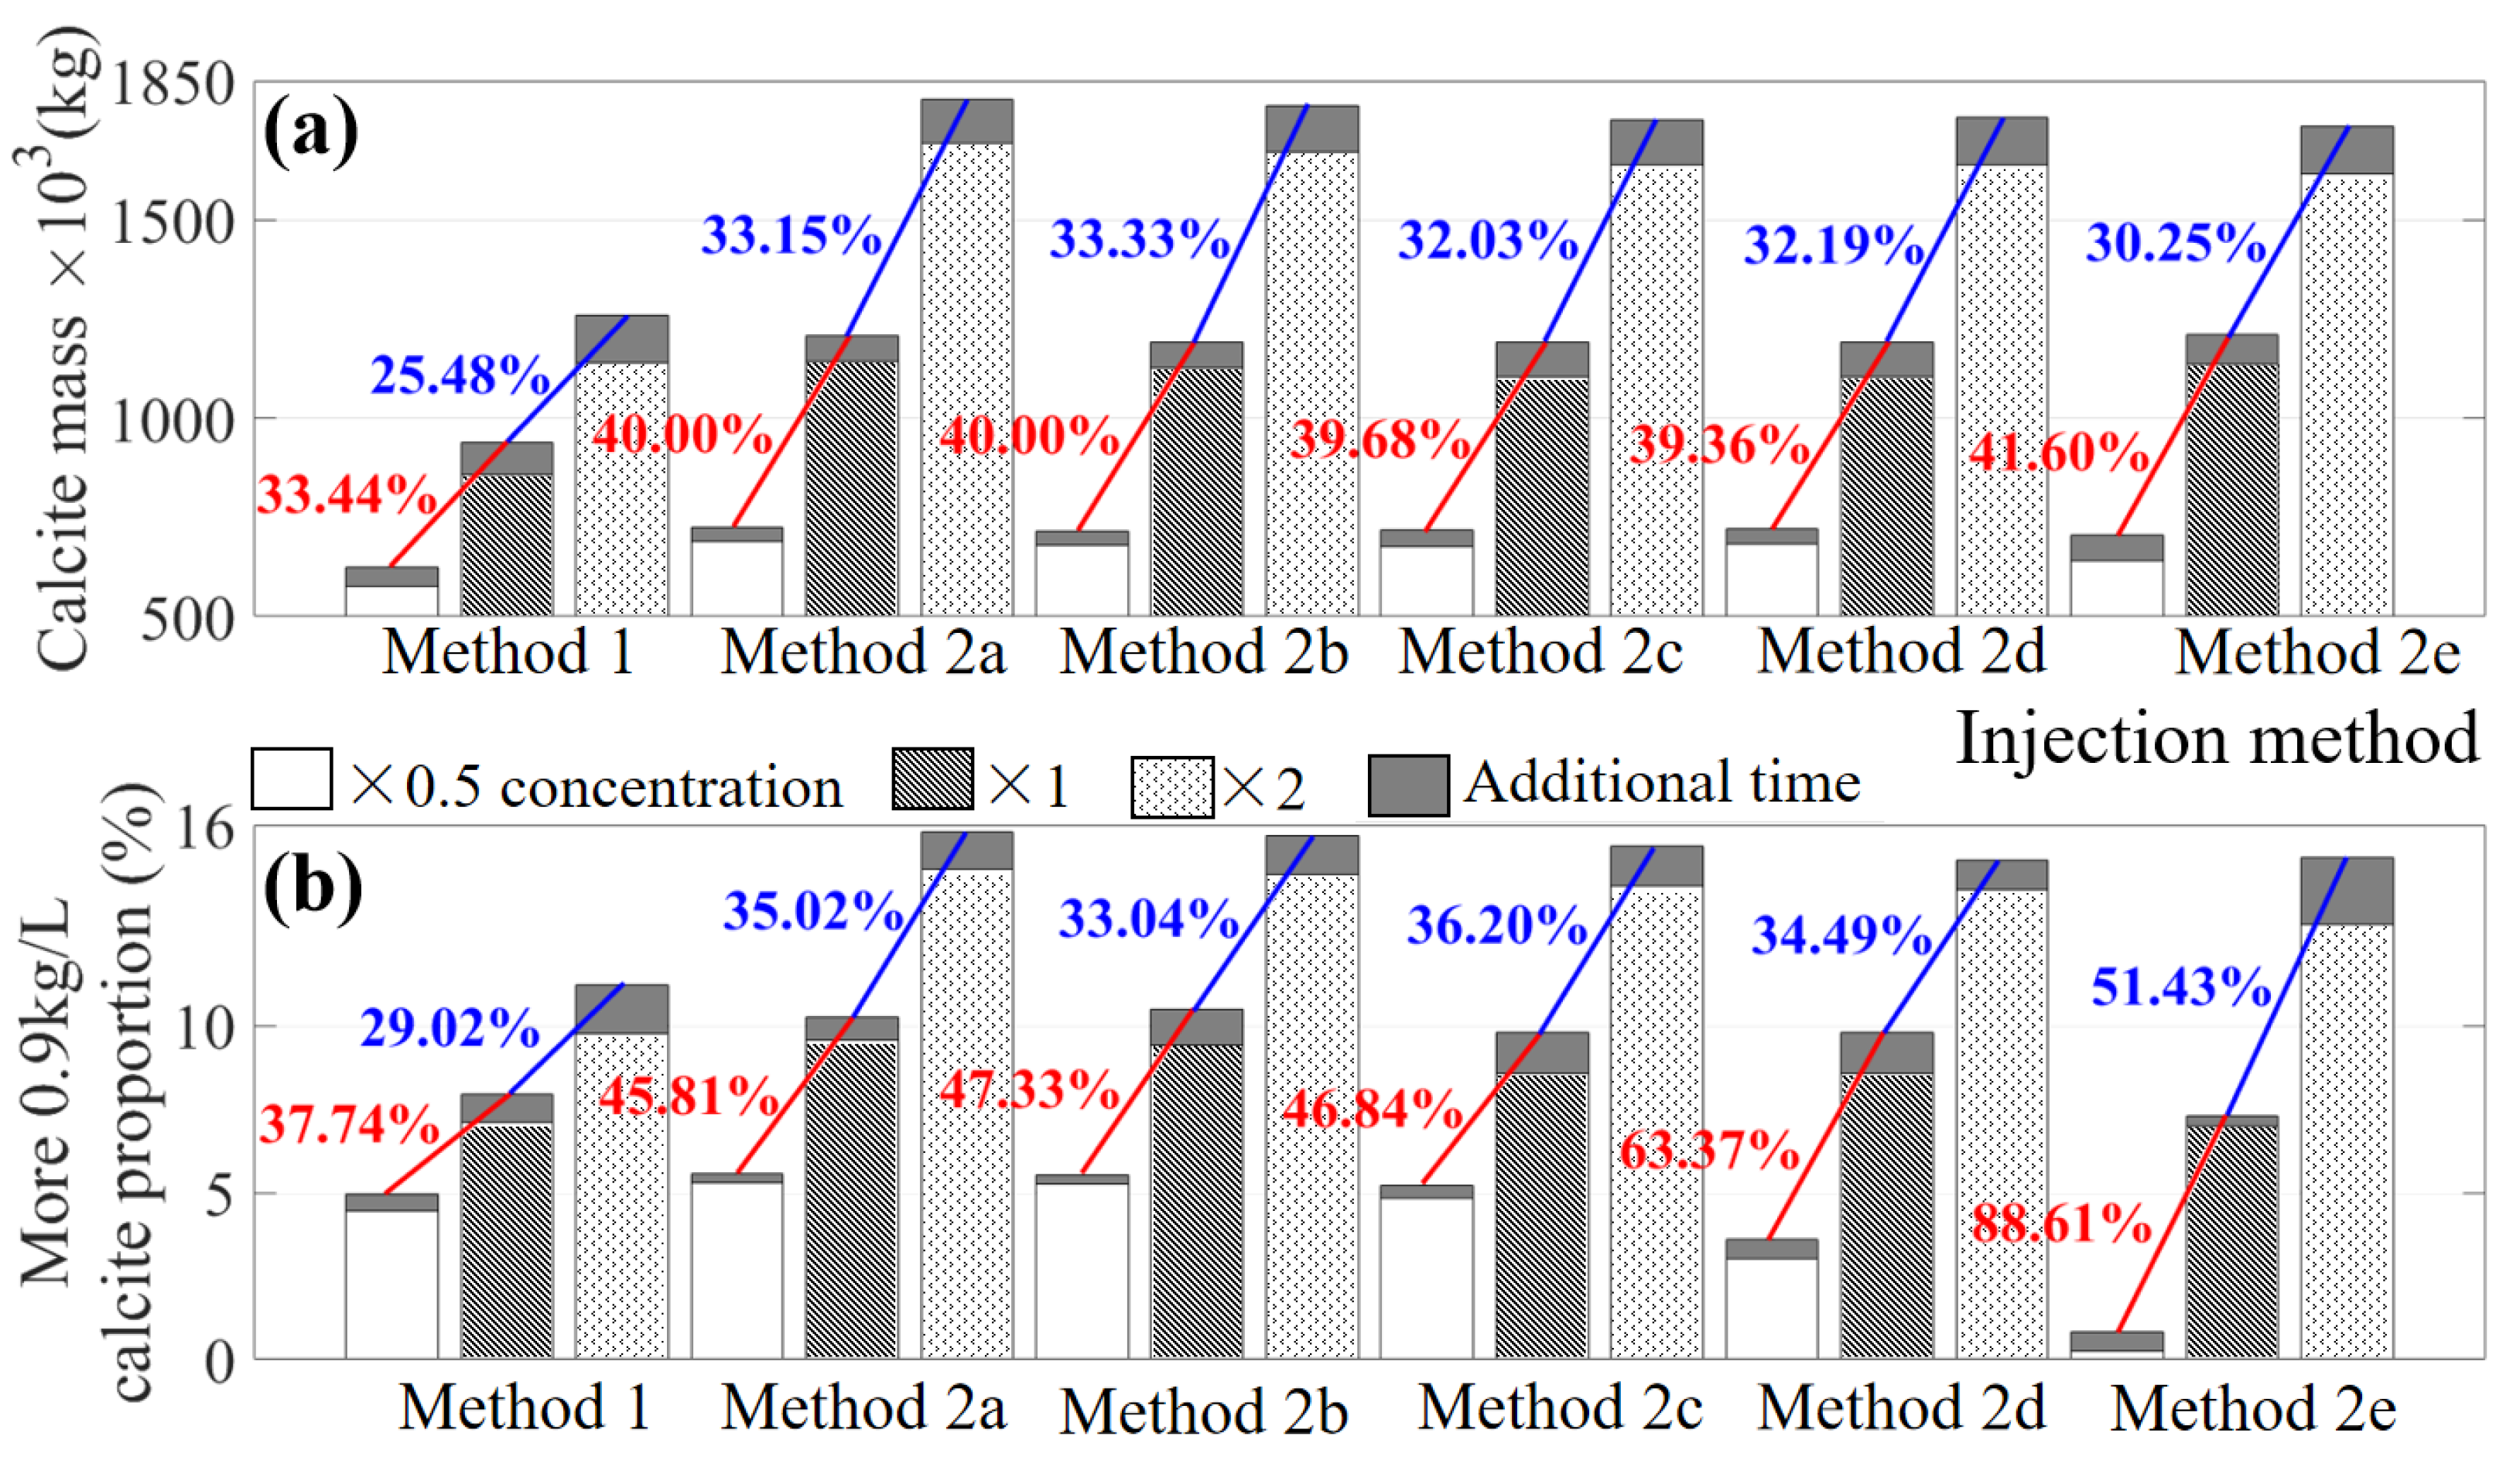
3.3. Effect of Substance Concentrations under Different Injection Methods (Case 3)

In this section, the effect of bacteria and cementation concentrations under different injection methods on the MICP process is investigated. Based on case 1, we additionally set two control groups, namely, half and double of substance concentrations. Total calcite mass and consolidation effect with half, original, and double solution concentrations are compared.
Due to the increased reactant and bacteria amounts, total precipitated calcite mass and proportions of high-concentration calcite continuously rise, as illustrated in Figure 8. Figure 8a shows that the precipitated calcite mass quantitatively increases by about 40 % and 32 % under staged injection, from half to double of substance concentrations. At high concentrations, the increase in retention time causes a slight decline in the precipitated calcite mass. This is because too long a retention time at high concentrations leads to significant heterogeneity in the distribution of bacteria and reactants, and the difference in calcite masses is a result. As a remark, it is noted that there is more and more difference in the precipitated calcite mass between the continuous injection and staged injection with the increase in reactant concentrations.
The retention time affects not only the calcite mass but also its consolidation effect. With the increase in retention time under staged injection, the proportion of high-concentration calcite gradually reduces, especially in low substance concentration (in Figure 8b). Combined with Figure 9, we find that at low concentration, the staged injection with very long retention times is applied. Although the precipitated calcite mass is the same as other staged injections, the reinforcement effect is extremely bad, and even its mechanical strength is too below the continuous injection. In a word, we should consider not only the total calcite mass but also the consolidation effect in the choice of optimum injection strategy. In this condition of high substance concentration, staged injections with any retention time can be considered. However, in this case of low substance concentrations, the suggested injection methods are only Methods 2a, 2b, and 2c.

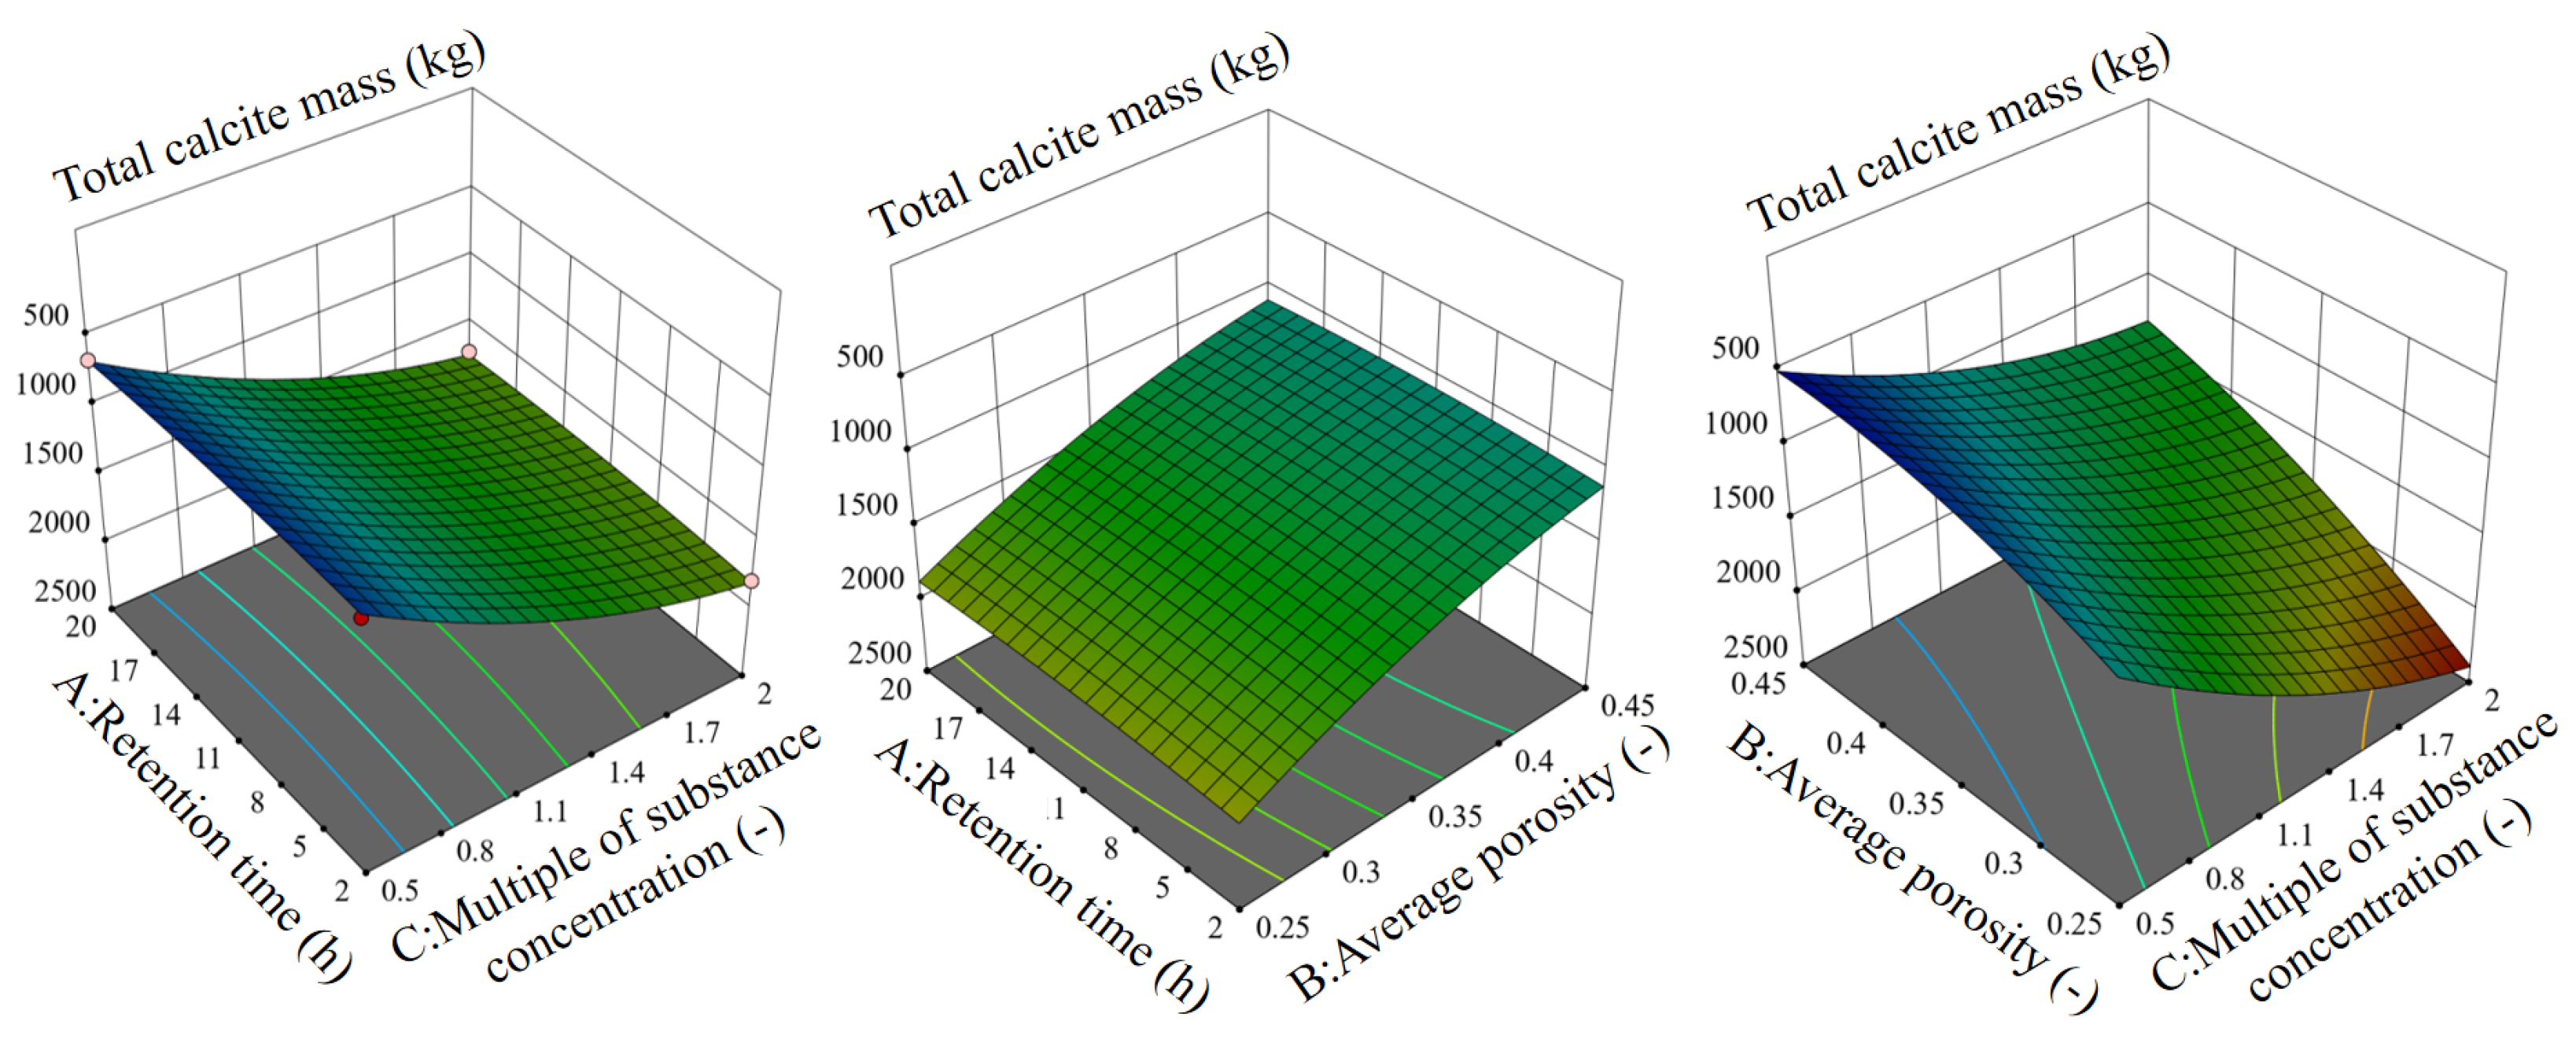
3.4. Analysis by the Orthogonal Experiments

In this section, we design two multifactor orthogonal array experiments to analyze the combined influences of average porosity, substance concentration, retention time in staged injections, and additional time on the total calcite mass and reinforcement effect in consolidation areas. At last, based on the analysis of variance, these factors in significance and the interaction effect are described.
In the orthogonal experiment, an orthogonal array of four factors and three levels is applied to assign the considered factors and levels as listed in Table 3. We simulate the orthogonal experiments with each factor as the independent variable and the total precipitated calcite mass (Y1) and proportion of its high concentration (Y2) as the evaluation indicators, and the detailed information for simulated groups is listed as Table A3 in Appendix B. According to the fit statistics (Table A4 in Appendix B), two orthogonal experiments are well fitted, with significance. Moreover, the proposed regression models for two orthogonal experiments all have high reliability. The regression models are written as the polynomials
Y 1 = 1355.28 16.51 A 392.94 B + 535.93 C + 47 D + 8.4 A B 16.57 A C + 1.28 A D 148.6 B C 9.02 B D 9.02 C D + 30.73 A 2 + 110.75 B 2 156.69 C 2 31.22 D 2
Y 2 = 11.62 1.34 A 3.21 B + 5.59 C + 0.387 D + 0.6346 A B + 0.8839 A C 0.0998 A D 1.53 B C 0.0275 B D + 0.0123 C D 0.9644 A 2 + 0.8484 B 2 1.73 C 2 0.2516 D 2
The analysis of variance (ANOVA) of the total calcite mass and its proportion of high concentration is summarized in Table 4. According to the p-value in Table 4, it is observed that the average porosity (B) and the substance concentration (C) have an extremely significant impact on total calcite masses. Additionally, changes in both retention time (A) during staged injections and additional time (D) also have a significant influence on total calcite masses. These effects can be ranked from the largest to the smallest as follows: substance concentration ≫ average porosity ≫ additional time > retention time in staged injection. In terms of consolidation effect, retention time (A), average porosity (B), and substance concentration (C), all are significant impact factors. However, the additional time (D) only indirectly impacts it. The influences on the consolidation effect are in the following order: substance concentration ≫ retention time in staged injection > average porosity ≫ additional time.
The simulated results of the interaction effects on the total calcite mass and consolidation effect are also listed in Table 4. In all interaction effects, only the average porosity and the substance concentration interact to very significantly impact total calcite masses. However, the consolidation effect is (very) significantly affected by the interactions of retention time (A) in staged injections, average porosity (B), and substance concentration (C). The interaction effect response surface of these three factors on the total calcite mass and reinforcement effect are respectively shown in Figure 10 and Figure 11. The slope of the response surface represents the significance of the interaction effect, that is, the larger its slope, the more significant its influence. The same interaction effects influence different degrees of the total calcite mass and its reinforcement effect.

4. Summary and Conclusions

In this study, we simulated the MICP process in porous media with various injection methods to investigate its influence. Specifically, the continuous injection and the staged injections with various retention times were simulated. Additionally, the influence of the additional time on the precipitated calcite mass and the reinforcement effect in the MICP process was investigated. To make a comparison, we kept the same substance amounts and other conditions in the simulation. We compared the precipitated calcite masses and the proportions of high-concentration calcite to obtain the influence of injection methods on consolidation areas and reinforcement effects. Moreover, the interaction of different scenarios, such as the changes in soil types and substance concentrations, with injection methods was investigated. For soil types, we changed the average porosity and generated randomly heterogeneous pore distributions to study. For the substance concentration, different bacterial and cementation concentrations were applied, and the simulated results in difference were described and qualitatively and quantitatively analyzed. For a better understanding of the role of the injection methods, soil types, and substance concentration, we employed the multifactor orthogonal array experiments. Combined with the simulated results, the significance of each impact factor and interaction effect were analyzed.
The key findings are summarized as follows.
(1) In comparison with continuous injection, the precipitated calcite mass and consolidation area under staged injections are higher with a mean increase of 23.55 % . The changes in the retention time during staged injections do not impact total calcite masses, but the increase in retention time gradually declines the reinforcement effect. Moreover, it is essential to set the additional time to wait. It can also improve total calcite masses (up to 6.33 % ) and consolidation effect without added injections. However, the improved rate gradually decreases over time.
(2) The increase in average porosity from 0.25 to 0.45 causes a reduction in total calcite masses at 28 % and 22 % . This decreased rate is not avoided by the changes in injection methods. Moreover, the changes in heterogeneous distributions at the same average porosity do not impact total calcite masses and consolidation effects; they only influence consolidation distributions.
(3) The bacteria and cementation concentrations improved from half to double can increase total calcite masses and expand consolidation areas. At high concentrations, total calcite mass and the consolidation effect slightly decline with retention time in staged injections. At low concentrations, the consolidation effect very significantly decreases with retention time, even below the continuous injection.
(4) For the effect on total calcite masses, substance concentration ≫ average porosity ≫ additional time > retention time in staged injection. For the effect on the consolidation effect, substance concentration ≫ retention time in staged injection > average porosity ≫ additional time. A retention time of 5 h in staged injections is optimum and widely used in the setting conditions with the changes in soil types and substance concentrations.
In the field implementation, we suggest the staged injection method and set the additional time after the injection to wait for the full reaction process. If it is possible, higher bacteria and reactant concentrations should be applied, while the amounts of by-products produced should be continuously noticed to avoid environmental pollution. The 5 h retention time in staged injections was recommended as the optimum injection method in the geotechnical conditions for an average porosity of 0.25 to 0.45 , with the changes in different reactant concentrations.
These suggestions can enhance both the total calcite mass and the reinforcement effect in field implementations of MICP. Nonetheless, the development of comprehensive numerical models, cost-effectiveness analyses, and the exploration of innovative injection techniques in the MICP method can be further considered to improve their application in geotechnical engineering. In this study, our proposed numerical model is applied to the field scale, with limited application at the pore scale. This numerical model can be further developed so that it can be applied in a wider range, from the pore scale to the field scale. Additionally, we can later consider the cost-effectiveness and innovate the injection methods to perfect the optimization of the injection methods in more complex geological conditions.

Author Contributions

L.W.: Investigation, data curation, software, writing—original draft and editing. H.S.: investigation, data analysis, validation. C.Y.: methodology, suggestion. Y.H.: supervision, writing—editing. D.F.: funding acquisition, project administration, writing—review and editing. All authors have read and agreed to the published version of the manuscript.

Funding

This research was funded by the Fundamental Research Funds for the Central Universities in China and the National Natural Science Foundation of China (No. 42207198).

Data Availability Statement

Data is contained within the article.

Conflicts of Interest

The authors declare that they have no known competing financial interests or personal relationships that could have appeared to influence the work reported in this paper.

Appendix A. Information in the Simulation

The detailed boundary conditions in the simulation are summarized in Table A1. Additionally, relative parameters for the numerical modeling and computed domain in the simulation are listed in Table A2.
Table A1. Boundary conditions in the simulation.
Inlet BoundaryOutlet Boundary
C a t t B a c t ( D · ϕ C ) · n = 0 ( C ) · n = 0
C u r e a ( D · ϕ C ) · n = 0 ( C ) · n = 0
C C a C l 2 ( D · ϕ C ) · n = 0 ( C ) · n = 0
Flow q · n = q i n p = P
Table A2. Relative parameters for the numerical modeling and computed domain.
ParameterUnitDescriptionValueReference
Model designA m2Computed domain 100 × 100 Assumed
Δ x mMesh length 0.05
Q i n L  · h−1Flow rate0.35[69]
q i n m · s−1Inflow velocity 2.84 × 10 5
C a t t B a c OD600Attached bacteria concentration1.538
C u r e a MUrea concentration1.1
C C a 2 + M C a C l 2 concentration1.1
Hydrodynamics D m m2 · s−1Diffusion coefficient 10 9 [49]
α L mLongitudinal dispersion length0.001[62]
P PaReference pressure 1.5 × 10 5
Permeability ϕ 0 -Original effective porosity0.35Assumed
μ l Pa  · sKinematic viscosity of liquid 1.15 × 10 3 [62]
k 0 m2Basic permeability 10 9 [49]
Bacteria r a t t s−1Attachment rate 1.8 × 10 6 Validated
metabolism r s t r s−1Straining rate 1.8 × 10 7
r g r o s−1Growth rate 9.0 × 10 8
R e n c a kg  · m−3  · s−1Encapsulation rate constant12[49]
U a t t Velocity dependence1
S a t t Neighbor attachment cells1
Ureolysis r u r e o s−1Ureolysis rate 1.5 × 10 4 Validated
R m MHalf saturation constant0.301[49]
R N H 4 + MAmmonium inhibition constant0.22
Precipitation r p r e c s−1Precipitation rate constant0.01
ρ C a C O 3 kg · m−3Bulk density of calcite1620Standard value
M W C a C O 3 kg · m−3  · M−1Calcite molecular weight100.0869

Appendix B. Information in the Orthogonal Experiments

The information of simulated groups in the orthogonal experiments is summarized in detail in Table A3.
Table A3. Simulated groups in the orthogonal array experiments.
SimulatedA: RetentionB: AverageC: Multiple ofD: AdditionalY1: Total CalciteY2: More 0.9 kg/L Calcite
GroupTime (h)Porosity (-)Concentration (-)Time (h)Mass (kg)Concentration Proportion (%)
1100.252152408.3621.2
220.352151903.3116.49
3100.351151160.839.74
4100.450.515553.863.95
5100.352301752.4315.36
6200.350.515687.590.52
720.251151794.9315.24
8200.351301210.857.27
9100.452151349.3811.72
10100.35201636.6314.19
11100.350.50526.453.72
12100.351151160.839.74
13100.350.530718.475.19
1420.35101141.429.53
15200.45115930.995.66
16100.45130913.177.62
1720.350.515776.486.02
18200.35101134.66.98
19100.251301629.9313.7
20100.250.515992.487.16
21100.351151160.839.74
2220.351301428.5212.08
23100.351151160.839.74
24200.251151626.679.56
25200.351151709.9314.26
26100.351151160.839.74
27100.25101542.7613.07
28100.4510862.077.1
2920.451151002.18.3
Before the analysis of the orthogonal experimental results, we make the fit statistics to validate the feasibility for two orthogonal experiments, as illustrated in Table A4. The R 2 of both models is close to 1, and the coefficients of variation (C.V.) are less than 15 % , which indicates that the orthogonal experiments are well fitted, with significance. Moreover, the differences between the adjusted R 2 and R 2 are all less than 0.2, which means that the obtained regression models are extremely reliable.
Table A4. Fit statistics for two orthogonal experiments.
Std. Dev.C.V. (%)R 2 Adjusted R 2 Predicted R 2
Y131.472.580.99740.99470.9834
Y20.43644.530.99500.99000.9669

References

  1. Morgan, R.P.C. Soil Erosion and Conservation; John Wiley & Sons: Hoboken, NJ, USA, 2009. [Google Scholar]
  2. Huang, J.; Yu, H.; Guan, X.; Wang, G.; Guo, R. Accelerated dryland expansion under climate change. Nat. Clim. Chang. 2016, 6, 166–171. [Google Scholar] [CrossRef]
  3. Chung, H.; Kim, S.H.; Nam, K. Application of microbially induced calcite precipitation to prevent soil loss by rainfall: Effect of particle size and organic matter content. J. Soils Sediments 2021, 21, 2744–2754. [Google Scholar] [CrossRef]
  4. Zhang, K.; Tang, C.S.; Jiang, N.J.; Pan, X.H.; Liu, B.; Wang, Y.J.; Shi, B. Microbial-induced carbonate precipitation (MICP) technology: A review on the fundamentals and engineering applications. Environ. Earth Sci. 2023, 82, 229. [Google Scholar] [CrossRef] [PubMed]
  5. Huang, Y.; Xu, X.; Liu, J.; Mao, W. Centrifuge modeling of seismic response and failure mode of a slope reinforced by a pile-anchor structure. Soil Dyn. Earthq. Eng. 2020, 131, 106037. [Google Scholar] [CrossRef]
  6. Domènech, G.; Fan, X.; Scaringi, G.; van Asch, T.W.; Xu, Q.; Huang, R.; Hales, T.C. Modelling the role of material depletion, grain coarsening and revegetation in debris flow occurrences after the 2008 Wenchuan earthquake. Eng. Geol. 2019, 250, 34–44. [Google Scholar] [CrossRef]
  7. Kou, H.L.; Wu, C.Z.; Ni, P.P.; Jang, B.A. Assessment of erosion resistance of biocemented sandy slope subjected to wave actions. Appl. Ocean. Res. 2020, 105, 102401. [Google Scholar] [CrossRef]
  8. Gong, W.; Juang, C.H.; Wasowski, J. Geohazards and human settlements: Lessons learned from multiple relocation events in Badong, China–Engineering geologist’s perspective. Eng. Geol. 2021, 285, 106051. [Google Scholar] [CrossRef]
  9. Huang, Y.; He, Z.; Yashima, A.; Chen, Z.; Li, C. Multi-objective optimization design of pile-anchor structures for slopes based on reliability theory considering the spatial variability of soil properties. Comput. Geotech. 2022, 147, 104751. [Google Scholar] [CrossRef]
  10. Huang, Y.; Xu, X.; Mao, W. Numerical performance assessment of slope reinforcement using a pile-anchor structure under seismic loading. Soil Dyn. Earthq. Eng. 2020, 129, 105963. [Google Scholar] [CrossRef]
  11. Singh, A.K. Bioengineering techniques of slope stabilization and landslide mitigation. Disaster Prev. Manag. Int. J. 2010, 19, 384–397. [Google Scholar] [CrossRef]
  12. Liu, J.; Shi, B.; Jiang, H.; Huang, H.; Wang, G.; Kamai, T. Research on the stabilization treatment of clay slope topsoil by organic polymer soil stabilizer. Eng. Geol. 2011, 117, 114–120. [Google Scholar] [CrossRef]
  13. Salifu, E.; MacLachlan, E.; Iyer, K.R.; Knapp, C.W.; Tarantino, A. Application of microbially induced calcite precipitation in erosion mitigation and stabilisation of sandy soil foreshore slopes: A preliminary investigation. Eng. Geol. 2016, 201, 96–105. [Google Scholar] [CrossRef]
  14. Giupponi, L.; Borgonovo, G.; Giorgi, A.; Bischetti, G.B. How to renew soil bioengineering for slope stabilization: Some proposals. Landsc. Ecol. Eng. 2019, 15, 37–50. [Google Scholar] [CrossRef]
  15. Gowthaman, S.; Mitsuyama, S.; Nakashima, K.; Komatsu, M.; Kawasaki, S. Biogeotechnical approach for slope soil stabilization using locally isolated bacteria and inexpensive low-grade chemicals: A feasibility study on Hokkaido expressway soil, Japan. Soils Found. 2019, 59, 484–499. [Google Scholar] [CrossRef]
  16. Archibong, G.; Sunday, E.; Akudike, J.; Okeke, O.; Amadi, C. A review of the principles and methods of soil stabilization. Int. J. Adv. Acad. Res. Sci. 2020, 6, 2488–9849. [Google Scholar]
  17. Moghal, A.A.B.; Rasheed, R.M.; Mohammed, S.A.S. Sorptive and desorptive response of divalent heavy metal ions from EICP-treated plastic fines. Indian Geotech. J. 2023, 53, 315–333. [Google Scholar] [CrossRef]
  18. Chittoori, B.C.; Rahman, T.; Burbank, M.; Moghal, A.A.B. Evaluating shallow mixing protocols as application methods for microbial induced calcite precipitation targeting expansive soil treatment. In Eighth International Conference on Case Histories in Geotechnical Engineering; American Society of Civil Engineers: Reston, VA, USA, 2019; pp. 250–259. [Google Scholar]
  19. Punetha, P.; Samanta, M.; Sarkar, S. Bioengineering as an effective and ecofriendly soil slope stabilization method: A review. In Landslides: Theory, Practice and Modelling; Springer: Berlin/Heidelberg, Germany, 2019; pp. 201–224. [Google Scholar]
  20. Harran, R.; Terzis, D.; Laloui, L. Mechanics, Modeling, and Upscaling of Biocemented Soils: A Review of Breakthroughs and Challenges. Int. J. Geomech. 2023, 23, 03123004. [Google Scholar] [CrossRef]
  21. Shan, Y.; Zhao, J.; Tong, H.; Yuan, J.; Lei, D.; Li, Y. Effects of activated carbon on liquefaction resistance of calcareous sand treated with microbially induced calcium carbonate precipitation. Soil Dyn. Earthq. Eng. 2022, 161, 107419. [Google Scholar] [CrossRef]
  22. Dejong, J.T.; Soga, K.; Kavazanjian, E.; Burns, S.; Van Paassen, L.; Al Qabany, A.; Aydilek, A.; Bang, S.; Burbank, M.; Caslake, L.F.; et al. Biogeochemical processes and geotechnical applications: Progress, opportunities and challenges. In Bio- and Chemo-Mechanical Processes in Geotechnical Engineering: Géotechnique Symposium in Print 2013; Ice Publishing: Washington, DC, USA, 2014; pp. 143–157. [Google Scholar]
  23. Mujah, D.; Cheng, L.; Shahin, M.A. Microstructural and geomechanical study on biocemented sand for optimization of MICP process. J. Mater. Civ. Eng. 2019, 31, 04019025. [Google Scholar] [CrossRef]
  24. Osinubi, K.; Eberemu, A.; Ijimdiya, T.; Yakubu, S.; Gadzama, E.; Sani, J.; Yohanna, P. Review of the use of microorganisms in geotechnical engineering applications. SN Appl. Sci. 2020, 2, 207. [Google Scholar] [CrossRef]
  25. Wang, Y.; Konstantinou, C.; Soga, K.; DeJong, J.T.; Biscontin, G.; Kabla, A.J. Enhancing strength of MICP-treated sandy soils: From micro to macro scale. arXiv 2020, arXiv:2006.15760. [Google Scholar]
  26. Wani, K.S.; Mir, B. Influence of microbial geo-technology in the stabilization of dredged soils. Int. J. Geotech. Eng. 2021, 15, 235–244. [Google Scholar] [CrossRef]
  27. Yu, T.; Souli, H.; Péchaud, Y.; Fleureau, J.M. Optimizing protocols for microbial induced calcite precipitation (MICP) for soil improvement–a review. Eur. J. Environ. Civ. Eng. 2022, 26, 2218–2233. [Google Scholar] [CrossRef]
  28. Lee, M.; Kolbus, C.M.; Yepez, A.D.; Gomez, M.G. Investigating ammonium by-product removal following stimulated ureolytic microbially-induced calcite precipitation. In Proceedings of the Eighth International Conference on Case Histories in Geotechnical Engineering, Philadelphia, PA, USA, 24–27 March 2019; pp. 260–272. [Google Scholar]
  29. Mohsenzadeh, A.; Aflaki, E.; Gowthaman, S.; Nakashima, K.; Kawasaki, S.; Ebadi, T. A two-stage treatment process for the management of produced ammonium by-products in ureolytic bio-cementation process. Int. J. Environ. Sci. Technol. 2022, 19, 449–462. [Google Scholar] [CrossRef]
  30. Wang, X.; Nackenhorst, U. A coupled bio-chemo-hydraulic model to predict porosity and permeability reduction during microbially induced calcite precipitation. Adv. Water Resour. 2020, 140, 103563. [Google Scholar] [CrossRef]
  31. Rajasekar, A.; Wilkinson, S.; Moy, C.K. MICP as a potential sustainable technique to treat or entrap contaminants in the natural environment: A review. Environ. Sci. Ecotechnol. 2021, 6, 100096. [Google Scholar] [CrossRef]
  32. Whiffin, V.S. Microbial CaCO3 Precipitation for the Production of Biocement. Ph.D. Thesis, Murdoch University, Murdoch, Australia, 2004. [Google Scholar]
  33. Terzis, D.; Laloui, L. Cell-free soil bio-cementation with strength, dilatancy and fabric characterization. Acta Geotech. 2019, 14, 639–656. [Google Scholar] [CrossRef]
  34. Cheng, L.; Cord-Ruwisch, R.; Shahin, M.A. Cementation of sand soil by microbially induced calcite precipitation at various degrees of saturation. Can. Geotech. J. 2013, 50, 81–90. [Google Scholar] [CrossRef]
  35. van Paassen, L.A.; Ghose, R.; van der Linden, T.J.; van der Star, W.R.; van Loosdrecht, M.C. Quantifying biomediated ground improvement by ureolysis: Large-scale biogrout experiment. J. Geotech. Geoenviron. Eng. 2010, 136, 1721–1728. [Google Scholar] [CrossRef]
  36. Liu, L.; Liu, H.; Stuedlein, A.W.; Evans, T.M.; Xiao, Y. Strength, stiffness, and microstructure characteristics of biocemented calcareous sand. Can. Geotech. J. 2019, 56, 1502–1513. [Google Scholar] [CrossRef]
  37. Terzis, D.; Laloui, L. A decade of progress and turning points in the understanding of bio-improved soils: A review. Geomech. Energy Environ. 2019, 19, 100116. [Google Scholar] [CrossRef]
  38. Almajed, A.; Lateef, M.A.; Moghal, A.A.B.; Lemboye, K. State-of-the-art review of the applicability and challenges of microbial-induced calcite precipitation (MICP) and enzyme-induced calcite precipitation (EICP) techniques for geotechnical and geoenvironmental applications. Crystals 2021, 11, 370. [Google Scholar] [CrossRef]
  39. Hammes, F.; Boon, N.; de Villiers, J.; Verstraete, W.; Siciliano, S.D. Strain-specific ureolytic microbial calcium carbonate precipitation. Appl. Environ. Microbiol. 2003, 69, 4901–4909. [Google Scholar] [CrossRef] [PubMed]
  40. Park, S.J.; Park, Y.M.; Chun, W.Y.; Kim, W.J.; Ghim, S.Y. Calcite-forming bacteria for compressive strength improvement in mortar. J. Microbiol. Biotechnol. 2010, 20, 782–788. [Google Scholar] [PubMed]
  41. Lv, C.; Tang, C.S.; Zhang, J.Z.; Pan, X.H.; Liu, H. Effects of calcium sources and magnesium ions on the mechanical behavior of MICP-treated calcareous sand: Experimental evidence and precipitated crystal insights. Acta Geotech. 2023, 18, 2703–2717. [Google Scholar] [CrossRef]
  42. Zhang, Y.; Guo, H.; Cheng, X. Role of calcium sources in the strength and microstructure of microbial mortar. Constr. Build. Mater. 2015, 77, 160–167. [Google Scholar] [CrossRef]
  43. Tang, C.S.; Yin, L.y.; Jiang, N.j.; Zhu, C.; Zeng, H.; Li, H.; Shi, B. Factors affecting the performance of microbial-induced carbonate precipitation (MICP) treated soil: A review. Environ. Earth Sci. 2020, 79, 1–23. [Google Scholar] [CrossRef]
  44. Sharma, A.; Ramkrishnan, R. Study on effect of microbial induced calcite precipitates on strength of fine grained soils. Perspect. Sci. 2016, 8, 198–202. [Google Scholar] [CrossRef]
  45. Kim, G.; Kim, J.; Youn, H. Effect of temperature, pH, and reaction duration on microbially induced calcite precipitation. Appl. Sci. 2018, 8, 1277. [Google Scholar] [CrossRef]
  46. Peng, J.; Feng, Q.-P.; Sun, Y.-C. Influences of temperatures on MICP-treated soils. Chin. J. Geotech. Eng. 2018, 40, 1048–1055. [Google Scholar]
  47. Fu, T.; Saracho, A.C.; Haigh, S.K. Microbially induced carbonate precipitation (MICP) for soil strengthening: A comprehensive review. Biogeotechnics 2023, 2023, 100002. [Google Scholar] [CrossRef]
  48. Kadhim, F.J.; Zheng, J. Review of the factors that influence on the microbial induced calcite precipitation. Civ. Environ. Res. 2016, 8, 69–76. [Google Scholar]
  49. Minto, J.M.; Lunn, R.J.; El Mountassir, G. Development of a reactive transport model for field-scale simulation of microbially induced carbonate precipitation. Water Resour. Res. 2019, 55, 7229–7245. [Google Scholar] [CrossRef]
  50. Stocks-Fischer, S.; Galinat, J.K.; Bang, S.S. Microbiological precipitation of CaCO3. Soil Biol. Biochem. 1999, 31, 1563–1571. [Google Scholar] [CrossRef]
  51. Gebru, K.A.; Kidanemariam, T.G.; Gebretinsae, H.K. Bio-cement production using microbially induced calcite precipitation (MICP) method: A review. Chem. Eng. Sci. 2021, 238, 116610. [Google Scholar] [CrossRef]
  52. Whiffin, V.S.; Van Paassen, L.A.; Harkes, M.P. Microbial carbonate precipitation as a soil improvement technique. Geomicrobiol. J. 2007, 24, 417–423. [Google Scholar] [CrossRef]
  53. Wang, Y.; Konstantinou, C.; Soga, K.; Biscontin, G.; Kabla, A.J. Use of microfluidic experiments to optimize MICP treatment protocols for effective strength enhancement of MICP-treated sandy soils. Acta Geotech. 2022, 17, 3817–3838. [Google Scholar] [CrossRef]
  54. Cheng, L.; Shahin, M.A.; Cord-Ruwisch, R. Surface percolation for soil improvement by biocementation utilizing in situ enriched indigenous aerobic and anaerobic ureolytic soil microorganisms. Geomicrobiol. J. 2017, 34, 546–556. [Google Scholar] [CrossRef]
  55. Feng, K.; Montoya, B. Influence of confinement and cementation level on the behavior of microbial-induced calcite precipitated sands under monotonic drained loading. J. Geotech. Geoenviron. Eng. 2016, 142, 04015057. [Google Scholar] [CrossRef]
  56. Soon, N.W.; Lee, L.M.; Khun, T.C.; Ling, H.S. Factors affecting improvement in engineering properties of residual soil through microbial-induced calcite precipitation. J. Geotech. Geoenviron. Eng. 2014, 140, 04014006. [Google Scholar] [CrossRef]
  57. Martinez, B.; DeJong, J.; Ginn, T.; Montoya, B.; Barkouki, T.; Hunt, C.; Tanyu, B.; Major, D. Experimental optimization of microbial-induced carbonate precipitation for soil improvement. J. Geotech. Geoenviron. Eng. 2013, 139, 587–598. [Google Scholar] [CrossRef]
  58. Faeli, Z.; Montoya, B.M.; Gabr, M.A. Elucidating factors governing MICP biogeochemical processes at macro-scale: A reactive transport model development. Comput. Geotech. 2023, 160, 105514. [Google Scholar] [CrossRef]
  59. Dawoud, O.; Chen, C.; Soga, K. Microbial-induced calcite precipitation (MICP) using surfactants. In Proceedings of the Geo-Congress 2014: Geo-Characterization and Modeling for Sustainability, Atlanta, GA, USA, 23–26 February 2014; pp. 1635–1643. [Google Scholar]
  60. Choi, S.G.; Chang, I.; Lee, M.; Lee, J.H.; Han, J.T.; Kwon, T.H. Review on geotechnical engineering properties of sands treated by microbially induced calcium carbonate precipitation (MICP) and biopolymers. Constr. Build. Mater. 2020, 246, 118415. [Google Scholar] [CrossRef]
  61. Saricicek, Y.E.; Gurbanov, R.; Pekcan, O.; Gozen, A.G. Comparison of microbially induced calcium carbonate precipitation eligibility using sporosarcina pasteurii and bacillus licheniformis on two different sands. Geomicrobiol. J. 2019, 36, 42–52. [Google Scholar] [CrossRef]
  62. Van Wijngaarden, W.; Van Paassen, L.; Vermolen, F.; Van Meurs, G.; Vuik, C. A reactive transport model for biogrout compared to experimental data. Transp. Porous Media 2016, 111, 627–648. [Google Scholar] [CrossRef]
  63. GGNN, A.; Kawasaki, S. Factors affecting sand solidification using MICP with Pararhodobacter sp. Mater. Trans. 2018, 59, 72–81. [Google Scholar]
  64. Wang, X.; Nackenhorst, U. Micro-feature-motivated numerical analysis of the coupled bio-chemo-hydro-mechanical behaviour in MICP. Acta Geotech. 2022, 17, 4537–4553. [Google Scholar] [CrossRef]
  65. Kolditz, O.; Bauer, S.; Bilke, L.; Böttcher, N.; Delfs, J.O.; Fischer, T.; Görke, U.J.; Kalbacher, T.; Kosakowski, G.; McDermott, C.; et al. OpenGeoSys: An open-source initiative for numerical simulation of thermo-hydro-mechanical/chemical (THM/C) processes in porous media. Environ. Earth Sci. 2012, 67, 589–599. [Google Scholar] [CrossRef]
  66. Charlton, S.R.; Parkhurst, D.L. Modules based on the geochemical model PHREEQC for use in scripting and programming languages. Comput. Geosci. 2011, 37, 1653–1663. [Google Scholar] [CrossRef]
  67. Parkhurst, D.L.; Appelo, C. Description of input and examples for PHREEQC version 3—A computer program for speciation, batch-reaction, one-dimensional transport, and inverse geochemical calculations. US Geol. Surv. Tech. Methods 2013, 6, 497. [Google Scholar]
  68. Feng, D.; Wang, X.; Nackenhorst, U.; Zhang, X.; Pan, P. A comparative study of using two numerical strategies to simulate the biochemical processes in microbially induced calcite precipitation. J. Rock Mech. Geotech. Eng. 2022, 14, 592–602. [Google Scholar] [CrossRef]
  69. Van Paassen, L.A. Biogrout, Ground Improvement by Microbial Induced Carbonate Precipitation. Doctoral Thesis, TU Delft, Delft, The Netherlands, 2009. [Google Scholar]
  70. Yan, D.; Qu, N.; Li, H.; Wang, X. Significance of dimple parameters on the friction of sliding surfaces investigated by orthogonal experiments. Tribol. Trans. 2010, 53, 703–712. [Google Scholar] [CrossRef]
  71. Xu, C.; Nie, W.; Yang, S.; Peng, H.; Liu, Z.; Ma, Q.; Guo, C.; Liu, Q. Numerical simulation of the multi-index orthogonal experiments on the spray dust-settling devices. Powder Technol. 2020, 371, 217–230. [Google Scholar] [CrossRef]
  72. Konstantinou, C.; Biscontin, G.; Jiang, N.J.; Soga, K. Application of microbially induced carbonate precipitation to form bio-cemented artificial sandstone. J. Rock Mech. Geotech. Eng. 2021, 13, 579–592. [Google Scholar] [CrossRef]
  73. Konstantinou, C.; Wang, Y.; Biscontin, G. A systematic study on the influence of grain characteristics on hydraulic and mechanical performance of MICP-treated porous media. Transp. Porous Media 2023, 147, 305–330. [Google Scholar] [CrossRef]
Figure 1. Schematic diagram of mass transport and reaction in the model. The red square represents sink/source term produced by reactions.
Water 16 00082 g001
Figure 2. Simulation scheme in the numerical MICP model.
Water 16 00082 g002
Figure 3. Simulation schematic with heterogeneous porosity distributions.
Water 16 00082 g003
Figure 4. Differences in substance concentration and total calcite mass over time under different injection methods. (a) Proportional changes of bacteria concentration over time, (b) urea concentration, (c) total calcite mass, and (d,e) concentration distributions of bacteria and urea in Method 2a.
Water 16 00082 g004
Figure 5. Heterogeneous porosity distributions (from left to right, the average porosity increases).
Water 16 00082 g005
Figure 6. Effect of the porosity on the MICP process under different injection methods. (a) Differences in total calcite masses at 150 h; (b) differences in proportions of high-concentration calcite at 150 h.
Water 16 00082 g006
Figure 7. Calcite distributions with different porosities and injection methods. (a) At ϕ = 0.25 under Method 2a, (b) At ϕ = 0.45 under Method 2a, (c) At ϕ = 0.25 under Method 2e, and (d) At ϕ = 0.45 under Method 2e.
Water 16 00082 g007
Figure 8. Effect of substance concentrations on total calcite masses under different injection methods. (a) Differences in total calcite masses; (b) differences in proportions of high-concentration calcite.
Water 16 00082 g008
Figure 9. Calcite distributions with different substance concentrations and injection methods. (a) With 0.5 C s u b under Method 2a, (b) 2 C s u b under Method 2a, (c) with 0.5 C s u b under Method 2e, and (d) with 2 C s u b under Method 2e.
Water 16 00082 g009
Figure 10. Interaction effect response surfaces on the total calcite masses.
Water 16 00082 g010
Figure 11. Interaction effect response surfaces on the consolidation effect.
Water 16 00082 g011
Table 1. Injection parameters in different injection methods.
InjectionInjectionTotal Injection TimeInjection NumbersRetention TimeAdditional Time
MethodType(h)(Bacteria/Cementation)(h)(h)
Method 1Continuous60-- / 30
Method 2aPhased120 30 / 30 2 / 30
Method 2bPhased120 12 / 12 5 / 30
Method 2cPhased120 6 / 6 10 / 30
Method 2dPhased120 4 / 4 15 / 30
Method 2ePhased120 3 / 3 20 / 30
Note: No additional time marked as -, with additional time (30 h) marked as 30.
Table 2. High calcite concentration proportions and total calcite mass per unit thickness.
Injection MethodAfter the Injection (60 h or 120 h)With the Additional Time (30 h)Difference in Calcite Mass
0.9 kg/L CalciteTotal Calcite Mass0.9 kg/L CalciteTotal Calcite Mass
(%) ×10 3 (kg)(%)×10 3 (kg)×10 3 (kg)
Method 17.11 858.26 7.95 939.15 80.9
Method 2a9.55 1141.42 10.26 1205.96 64.54
Method 2b9.41 1127.18 10.50 1191.14 63.95
Method 2c9.20 1106.30 9.83 1170.66 64.36
Method 2d8.54 1103.96 9.80 1191.16 87.20
Method 2e7.00 1134.60 7.29 1210.85 76.25
Table 3. Levels and factors affecting the total calcite mass and its consolidation effect.
LevelFactor A: RetentionFactor B: AverageFactor C: Multiple of SubstanceFactor D: Additional
Time (h)Porosity (-)Concentration (-)Time (h)
−120.250.50
0100.35115
1200.45230
Table 4. Analysis of variance (ANOVA) of the total calcite mass and its proportion of high concentration.
Source ofTotal Calcite MassProportion of High-Concentration Calcite
VarianceMean SquareF-Valuep-Value
(Significance)
Mean SQUAREF-Valuep-Value
(Significance)
Factor 3.75 × 10 5 378.83<0.0001 **37.88198.87<0.0001 **
A2875.812.90.110518.9999.67<0.0001 **
B 1.60 × 10 6 1618.68<0.0001 **107.12562.35<0.0001 **
C 3.40 × 10 6 3426.94<0.0001 **368.871936.46<0.0001 **
D22,939.5523.160.0003 **1.568.170.0127 *
AB284.850.28750.60021.628.520.0112 *
AC1189.851.20.29123.3817.760.0009 **
AD6.630.00670.9360.04010.21070.6533
BC94,856.8995.75<0.0001 **10.0752.86<0.0001 **
BD325.260.32830.57570.00300.01590.9015
CD349.610.35290.5620.00070.00340.9542
5936.925.990.0282 *5.8530.69<0.0001 **
79,555.5380.3<0.0001 **4.6724.510.0001 **
1.19 × 10 5 119.82<0.0001 **14.4976.04<0.0001 **
6322.546.380.0242 *0.41072.160.1641
Residual990.68 0.1905
Lack of Fit1386.95 0.2667
Note: ** denotes that the term is very significant (p < 0.01); * denotes that the term is significant (p < 0.05).
Disclaimer/Publisher’s Note: The statements, opinions and data contained in all publications are solely those of the individual author(s) and contributor(s) and not of MDPI and/or the editor(s). MDPI and/or the editor(s) disclaim responsibility for any injury to people or property resulting from any ideas, methods, instructions or products referred to in the content.

