Article

Research on Flood Risk Control Methods and Reservoir Flood Control Operation Oriented towards Floodwater Utilization

1
School of Civil and Hydraulic Engineering, Huazhong University of Science and Technology, Wuhan 430074, China
2
Hubei Key Laboratory of Digital Valley Science and Technology, Wuhan 430074, China
*
Author to whom correspondence should be addressed.
Water 2024, 16(1), 43; https://doi.org/10.3390/w16010043
Submission received: 21 November 2023 / Revised: 15 December 2023 / Accepted: 20 December 2023 / Published: 21 December 2023
(This article belongs to the Special Issue Reservoir Control Operation and Water Resources Management)

Abstract

:
Since improving floodwater utilization may increase flood risk, flood risk control methods for trade-offs between these factors have research value. This study presented a flood risk control method oriented towards floodwater utilization which considers multiple main flood risk factors. The proposed method not only achieves the boundaries of the flood limited water level (FLWL) under various acceptable risks but also dynamically controls the water level to enhance floodwater utilization. A case study conducted on the Danjiangkou reservoir yielded the following results: (1) The proposed method provides FLWL dynamic control boundaries under various acceptable risks. (2) The proposed method reveals the potential to raise the FLWL, with a possibility to raise it by 1.00 m above the present FLWL under the absence of flood risk. (3) The available flood resources in both the wet and dry seasons increase, on average, by 0.83 and 0.81 billion m3, and the flood risk remains within the acceptable range after raising the FLWL by 1.00 m, which contributes to enhancing floodwater utilization.

1. Introduction

Floods are significant natural disasters that result in casualties and property damage [1]. Reservoirs are crucial for flood control and floodwater utilization and lead to conflicts between the two [2]. With growing populations and socio-economic development, water shortages in some regions are becoming more acute [3]. Therefore, enhancing floodwater utilization becomes necessary [4]. The flood limit water level (FLWL) balances flood control and floodwater utilization [5]. In China, reservoirs typically stay below the FLWL during the wet season [6]. However, the conventional FLWL is designed to overemphasize low-probability floods, leading to the insufficient utilization of floodwater [7]. Realizing the dynamic control of the flood limit water level (DC-FLWL) is an available way to improve floodwater utilization; this involves controlling water levels in safe regions for trade-off benefits between flood risk and floodwater utilization [8].
The relationship between risks and benefits is characterized by mutual antagonism, and enhancing the advantages will inevitably entail certain potential hazards. Realizing the dynamic control of the FLWL enhances floodwater utilization, yet it also introduces uncertainties to a certain extent, potentially giving rise to additional flood-related risks [9]. Therefore, research on the DC-FLWL and the generated risks associated with this approach has become popular in recent years. Tan et al. [10] studied the DC-FLWL taking into account the spatial uncertainty of floods. Zhou et al. [11] realized the DC-FLWL with the aim of improving water resource utilization using a multi-objective optimization algorithm and an aggregation decomposition method. Zhang et al. [12] discussed and improved the DC-FLWL on the basis of forecast information. Gong et al. [13] conceptualized river flood routing as a hypothetical reservoir based on the Muskingum model and analyzed its impact on dynamic control boundaries. Ning et al. [14] assessed flood risk by considering flood forecast uncertainty and analyzed the impacts at different FLWLs. Mu et al. [15] established the dynamic water level to optimize water resource utilization and estimated the flood risk resulting from flood forecast errors. Pan et al. [16] identified dynamic control areas using the pre-discharge method and built a risk analysis model. Lu et al. [17] integrated a flood risk analysis model with various risk sources and studied their impacts on flood risk. Du et al. [18] discovered both the risks and benefits of floodwater utilization increases in the wake of increasing the FLWL, albeit at different rates.
The theories and methods for realizing the dynamic control of FLWL and flood risk control are being continuously enhanced. Nevertheless, there are still unresolved issues that warrant further investigation in the field of the DC-FLWL and its associated risks: (1) The existing research on the DC-FLWL mainly focuses on studying the dynamic control boundaries and does not consider the variability of the dynamic control boundaries under different acceptable flood risks. (2) Previous studies have primarily concentrated on floodwater utilization while paying limited attention to reservoir operation and risk control in the context of the DC-FLWL. The DC-FLWL is crucial to improving floodwater utilization and ensuring an acceptable flood risk, which is also an urgent problem in the current research on the flood risk control method. This paper identified key risk factors and proposed a flood risk control method oriented towards floodwater utilization. The proposed method achieved the dynamic control boundaries of the FLWL under various acceptable risks and provided a supportive role for the DC-FLWL.

2. Methodology

The risk control method oriented towards floodwater utilization proposed in this paper consists of the following components: (1) The identification of the main risk factors affecting flood control operation; (2) the uncertainty of the main risk factors, including reservoir inflow, interval floods, and forecast errors; (3) the development of a risk analysis model, (4) the modeling of the flood risk control method; (5) an assessment of the risks and benefits of floodwater utilization.

2.1. The Identification of The Main Flood Risk Factors

There are various flood risk factors that can affect reservoir flood control operation, including flood shape, flood forecast error, outflow discharge error, scheduling lag time, and river flood routing errors [19]. It is not feasible to analyze the combined influence of all risk factors. Instead, it is important to consider the main risk factors comprehensively [20]. The forecasted flood is a significant source of uncertainty and serves as the primary input for the model. Additionally, the uncertainties of interval floods must be also considered for reservoirs with downstream flood control tasks [21]. Therefore, the uncertainties of reservoir inflow, interval floods, and flood forecast errors are key focal points in the following paragraphs.

2.2. An Uncertainty Analysis of The Main Flood Risk Factors

2.2.1. The Uncertainty of Reservoir Inflows

Since the uncertainty of reservoir inflows is one of the most important risk factors, it is crucial to have a large number of reservoir inflows that encompass different types, magnitudes, and shapes. While design floods and historical floods provide some insight, they are not sufficient. Therefore, it is necessary to simulate reservoir inflows [22]. Disaggregation methods break down runoff from larger time scales into smaller ones based on historical runoff, which effectively captures the statistical characteristics of both large- and small-scale runoff [23].
In this study, the correlated disaggregation model was used due to its ease of implementation and the availability of code for this model. Taking the flood volume (over T days) during the wet season decomposed into daily flow components as an example, the basic form of the correlated disaggregation model is shown as the following equation:
Q = A V + B ε
where Q is the daily flow during the wet season; V is the flood volume during the wet season, which is generally believed to follow the Log-Person Type III distribution; and A, B and ε are the parameter matrixes of the model. The parameter estimation and simulation steps of the correlated disaggregation model are mentioned in [24].

2.2.2. The Uncertainty of Interval Floods

For a reservoir with a downstream area flood control task, the uncertainty of the interval flood is a significant flood risk factor [25]. When interval floods do not meet the requirements of flood risk analysis, alternatives can be generated in accordance with the joint distribution relationship between the reservoir inflow and the interval flood [26]. Their joint distribution relationship is a complex multivariate issue that can be built by using the Copula function.
The Copula function describes the correlation between multiple variables which can connect their marginal distributions with their joint distribution when their marginal distributions have already been determined with certainty [27]. The joint distribution function can be represented as the following equation:
G ( x 1 , x 2 ) = C θ ( M 1 ( x 1 ) , M 2 ( x 2 ) )
where G(x1,x2) is the joint distribution function; M1(x1) and M2(x2) are the marginal distribution functions of X1 and X2, respectively; and Cθ(∙) is the Copula function. The Copula function and its parameters are optimized based on historical runoff, and the optimization process is discussed in [28].

2.2.3. The Uncertainty of Forecast Error

The forecast error is a significant factor contributing to the uncertainty in flood risk. Assuming an unbiased flood forecast, the forecasted flow at each time follows normal distribution [29]. The relative error is used to comprehensively reflect the forecast error, and the following equation can be obtained:
U ( t ) = O ( t ) [ 1 + α ( t ) ]
where U(t) is the forecasted inflow or interval flood; O(t) is the observed inflow or interval flood; and α(t) is the relative error. Both the relative errors of inflow and interval flood obey the normal distribution, and their distribution parameters can be estimated in accordance with historical flood forecast results [30].

2.3. The Development of a Risk Analysis Model

This paper analyzes the flood risk generated by the main risk factors described in the previous section. The Monte Carlo simulation method [31] was performed m times on the basis of operation rules. When the flood risk control objective is compromised under n floods, flood risk ratio (RR) can be mathematically described as Equation (4):
R R = P ( A ) = P ( Z ( t ) > Z max | | D ( t ) > D safety ) = n m × 100 %
where P(A) denotes the probability of damage to the risk control objective, which is defined by the water level not exceeding the flood control water level (FCWL) and the discharge of the flood control station not exceeding the allowable discharge shown in this paper; Z(t) is the water stage; D(t) is the discharge of the flood control station; Zmax is the FCWL; and Dsafety is the allowable discharge of the flood control station.

2.4. Flood Risk Control Method Oriented towards Floodwater Utilization

In this paper, the upper limit of the FLWL is taken for the risk control water level (RCWL), and the lower boundary of FLWL is the present FLWL. Therefore, when RCWLs under various flood return periods are obtained by using the reservoir flood control risk analysis model, dynamic control domain under a certain acceptable risk ratio can be realized. Figure 1 provides a schematic illustration of how one calculates the RCWL, and the detailed process is explained below.
Step 1: Define the flood risk control objective. The water level does not exceed the FCWL, and the discharge of the flood control station does not exceed its allowable discharge.
Step 2: Develop the risk analysis model. The risk analysis model is developed on the basis of the flood risk control objective and operation rules.
Step 3: Determine the computational accuracy of the RCWL as ∆H = 0.01 m, and set the scheduling time as t = 0.
Step 4: Set the present RCWL H(t) at scheduling time t as the present FLWL.
Step 5: Calculate the risk ratio (RR) using the risk analysis model.
Step 6: If RR is not greater than the acceptable risk ratio (ARR), set H(t) = H(t) + ∆H and switch to Step 7. Otherwise, set H(t) = H(t) − ∆H and switch to Step 8.
Step 7: If H(t) is not higher than the FCWL, return to Step 5. Otherwise, set H(t) = H(t) − ∆H and switch to Step 8.
Step 8: If t is less than T, which represents the number of scheduling periods, set t = t + 1 and execute Step 4. Elsewise, finish this process.
For this paper, the RCWLs and the boundaries of the FLWL under various acceptable risks were determined through extensive simulations of floods. Subsequently, the reservoir flood risk control map was generated by considering the lower boundaries of the FLWL. For the wet season, the flood risk control map was directly applied to the DC-FLWL. If the water level exceeds the upper boundary under acceptable risk, the risk will be greater than the acceptable risk. In such cases, the water level should be decreased below the dynamic control upper boundary of FLWL to reduce flood risk based on forecast information. Conversely, the water level should be elevated within the dynamic control domain of the FLWL to enhance floodwater utilization based on forecast information.
Therefore, the core principle of the flood risk control method is realizing the DC-FLWL for balancing floodwater utilization and flood risk. Based on a reservoir flood risk control map, the risk control method in this paper, facilitates improved floodwater utilization within acceptable flood risks, offering technical support for reducing flood risk and enhancing floodwater utilization in reservoir flood control operation.

2.5. Risk and Benefit Assessment
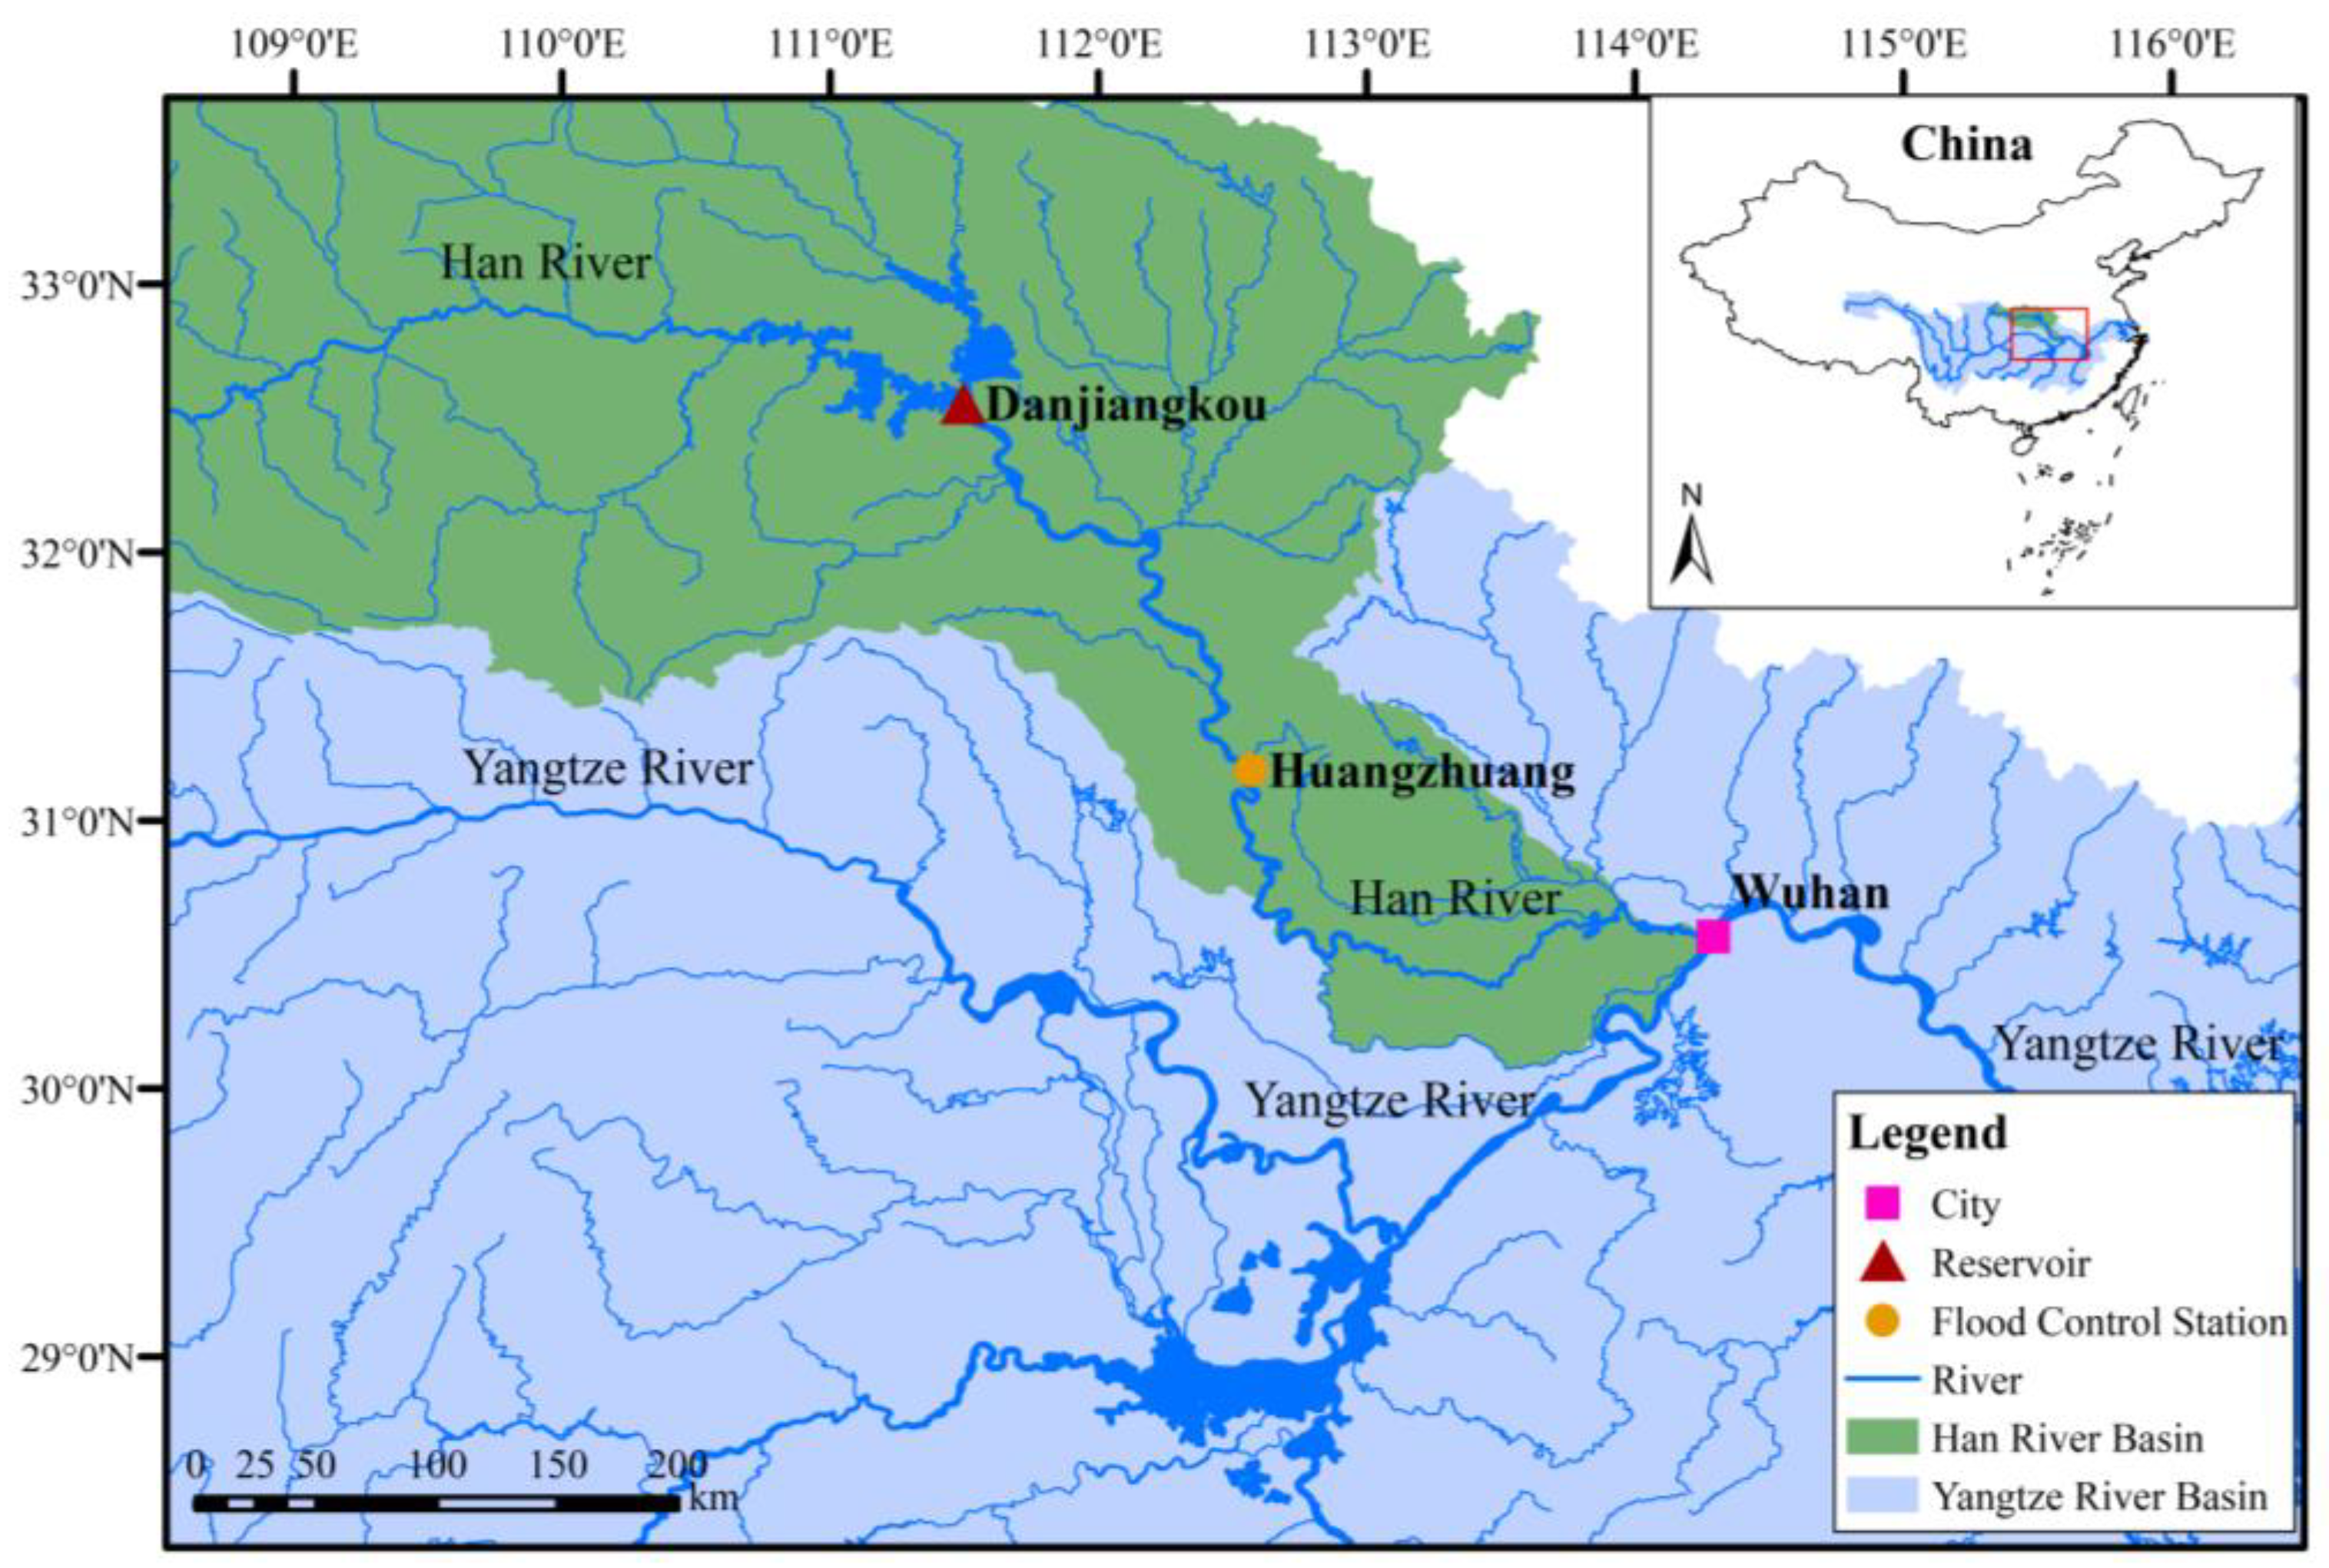
As mentioned above, the risks and benefits of floodwater utilization are influenced by the water level, and elevated water levels increase flood risk but enhance floodwater utilization. In this paper, the highest water level (HWL), the average storage capacity deducted from the dead storage capacity during the wet season (ASC), and the storage capacity deducted from the dead storage capacity in the last stage of the wet season (SCT) are used to evaluate the risks and benefits of floodwater utilization.
H W L = max t [ 1 , T ] { Z t }
A S C = t = 1 T ( V t V D W L ) T
S C T = V T V D W L
where Vt and Zt are the storage capacity and water level, respectively; VT is the storage capacity in the last stage of the wet season; and VDWL is the dead storage capacity. The HWL is used to measure the flood risk, and the ASC and the SCT are both used to measure the benefits of floodwater utilization.

3. Case Study

The Danjiangkou reservoir in China’s Han river is a water source project for the middle route of the South-to-North Water Diversion Project, the aim of which is to alleviate the water scarcity of 19 large and medium-sized cities [32]. The first phase of this water diversion project created a multi-year average annual transfer of 9.5 billion m3 of water. As of 30 March 2023, this water diversion project has transferred over 55 billion m3 of water and implemented approximately 9 billion m3 of ecological water replenishment. This has directly benefited more than 85 million people, including over 5 million individuals who no longer have to deal with bitter and salty water or highly fluoridated water. The Danjiangkou reservoir is a multi-year adjustment water conservancy project, which provides various benefits. On the basis of the optimal scheduling plan of the Danjiangkou reservoir, it carries out flood control for the Han River, with the Huangzhuang station serving as the control station. The wet season spans from 21 June to 10 October. During the summer wet season, which occurs before 20 August, the FLWL is set at 160.00 m. Similarly, during the autumn wet season, which starts from 1 September, the FLWL remains at 163.50 m. Figure 2 plots the geographical location relationship between the Danjiangkou reservoir and the Huangzhuang station.
According to the optimal scheduling plan of the Danjiangkou reservoir, the protection standard for the downstream control area is set at a frequency of once in 100 years. For the sake of guaranteeing downstream safety for floods that occur once in 100 years or less, the reservoir operates using a graded compensation and regulation mode. For floods that exceed the rate of occurring once in 100 years, the reservoir operates using a graded control and discharge mode. Therefore, this paper only considers the floodwater utilization operation mode of the Danjiangkou reservoir for floods that occur once in 100 years or less.
The Danjiangkou reservoir operates according to the proposed operation rules during the wet season and maintains the water level near the FLWL. However, there is a tendency to release water during the wet season, and it is difficult to refill the reservoir in the last stage of wet season, resulting in the prominent conflict between water supply and flood control. This paper considers four historical floods (ones in 1935 and 1975 in the summer wet season and ones in 1964 and 1983 in the autumn wet season) and upscales them to design floods with magnitudes of once in every 5, 10, 20, 50, and 100 years. Additionally, historical daily runoff data from 1969 to 2018 (50 years) and the interval historical daily runoff data from the Danjiangkou reservoir and Huangzhuang station from 1989 to 2018 (30 years) during the wet season were used for the work presented in this paper.

4. Results

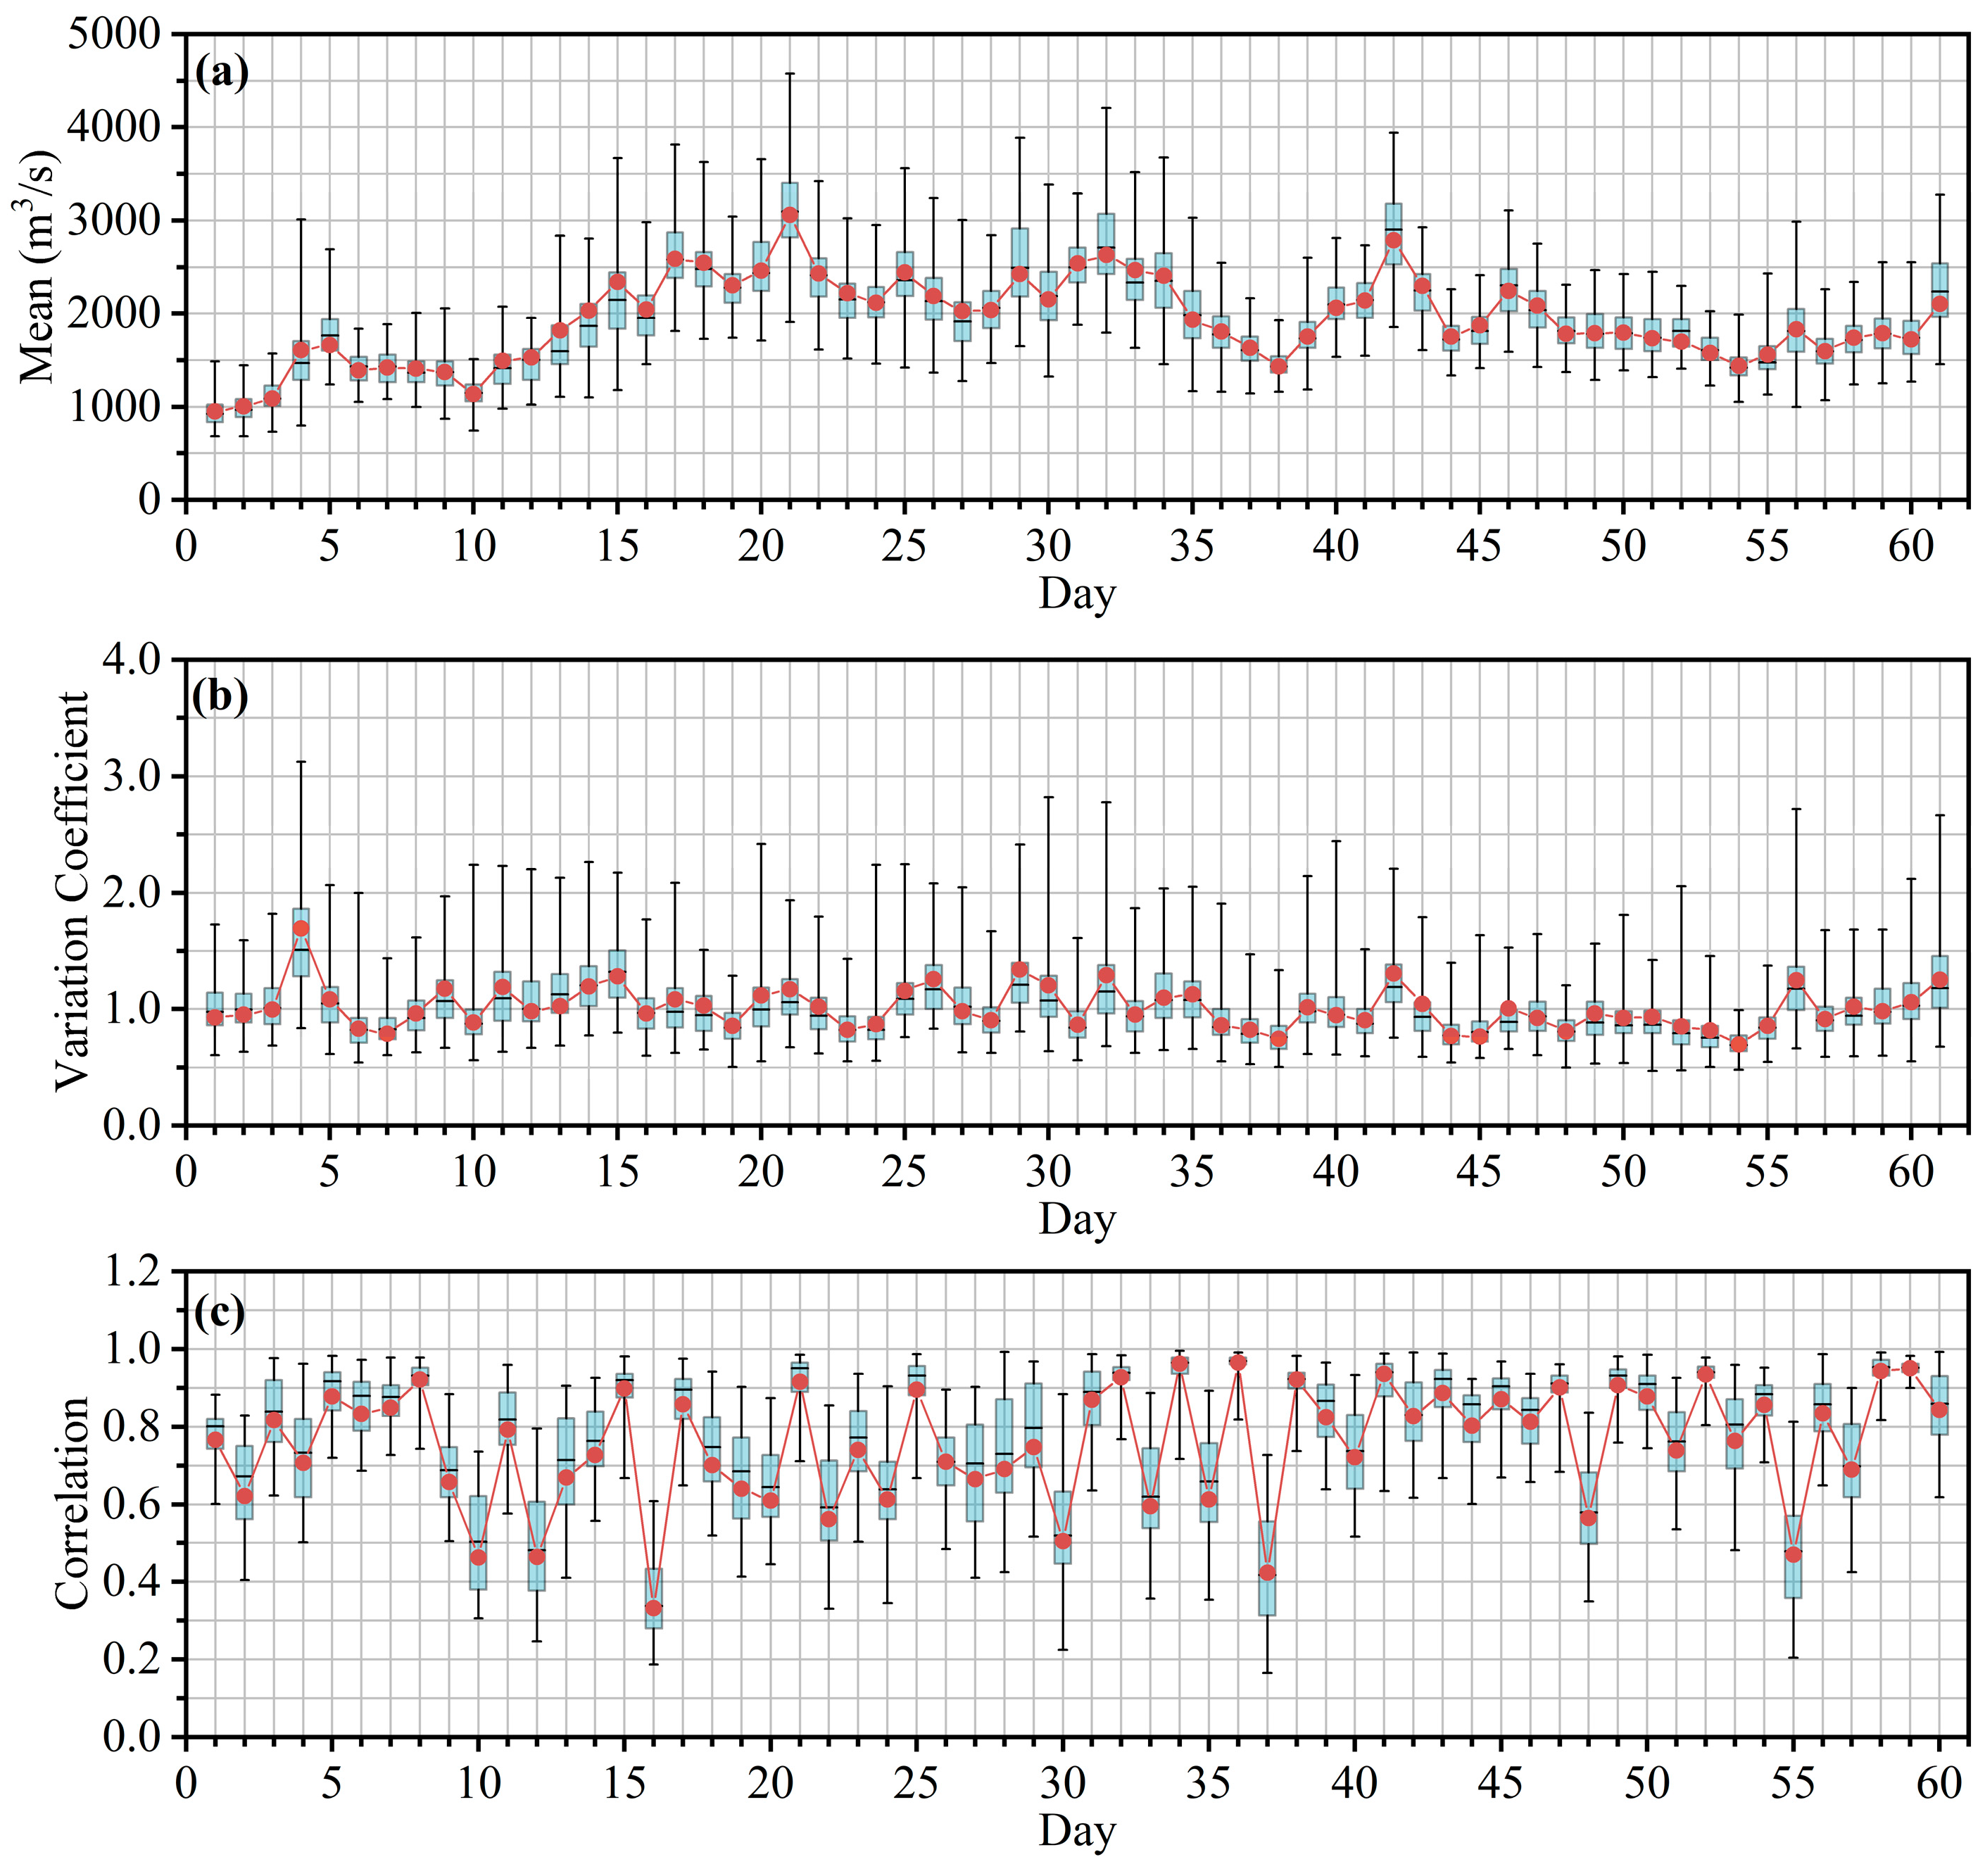
4.1. Simulation of Reservoir Inflow

The correlated disaggregation model was constructed based the on Danjiangkou reservoir daily inflow during the wet season from 1969 to 2018 and evaluated by using statistics, including the mean, coefficient of variation, daily lag-1 autocorrelation, and probability density function. Taking the summer wet season as an example, the daily reservoir inflow processes of the last 50 years were simulated 100 times. Box plots of statistics pertaining to the simulated daily inflow are shown in Figure 3. The light blue boxes describe the distribution characteristics of the corresponding statistic, while the horizontal line represents the median of the corresponding statistic. The red dots connected by a red solid line describe the corresponding statistic of the historical data. As shown in Figure 3, the red dots are all inside the light blue boxes, which indicates that the obtained daily inflow is consistent with the statistics of historical daily inflow. In addition, the statistics of the simulated data exhibit a similar trend to that of the historical data, which indicates that the statistical properties of the historical daily inflow have been well captured and that the simulated daily inflow exhibits the same continuity as the historical data.
In order to further verify that the correlated disaggregation model can effectively reproduce the observed statistics of flood volume (FV), the FV in 1 day, 3 days, 7 days, and 15 days of the simulated and observed inflow were calculated, respectively. Box plots of the probability density functions of the simulated FV1, FV3, FV7, and FV15 are shown in Figure 4. It can be seen that the historical probability density functions of FV, which are highly skewed, are very well captured in different time periods. Therefore, the correlated disaggregation model restores the entire distribution features of FV and daily inflow and can be used to simulate the mass of the daily inflow of the Danjiangkou reservoir.

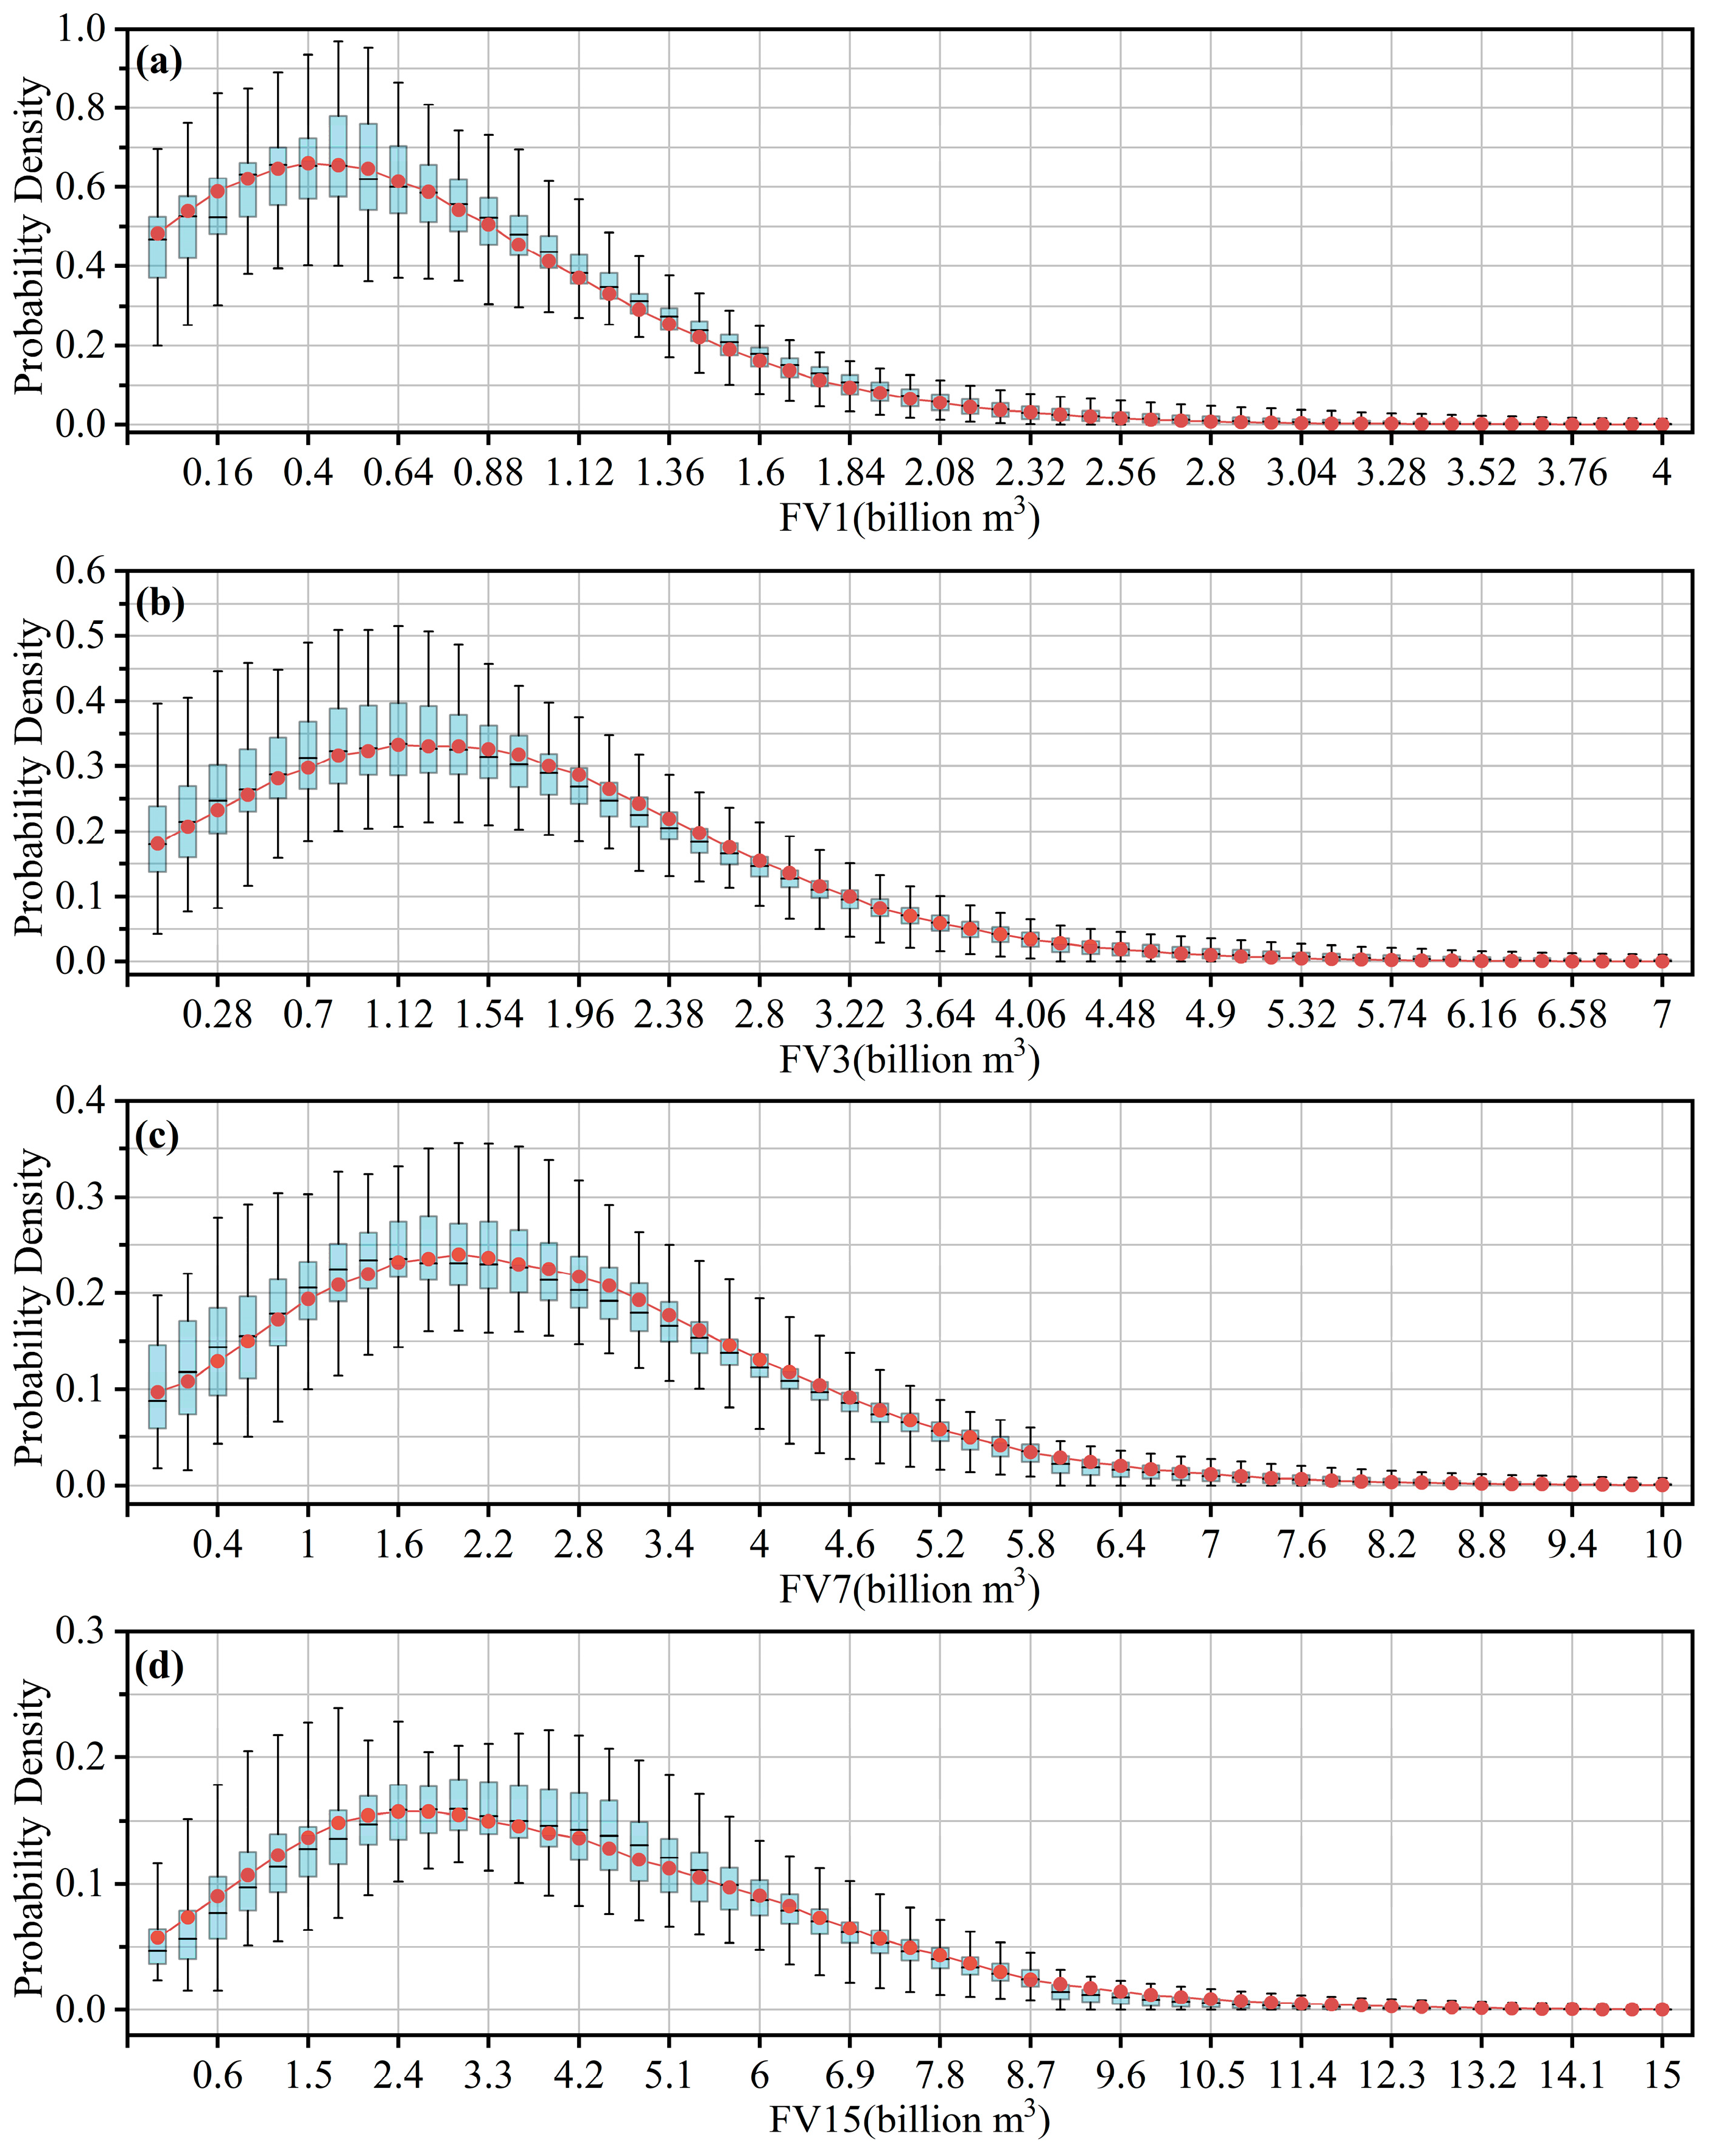
4.2. Simulation of Interval Flood

The reservoir inflow floods and the interval floods during the wet season from 1989 to 2018 were used to establish their joint distribution relationship. Taking the summer wet season as an example, the contour plot of joint distribution probabilities between reservoir flood volume and interval flood volume is illustrated in Figure 5. Their joint distribution probability can be conveniently obtained from Figure 5; if the reservoir flood volume and the interval flood volume are greater than 13.5 and 12.5 billion m3, respectively, their joint distribution probability is about 1% (see the red auxiliary line). Once the joint distribution relationship between reservoir flood volume and interval flood volume was obtained, on the basis of the mass of the simulated reservoir floods, it is possible to obtain the abundant interval floods by using the same ratio amplification method according to the 7-day flood volume under a certain flood return period.

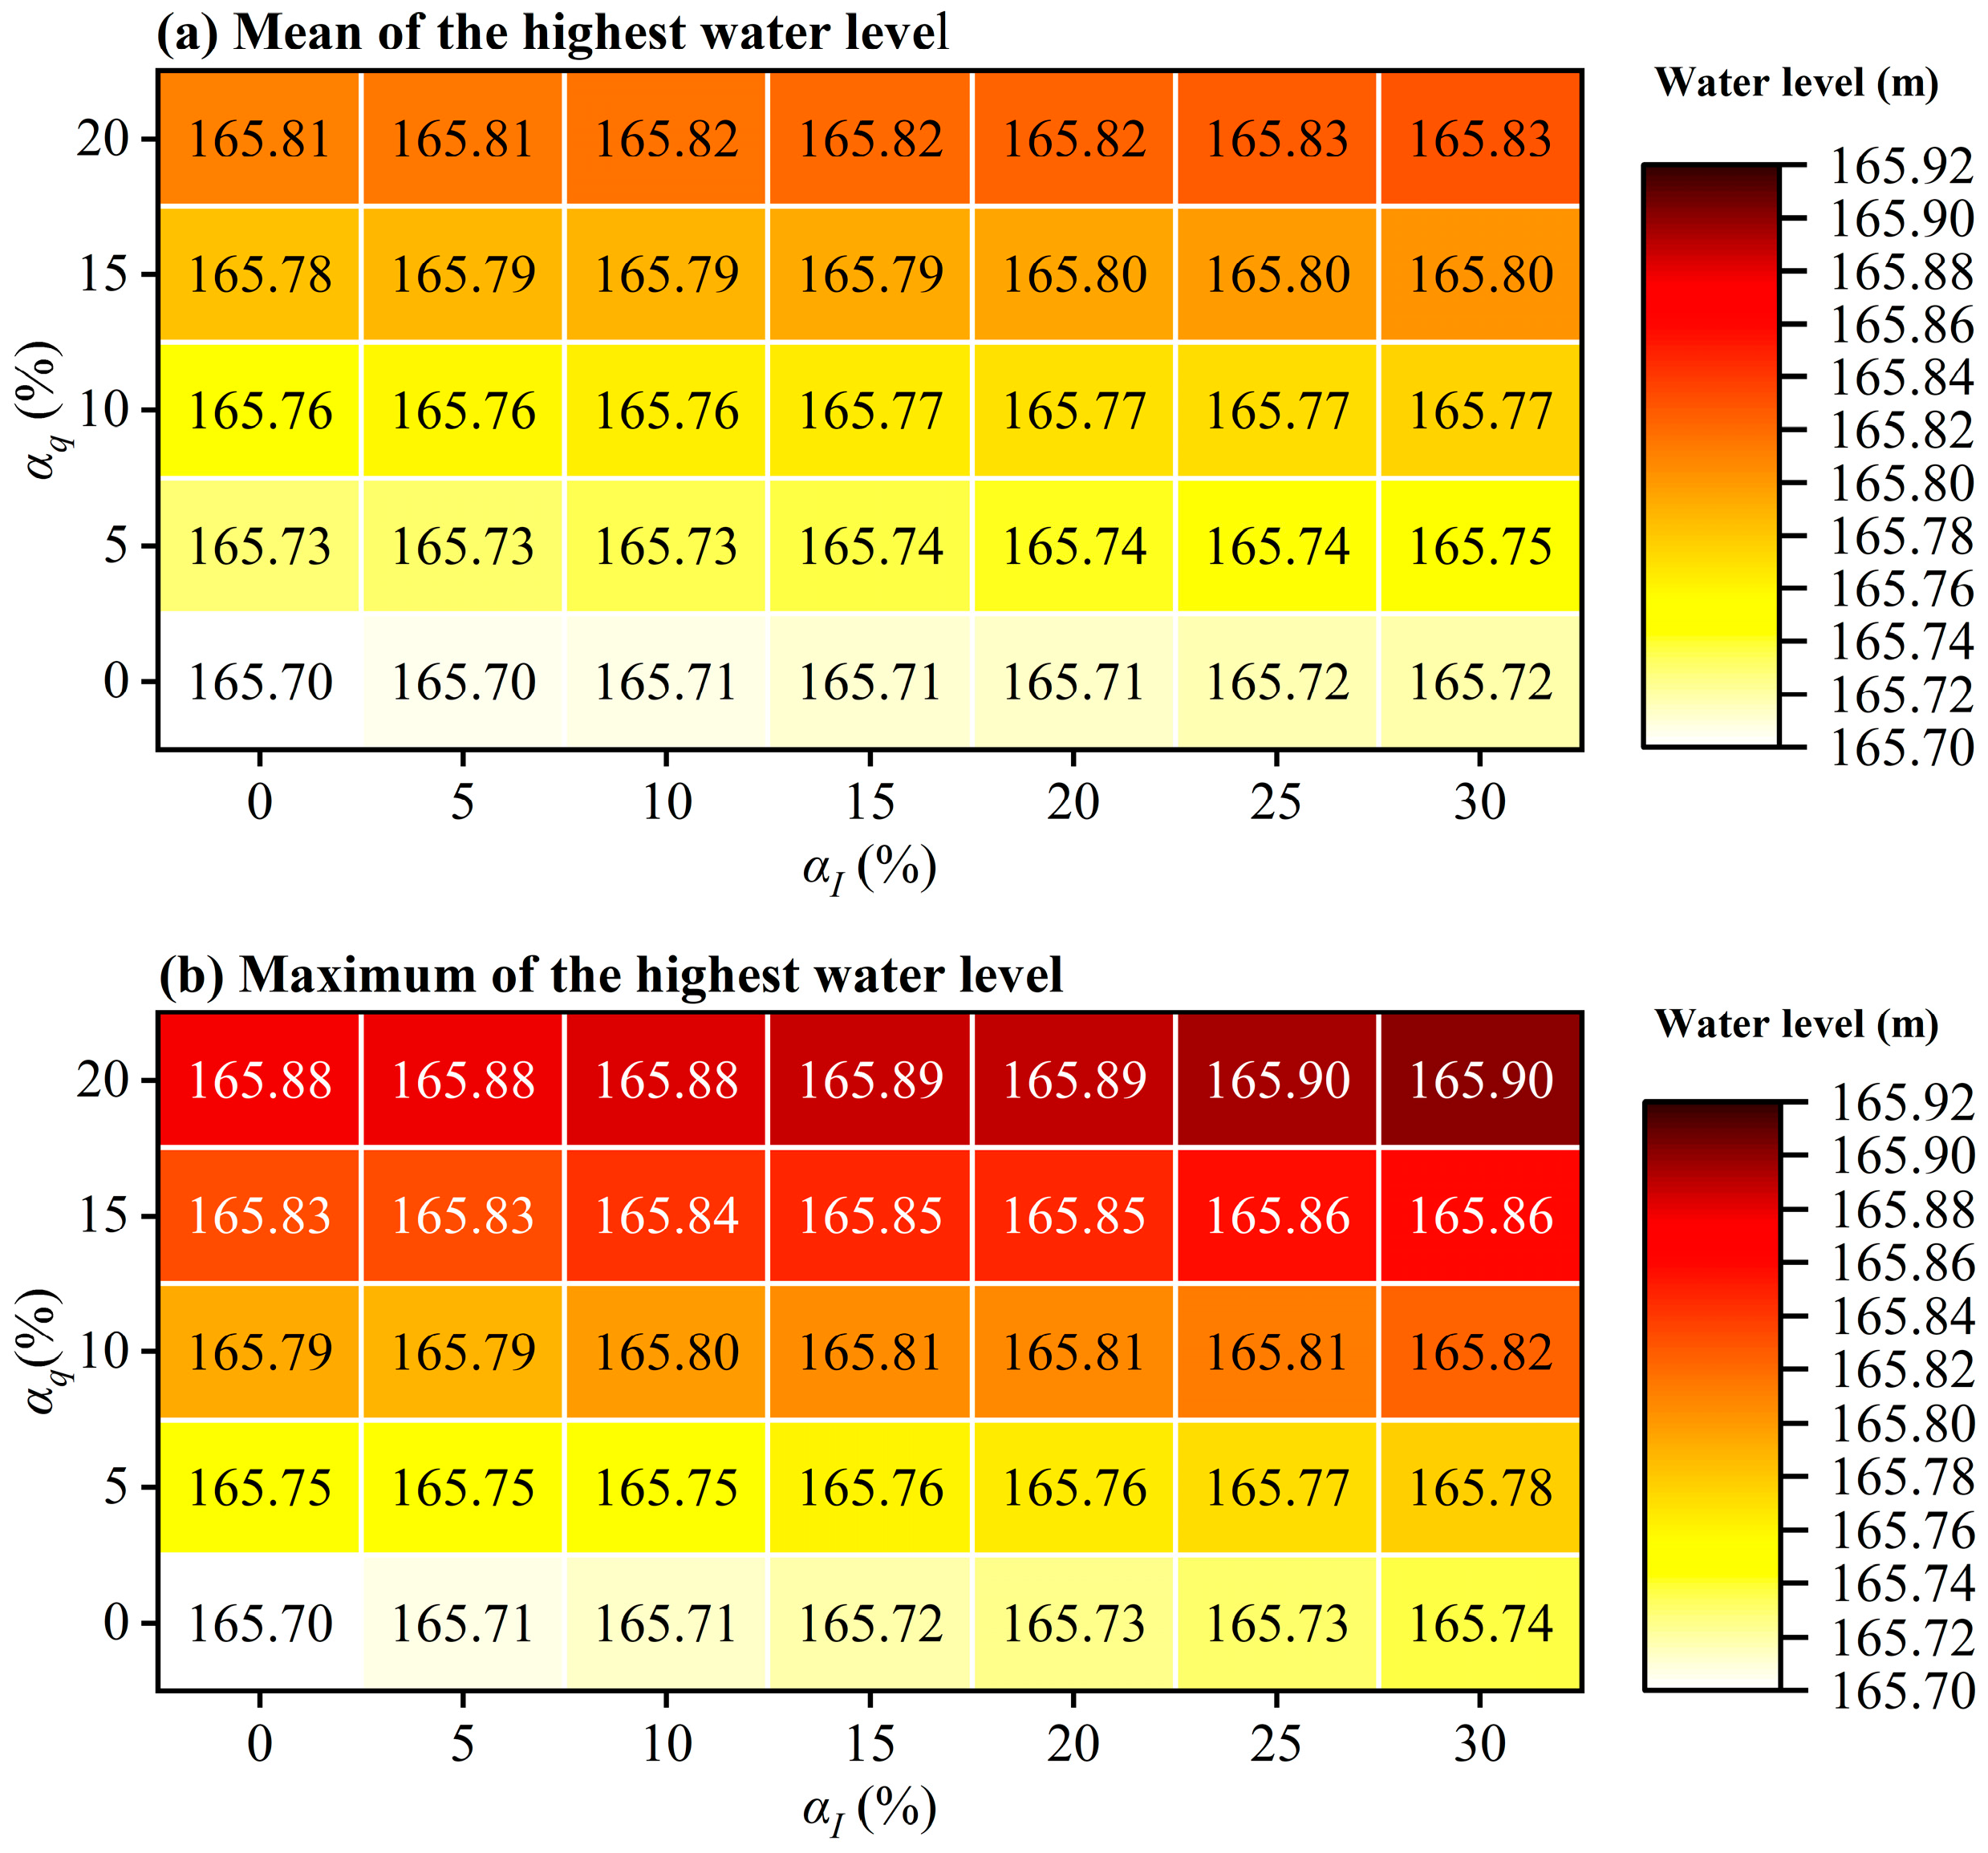
4.3. The Influence of Flood Forecast Error

According to the “Danjiangkou Water Conservancy Project Flood Control Operation Special Report”, the maximum relative error of the reservoir flood forecast αI and the interval flood forecast αq are 30% and 20%, respectively. Taking into account the most unfavorable conditions, the forecasted reservoir flood values were assumed to be smaller than the observed values, while the forecasted interval flood values were assumed to be larger than the observed values. To study the influence of flood forecast error, the relative errors were deemed to change in interval of 5%. Taking the once-in-100-year flood of 1975’s summer wet season as an example, each set of relative errors was randomly generated for 10,000 forecast floods. Statistics for the highest water level values under various relative errors are shown in Figure 6.
Figure 6 reveals that the mean and maximum of highest water level gradually increases with relative error. There is no flood forecast error when αI = 0% and αq = 0%, and the mean and maximum are both 165.70 m. The larger the relative error is, the larger the mean and maximum are and the higher the flood risk may be.

4.4. A Flood Risk Control Map and Flood Risk Control Method Oriented toward Floodwater Utilization

The RCWLs of the reservoir for various acceptable risk ratios (0, 5%, 10%, 15%, 20%) and flood return periods (5a, 10a, 20a, 50a, 100a) can be calculated by calculating the RCWL based on 30,000 simulated floods. The RCWLs for the same acceptable risk ratio and various flood return periods can be used to draw the dynamic control domain of the FLWL under an acceptable risk ratio. In the absence of flood risk, diagrams of the RCWLs for various flood return periods are shown in Figure 7. The light blue area represents the dynamic control domain of the FLWL, situated above current the FLWL (160.00 m and 163.50 m, respectively) and below the lower boundary line of the RCWLs for various flood return periods. The reservoir operates without flood risk by dynamically controlling the water level within the light blue area.
The dynamic control domains of the FLWL under various acceptable risk ratios can be used to draw flood risk control maps, as proven by Figure 8. The dynamic control domain under an acceptable risk ratio and its corresponding flood risk ratio can be easily determined from Figure 8. For example, if the acceptable risk ratio is 5%, the water level should be dynamically controlled in the green area. Flood risk control maps can be also used to study the potential of raising the FLWL under the acceptable risk ratio. Assuming an acceptable risk ratio of 0 (under the absence of flood risk scenario), the minimum RCWLs during the summer and autumn wet seasons are 161.13 m and 164.86 m (see Figure 7 and Figure 8), respectively, and raising the FLWL by 1.00 m based on the current FLWL poses no flood risk for the four historical floods upscaled to various flood return periods. Therefore, from a flood control safety perspective, it can be concluded that there is no flood risk when the FLWLs of the reservoir are raised to 161.00 m and 164.50 m (an increase of 1.00 m from the current FLWL), respectively, during the summer and autumn wet seasons.

4.5. The Risks and Benefits of Floodwater Utilization

Data pertaining to a total of 50 years (1969–2018) of the historical floods during the wet season were used to evaluate the risks and benefits of floodwater utilization after the FLWL is raised by 1.00 m, and the findings indicate that the discharge of the Huangzhuang station did not exceed its allowable limit in any of these years. The changes in the HWL, ASC, and SCT before and after the FLWL was raised are noted in Figure 9.
Figure 9a reveals that the HWL increases after FLWL is raised. The annual mean and maximum of the highest HWLs after the FLWL was raised are 165.24 m and 170.59 m, respectively, which are larger than the values before the FLWL was raised. Nonetheless, the HWL after the FLWL raised does not exceed the FCWL (171.70 m), indicating that the flood risk remains within a controllable range.
Figure 9b demonstrates that the ASC values all increased after the FLWL was raised. The annual mean and maximum of the ASC are 8.64 and 9.43 billion m3, respectively, and the ASC values are, on average, 10.68% (9.66–12.13%) more than the ones from before the FLWL was raised. In addition, the ASC values are, on average, 0.83 billion m3 more than the ones before the FLWL was raised, which is 8.74% of the average annual volume (9.5 billion m3) of water transferred by the aforementioned water transfer project over many years. As a consequence, the average available flood resources during the wet season increased after the FLWL was raised.
Figure 9c illustrates that the SCT values are all higher than the ones from before the FLWL was raised. The annual mean and maximum of the SCT are 11.40 and 16.01 billion m3, respectively, and the SCT values are, on average, 8.13% (1.10–12.78%) more than the ones from before the FLWL was raised. Moreover, the SCT are values, on average, 0.81 billion m3 more than the ones from before the FLWL was raised, which is 8.53% of the average annual volume of water transferred. Hence, the average available flood resources at the end of the wet season increased after the FLWL was raised.

5. Discussion

During reservoir operation and management, the flood risk control method oriented towards floodwater utilization can be directly applied to the DC-FLWL on the basis of the flood risk control map (Figure 8). Assuming an acceptable risk ratio of 5%, taking the summer wet season as an example, if the water level on 3 July is 166.00 m, the risk ratio exceeds 5% but is not higher than 10% (as indicated by the auxiliary line in Figure 8a), and the water level could be decreased adequately in the green area to reduce flood risk. Conversely, if the water level on 3 July is 161.00 m, the risk ratio does not exceed the acceptable risk ratio of 5%, and the water level may be prompted to the green area to enhance floodwater utilization based on the forecast information. The aim of this flood risk control method is to realize the DC-FLWL under an acceptable risk ratio, thereby enhancing floodwater utilization as much as possible while ensuring an acceptable risk level.
Furthermore, the risk ratios of various FLWLs were studied for the creation of this paper to verify the reasonability of the dynamic control domains of the FLWL under various acceptable risk ratios. The FLWL was raised in increments of 0.50 m, and the risk ratios of various FLWLs were calculated using a risk analysis model on the basis of 30,000 simulated floods. Figure 10 demonstrates more detailed information about the changes in risk ratio under various FLWLs and flood return periods (5a, 10a, 20a, 50a, 100a).
The results in Figure 10 reveal that the risk ratio gradually increases as the FLWL increases, and Figure 9 also indicates that the both risks and benefits increased as FLWL rose, which is in line with some existing studies [33,34,35]. Specifically, taking the flood of shown by the red curve and red cones in Figure 10a for the summer wet season as an example, the risk ratio remains relatively constant when the FLWL is less than 164.00 m. However, the risk ratio steeply increases with increasing FLWL when the FLWL is greater than 164.00 m. It is important to note that the risk ratios are 0 when the FLWLs are not more than 161.00 m and 164.50 m, respectively, during the summer and autumn wet seasons, which validates the potential of raising the FLWL in another way. This means that when the FLWL is raised from the current FLWL by 1.00 m, the flood risks for floods that occur once in 100 years and less remain unchanged and are all 0, which is the reason why many studies aim to enhance floodwater utilization without increasing the flood risk [36,37]. Whilst raising the FLWL has the potential to increase flood risk, this rule is not absolute. The flood risk may remain the same after raising the FLWL in some cases [38,39,40].
From what has been discussed above, it can be concluded that the flood risk is within a controllable range when the FLWL is raised by 1.00 m, based on the present study’s FLWL, and the ASC and SCT both increased (annual average increase of 0.83 and 0.81 billion m3, respectively), according to Figure 9, which effectively improves floodwater utilization and contributes to guaranteeing the water supply and power generation of the Danjiangkou reservoir.

6. Conclusions

Realizing the DC-FLWL is one of the ways of enhancing floodwater utilization, and the focus of this approach is to balance flood risk and the benefits of floodwater utilization. This paper presents a flood risk control method oriented towards floodwater utilization that achieves the dynamic control domains of the FLWL under various acceptable risk ratios, considering multiple main risk factors. Based on the comprehensive attention paid in this paper to the main flood risk factors, including the uncertainty of reservoir inflow, interval floods, and flood forecast errors, a risk analysis model was constructed, after which the process of calculating the RCWL was proposed to acquire the reservoir flood risk control map, both which were used in the flood risk control method oriented towards floodwater utilization. Then, the risks and benefits of floodwater utilization were investigated. Finally, the Danjiangkou reservoir was used as a case study. Based on our study, the following conclusions can be drawn.
(1)
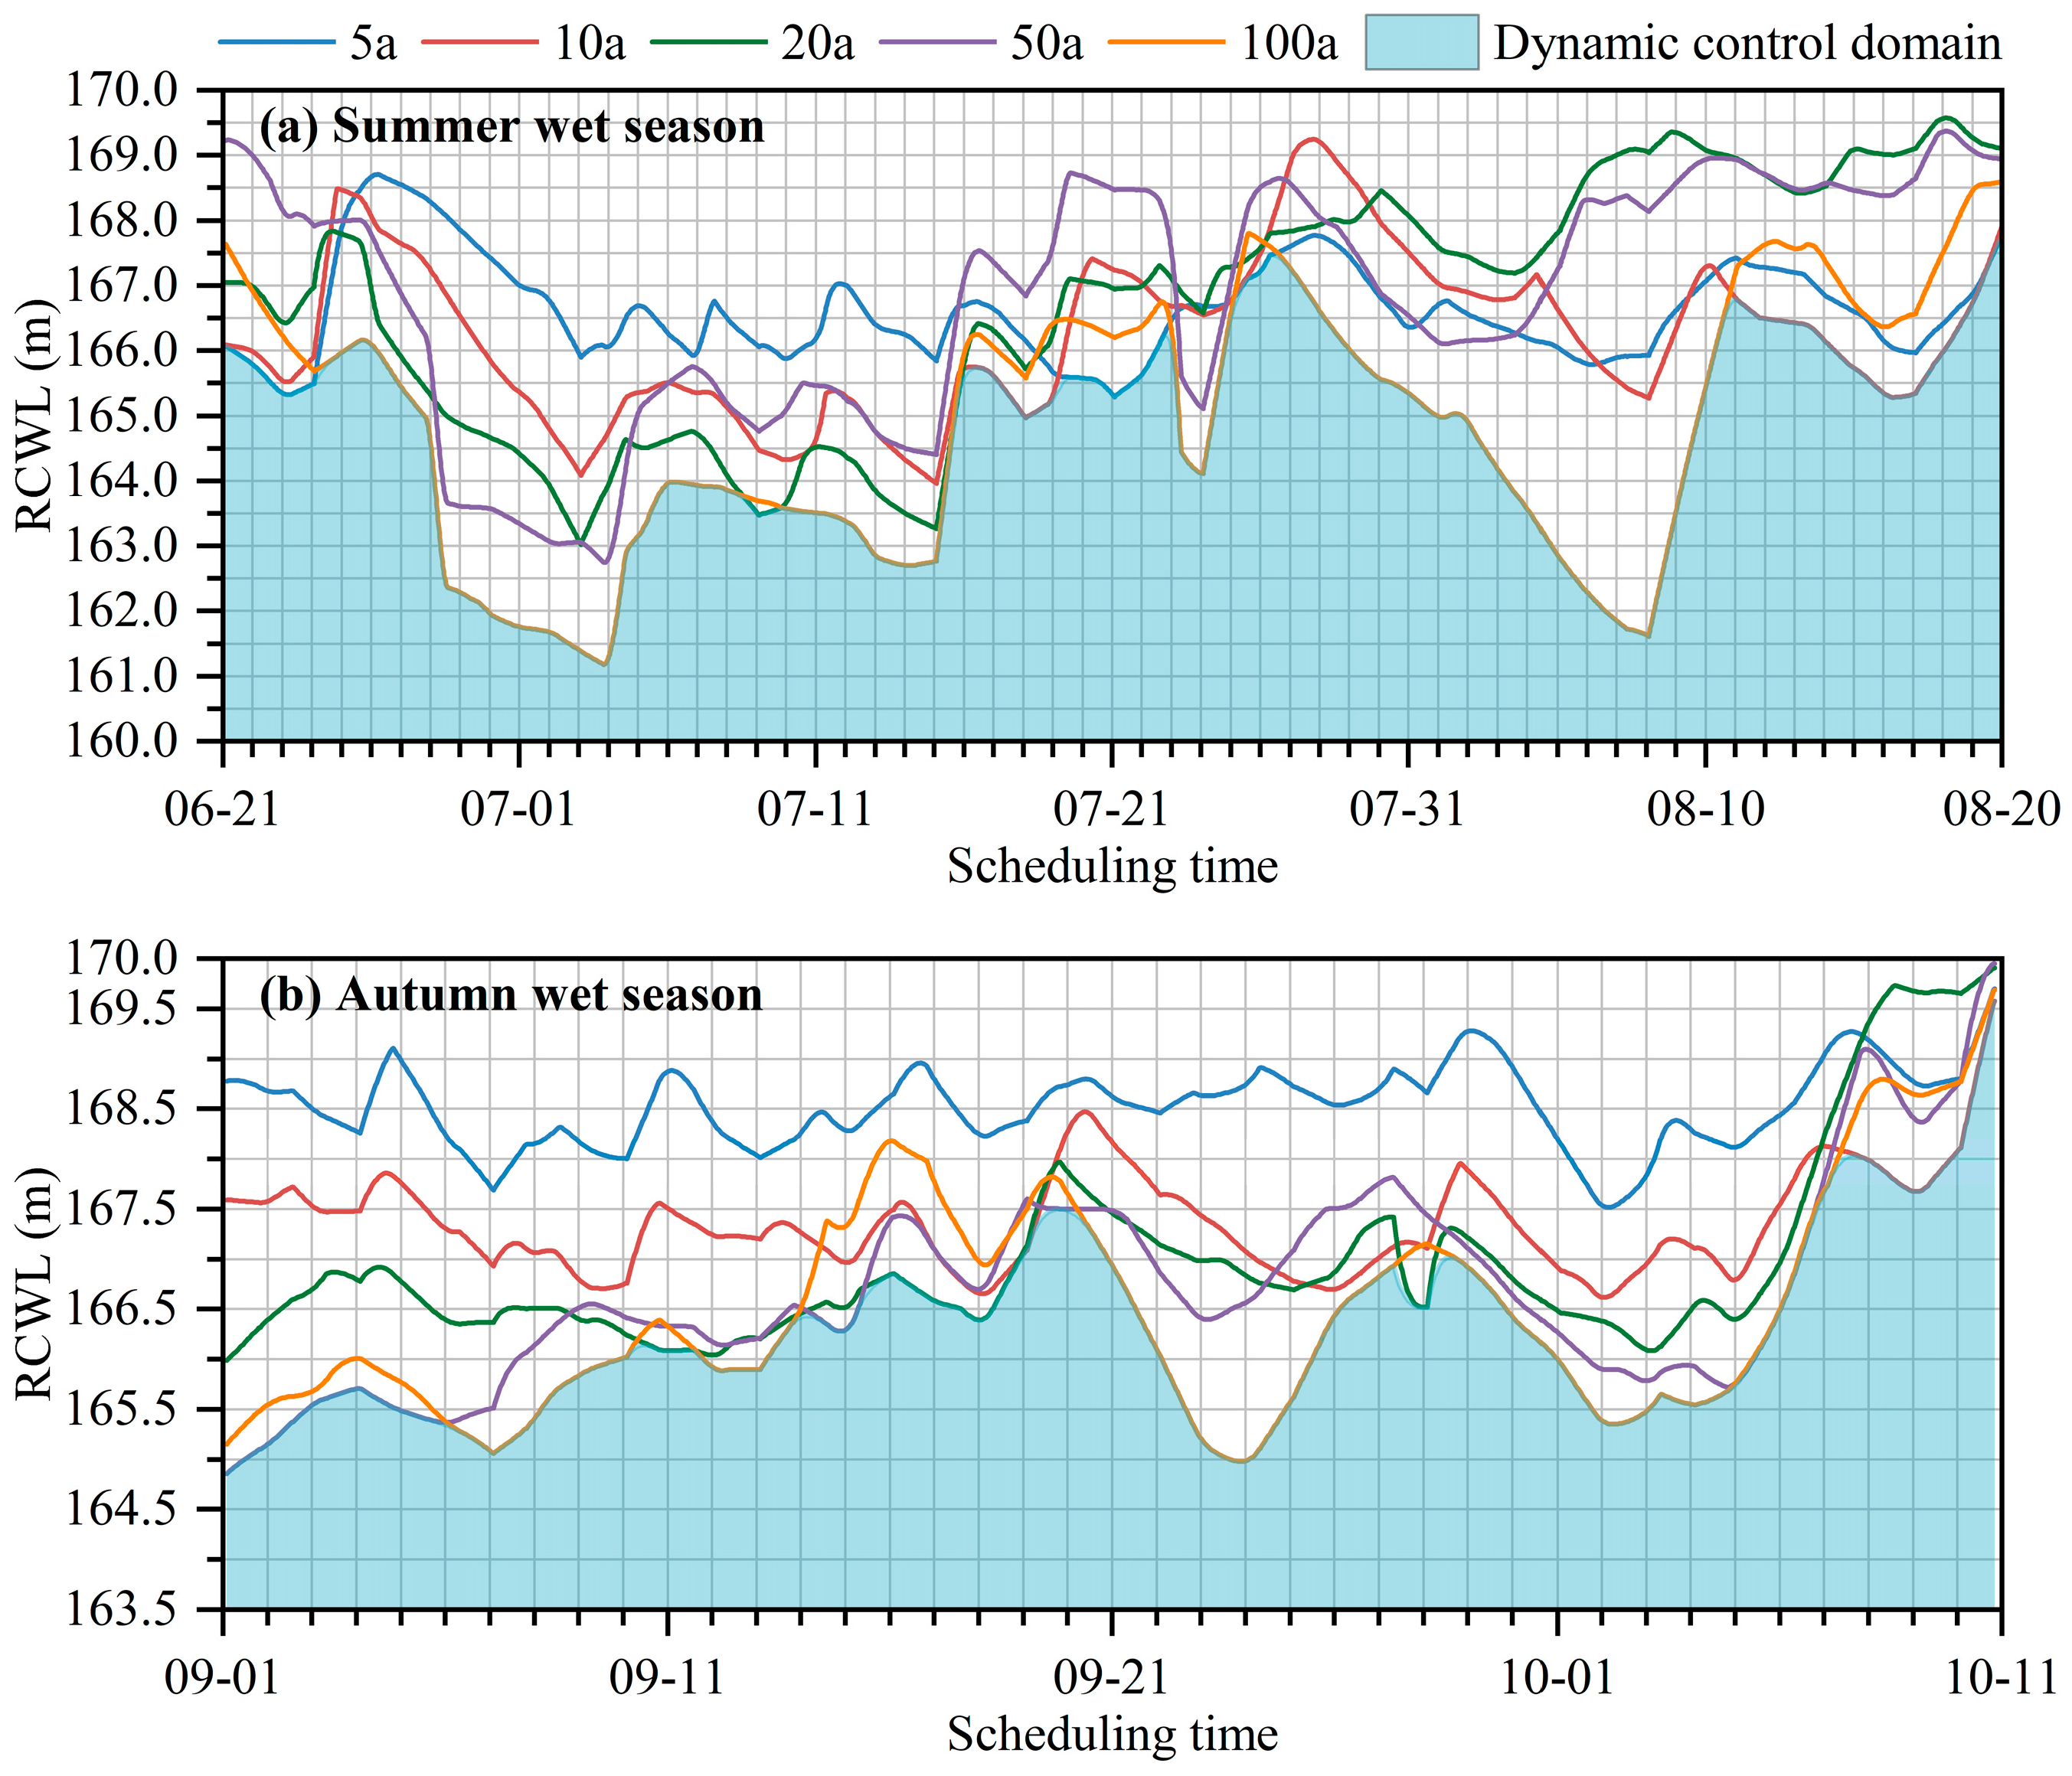
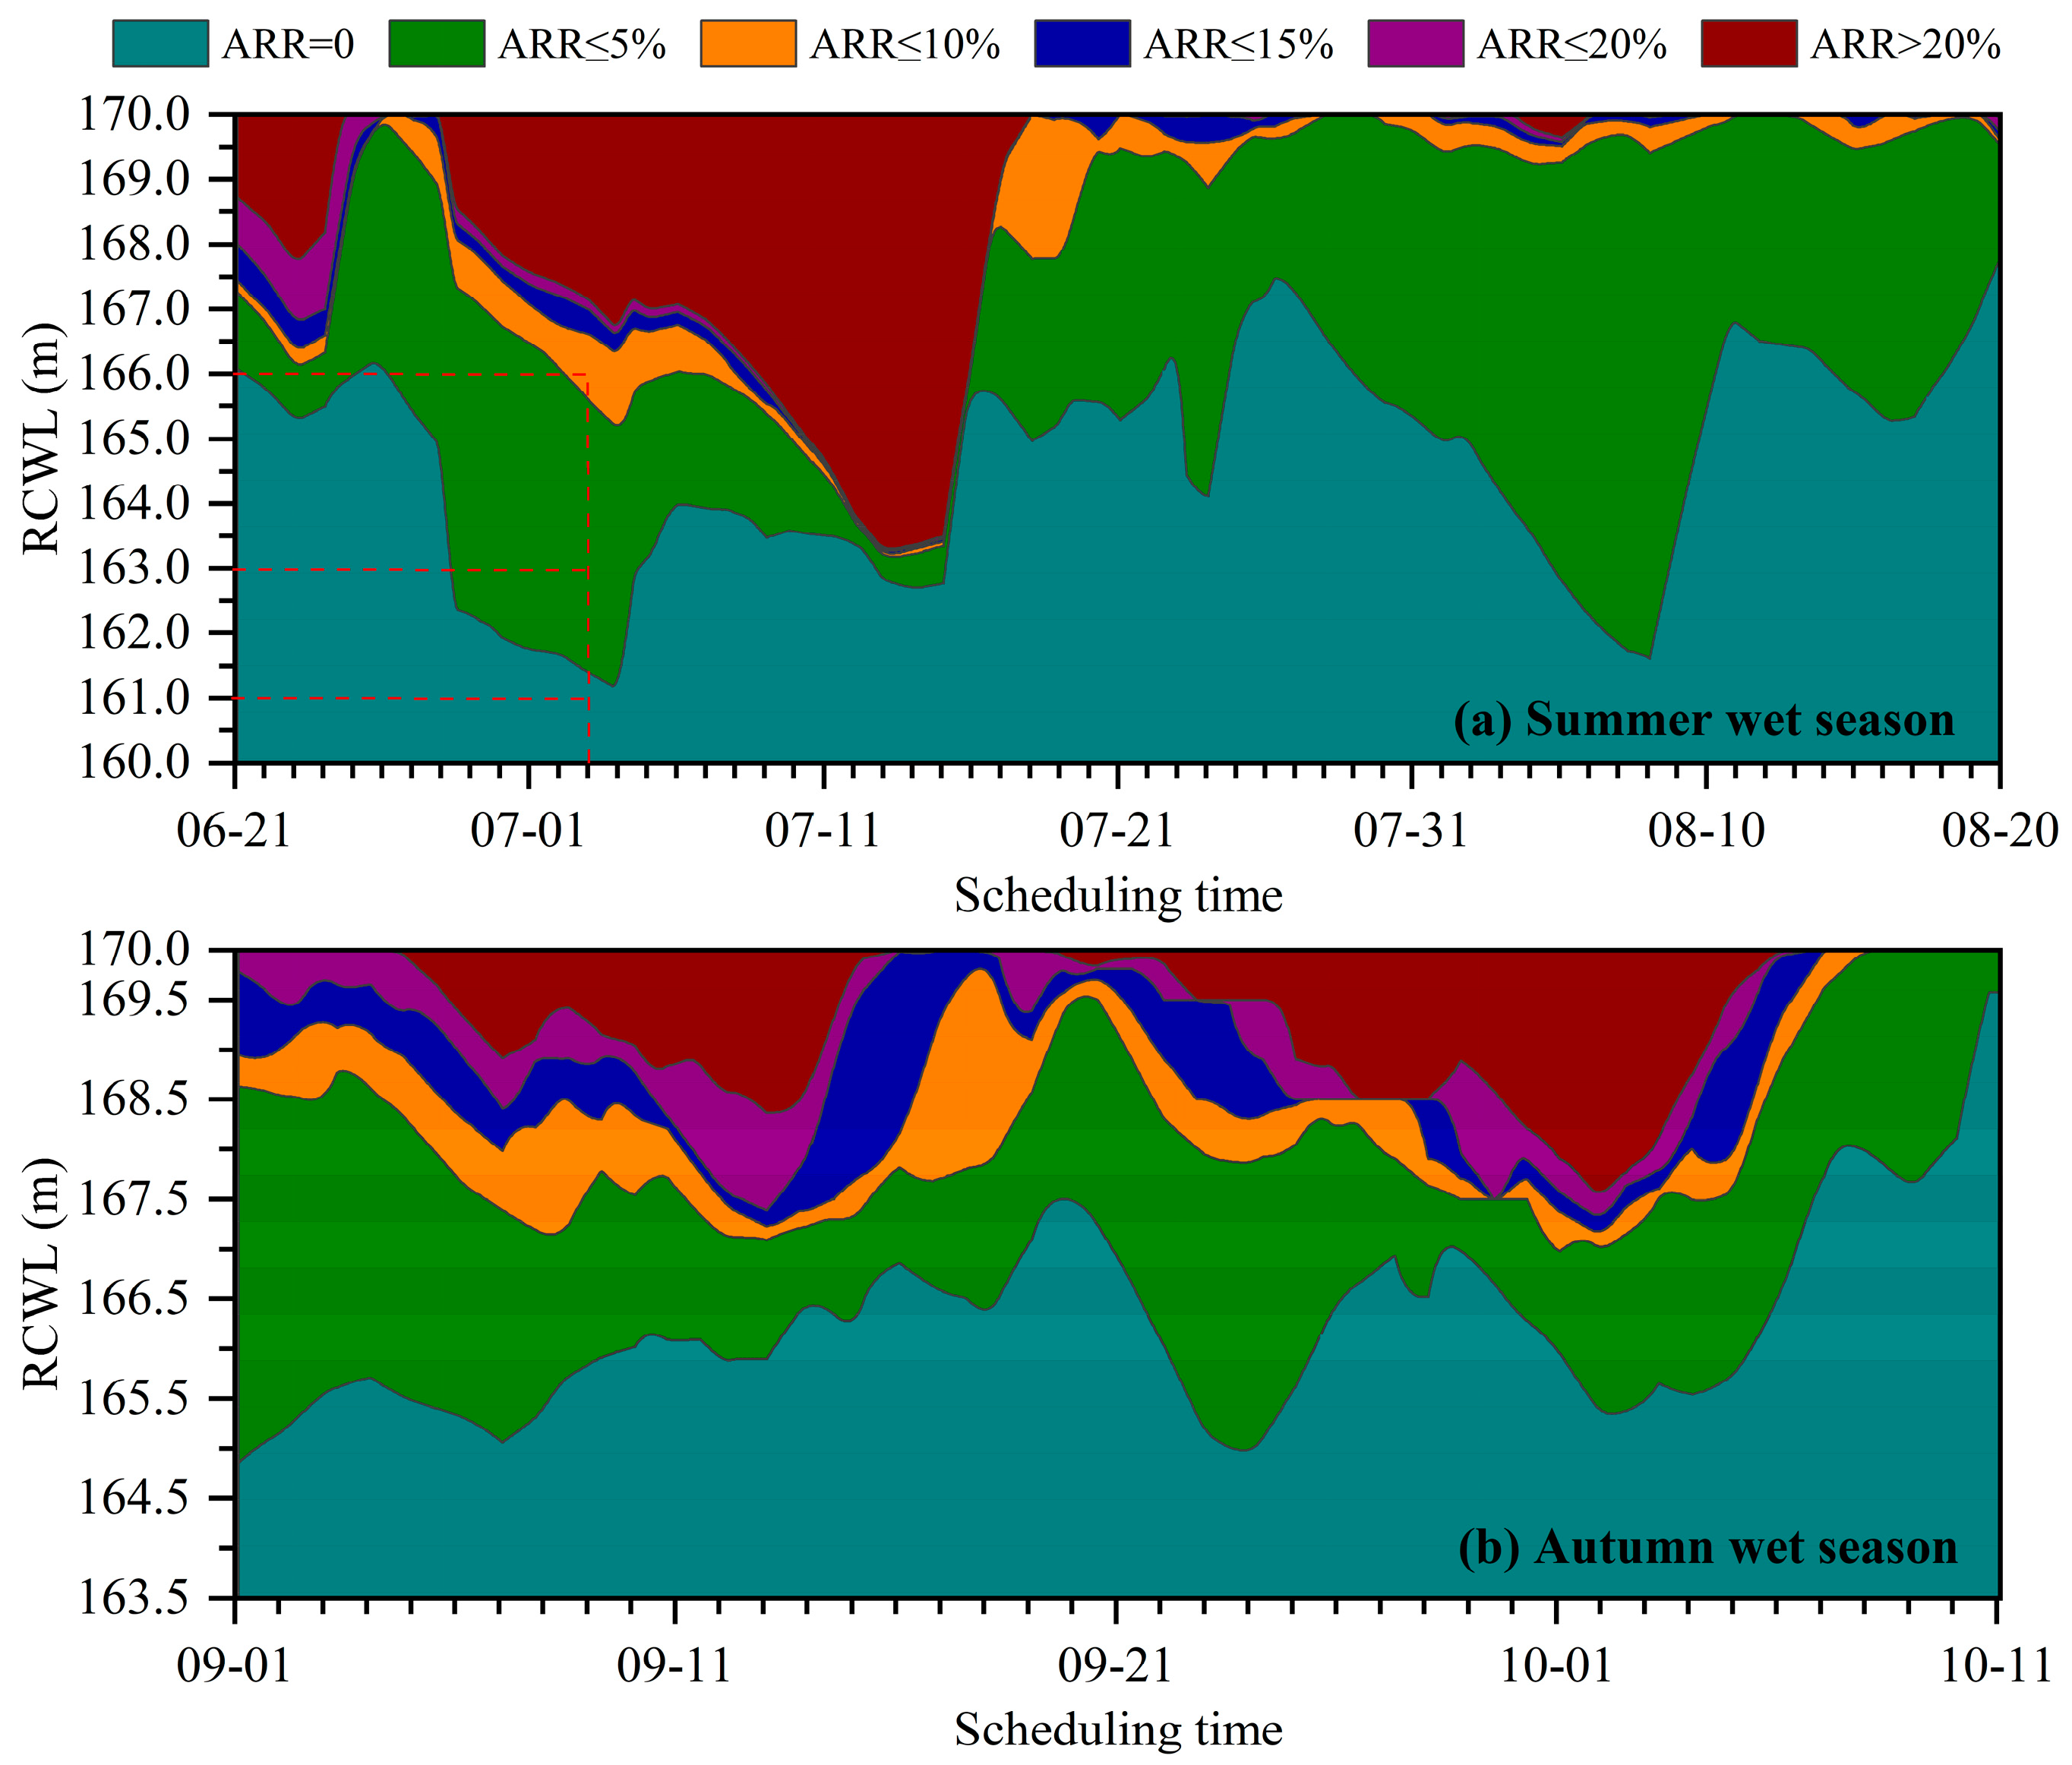
The dynamic control domains of the FLWL under various acceptable risk ratios and flood risk control maps were obtained, and the flood risk control method could improve floodwater utilization by realizing the DC-FLWL under acceptable risk ratios.
(2)
The potential of raising the FLWL was studied by using the established risk analysis model. The results show that the risk ratio increases as the FLWL rises. The FLWL could be raised by 1.00 m based on the present FLWL during the summer and autumn wet seasons under the absence of flood risk.
(3)
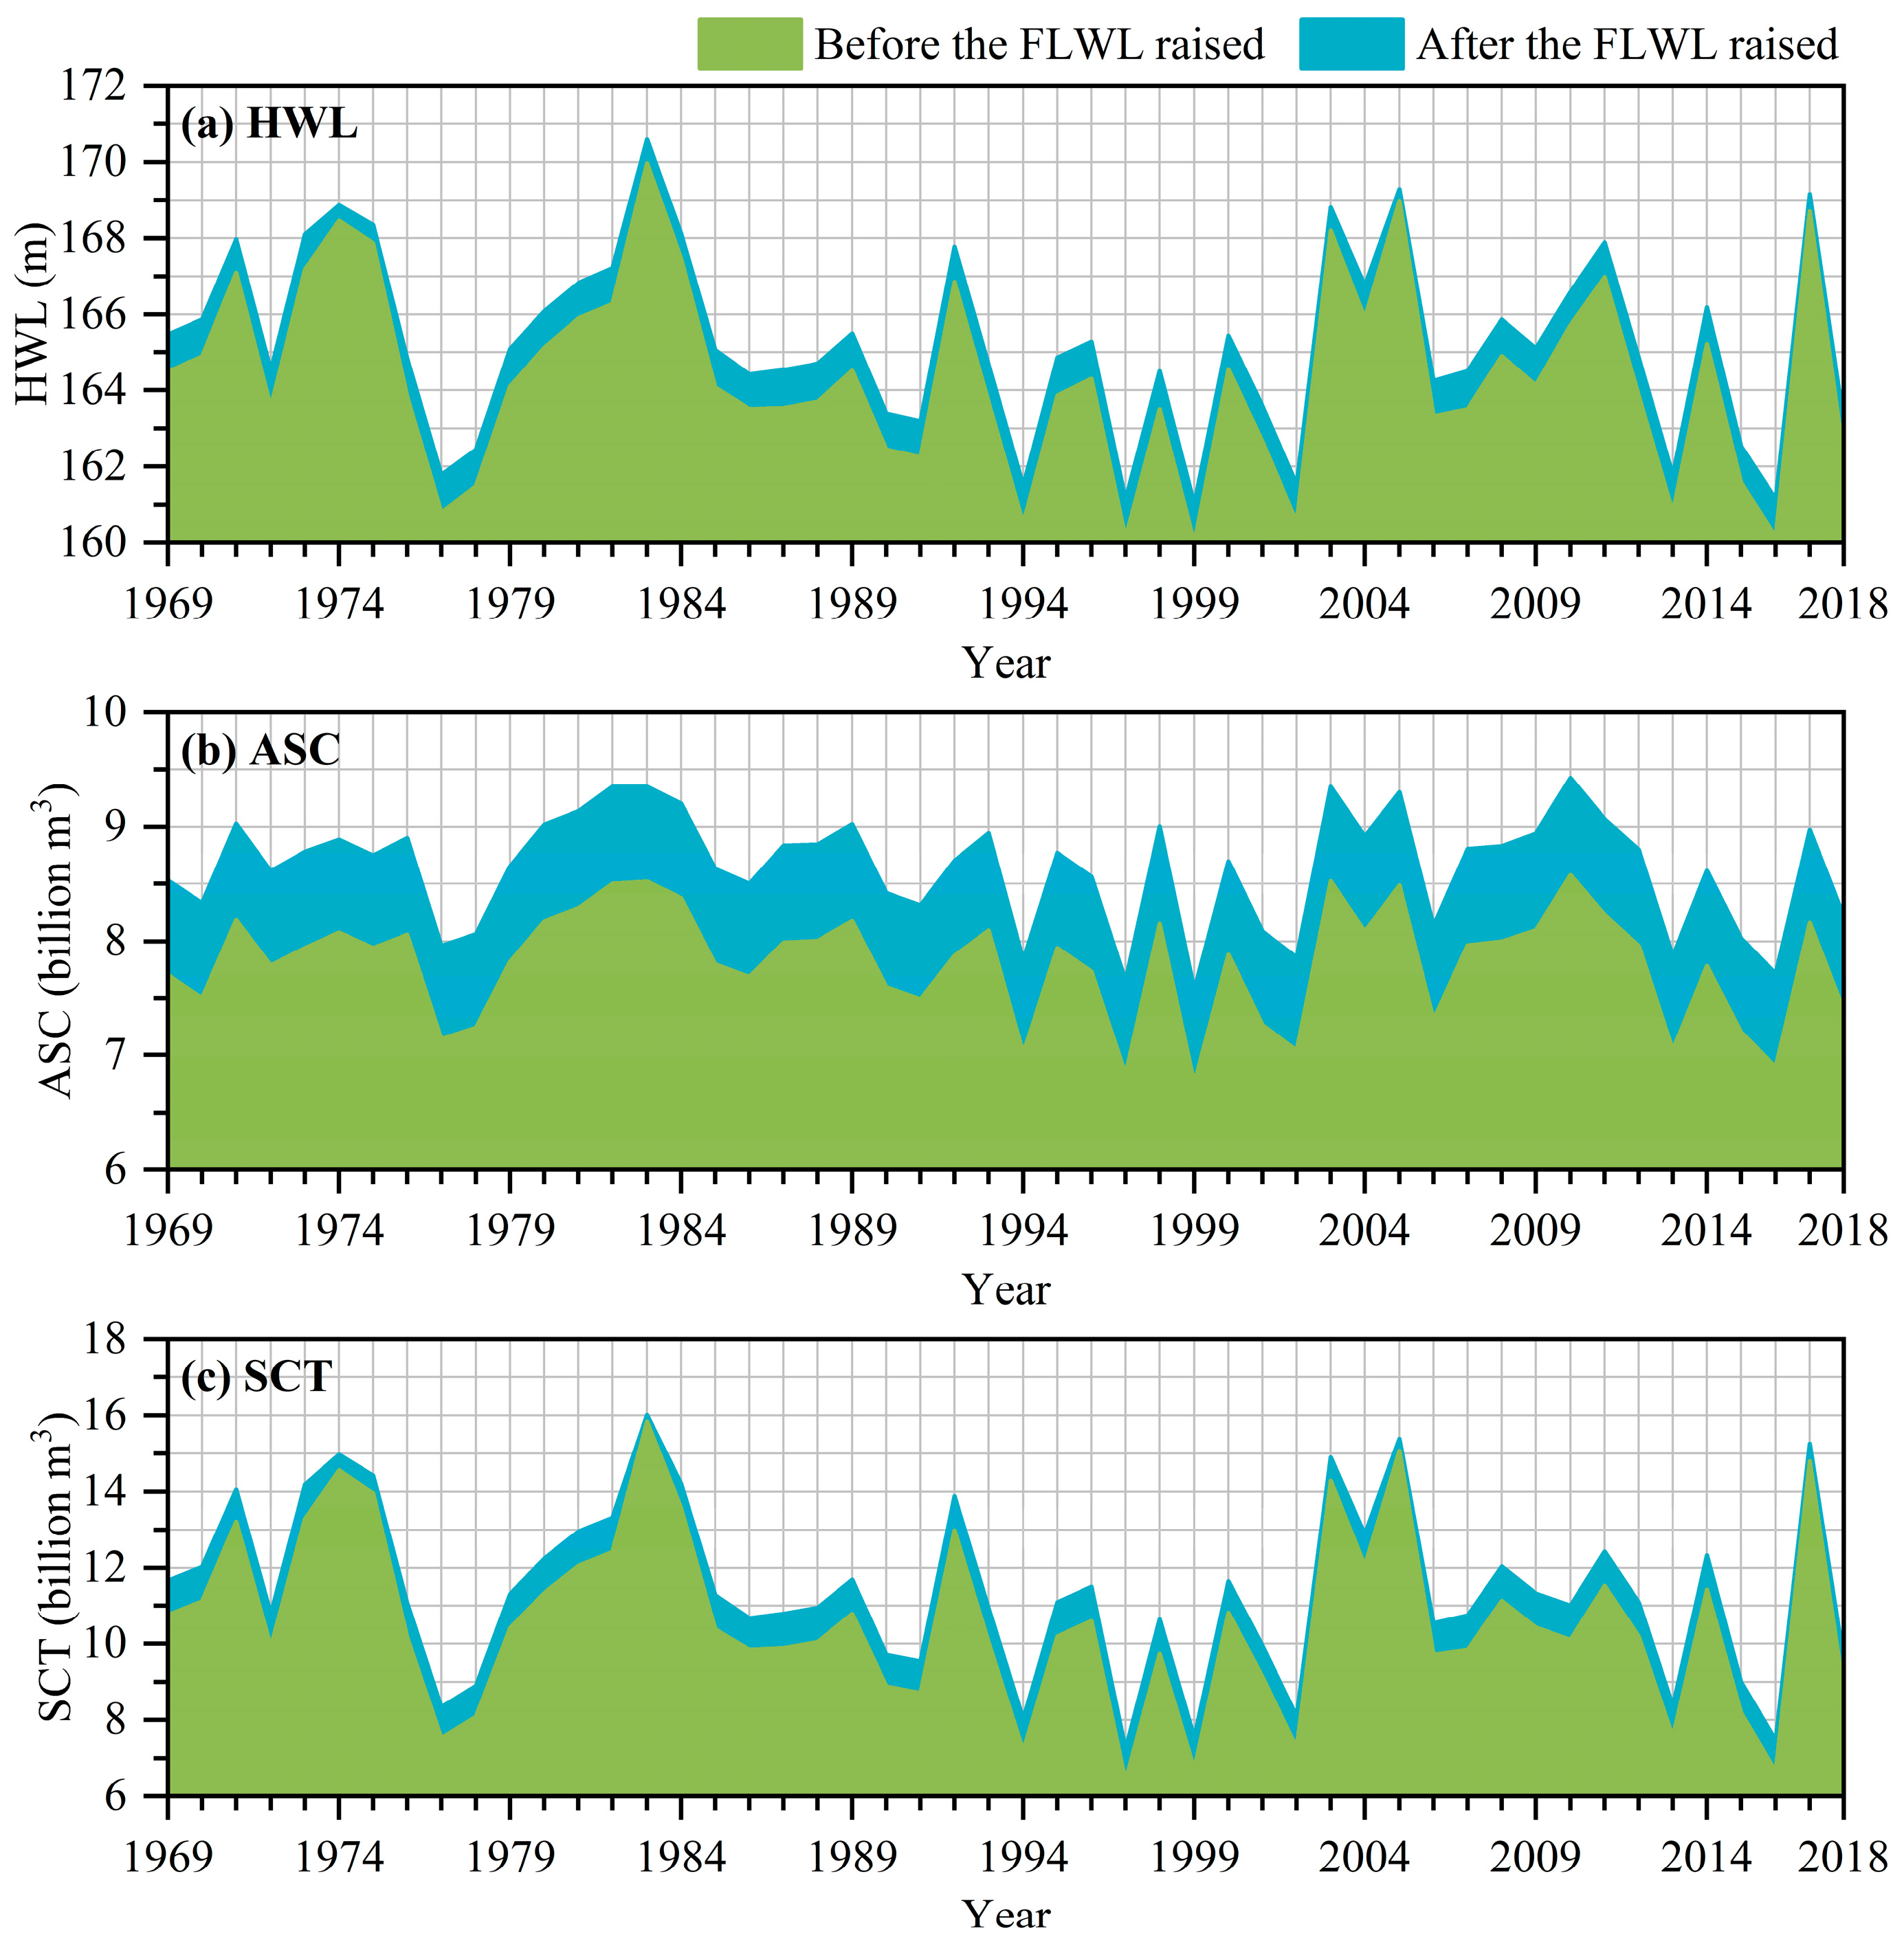
The assessment criteria, namely the HWL, ASC, and SCT values, were used to quantitatively measure the risks and benefits of floodwater utilization. The flood risk is within an acceptable range, and the available flood resources in the wet and dry seasons could be increased by about 10.68% and 8.13%, respectively, which could effectively improve the floodwater utilization and contribute to water supply safety.
The flood risk control method proposed in this paper achieves the dynamic control of the FLWL to improve floodwater utilization under the acceptable flood risk. However, amidst the backdrop of global climate change, considering key risk factors as comprehensively as possible, achieving the DC-FLWL, and weighing the risks and benefits of floodwater utilization remain as challenges for the future.

Author Contributions

Conceptualization, L.Z. and L.K.; data curation, L.Z.; formal analysis, L.Z.; funding acquisition, L.K.; investigation, S.H. and J.G.; methodology, L.Z.; project administration, L.K.; resources, L.K.; software, L.Z., S.H. and J.G.; supervision, L.K.; validation, L.K., S.H. and J.G.; visualization, L.Z.; writing—original draft, L.Z.; writing—review and editing, L.K. All authors have read and agreed to the published version of the manuscript.

Funding

This paper was funded by the National Key R&D Program of China (Grant No. 2021YFC3200302).

Data Availability Statement

The data that support the findings of this paper are available from the corresponding author upon reasonable request.

Acknowledgments

We would like to express our gratitude to the Hanjiang Water Conservancy and Hydropower (Group) Co., Ltd. (Danjiangkou, China) for providing data.

Conflicts of Interest

The authors declare no conflict of interest.

References

  1. Garrote, J.; Pena, E.; Diez-Herrero, A. Probabilistic Flood Hazard Maps from Monte Carlo Derived Peak Flow Values—An Application to Flood Risk Management in Zamora City (Spain). Appl. Sci. 2021, 11, 6629. [Google Scholar] [CrossRef]
  2. Zhou, L.; Kang, L. A Comparative Analysis of Multiple Machine Learning Methods for Flood Routing in the Yangtze River. Water 2023, 15, 1556. [Google Scholar] [CrossRef]
  3. Wen, Y.; Zhou, L.; Kang, L.; Chen, H.; Guo, J. Drought risk analysis based on multivariate copula function in Henan Province, China. Geomat. Nat. Hazards Risk 2023, 14, 2223344. [Google Scholar] [CrossRef]
  4. Fadel, A.W.; Marques, G.F.; Goldenfum, J.A.; Medellín-Azuara, J.; Tilmant, A. Full Flood Cost: Insights from a Risk Analysis Perspective. J. Environ. Eng. 2018, 144, 04018071. [Google Scholar] [CrossRef]
  5. Ding, W.; Zhang, C.; Peng, Y.; Zeng, R.; Zhou, H.; Cai, X. An analytical framework for flood water conservation considering forecast uncertainty and acceptable risk. Water Resour. Res. 2015, 51, 4702–4726. [Google Scholar] [CrossRef]
  6. Li, Y.; Guo, S.L.; Quo, J.L.; Wang, Y.; Li, T.Y.; Chen, J.H. Deriving the optimal refill rule for multi-purpose reservoir considering flood control risk. J. Hydro-Environ. Res. 2014, 8, 248–259. [Google Scholar] [CrossRef]
  7. Liu, G.; Zhou, J.; Yang, Y.; Ke, S.; Mo, L.; Wang, Y.; Xiao, X. Risks Analysis of Discarding Water in Power Generation Process of Hydropower Station. IEEE Access 2020, 8, 132703–132720. [Google Scholar] [CrossRef]
  8. Zhang, J.; Min, Y.W.; Feng, B.F.; Duan, W.X. Research and Application of Key Technologies for Dynamic Control of Reservoir Water Level in Flood Season. Water 2021, 13, 3576. [Google Scholar] [CrossRef]
  9. Ding, W.; Zhang, C.; Cai, X.M.; Li, Y.; Zhou, H.C. Multiobjective hedging rules for flood water conservation. Water Resour. Res. 2017, 53, 1963–1981. [Google Scholar] [CrossRef]
  10. Tan, Q.F.; Wang, X.; Liu, P.; Lei, X.H.; Cai, S.Y.; Wang, H.; Ji, Y. The Dynamic Control Bound of Flood Limited Water Level Considering Capacity Compensation Regulation and Flood Spatial Pattern Uncertainty. Water Resour. Manag. 2017, 31, 143–158. [Google Scholar] [CrossRef]
  11. Zhou, Y.L.; Guo, S.L.; Chang, F.J.; Liu, P.; Chen, A.B. Methodology that improves water utilization and hydropower generation without increasing flood risk in mega cascade reservoirs. Energy 2018, 143, 785–796. [Google Scholar] [CrossRef]
  12. Zhang, Z.B.; He, X.Y.; Geng, S.M.; Zhang, S.H.; Ding, L.Q.; Kan, G.Y.; Li, H.; Jiang, X.M. An Improved “Dynamic Control Operation Module” for Cascade Reservoirs. Water Resour. Manag. 2018, 32, 449–464. [Google Scholar] [CrossRef]
  13. Gong, Y.; Liu, P.; Cheng, L.; Chen, G.Y.; Zhou, Y.L.; Zhang, X.Q.; Xu, W.F. Determining dynamic water level control boundaries for a multi-reservoir system during flood seasons with considering channel storage. J. Flood Risk Manag. 2020, 13, 17. [Google Scholar] [CrossRef]
  14. Ning, Y.W.; Ding, W.; Liang, G.H.; He, B.; Zhou, H.C. An Analytical Risk Analysis Method for Reservoir Flood Control Operation Considering Forecast Information. Water Resour. Manag. 2021, 35, 2079–2099. [Google Scholar] [CrossRef]
  15. Mu, Z.; Ai, X.; Ding, J.; Huang, K.; Chen, S.; Guo, J.; Dong, Z. Risk Analysis of Dynamic Water Level Setting of Reservoir in Flood Season Based on Multi-index. Water Resour. Manag. 2022, 36, 3067–3086. [Google Scholar] [CrossRef]
  16. Pan, J.B.; Xie, Y.; Liu, M.; Gao, Z.; Gao, Z.Z.; Xue, B.W. Dynamic Control of Water Level in Flood Limited Reservoir Based on Intelligent Calculation. Math. Probl. Eng. 2022, 2022, 10. [Google Scholar] [CrossRef]
  17. Lu, Q.; Zhong, P.; Xu, B.; Huang, X.; Zhu, F.; Wang, H.; Ma, Y. Multi-objective risk analysis for flood control operation of a complex reservoir system under multiple time-space correlated uncertainties. J. Hydrol. 2022, 606, 127419. [Google Scholar] [CrossRef]
  18. Du, H.; Wang, Z.; Yin, J. Analysis of flood control risk in floodwater utilization considering the uncertainty of flood volume and peak. Front. Earth Sci. 2023, 11, 1196903. [Google Scholar] [CrossRef]
  19. Chen, J.; Zhong, P.A.; Zhang, W.G.; Zhu, F.L.; Zhang, Y. Improved Risk-Assessment Model for Real-Time Reservoir Flood-Control Operation. J. Water Resour. Plan. Manag. 2020, 146, 0001174. [Google Scholar] [CrossRef]
  20. Winter, B.; Schneeberger, K.; Huttenlau, M.; Stotter, J. Sources of uncertainty in a probabilistic flood risk model. Nat. Hazards 2018, 91, 431–446. [Google Scholar] [CrossRef]
  21. Peng, Y.; Chen, K.; Yan, H.; Yu, X. Improving Flood-Risk Analysis for Confluence Flooding Control Downstream Using Copula Monte Carlo Method. J. Hydrol. Eng. 2017, 22, 04017018. [Google Scholar] [CrossRef]
  22. Wang, Q.S.; Zhou, J.Z.; Dai, L.; Huang, K.D.; Zha, G. Risk assessment of multireservoir joint flood control system under multiple uncertainties. J. Flood Risk Manag. 2021, 18, e12740. [Google Scholar] [CrossRef]
  23. Barría, P.; Chadwick, C.; Ocampo-Melgar, A.; Galleguillos, M.; Garreaud, R.; Díaz-Vasconcellos, R.; Poblete, D.; Rubio-Álvarez, E.; Poblete-Caballero, D. Water management or megadrought: What caused the Chilean Aculeo Lake drying? Reg. Environ. Change 2021, 21, 19. [Google Scholar] [CrossRef]
  24. Valencia, D.; Schakke, J.C. Disaggregation processes in stochastic hydrology. Water Resour. Res. 1973, 9, 580–585. [Google Scholar]
  25. Chen, J.; Zhong, P.; Zhao, Y.; Xu, B. Risk analysis for the downstream control section in the real-time flood control operation of a reservoir. Stoch. Environ. Res. Risk Assess. 2015, 29, 1303–1315. [Google Scholar] [CrossRef]
  26. Fan, Y.R.; Huang, W.W.; Huang, G.H.; Li, Y.P.; Huang, K.; Li, Z. Hydrologic risk analysis in the Yangtze River basin through coupling Gaussian mixtures into copulas. Adv. Water Resour. 2016, 88, 170–185. [Google Scholar] [CrossRef]
  27. Kang, L.; Jiang, S. Bivariate Frequency Analysis of Hydrological Drought Using a Nonstationary Standardized Streamflow Index in the Yangtze River. J. Hydrol. Eng. 2019, 24, 05018031. [Google Scholar] [CrossRef]
  28. Li, W.; Zhou, J.; Yao, X.; Feng, K.; Luo, C.; Sun, N. Flood Hazard Analysis Based on Copula Connect Function. Nat. Hazards Rev. 2023, 24, 04022041. [Google Scholar] [CrossRef]
  29. Lu, Q.; Zhong, P.-a.; Xu, B.; Zhu, F.; Ma, Y.; Wang, H.; Xu, S. Risk analysis for reservoir flood control operation considering two-dimensional uncertainties based on Bayesian network. J. Hydrol. 2020, 589, 125353. [Google Scholar] [CrossRef]
  30. Dai, L.; Zhou, J.; Chen, L.; Huang, K.; Wang, Q.; Zha, G. Flood-risk analysis based on a stochastic differential equation method. J. Flood Risk Manag. 2019, 12, e12515. [Google Scholar] [CrossRef]
  31. Chen, G.; Lin, H.; Hu, H.; Yan, Y.; Wan, Y.; Xiao, T.; Peng, Y. Research on the Measurement of Ship’s Tank Capacity Based on the Monte Carlo Method. Chem. Technol. Fuels Oils 2022, 58, 232–236. [Google Scholar] [CrossRef]
  32. Kang, L.; He, X. Risk analysis of rich–poor rainfall encounter in inter-basin water transfer projects based on Bayesian networks. Water Supply 2011, 11, 451–459. [Google Scholar] [CrossRef]
  33. Chang, J.; Guo, A.; Du, H.; Wang, Y. Floodwater utilization for cascade reservoirs based on dynamic control of seasonal flood control limit levels. Environ. Earth Sci. 2017, 76, 260. [Google Scholar] [CrossRef]
  34. Yang, Z.; Huang, X.; Liu, J.; Fang, G. Optimal Operation of Floodwater Resources Utilization of Lakes in South-to-North Water Transfer Eastern Route Project. Sustainability 2021, 13, 4857. [Google Scholar] [CrossRef]
  35. Wang, K.; Wang, Z.; Xu, J.; Mo, Y.; Cheng, L.; Bai, Y.; Du, H.; Liu, K. Floodwater utilization potential assessment of China based on improved conceptual model and multi-reservoir basin assessment method. J. Hydrol. 2023, 625, 129921. [Google Scholar] [CrossRef]
  36. Li, X.; Guo, S.; Liu, P.; Chen, G. Dynamic control of flood limited water level for reservoir operation by considering inflow uncertainty. J. Hydrol. 2010, 391, 124–132. [Google Scholar] [CrossRef]
  37. Ye, A.; Wang, Z.; Zhang, L.; Wang, L.; Wang, K. Assessment approach to the floodwater utilization potential of a basin and an empirical analysis from China. Environ. Earth Sci. 2019, 78, 52. [Google Scholar] [CrossRef]
  38. Xie, A.; Liu, P.; Guo, S.; Zhang, X.; Jiang, H.; Yang, G. Optimal Design of Seasonal Flood Limited Water Levels by Jointing Operation of the Reservoir and Floodplains. Water Resour. Manag. 2018, 32, 179–193. [Google Scholar] [CrossRef]
  39. Lu, Q.; Zhong, P.-a.; Xu, B.; Zhu, F.; Huang, X.; Wang, H.; Ma, Y. Stochastic programming for floodwater utilization of a complex multi-reservoir system considering risk constraints. J. Hydrol. 2021, 599, 126388. [Google Scholar] [CrossRef]
  40. Wang, K.; Wang, Z.; Liu, K.; Du, H.; Mo, Y.; Wang, M.; Jin, G.; Li, L. Assessing the floodwater utilization potential in a reservoir-controlled watershed: A novel method considering engineering regulations and an empirical case from China. Ecol. Inform. 2022, 68, 101581. [Google Scholar] [CrossRef]
Figure 1. Schematic illustration detailing the calculation of the RCWL.
Water 16 00043 g001
Figure 2. The geographical location relationship between the Danjiangkou reservoir and Huangzhuang station.
Water 16 00043 g002
Figure 3. Box plots of the statistics for simulated daily inflow. (a) The mean; (b) the coefficient of variation; (c) the daily lag-1 autocorrelation.
Water 16 00043 g003
Figure 4. Box plots of the probability density functions of simulated FVs in different time periods. (a) FV1; (b) FV3; (c) FV7; (d) FV15.
Water 16 00043 g004
Figure 5. Contour plot of joint distribution probabilities between reservoir flood volume and interval flood volume.
Water 16 00043 g005
Figure 6. Statistics for the highest water level values under various relative errors. (a) The mean; (b) the maximum.
Water 16 00043 g006
Figure 7. Diagrams reflecting the RCWLs for various flood return periods. (a) The summer wet season; (b) the autumn wet season.
Water 16 00043 g007
Figure 8. Flood risk control maps of the Danjiangkou reservoir. (a) Summer wet season; (b) autumn wet season.
Water 16 00043 g008
Figure 9. The changes in the HWL, ASC, and SCT values before and after the FLWL was raised. (a) The HWL values; (b) the ASC values; (c) the SCT values.
Water 16 00043 g009
Figure 10. The changes in risk ratio under various FLWLs and flood return periods. (a) Summer wet season; (b) Autumn wet season.
Water 16 00043 g010
Disclaimer/Publisher’s Note: The statements, opinions and data contained in all publications are solely those of the individual author(s) and contributor(s) and not of MDPI and/or the editor(s). MDPI and/or the editor(s) disclaim responsibility for any injury to people or property resulting from any ideas, methods, instructions or products referred to in the content.

