Article

Does Marsh Restoration Have an Impact on Dew?

Key Laboratory of Songliao Aquatic Environment, Ministry of Education, Jilin Jianzhu University, No. 5088 Xin Cheng Road, Changchun 130118, China
*
Author to whom correspondence should be addressed.
Water 2024, 16(1), 178; https://doi.org/10.3390/w16010178
Submission received: 10 October 2023 / Revised: 18 December 2023 / Accepted: 31 December 2023 / Published: 3 January 2024
(This article belongs to the Section Biodiversity and Functionality of Aquatic Ecosystems)

Abstract

:
As an ecological factor of wetland ecosystems, dew condenses frequently and in large amounts. In the process of marsh wetland restoration, the differences in water depth and plant types in different restoration years may affect dew condensation and evaporation. In this study, by monitoring dew in natural marshes, unrestored marshes (farmlands), and marshes restored 15, 10, and 5 years ago in the plant growth period of 2022 in the Sanjiang Plain, China, it was found that the “cold and wet effect” of marshes was conducive to dew condensation and could prolong the evaporation time of dew. In the process of marsh restoration, the number of dew days increased from 106 days (farmland) to 122 days (15-year marsh restoration), and the duration increased from 791.1 ± 90.3 min (farmland) to 869.4 ± 100.5 min (15-year marsh restoration). The dew intensity increased from 0.06 ± 0.02 mm (farmland) to 0.13 ± 0.04 mm (15-year marsh restoration), and the annual dew amount increased from 35.10 mm/y (farmland) to 44.86 mm/y (15-year marsh restoration). The number of dew days and the duration were similar to those of natural marshes after 15 years of restoration. SO42−, Ca2+, NH4+ and NO3 were the main ions of dew in marsh in each restoration year and farmland. There was no significant difference in the ion concentration (Ca2+, Mg2+, Na+, K+, NH4+, F, Cl, NO2, and SO42−) of natural marsh dew compared with that 15 years after restoration (p > 0.05), except for NO3. The marsh restored after 15 years had basically restored the characteristics of natural marsh in terms of the quality and quantity of dew. This study showed that marsh restoration increased dew, and dew was a good indicator of the restoration effect of marshes.

1. Introduction

Wetlands play an important role in water conservation, water purification, climate regulation, carbon storage, and biodiversity maintenance [1]. Marsh is the most important type of wetland, and the Northeast Plain is one of the three concentrated distribution areas of natural marshes in China, with the existing marsh area accounting for 10.91% of the country. Unlike other natural wetlands (peatlands, lakes, rivers, and coastal wetlands), marshes are characterized by low-lying water on the surface and are dominated by herbaceous vegetation. The marsh area of the Northeast Plain was reduced by nearly 60% in less than 40 years through large-scale reclamation after the founding of the People’s Republic of China (1949) [2]. By the end of 2022, the wetland area in China exceeded 850,000 km2, ranking first in Asia and fourth in the world [3]. The National Wetland Protection Plan (2022–2030) issued in October 2022 proposes that by 2025, the national wetland protection rate, which refers to the proportion of wetland area protected by national parks, nature reserves, wetland parks, and other forms to the total wetland area, will reach 55%.
Dew is an important ecological factor of wetland ecosystems, and condensation is frequent and occurs in considerable amounts [2]. Dew is easily absorbed by plant leaves to improve water utilization [4] and alleviate the negative effects of insufficient rainfall on plants in the dry season [5,6]. Dew can also decrease the plant transpiration rate and increase plant survival [7]. In addition, dew can increase leaf surface stomatal conductance to improve the photosynthetic rate of plants and increase the total biomass [8,9]. Dew absorption is a strategy for plant growth, so the presence or amount of dew can affect plant growth and distribution to counter the drying trend of climate change [10,11]. As an important method of wet deposition, dew can effectively remove pollutants from the atmosphere during condensation, and its ionic component is significantly higher than that of rainwater [12,13,14]. The ion concentration and component ratio of dew are closely related to the environment. The ion concentration of dew is high in polluted cities and coastal areas but low in inland areas. Most dew is dominated by SO42− and Ca2+. The NO3, NH4+, K+, Ca2+, and Mg2+ in dew can provide nutrients for plant leaves [15]. Therefore, dew is an essential input affecting the water balance and nutrient circulation in wetland systems. The quantitative determination of the water quantity and quality characteristics of dew in wetland ecosystems is of great importance to ecology and wetland water resource utilization.
Since China joined the “Convention on Wetlands” in 1992, the area of restored wetlands has been continuously expanded, and the implementation of protection and restoration projects such as returning farmland to wetlands, returning fishing to wetlands, and replenishing wetlands has greatly changed the hydrological conditions, climate factors, and plant types of the original cultivated land/wasteland. In the process of marsh restoration, the vegetation community succession of marshes with different times since restoration appeared obvious. For example, the dominant species of marshes restored for 5 years was xerophytes, while marshes restored 12 years ago were gradually dominated by wetland plants [16]. The condensation and evaporation processes of dew are closely related to the meteorological conditions near the surface and the types of underlying surfaces [17]. The differences in water depth and plant types in wetlands with different years since restoration will affect the mechanisms of dew condensation and evaporation. However, at present, in the process of wetland restoration, the frequency of dew occurrence, condensation amount, and evaporation process of wetlands in different years since restoration are poorly understood.
Dew plays a unique role in the water balance, material circulation, and community succession in wetland ecosystems. This study focused on the dew condensation and evaporation process of marshes in different years since restoration, aiming to reveal the amount and quality of dew condensation in the process of marsh restoration and to evaluate whether the restored marsh can reproduce the water balance and material circulation characteristics before degradation. This study reveals the degree of local climate change and the utilization of dew as a “water resource” in the process of marsh restoration, and it further deepens the understanding of the impact of marsh restoration on the regional water cycle and ecological environment.

2. Materials and Methods

2.1. Monitoring Site

The monitoring sites were set up on the Sanjiang Plain, east of Heilongjiang Province, Northeast China. This area was a natural marsh wetland in the 1950s and has undergone a large-scale wetland reclamation process. Farmland (mainly corn and soybean) has become the main landscape type. In 2008, the policy of returning farmland to marsh in low-lying areas began, and some farmland areas were to be restored to marsh. In this study, natural marshes; farmland restored 5, 10, and 15 years ago; and unrestored farmland were selected as monitoring sites. The starting point of restoration was the time when no agricultural activities were carried out.
The monitoring sites belong to the temperate humid and semihumid continental monsoon climate (Figure 1). The four seasons vary significantly, the freezing period is long, and the precipitation is concentrated. The mean annual air temperature is 2.2 °C, the frost-free period is 155–170 days, and the average annual total sunshine is 2304.3 h. The annual average precipitation is 603.8 mm, and the distribution of rainfall is uneven, mainly concentrated between June and September. The June-to-September precipitation accounts for 71.40% of the annual precipitation. The monitoring area is located in the westerlies with significant seasonal changes in wind direction and an annual average wind speed of 3.6 m/s [18]. This study was mainly carried out during the growing period of plants, from April 20 to October 20 (summer and autumn).

2.2. Typical Plants

The typical plants of each monitoring site are given in Table 1. The typical plant species of the natural marsh was Carex lasiocarpa. Carex lasiocarpa was the characteristic plant species in the natural marsh, accounting for approximately 57% of the plant cover. The surface layer of Carex lasiocarpa has a permanent waterlogged condition year-round. The water depth was generally 15~35 cm, and the deepest water depth reached 50~80 cm. The surface water was generally acidic, and the pH was 5.0~6.5. The plant height was generally 30~80 cm, and the community coverage was 50~80% [19]. The common dominant plants of the marsh restored for 15 years were mixed stands of Carex angustifolia and Carex lasiocarpa, and the main associated species were Caltha palustris, Lythrum salicaria, and Lysimachia thyrsiflora. The total plant cover was 70–80%, and the average height was 50–80 cm. The typical plants in the marsh restored for 10 years were Carex angustifolia, and the main associated species were Stachys baicalensis, Phragmites australis, Lythrum salicaria, and Lysimachia thyrsiflora. The total plant cover was 90–95%, and the average height was 80–110 cm. The typical plant species of the marsh restored 5 years ago was Artemisia latifolia, and the main associated species were Phragmites australis and Typha orientalis. The total plant cover was 65–80%, and the average height was 20–70 cm.

2.3. Dew Monitoring Method

The dew condensation–evaporation time node, dew intensity, and leaf area index (LAI) of each monitoring site were monitored daily during the experimental period. LAI was measured daily using an LAI-2200C Plant Canopy Analyzer (LICOR, Lincoln, NE, USA). A leaf wetness sensor (METER Environment, Pullman, WA, USA) was used to determine the time node of dew condensation and evaporation. A leaf surface humidity sensor was placed in the plant canopy (5–10 cm below the top of the plant) half an hour after sunset at each monitoring site. The time node at half an hour after sunset (T0) was recorded in addition to when the sensor value reached the maximum value (T1) and the value was stable after sunrise (T2). T1 usually appeared half an hour before sunrise. The corresponding T2-T0 period was defined as the dew duration period. A poplar stick with dimensions of 18 cm × 3.5 cm × 3.5 cm (length × width × height) was used as the dew monitor. Three poplar sticks were placed in the plant canopy (5–10 cm below the top of the plant), and the poplar wood sticks were accurately weighed with an electronic balance (accuracy within 0.001 g) at half an hour after sunset (W0) and T1 (W1).
The daily dew intensity was calculated with the following formula:
I = (W1W0) × 10/S
The total dew amount was calculated with the following formula:
D F = n = 1 D d 2 × L A I × I ,
I is the daily dew intensity (mm), which is the amount of dew per unit area. W0 is the weight of the wood stick after sunset (g), W1 is the weight of the wood stick before sunrise (g), S is the surface area (cm2) of the wood stick, 10 is the conversion factor, DF is the dew amount in a particular period (month or year) (mm), Dd is the number of dew days in a particular period (month or year) (days), 2 is a coefficient to account for both sides of the leaf, and LAI is the leaf area index (cm2/cm2) [20].
The meteorological factors, including relative humidity (RH, %), air temperature (T, °C), wind speed (V, m/s) near the surface, and rainfall (mm), were measured at hourly intervals during the dew condensation and evaporation period by a MILOS 520 automatic weather station (VAISALA, Helsinki, Finland) at each plot.

2.4. Sample Collection and Analysis

Rain and surface water were all collected in precleaned PTFE bottles with a 250 mL capacity. Dew was directly collected on plant leaves with a needle tube. The dew was collected at the end of the dew condensation period when the dew was heavy. Surface water was collected at the same time as the dew collection. Rain samples were collected each time. There were 17, 15, 14, 11, and 13 dew samples from natural marshes; marshes restored 15, 10, and 5 years ago; and farmlands, respectively, during the experimental period.
All collected samples were analyzed to determine pH (LA-pH 10, Loveland, CO, USA), electrical conductivity (EC), and total dissolved solids (TDS) (LA-EC20, Loveland, CO, USA) immediately. All dew, surface water, and rainwater samples were filtered through 0.45 μm membrane filters and stored at approximately 4 °C for further chemical analysis. Major cations (Ca2+, Mg2+, Na+, K+, and NH4+) and anions (F, Cl, NO3, NO2, and SO42−) were analyzed with an ion chromatograph (Shimadzu LC-20AD, Kyoto, Japan). A Shim-pack IC-A3 column with 8.0 mmol phydroxybenzoic acid (PHBA), 3.2 mmol Bis-Tris, and 50 mmol boric acid as the eluent and a 1.5 mL/min flow rate was used to analyze 50 μL of each sample for anions. A Shim-pack IC-C1 column with 5 mmol HNO3 as the eluent and a 1.3 mL/min flow rate was used to analyze 20 μL of each sample for cations [21].

3. Results and Discussion

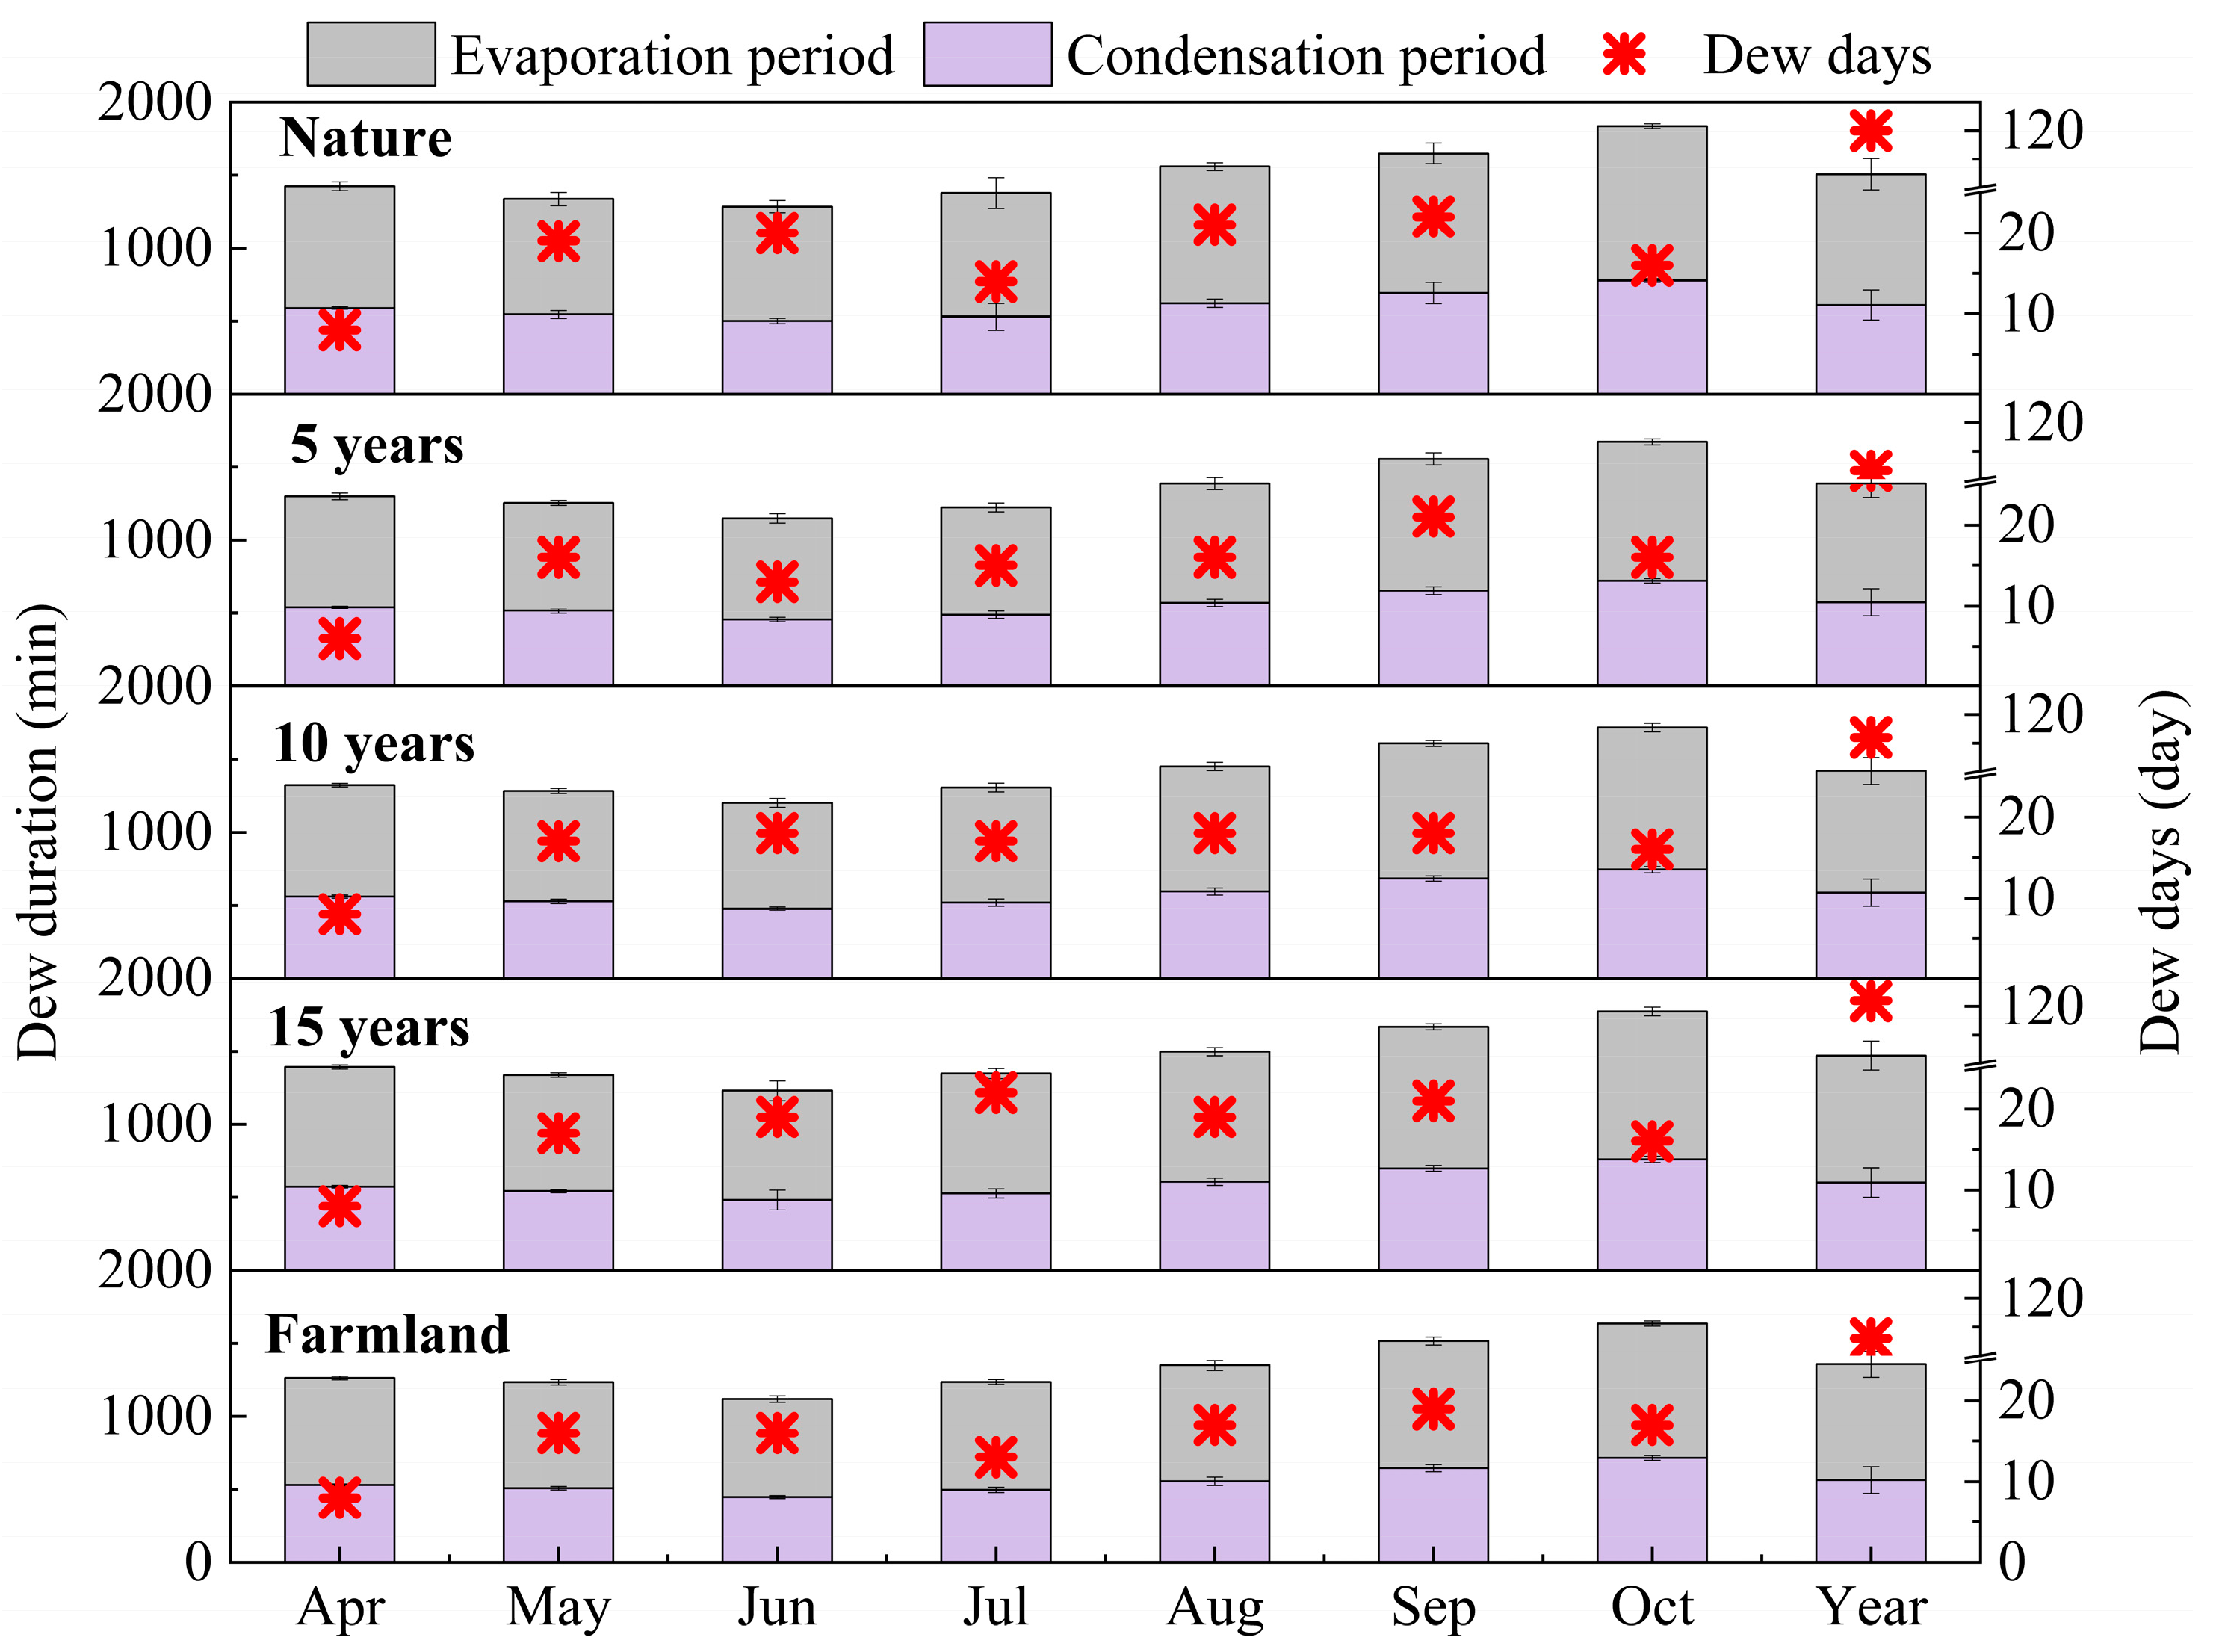
3.1. Dew Frequency and Duration

The natural marsh; the marsh restored 5, 10, and 15 years ago; and the nonrestored marsh (farmland) had dew days of 120 days, 122 days, 112 days, 103 days, and 106 days, respectively (Figure 2). The number of days with dew was highest in natural marshes and marshes restored for 15 years, accounting for 65–66% of the experimental period. All the monitoring sites had the most dew days in September. The frequency of dew condensation increased during the succession after the restoration, and the dew days in the marsh after 15 years of restoration were basically the same as those in the natural marsh. The number of dew days in the study area was generally lower than that at other sites (Table 2) and higher only than those at Duolun (82~116 days), Baiyin (81 days), and Zhangye (69 days) in China. This was due to the short frost-free period (only 6 months) in the study area and the frequent occurrence of rain events in summer and autumn during the concentrated dew condensation period.
The dew condensation periods in the natural marsh; marsh restored 15, 10, and 5 years ago; and farmland were 611.8 ± 104.5 min, 601.2 ± 100.7 min, 587.9 ± 93.0 min, 575.8 ± 93.6 min, and 564.0 ± 91.4 min, respectively (Figure 2). At each site, the condensation period was the shortest in June, followed by July, May, April, August, September, and October. This is because the dew condensation period is closely related to the sunset and sunrise times [7], and it is not related to the dew intensity or relative humidity (RH) during condensation (p > 0.05). According to our observations, dew began to condense 10 min after sunset and turned to evaporation 10 min after sunrise in the natural marsh. The condensation period in natural marshes was approximately 10 min, 24 min, 35 min, and 48 min longer than that in marshes restored 15, 10, and 5 years ago and farmland, respectively. There was no significant difference in the dew condensation period between natural marsh and 15-year restored marsh (p > 0.05), and the value was significantly higher than that in 5-year restored marsh and farmland (p < 0.01).
The dew evaporation periods in the natural marsh; the marsh restored 15, 10, and 5 years ago; and the farmland were 276.5 ± 41.2 min, 269.3 ± 23.6 min, 241.9 ± 27.7 min, 236.8 ± 23.7 min, and 221.4 ± 18.2 min, respectively (Figure 2). At each site, the dew evaporation period was longest in July, followed by August, June, October, September, May, and April. This is because the evaporation period is positively correlated with the RH during evaporation and negatively correlated with the wind speed (p < 0.01), which is the same as the rule of dew evaporation in urban ecosystems [22]. Sufficient precipitation and higher RH led to longer dew evaporation periods in July and August. The dew evaporation period of the natural marsh was significantly higher than that of the other monitoring sites (p < 0.01), indicating that the meteorological conditions of the natural marsh were conducive to the occurrence of dew during the evaporation period (10 min~4.5 h after sunrise).
Wetlands affect near-surface atmospheric conditions. The air temperature decreases rapidly after sunset, and water vapor easily condenses. After sunrise, the marsh still maintains a lower temperature and higher humidity, which leads to dew evaporating more slowly than that in farmland. The total dew duration in the natural marsh (893.3 ± 106.1 min) was the longest among the monitoring sites. There was no significant difference in dew duration in marsh restored 15 years ago (869.4 ± 100.5 min) (p > 0.05). These results indicated that the water vapor circulation characteristics in the 15-year restored marsh returned to the level of the natural marsh. The dew durations of the 10-year and 5-year restored marsh and farmland were 831.9 ± 93.2 min, 811.9 ± 95.6 min, and 791.1 ± 90.3 min, respectively, with no significant difference (p > 0.05), and these values were significantly lower than those of the natural marsh and 15-year restored marsh (p < 0.01). The results indicated that the restoration of marsh could effectively increase the dew duration period, but the dew condensation and evaporation characteristics of marsh restored for less than 10 years still did not achieve the level of the natural marsh. The dew duration in the study area was longer than that in other areas and only shorter than that in the Tengger Desert (20 h) (Table 2). This is because the climatic conditions in the study area were more suitable for dew condensation. Moreover, the dew duration with plants on the underlying surface is generally longer than that in desert areas without plant growth (3~4 h) [17]. In addition, the study area is located further north and the night is longer, which is also an important factor affecting the long dew duration.

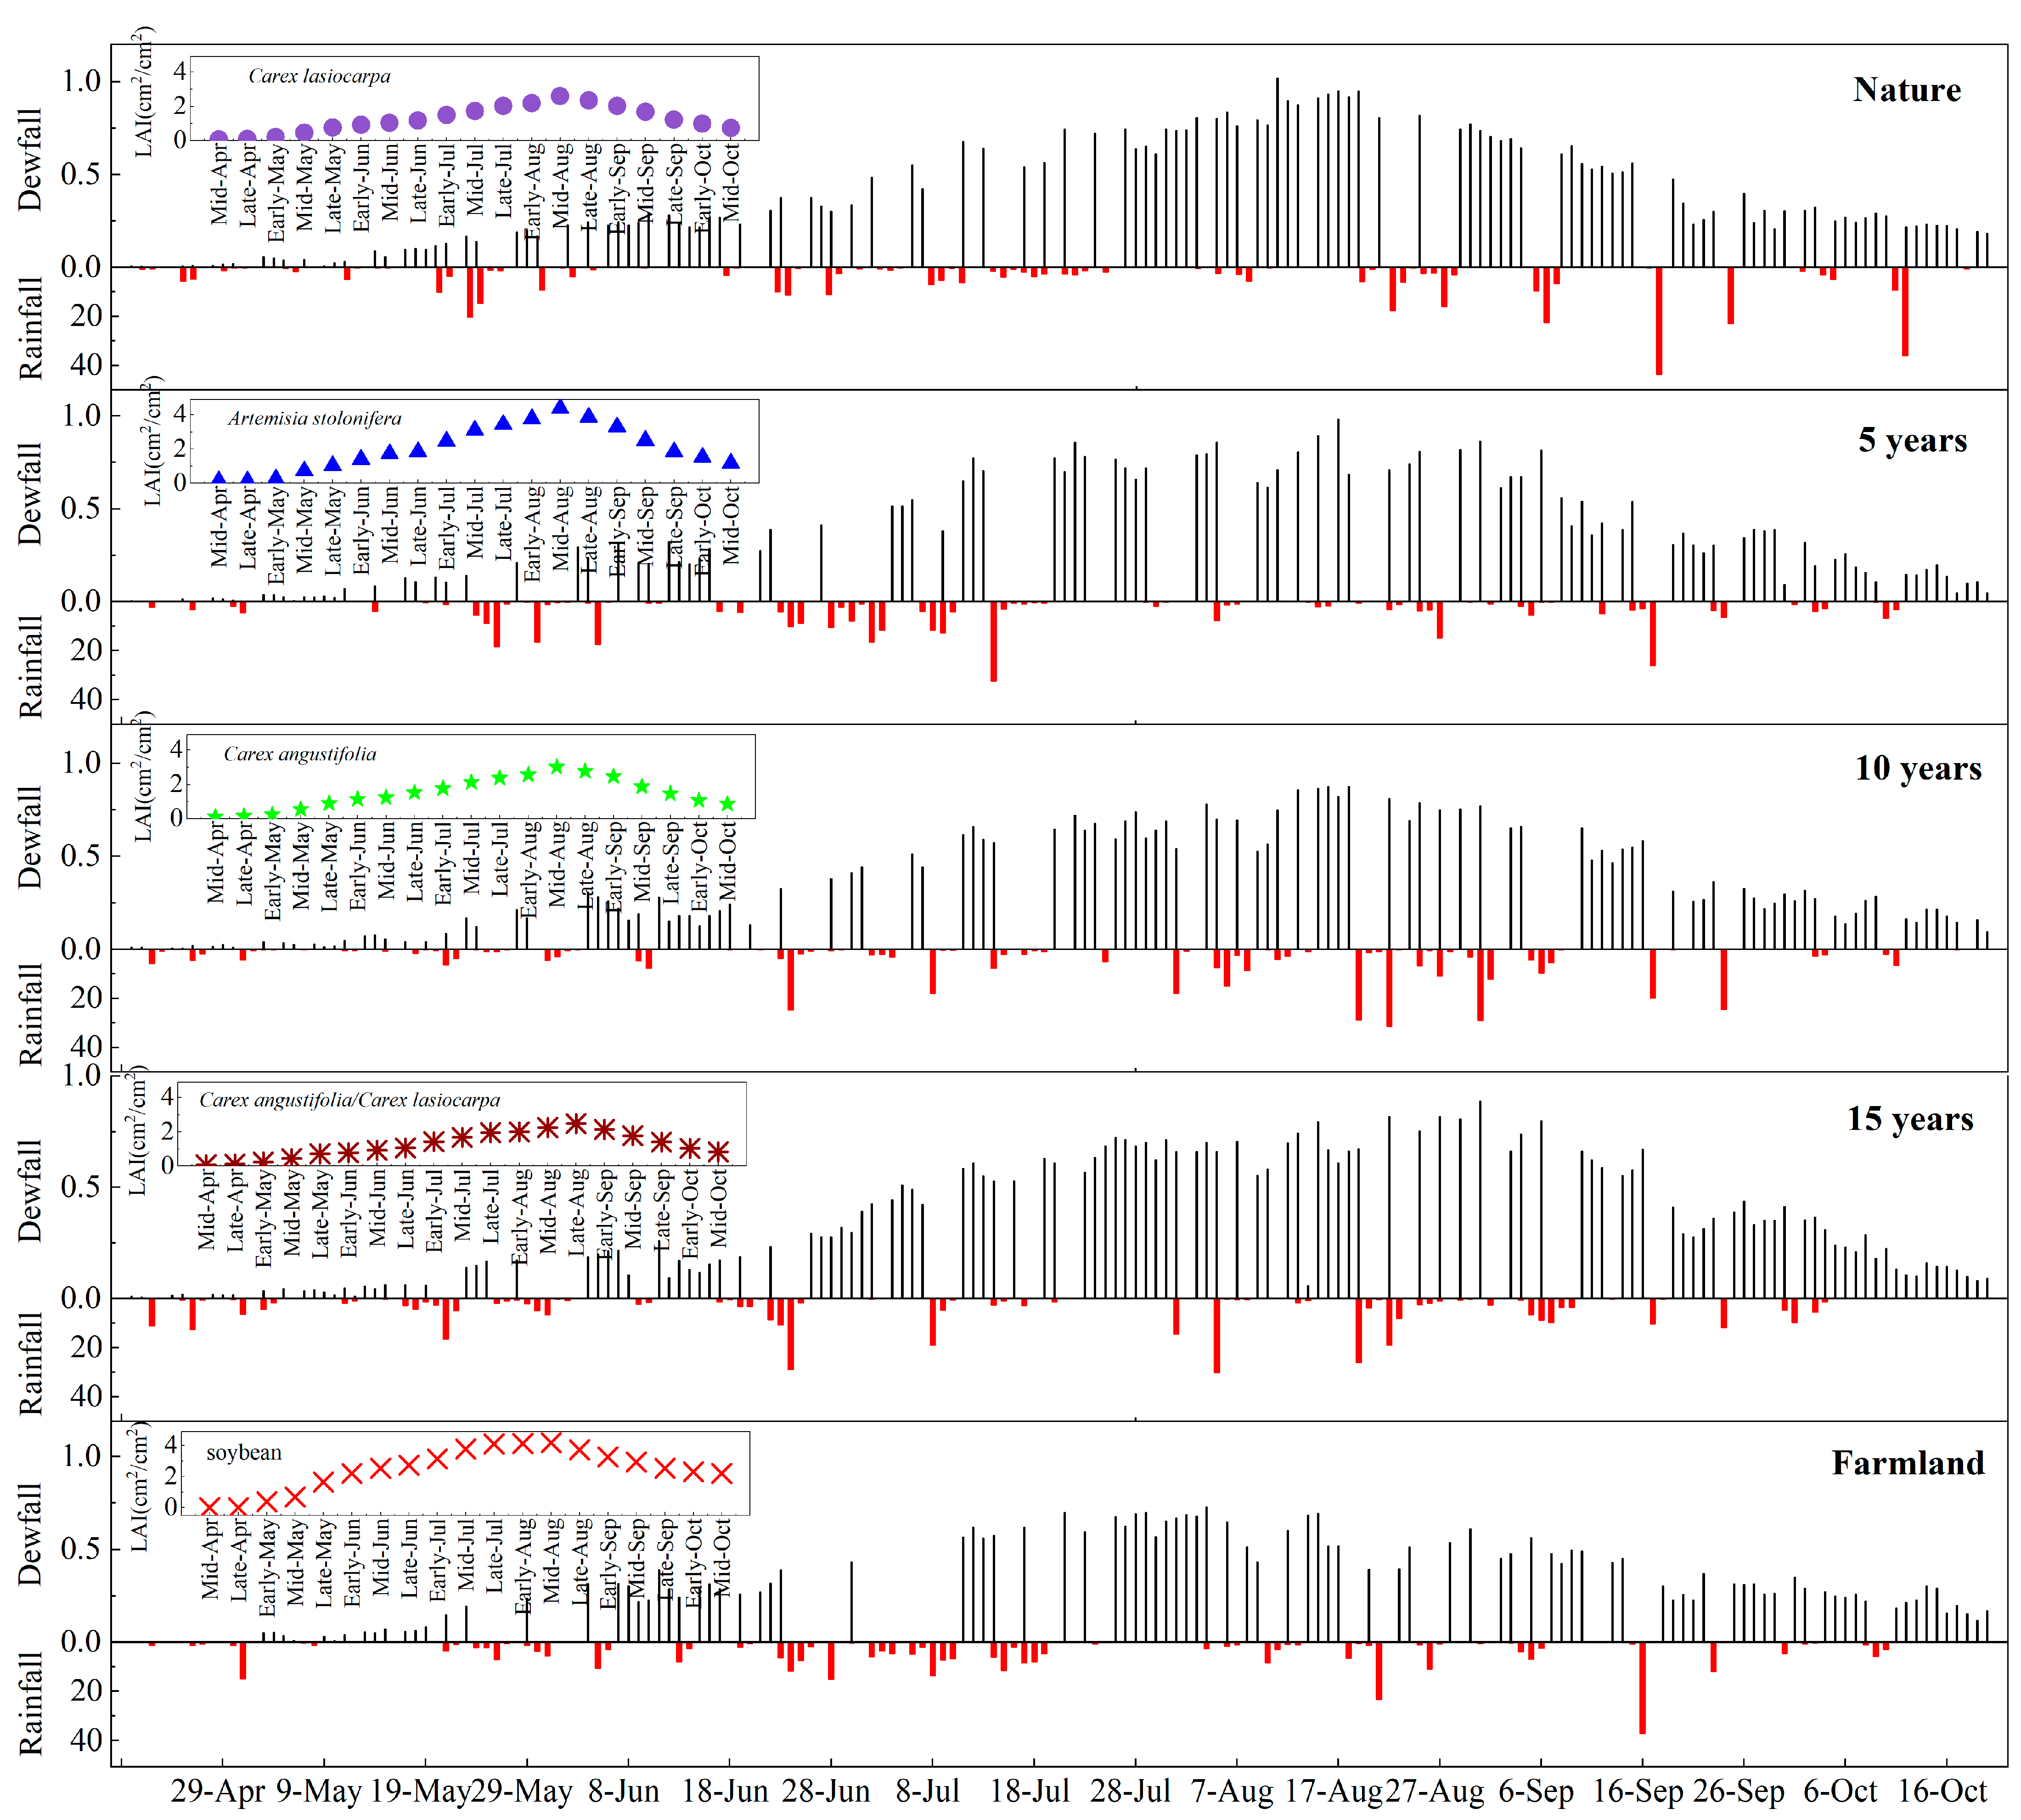
3.2. Dew intensity and Amount

The average dew intensity of farmland was 0.06 ± 0.02 mm, and the dew intensity increased significantly during marsh restoration (Figure 3). The dew intensities in the natural marsh and the marshes restored 5 years, 10 years, and 15 years ago were 0.08 ± 0.03 mm, 0.10 ± 0.04 mm, and 0.13 ± 0.04 mm, respectively, which were significantly higher than those of farmland (p < 0.01). There was no significant difference in dew intensity between the marsh restored 15 years ago and the natural marsh (0.14 ± 0.04 mm) (p > 0.05). The dew intensity peaked in July and August, and it was the lowest in April at each monitoring site. Dew intensity was positively correlated with RH and T in the condensation stage (p < 0.01) and negatively correlated with wind speed (p < 0.01). In the natural marsh; marshes restored 5 years, 10 years, and 15 years ago; and farmland, the average RH during the condensation stage was 76.87 ± 13.90%, 72.20 ± 15.22%, 69.68 ± 17.79%, 67.35 ± 17.28%, and 65.89 ± 17.68%, respectively, and the mean air temperature was 14.30 ± 5.56 °C. 14.80 ± 6.62 °C, 15.14 ± 6.10 °C, 15.48 ± 6.62 °C, and 15.50 ± 6.19 °C, respectively. The average wind speeds were 2.32 ± 1.41 m/s, 2.30 ± 0.95 m/s, 2.12 ± 1.11 m/s, 1.82 ± 0.97 m/s, and 2.40 ± 1.10 m/s, respectively. There was no significant difference in wind speed (p > 0.05) among the sites, the RH of natural marshes was significantly higher than that of restored marshes and farmland (p < 0.01), and the mean air temperature was significantly lower than that of restored marshes and farmland (p < 0.01), indicating the “cold and wet effect” of wetlands. The higher RH and lower temperature of natural marshes also make it easier for water vapor to condense. The difference in meteorological factors among natural marsh, restored marsh, and farmland is mainly due to changes in habitat, such as there being no seeper on the surface of farmland, seasonal seeper in marsh restored 5 years ago, and perennial seeper all year round in natural marsh. The difference in habitats leads to differences in dominant populations [16], which also causes differences in total plant cover, plant height, transpiration rate, etc. (Table 1). The surface environment and plant type are the main reasons for the differences in meteorological factors among natural marshes and restored marshes.
In our study area, for farmland, dew can form under wind speeds ranging from 0.48 m/s to 5.56 m/s and RH ranging from 44.5% to 93.8%. For the marshes, the conditions varied as the wind speeds ranged from 0.17 m/s to 6.40 m/s, and the RH ranged from 42.2% to 95.6%. In the process of marsh restoration, the threshold of meteorological conditions for dew condensation increases. Compared with other sites, the meteorological threshold of dew condensation in the marsh was relatively broad (Table 3). For example, in Inner Mongolia and the Loess Plateau, dew condenses only when the RH is higher than 80%. In the Qinghai–Tibet Plateau, Mizhi, and other places, there is no dew when the wind speeds exceed 2.0 m/s. In our study area, water vapor condensation occurs at both lower RH and higher wind speed, which may also be due to the accumulation of water on the wetland surface and the high plant density, which can provide abundant water vapor and weaken the disturbance of the near-surface air layer by higher wind speed.
The annual dew amount changed markedly during succession after marsh restoration. The dew amount of the natural marsh was 47.96 mm/y, and it was 44.86 mm/y, 40.46 mm/y, and 38.39 mm/y in the marshes restored 15, 10, and 5 years ago, respectively. The dew amount in farmland was the lowest, at 35.10 mm/y. Plant growth had a positive effect on dew condensation. Taking the natural marsh as an example, the dew intensities were 0.07 ± 0.03 mm, 0.10 ± 0.03 mm, 0.13 ± 0.02 mm, 0.17 ± 0.02 mm, 0.18 ± 0.01 mm, 0.14 ± 0.03 mm, and 0.14 ± 0.01 mm in April, May, June, July, August, September, and October, respectively. The dew amounts were 0.09 mm, 1.82 mm, 5.47 mm, 8.75 mm, 17.59 mm, 10.29 mm, and 3.95 mm in April, May, June, July, August, September, and October, respectively (Figure 4). The dew intensity and amount in August were significantly higher than those in other months (p < 0.01). The dew amount was closely related to the plant LAI, and its change trend was basically the same as that of the LAI, generally reaching its peak in August, which is the peak period of plant growth.
Dew is an important input to marsh and farmland. Taking natural marsh as an example, the annual dew amount accounted for 11.93% of the rainfall in the plant growing period, and the dew amount in August (17.59 mm) accounted for 23.36% of the rainfall in August. As shown in Table 2, there was no significant difference in dew intensity between the study area and the desert area. This shows that there is no difference in the daily dew condensation per unit area. After considering the LAI, the dew amount in the underlying surface with plants was significantly higher than that of the sandy land. In particular, the dew amount in the marsh was considerable, lower only than that in the Efoetsty area (58.4 mm), and the annual dew input in the study area was equivalent to a heavy rain level. This is mainly due to the dense vegetation in the study area. However, dew was a more important water resource in deserts such as the Badain Jaran Desert (16.7%) and Taklimakan Desert (64%), with a high proportion of rainfall during the same period.

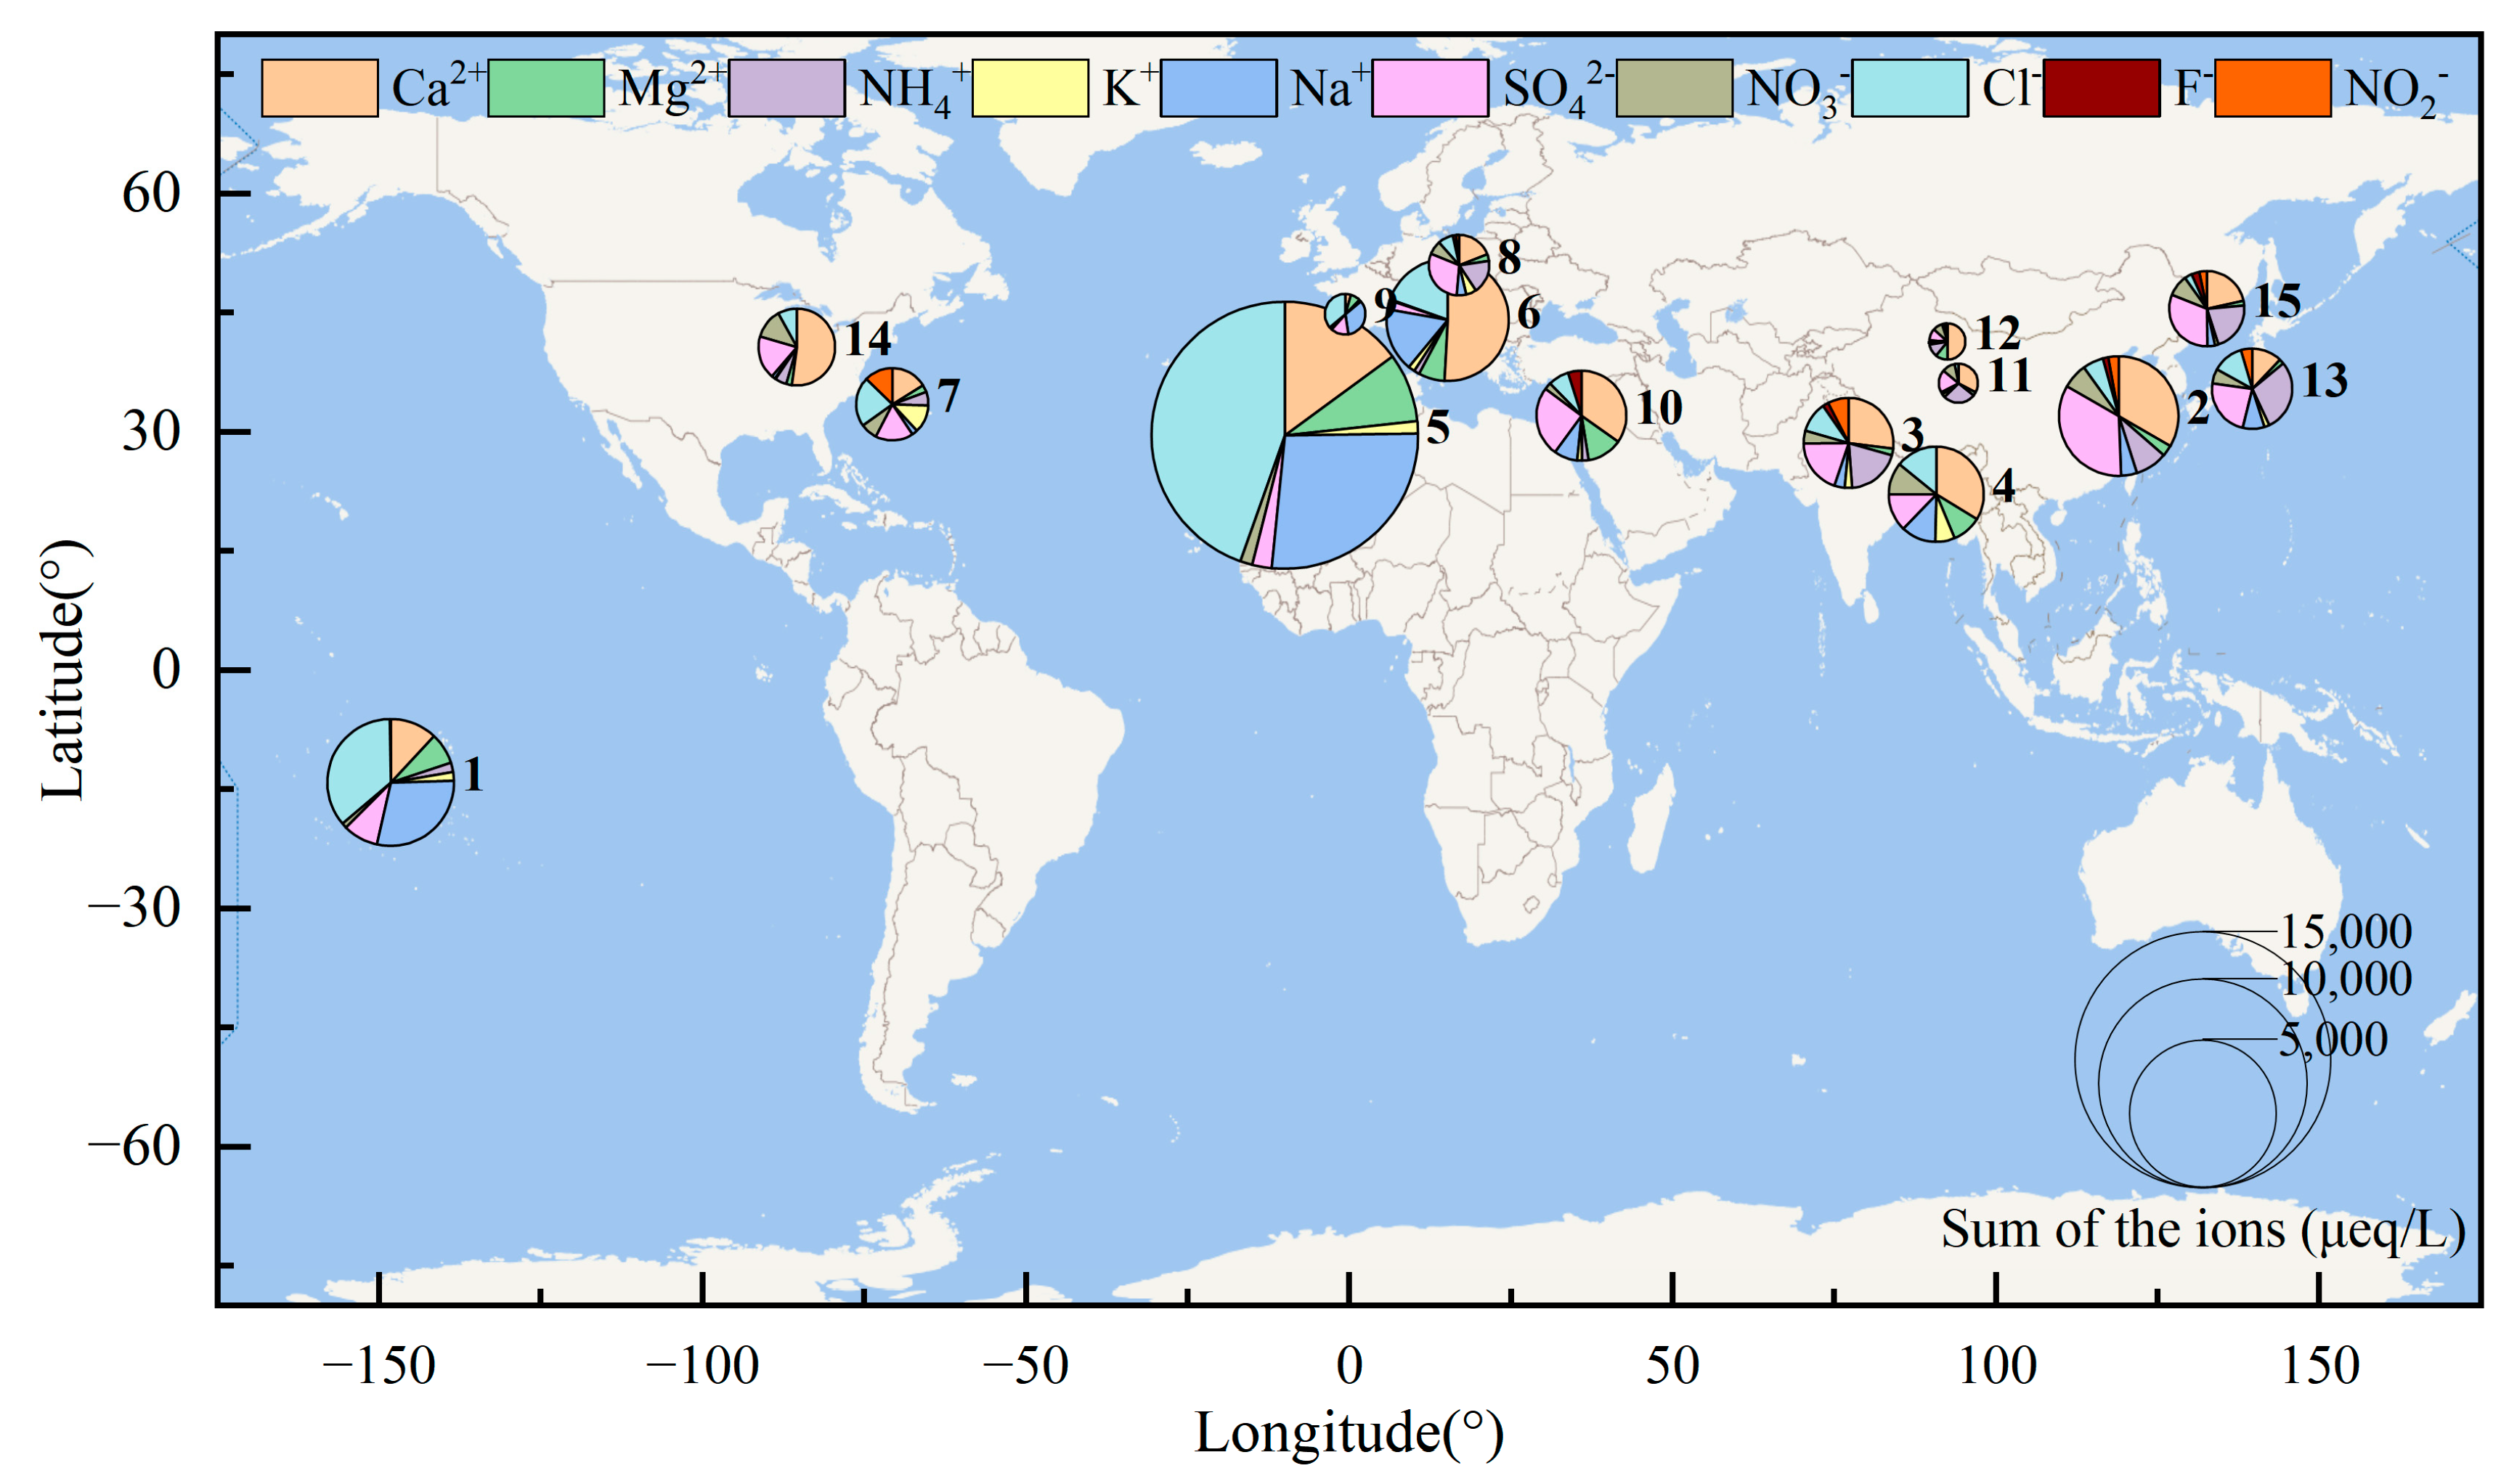
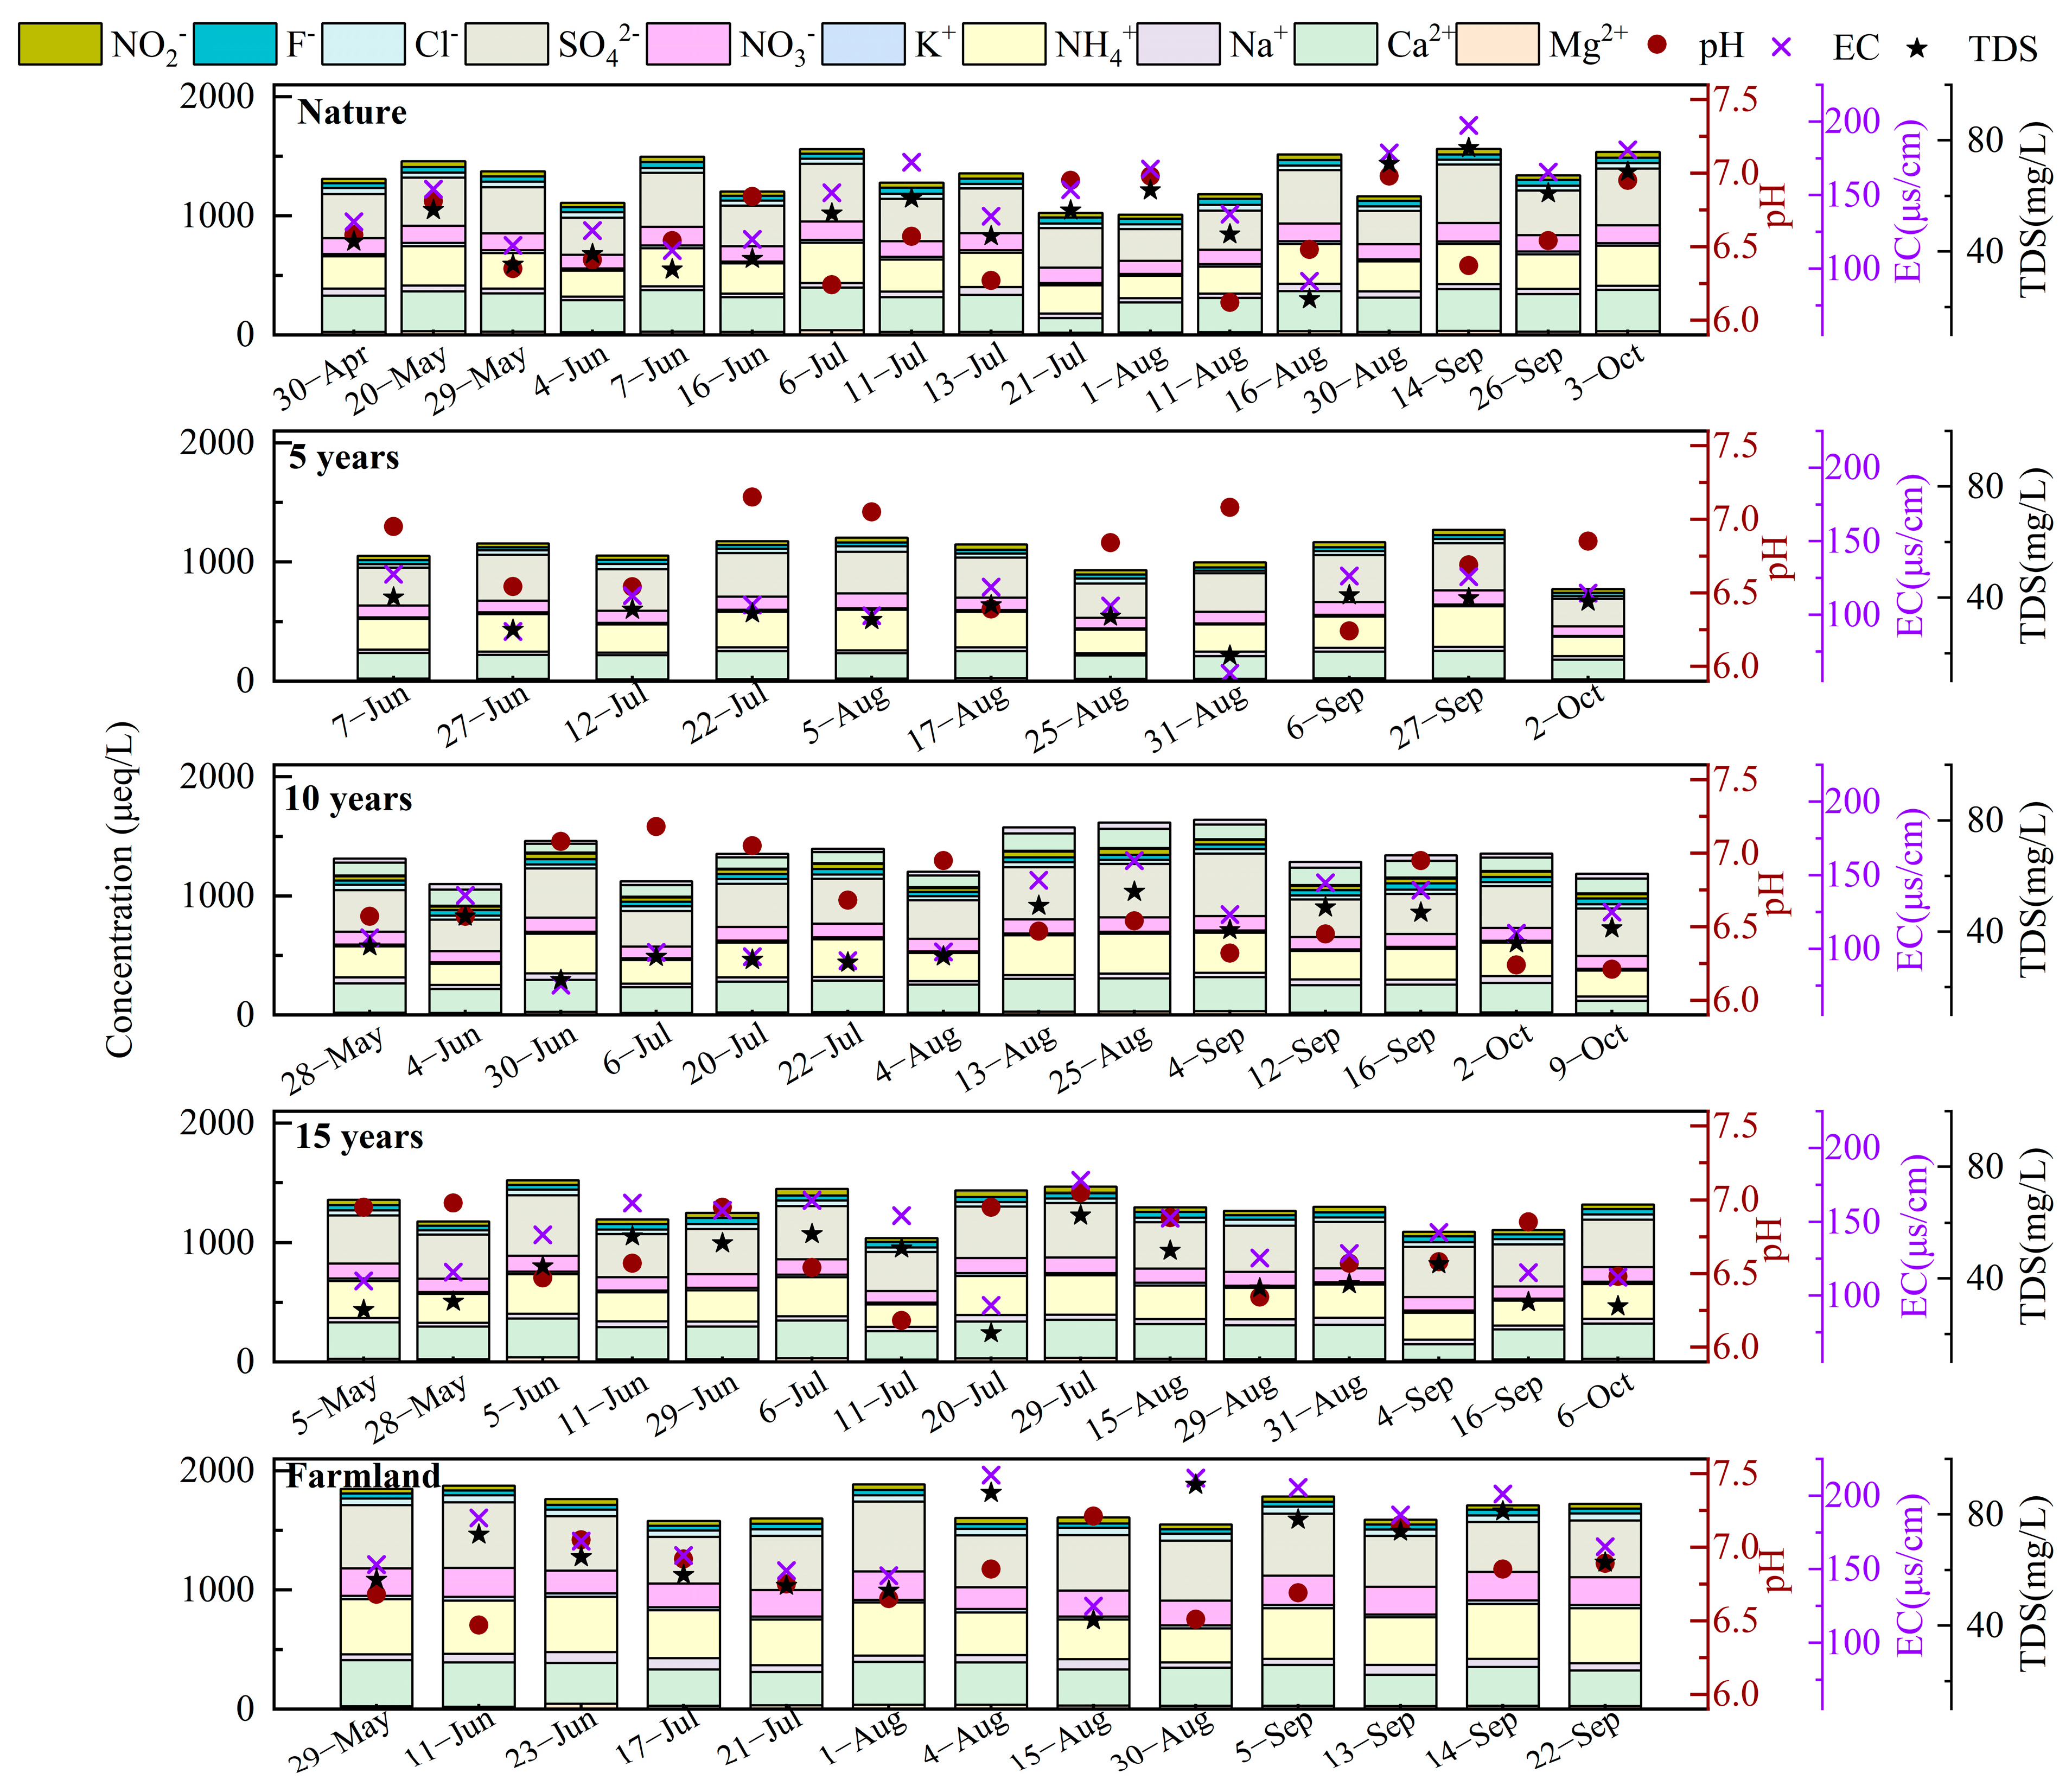
3.3. Dew Chemical Characteristics

Some acidic gases (SO2, CO2, etc.) dissolve in dew during its formation, and most of the dew is acidic in most areas [36,37]. The proportion and concentration of ionic components in dew impact pH. The concentrations of SO42−, NO3, and Cl, which are mainly derived from anthropogenic emissions (coal burning, industrial emissions, automobile exhaust, etc.) in metropolis dew, were high because the level of urban pollution is serious. As an indicator of the underlying air quality near the surface, the dew pH of urban areas is usually acidic. For instance, dew pH values in New Delhi, India (6.26) [36]; Wroclaw, Poland (6.63) [38]; Santiago, Chile (6.6) [39]; and Yokohama, Japan (4.6) [40], were all acidic. The dew pH was alkaline only in a few areas. For example, in Mirleft, the pH of dew was 7.4 [41]. Because the observation site was located within 200 m of the sea, the concentration of marine ions was high, reaching 2413.5 (Ca2+), 1348.6 (Mg2+), and 4318.2 (Na+) μeq/L (Figure 5).
  • Ref. [42], Tikehau, Frech.
  • Ref. [43], Nanjing, China.
  • Ref. [35], New Delhi, India.
  • Ref. [44], Bhola, Bangladesh.
  • Ref. [41], Mirleft, Morocco.
  • Ref. [37], Zadar, Croatia.
  • Ref. [39], Santiago, Chile.
  • Ref. [38], Wroclaw, Poland.
  • Ref. [45], Bordeaux, Frech.
  • Ref. [46], Amman, Jodan.
  • Ref. [47], Fayetteville, US.
  • Ref. [48], Indianapolis, US.
  • Ref. [40], Yokohama, Japan.
  • Ref. [49], Warren, US.
  • This study, Sanjiang, China.
As shown in Table 4, the mean pH value of dew in natural marsh, marsh in each restoration year, and farmland was slightly acidic, ranging from 6.6 to 6.8, with no significant difference at each site (p > 0.05). There was no anthropogenic pollution source discharged in the study area, while the pH in dew was also related to the surface water. There was no significant difference in the surface water pH between the natural marsh and the marsh 15 years after restoration (p > 0.05), but it was significantly lower than that of the marshes 10 years and 5 years after restoration (p < 0.05). The lower pH of the surface water may be due to the decay and decomposition of plant litter in the marsh [50]. It is speculated that surface water acidification occurs during succession after marsh restoration.
The ion concentration of dew in our study area was lower than that in urban and coastal areas (Figure 5). In natural marshes, restored marshes, or farmland, SO42−, Ca2+, NH4+, and NO3 ions were the main ions in dew. There was no obvious seasonal variation in the ion concentrations (Figure 6). There was no significant difference in the ion concentrations (Ca2+, Mg2+, Na+, K+, NH4+, F, Cl, NO2, and SO42−) of natural marsh dew compared with those 15 years after restoration (p > 0.05), except for NO3, but most ion concentrations (Ca2+, Mg2+, K+, F, and Cl) were higher than those in marshes restored 10 and 5 years ago (p < 0.05), and most ion concentrations (Na+, K+, Cl, NO3, and SO42−) of marsh dew were lower than those of farmland. Taking K+ and Cl as examples, the concentrations were 20.82 and 42.22 μeq/L in natural marshes, 19.21 and 41.39 μeq/L in marshes restored 15 years ago, 15.44 and 36.93 μeq/L in marshes restored 10 years ago, 12.70 and 35.30 μeq/L in marshes restored 5 years ago, and 27.28 and 56.58 μeq/L in farmlands, respectively. This is because dew was directly collected on plant leaves, and the plants in the natural and 15-year restored marshes had longer growth times and more leaf dust, while less dust was found on the plant leaves in the 5-year restored marsh because of the shorter growth time. This result indicated that the dew ion concentration was higher with more particulate matter in plant leaves. The dew ion concentration of farmland was higher than that of marsh due to the influence of crop spraying and disturbance from agricultural operation (p < 0.05). This can be reflected by the EC and TDS of dew (Table 4 and Figure 6). The EC and TDS in farmland dew were the highest, followed by those in natural marsh and 15-year, 10-year, and 5-year restored marshes. Moreover, dew contained evaporative water vapor from surface water [51]. Therefore, the dew ion concentration was also affected by the surface water environment in the marsh. The main source of marsh surface water is precipitation, and there was no significant difference in rain quality between different sites (Figure 7). The ion concentrations of the surface water in the natural and 15-year restored marshes were significantly higher than those of the 5-year restored marsh. K is a common element in plants, and the K+ in surface water was 52.6 μeq/L, 40.2 μeq/L, 36.5 μeq/L, and 28.4 μeq/L in the natural marsh and the marshes restored 15 years, 10 years, and 5 years ago, respectively (Figure 7). This can be seen by the decomposition of the plant in the surface water after wilting, increasing the ion concentration in the surface water. The dew ion concentration after 5 years of restoration was similar to that of local surface water. The evaporation of surface water vapor was also an important part of dew. Therefore, under the influence of leaf dust and surface water quality, the dew ion concentrations of natural and 15-year restored marshes were higher than those of marshes restored after 10 years and 5 years. However, dew quality is mainly affected by leaf surface dust and plant type. Because the evaporation process of surface water is a distillation process, the quality of surface water has little effect on dew quality.

4. Conclusions

Through the monitoring of the dew of farmland; marshes restored 5 years, 10 years, and 15 years ago; and natural marshes, it was found that in the process of marsh restoration, dew is more conducive to condensation, and it can prolong the evaporation time because of the “cold and wet effect” of wetlands. The number of dew days increased from 106 days (farmland) to 122 days (15-year restored marsh), and the dew duration increased from 791.1 ± 90.3 min (farmland) to 869.4 ± 100.5 min (15-year restored marsh). The dew days and duration were 120 days and 893.3 ± 106.1 min in the natural marsh, respectively, which were similar to those of the 15-year restored marsh. The marsh restored after 15 years has basically restored the characteristics of the natural marsh in terms of dew condensation and evaporation.
In the process of marsh restoration, the dew intensity and annual dew amount increased significantly. The dew intensities of marshes at 5, 10, and 15 years after restoration were 0.08 ± 0.03 mm, 0.10 ± 0.04 mm, and 0.13 ± 0.04 mm, respectively, which were significantly higher than those of farmland (0.06 ± 0.02 mm) (p < 0.01). There was no significant difference in dew intensity between the 15-year restored and the natural marsh (0.14 ± 0.04 mm) (p > 0.05). The dew intensity at each monitoring site was positively correlated with RH and T in the condensation stage (p < 0.01) and negatively correlated with wind speed (p < 0.01). In the process of marsh restoration, the threshold of meteorological conditions for dew condensation became wider, which also indicated that the marsh was more conducive to dew condensation. The dew intensity peaked in July and August, and the dew intensity was lowest in April. The annual dew amount of the natural marsh was 47.96 mm/y, and it was 44.86 mm/y, 40.46 mm/y, and 38.39 mm/y in the 15-year, 10-year, and 5-year restored marshes, respectively. The mean pH value of dew in marsh or farmland was acidic. The dew ions were mainly SO42−, Ca2+, NH4+, and NO3. Most ion concentrations (Na+, K+, Cl, NO3, and SO42−) in the dew of the marsh were lower than those in farmland (p < 0.05) due to the influence of crop spraying foliation and disturbance from agricultural operation. The results showed that dew in marshes helps water vapor deposition, and dew is a good indicator of marsh restoration. In future studies, the effect and significance of the amount and quality of dew on the distribution and growth of plants should be discussed.

Author Contributions

Conceptualization, Y.X. and L.C.; methodology, L.C.; validation, Y.X., H.H. and Y.Z.; formal analysis, Y.X.; investigation, H.H.; resources, L.C.; data curation, Y.Z.; writing—original draft preparation, Y.X.; writing—review and editing, Y.X.; visualization, L.C.; supervision, L.C.; project administration, Y.X.; funding acquisition, Y.X. All authors have read and agreed to the published version of the manuscript.

Funding

This research was funded by National Nature Science Foundation of China, grant number 42175140.

Data Availability Statement

Data available on request due to restrictions, e.g., privacy. The data presented in this study are available from the corresponding author by request ([email protected]).

Acknowledgments

The authors gratefully acknowledge the editors and reviewers for raising suggestions and commenting on this paper.

Conflicts of Interest

The authors declare no conflicts of interest.

References

  1. Sun, M.; Tian, X.; Zou, Y.; Jiang, M. Ecological aesthetic assessment of a rebuilt wetland restored from farmland and management implications for National Wetland Parks. PLoS ONE 2019, 14, e0223661. [Google Scholar] [CrossRef] [PubMed]
  2. Xu, Y.Y.; Yan, B.X.; Luan, Z.Q.; Zhu, H. Dewfall variation by large-scale reclamation in Sanjiang Plain. Wetlands 2012, 32, 783–790. [Google Scholar] [CrossRef]
  3. CCTV Network. China Has Achieved Remarkable Results in Wetland Protection. 2022. Available online: https://news.cctv.com/2022/11/05/ARTI1RzicYc2G5zjPCYKen6r221105.shtml (accessed on 5 November 2022).
  4. Yasutake, D.; Yokoyama, G.; Maruo, K.; Wu, Y.R.; Wang, W.Z.; Mori, M.; Kitano, M. Analysis of leaf wetting effects on gas exchanges of corn using a whole-plant chamber system. Plant Soil Environ. 2018, 64, 233–239. [Google Scholar] [CrossRef]
  5. Chavez-Sahagun, E.; Andrade, J.L.; Zotz, G.; Reyes-Garcia, C. Dew can prolong photosynthesis and water status during drought in some epiphytic bromeliads from a seasonally dry tropical forest. Trop. Conserv. Sci. 2019, 12, 1–11. [Google Scholar] [CrossRef]
  6. Munne-Bosch, S.; Nogues, S.; Alegre, L. Diurnal variations of photosynthesis and dew absorption by leaves in two evergreen shrubs growing in Mediterranean field conditions. New Phytol. 1999, 144, 109–119. [Google Scholar] [CrossRef]
  7. Barradas, V.L.; Glez-Medellin, M.G. Dew and its effect on two heliophile understorey species of a tropical dry deciduous forest in Mexico. Int. J. Biometeorol. 1999, 43, 1–7. [Google Scholar] [CrossRef]
  8. Liu, M.Z.; Cen, Y.; Wang, C.D.; Gu, X.; Bowler, P.; Wu, D.X.; Zhang, L.; Jiang, G.M.; Beysens, D. Foliar uptake of dew in the sandy ecosystem of the Mongolia Plateau: A life-sustaining and carbon accumulation strategy shared differently by C3 and C4 grasses. Agr. Forest Meteorol. 2020, 287, 107941. [Google Scholar] [CrossRef]
  9. Carmichael, M.J.; White, J.C.; Cory, S.T.; Berry, Z.C.; Smith, W.K. Foliar water uptake of fog confers ecophysiological benefits to four common tree species of southeastern freshwater forested wetlands. Ecohydrology 2020, 13, e2240. [Google Scholar] [CrossRef]
  10. Hayes, M.A.; Chapman, S.; Jesse, A.; O’Brien, E.; Langley, J.A.; Bardou, R.; Devaney, J.; Parker, J.D.; Cavanaugh, K.C. Foliar water uptake by coastal wetland plants: A novel water acquisition mechanism in arid and humid subtropical mangroves. J. Ecol. 2020, 108, 2625–2637. [Google Scholar] [CrossRef]
  11. Kool, D.; Agra, E.; Drabkin, A.; Duncan, A.; Fendinat, P.P.; Leduc, S.; Lupovitch, G.; Nambwandja, A.N.; Ndilenga, N.S.; Thi, T.N.; et al. The overlooked non-rainfall water input sibling of fog and dew: Daily water vapor adsorption on a Nara hummock in the Namib sand sea. J. Hydrol. 2021, 598, 126420. [Google Scholar] [CrossRef]
  12. Gałek, G.; Sobik, M.; Błaśa, M.; Polkowska, Ż.; Cichała-Kamrowska, K. Dew formation and chemistry near a motorway in Poland. Pure Appl. Geophys. 2011, 169, 1053–1066. [Google Scholar] [CrossRef]
  13. Odeh, I.; Arar, S.; Al-Hunaiti, A.; Sa’aydeh, H.; Hammad, G.; Duplissy, J.; Vuollekoski, H.; Korpela, A.; Petaja, T.; Kulmala, M.; et al. Chemical investigation and quality of urban dew collections with dust precipitates. Environ. Sci. Pollut. Res. 2017, 24, 12312–12318. [Google Scholar] [CrossRef] [PubMed]
  14. Rubio, M.A.; Lissi, E.; Villena, G. Nitrite in rain and dew in Santiago city, Chile. Its possible impact on the early morning start of the photochemical smog. Atmos. Environ. 2002, 36, 293–297. [Google Scholar] [CrossRef]
  15. Wesely, M.L.; Sisterson, D.L.; Jastrow, J.D. Observations of the chemical properties of dew on vegetation that affect the dry deposition of SO2. J. Geophys. Res. 1990, 95, 7501–7514. [Google Scholar] [CrossRef]
  16. Liu, Y.; Li, J.; Yan, D.D.; Chen, L.; Li, M.; Luan, Z.Q. Typical vegetation dynamics and hydrological changes of Dongting Lake wetland from 1985 to 2020. Ecohydrol. Hydrobiol. 2023. [Google Scholar] [CrossRef]
  17. Yu, R.H.; Zhang, Z.Z.; Lu, X.X.; Chang, I.-S.; Liu, T.X. Variations in dew moisture regimes in desert ecosystems and their influencing factor. Wires. Water 2020, 7, e1482. [Google Scholar] [CrossRef]
  18. Xie, S.; Yan, D.; Li, J.; Liu, Y.; Sheng, Y.; Luan, Z. GEE-Based Spatial-Temporal Dynamics in a Ramsar Wetland, Honghe National Nature Reserve, Northeast China from 1985 to 2021. Land 2022, 11, 2137. [Google Scholar] [CrossRef]
  19. Yan, D.D.; Luan, Z.Q.; Xu, D.D.; Xue, Y.Y.; Shi, D. Modeling the Spatial Distribution of Three Typical Dominant Wetland Vegetation Species’ Response to the Hydrological Gradient in a Ramsar Wetland, Honghe National Nature Reserve, Northeast China. Water 2020, 12, 2041. [Google Scholar] [CrossRef]
  20. Xu, Y.Y.; Jia, C.Z.; Liu, H.Z. Dew Evaporation Amount and Its Influencing Factors in an Urban Ecosystem in Northeastern China. Water 2022, 14, 2428. [Google Scholar] [CrossRef]
  21. Xu, Y.Y.; Zhu, H.; Tang, J.; Lin, Y.Z. Chemical compositions of dew and scavenging of particles in Changchun, China. Adv. Meteorol. 2015, 2015, 104048. [Google Scholar] [CrossRef]
  22. Zhuang, Y.L.; Zhao, W.Z. Dew formation and its variation in Haloxylon ammodendron plantations at the edge of a desert oasis, northwestern China. Agric. Forest Meteorol. 2017, 247, 541–550. [Google Scholar] [CrossRef]
  23. Guo, X.N.; Zha, T.S.; Jia, X.; Wu, B.; Feng, W.; Xie, J.; Gong, J.N.; Zhang, Y.Q.; Peltola, H. Dynamics of dew in a cold desert-shrub ecosystem and its abiotic controls. Atmosphere 2016, 7, 32. [Google Scholar] [CrossRef]
  24. Li, H.Y.; Han, C.T.; Yang, Y.; Chen, R.S. Formation and variations of dew and hoarfrost in the Hulu Catchment on Northeast Qinghai-Tibet Plateau, China. J. Hydrol-Reg. Stud. 2022, 42, 101179. [Google Scholar] [CrossRef]
  25. Hanisch, S.; Lohrey, C.; Buerkert, A. Dewfall and its ecological significance in semi-arid coastal south-western Madagascar. J. Arid Environ. 2015, 121, 24–31. [Google Scholar] [CrossRef]
  26. Aguirre-Gutiérrez, C.A.; Holwerda, F.; Goldsmith, G.R.; Delgado, J.; Yepez, E.; Carbajal, N.; Escoto-Rodríguez, M.; Arredondo, J.T. The importance of dew in the water balance of a continental semiarid grassland. J. Arid Environ. 2019, 168, 26–35. [Google Scholar] [CrossRef]
  27. Pan, Y.X.; Wang, X.P.; Zhang, Y.F.; Hu, R. Dew formation characteristics at annual and daily scale in xerophyte shrub plantations at Southeast margin of Tengger desert, Northern China. Ecohydrology 2018, 11, e1968. [Google Scholar] [CrossRef]
  28. Jia, Z.F.; Zhao, Z.Q.; Zhang, Q.Y.; Wu, W.C. Dew yield and its influencing factors at the western edge of Gurbantunggut Desert, China. Water 2019, 11, 733. [Google Scholar] [CrossRef]
  29. Hao, X.M.; Li, C.; Guo, B.; Ma, J.X.; Ayup, M.; Chen, Z.S. Dew formation and its long-term trend in a desert riparian forest ecosystem on the eastern edge of the Taklimakan Desert in China. J. Hydrol. 2012, 472–473, 90–98. [Google Scholar] [CrossRef]
  30. Yokoyama, G.; Yasutake, D.; Wang, W.Z.; Wu, Y.R.; Feng, J.J.; Dong, L.L.; Kimura, K.; Marui, A.; Hirota, T.; Kitano, M.; et al. Limiting factor of dew formation changes seasonally in a semiarid crop field of northwest China. Agric. Forest Meteorol. 2021, 311, 108705. [Google Scholar] [CrossRef]
  31. Jia, Z.F.; Wang, Z.; Wang, H. Characteristics of dew formation in the semi-arid loess plateau of central Shaanxi Province, China. Water 2019, 11, 126. [Google Scholar] [CrossRef]
  32. Meng, Y.; Wen, X.F. Characteristics of dew events in an arid artificial oasis cropland and a sub-humid cropland in China. J. Arid Land. 2016, 8, 399–408. [Google Scholar] [CrossRef]
  33. Khalil, M.M.; Kara-Ali, A.; Assad, M. Potential of harvesting water from fog and dew water over semi-arid and arid regions in Syria. Water Supply 2021, 22, 874. [Google Scholar] [CrossRef]
  34. Wang, X.; Gao, Z.Y.; Wang, Y.K.; Wang, Z.; Jin, S.S. Dew measurement and estimation of rain-fed jujube (Zizyphys jujube Mill) in a semi-arid loess hilly region of China. J. Arid. Land 2017, 9, 547–557. [Google Scholar] [CrossRef]
  35. Zhang, Q.; Wang, S.; Yang, F.L.; Yue, P.; Yao, T.; Wang, W.Y. Characteristics of dew formation and distribution, and its contribution to the surface water budget in a semi-arid region in China. Bound.-Lay. Meteorol. 2015, 154, 317–331. [Google Scholar] [CrossRef]
  36. Nath, S.; Yadav, S. A comparative study on fog and dew water chemistry at New Delhi, India. Aerosol Air Qual. Res. 2018, 18, 26–36. [Google Scholar] [CrossRef]
  37. Lekouch, I.; Mileta, M.; Muselli, M.; Milimouk-Melnytchouk, I.; Sojat, V.; Kabbachi, B.; Beysens, D. Comparative chemical analysis of dew and rain water. Atmos. Res. 2010, 95, 224–234. [Google Scholar] [CrossRef]
  38. Polkowska, Ż.; Błaś, M.; Klimaszewska, K.; Sobik, M.; Małek, S.; Namieśnik, J. Chemical characterization of dew water collected in different geographic regions of Poland. Sensors 2008, 8, 4006–4032. [Google Scholar] [CrossRef]
  39. Rubio, M.A.; Lissi, E.; Villena, G. Factors determining the concentration of nitrite in dew from Santiago, Chile. Atmos. Environ. 2008, 42, 7651–7656. [Google Scholar] [CrossRef]
  40. Okochi, H.; Kajimito, T.; Arai, Y.; Igawa, M. Effect of acid deposition on urban dew chemistry in Yokohama, Japan. Bull. Chem. Soc. Jpn. 1996, 69, 3355–3365. [Google Scholar] [CrossRef]
  41. Lekouch, I.; Muselli, M.; Kabbachi, B.; Ouazzani, J.; Melnytchouk-Milimouk, I.; Beysens, D. Dew, fog, and rain as supplementary sources of water in south-western Morocco. Energy 2011, 36, 2257–2265. [Google Scholar] [CrossRef]
  42. Muselli, M.; Clus, O.; Ortege, P.; Milimouk, I.; Beysens, D. Physical, chemecal and biological characteristics of dew and rainwater during the dry season of tropical island. Atmosphere 2021, 12, 69. [Google Scholar] [CrossRef]
  43. Hong, L.; Zhu, B.; Yu, X.N.; Shi, S.S.; Chen, K. Chemical composition of dew water at a suburban site in Nanjing, China, during the 2016–2017 winter. Atmos. Environ. 2019, 211, 226–233. [Google Scholar] [CrossRef]
  44. Shohel, M.; Simol, H.A.; Reid, E.; Reid, J.S.; Salam, A. Dew water chemical composition and source characterization in the IGP outflow location (coastal Bhola, Bangladesh). Air Qual. Atmos. Health 2017, 10, 981–990. [Google Scholar] [CrossRef]
  45. Beysens, D.; Ohayon, C.; Muselli, M.; Clus, O. Chemical and biological characteristics of dew and rain water in an urban coastal area (Bordeaux, France). Atmos. Environ. 2006, 40, 3710–3723. [Google Scholar] [CrossRef]
  46. Jiries, A. Chemical composition of dew in Amman, Jordan. Atmos. Res. 2001, 57, 261–268. [Google Scholar] [CrossRef]
  47. Wagner, G.H.; Steele, K.F. Dew and frost chemistry at a Midcontinent site, United States. J. Geophys. Res. 1992, 18, 20591–20597. [Google Scholar] [CrossRef]
  48. Foster, J.R.; Pribush, R.; Carter, B.H. The chemistry of dew and frosts in Indianapolis, Indiana. Atmos. Environ. 1990, 24, 2229–2236. [Google Scholar] [CrossRef]
  49. Mulawa, P.A.; Cadle, S.H.; Lipari, F.; Carolina, C.; Vandervennet, R.T. Urban dew: Its composition and influence on dry deposition rates. Atmos. Environ. 1986, 20, 1389–1396. [Google Scholar] [CrossRef]
  50. Wang, M.G.; Wang, M.; Yang, L.; Yang, T.; Li, J.J.; Chen, Y.M. Distribution characteristics and genesis of iron and manganese ions in groundwater of Eastern Sanjiang Plain, China. Water 2023, 15, 2068. [Google Scholar] [CrossRef]
  51. Maruyama, M.; Kuwagata, T.; Watanabe, T. Observations on dew formation in the rice canopy and its simulation using a multilayer microclimate model. J. Agr. Meteorol. 2023, 79, 28–37. [Google Scholar] [CrossRef]
Figure 1. Location of measurement sites in the Sanjiang Plain, China. The yellow star represents the location of the monitoring site.
Water 16 00178 g001
Figure 2. The frequency and duration of dew occurrence in farmland, natural marsh, and marshes in different years since restoration.
Water 16 00178 g002
Figure 3. Dew intensity and meteorological factors (RH, temperature, and wind speed) during dew condensation at each site.
Water 16 00178 g003
Figure 4. The annual dew amount, rainfall, and LAI of the typical plants at each site.
Water 16 00178 g004
Figure 5. Ion components and concentration in dew in the study area and other areas.
Water 16 00178 g005
Figure 6. Ion components and concentration in dew in the study area.
Water 16 00178 g006
Figure 7. The average ion concentrations in dew, rain, and surface water of farmland and marshes in different restoration years.
Water 16 00178 g007
Table 1. The characteristics of typical plants at each monitoring site.
SitesMarsh
Restoration Period
Typical PlantAverage
Annual Water Depth (cm)
Total Plant Cover (%)Average Plant Height (cm)
46°32′ N 132°09′ E0soybean07275
45°96′ N, 132°08′ E5 yearsArtemisia stolonifera56745
45°75′ N, 132°42′ E10 yearsCarex angustifolia157555
45°51′ N, 132°61′ E15 yearsCarex angustifolia—Carex lasiocarpa248558
47°48′ N, 133°58′ EnatureCarex lasiocarpa329052
Table 2. Dew days, duration, dew intensity, and amount in the study area and other sites.
SiteSurface LayerStudy PeriodDew Days (day/y)Average Duration (h)Dew
Intensity (mm/cm2·d)
Dewfall (mm/y)Proportion of
Precipitation in the Same Period (%)
Reference
Duolun County, Inner Mongolia, China (116°31.75′ E, 42°4.36′ N)Sandland2013–2015 (June–October)82–1168.30.156.18–9.4-[8]
Badain Jaran Desert, China (100°07′ E, 39°21′ N)Shrub2013 (June–October)1187.60.1316.116.7%[22]
Ningxia, China (107°13′ E, 37°42′ N)2012.6–2012.101667.50.04921.37.2%[23]
Qinghai–Tibet
Plateau, China (99°50′ E–99°54′ E, 39°12′–39°17′ N)
Grass2016–202090–313>90.113–330.3–7.3%[24]
Efoetsty, Madagasar (43.70° E, 24.08° S)2013.4–2014.932314.50.1658.419%[25]
Vaquerias, Mexico (101°60′ W, 21°78′ N)2011.1–2016.1214450.2016.5–694.9–10.2%[26]
Tengger Desert, China (104°57′ E, 37°27′ N)Moss crust2013.9–2014.8128200.1215.38.2%[27]
Gurbantuggut Desert, China (85°33′ E, 44°48′ N)Haloxylon ammodendron2015–2018160130.1012.19.1%[28]
Taklimakan Desert, China (87°51′ E, 40°28′ N)Populus2011.6–2011.1010420.1217.264%[29]
Baiyin City, China (104°25.4′ E, 36°25.5′ N)Corn2018–2020 (April–September)8110-7.64–11.75.4%[30]
Sanyuan County, China (108°54′ E, 33°33′ N)Wheat/corn2014–2016180–253100.0928.1–43.34.3–7.8%[31]
Zhangye, China (100°22′ E, 38°51′ N)Wheat/maize2012.5–2012.9695.00.149.99.5%[32]
Luancheng, China (114°40′ E, 37°49′ N)2008.4–2008.91285.40.1620.24.1%
Sanjiang Plain, China (133°58′ E, 47°48′ N)Carex lasiocarpa2022.4–2022.1012014.80.1447.9611.93%This study
Sanjiang Plain, China (132°61′ E, 45°51′ N)Carex angustifolia—Carex lasiocarpa12214.50.1344.8611.81%
Sanjiang Plain, China (132°42′ E, 45°75′ N)Carex angustifolia11213.90.1040.4610.16%
Sanjiang Plain, China (132°8′ E, 45°96′ N)Artemisia stolonifera10313.50.0838.3910.55%
Sanjiang Plain, China (132°09′ E, 46°32′ N)Soybean10613.20.0635.109.83%
Table 3. The thresholds of wind speed and RH on dew formation at other sites and study sites.
SiteReferenceWind Speed (m/s)RHSurface Layer
Inner Mongolia, China[8]<4.0>80%Sandland
Syria[33]<8-Sandland
Badain Jaran Desert, China[22]<4.27>50%Shrubs
Qinghai–Tibet Plateau, China[24]<1.8>52%Grass
Mizhi, China[34]<2.0>78Jujube
Loess Plateau, China[35]<1.5>80%Farmland
Sanjiang, ChinaThis study<5.56>44.5Farmland
<6.40>42.5Marsh
Table 4. pH, EC, and TDS in dew, rain, and surface water of farmland and marsh in different restoration years.
Natural Marsh5-Year Restored Marsh10-Year Restored Marsh15-Year Restored MarshFarmland
RainSurface waterDewRainSurface waterDewRainSurface waterDewRainSurface waterDewRainDew
pH6.7 ± 0.46.1 ± 0.26.6 ± 0.36.9 ± 0.46.8 ± 0.36.8 ± 0.36.7 ± 0.36.6 ± 0.36.7 ± 0.36.9 ± 0.36.2 ± 0.16.7 ± 0.36.8 ± 0.26.8 ± 0.2
EC (μs/cm)126.0 ± 11.2215.0 ± 20.1146.6 ± 28.695.0 ± 4.6159.0 ± 5.7108.0 ± 19.9104.0 ± 5.6168.0 ± 10.7117.9 ± 10.5106.0 ± 10.5185.0 ± 19.3137.1 ± 24.6134.0 ± 11.2174.7 ± 28.4
TDS (mg/L)35.0 ± 3.7212.0 ± 20.451.0 ± 14.929.0 ± 2.768.0 ± 4.734.5 ± 6.438.0 ± 3.0125.0 ± 11.338.6 ± 6.342.0 ± 6.3189.0 ± 22.542.2 ± 12.337.0 ± 2.467.3 ± 14.7
Disclaimer/Publisher’s Note: The statements, opinions and data contained in all publications are solely those of the individual author(s) and contributor(s) and not of MDPI and/or the editor(s). MDPI and/or the editor(s) disclaim responsibility for any injury to people or property resulting from any ideas, methods, instructions or products referred to in the content.

