Article

Spatiotemporal Evaluation of Water Resource Vulnerability in Four River Basins of Henan Province, China

School of Geoscience and Technology, Zhengzhou University, Zhengzhou 450001, China
*
Author to whom correspondence should be addressed.
Water 2024, 16(1), 149; https://doi.org/10.3390/w16010149
Submission received: 4 December 2023 / Revised: 22 December 2023 / Accepted: 28 December 2023 / Published: 30 December 2023

Abstract

:
Climate change, population growth, and socio-economic transformations present multifaceted challenges to the water resource systems in the four major river basins of Henan Province. Consequently, to gain a comprehensive understanding of water security within the study area, a quantitative assessment of water resource vulnerability (WRV) is imperative. In this investigation, the vulnerability scoping diagram (VSD) model serves as the analytical framework, subdividing vulnerability into three critical subsystems: exposure, sensitivity, and adaptive capacity. Utilizing a comprehensive evaluation index system, this study assesses WRV in Henan Province’s four primary watersheds. Temporal variations and spatial patterns of WRV from 2000 to 2020 are systematically examined through the standard deviational ellipse (SDE) and GeoDetector methods. The findings indicate that vulnerability within these river basins is shaped by the interactions among exposure, sensitivity, and adaptive capacity. Moreover, exposure and sensitivity are found to be more influential than adaptive capacity. Although there are indications of future improvements in the system’s resilience against water resource vulnerability, the overarching scenario remains precarious, particularly within the Hai and Yellow River basins. Considering the diverse characteristics of the watershed, it is recommended that adaptive management strategies be implemented. This study enhances the understanding of WRV dynamics in Henan Province, thereby aiding more effective decision making in sustainable water resource management.

1. Introduction

The dynamic interplay of climate change, population growth, and socio-economic advancement has led to an increasing imbalance between water supply and demand, resulting in the degradation of water quality and ecological health. These vulnerabilities manifest in various water-related challenges, encompassing water scarcity, contamination, and disruptions to ecological balance [1]. This makes the conflict between humans and the environment a central issue constraining the sustainable development of water resources and society [2]. Water resource vulnerability (WRV), initially grounded in disaster science, defines “vulnerability” as the degree to which a system succumbs to adverse effects when a disaster occurs [3]. The Intergovernmental Panel on Climate Change (IPCC) integrates water vulnerability with climate change factors and exposure, thereby transforming the concept into an analytical framework that explores the consequences and evolutionary paths of climate change, extreme events, human interventions, and other variabilities on water resource structures and operations [4,5]. Given the influences of global climate alterations and human endeavors, the imperative of water resource security has ascended to encompass economic, ecological, and national dimensions [6].
Research predominantly centers on quantitative models when examining water resource vulnerability. This includes primary methodologies such as functional assessment techniques and index-based evaluations [7,8,9]. Numerous researchers have employed a combination of quantitative methods to assimilate extensive multi-source data of varying characteristics from natural, economic, and cultural domains into their models [1,10]. When datasets are larger and encompass more extracted features, they facilitate a more thorough multidimensional data analysis, thus enhancing model accuracy [11,12]. However, the complexity of such functional approaches can render the interpretation of results challenging [13,14]. For example, Wei et al. [15] and Xia et al. [16] used system dynamics (SD) models and scenario analysis methods, respectively, to assess water resource vulnerability under various scenarios in their study areas, proposing tailored adaptive management strategies. In contrast, index-based methods [17] find more frequent application due to their enhanced flexibility, well-defined system architecture, seamless model integration, and the facile choice of influential parameters. In the realm of index-based vulnerability assessments, the formulation of evaluation metrics is crucial [18,19,20]. Present-day studies on vulnerability assessment theories and methodologies exhibit an absence of uniform and objective criteria, prompting researchers to devise evaluation indicator frameworks from varied angles [9,21]. For instance, Chen et al. [22] introduced an assessment schema focusing on water scarcity, contamination, and related natural calamities. Haak et al. [23] categorized metrics into socio-economic, water distribution, and socio-environmental groups, underscoring the complex interaction between urban water consumption patterns and socio-economic factors. To address this issue, considering theoretical frameworks, Polsky et al. [24] proposed the vulnerability scoping diagram (VSD) to coordinate the issues of diverse data, indicators, and information. Polsky et al. decomposed vulnerability into three dimensions: exposure, sensitivity, and adaptive capacity, providing a clear and comprehensive method for vulnerability assessment. In terms of practical application, Frazier et al. [25] developed the spatially explicit resilience-vulnerability (SERV) model to address the issues of spatial inconsistency and indicator dependency. Chen et al. [26] applied this model in the semi-arid region of Yulin City, integrating the VSD framework with the SERV model. This combination, featuring diverse data organization and a distinct indicator system, enhances understanding of the spatiotemporal disparities and characteristics of vulnerability in water resource systems.
A watershed represents a sophisticated confluence of natural and economic systems spanning multiple regions, covering vast expanses, and implicating broad water security concerns [10,27,28]. Consequently, there is a growing emphasis on its water resource vulnerability (WRV). Pandey et al. [29] explored the susceptibility of freshwater resources in Nepal’s expansive and intermediate river basins to environmental shifts. Chen et al. [30] forecasted the WRV for the Huang-Huai-Hai River basin under diverse socio-economic human activities and climatic shifts. The VSD framework is an important method for comprehensively characterizing the multiple risks and multi-factor indicators of regional WRV [8,15]. However, to our knowledge, there is still limited research on the comprehensive evaluation and analysis of WRV from the perspective of different basins within a region, although these methods have played a crucial role in quantifying water resources. Research conducted at scales beyond the basin level, encompassing cross-basin and regional dimensions [31], offers a more comprehensive understanding of water resource vulnerability within a broader spatial framework. In particular, when addressing WRV management across basin boundaries, reducing vulnerability contributes to regional collaboration, peaceful resolution of transboundary disputes, and strengthened emergency response mechanisms for local authorities [32,33]. Additionally, this approach supports the integration of WRV studies with regional sustainable development objectives [16,28], aligning with the goals of regional adaptive management. Implementing adaptive management in the assessment of water resources as a part of WRV [34,35,36] enables researchers to evaluate the effectiveness of current water management policies and practices. For instance, through quantitative analysis of trends and primary factors influencing regional water resource values, adjustments can be made in the allocation of protected ecosystem services [37] and in controlling total pollutant discharges into rivers and lakes [38].
This article delves into a case study centered on four basins within Henan Province, China, specifically the Huang-Huai-Hai-Yangtze River basin. Positioned in China’s central-eastern region, Henan Province is pivotal for bolstering national economic growth and agricultural outputs. Nonetheless, it grapples with challenges like limited water resources, demand–supply disparities [39], and pronounced basin variances [40]. This research seeks to enrich comprehension of spatiotemporal fluctuations in WRV across these four basins from 2000 to 2020. The investigation progressed as follows: (1) Constructing a WRV assessment model compartmentalized into exposure, sensitivity, and adaptive capability subdomains grounded on the VSD evaluation index system. (2) Gauging the WRV metric for the stipulated zone between 2000 and 2020 via a comprehensive index approach. (3) Charting the spatiotemporal trajectories of WRV using centroid and standard deviational ellipse (SDE) techniques. (4) Probing determinant elements via the GeoDetector methodology. (5) Initiating recommendations for adaptive management in the four principal river basins.

2. Materials and Methods
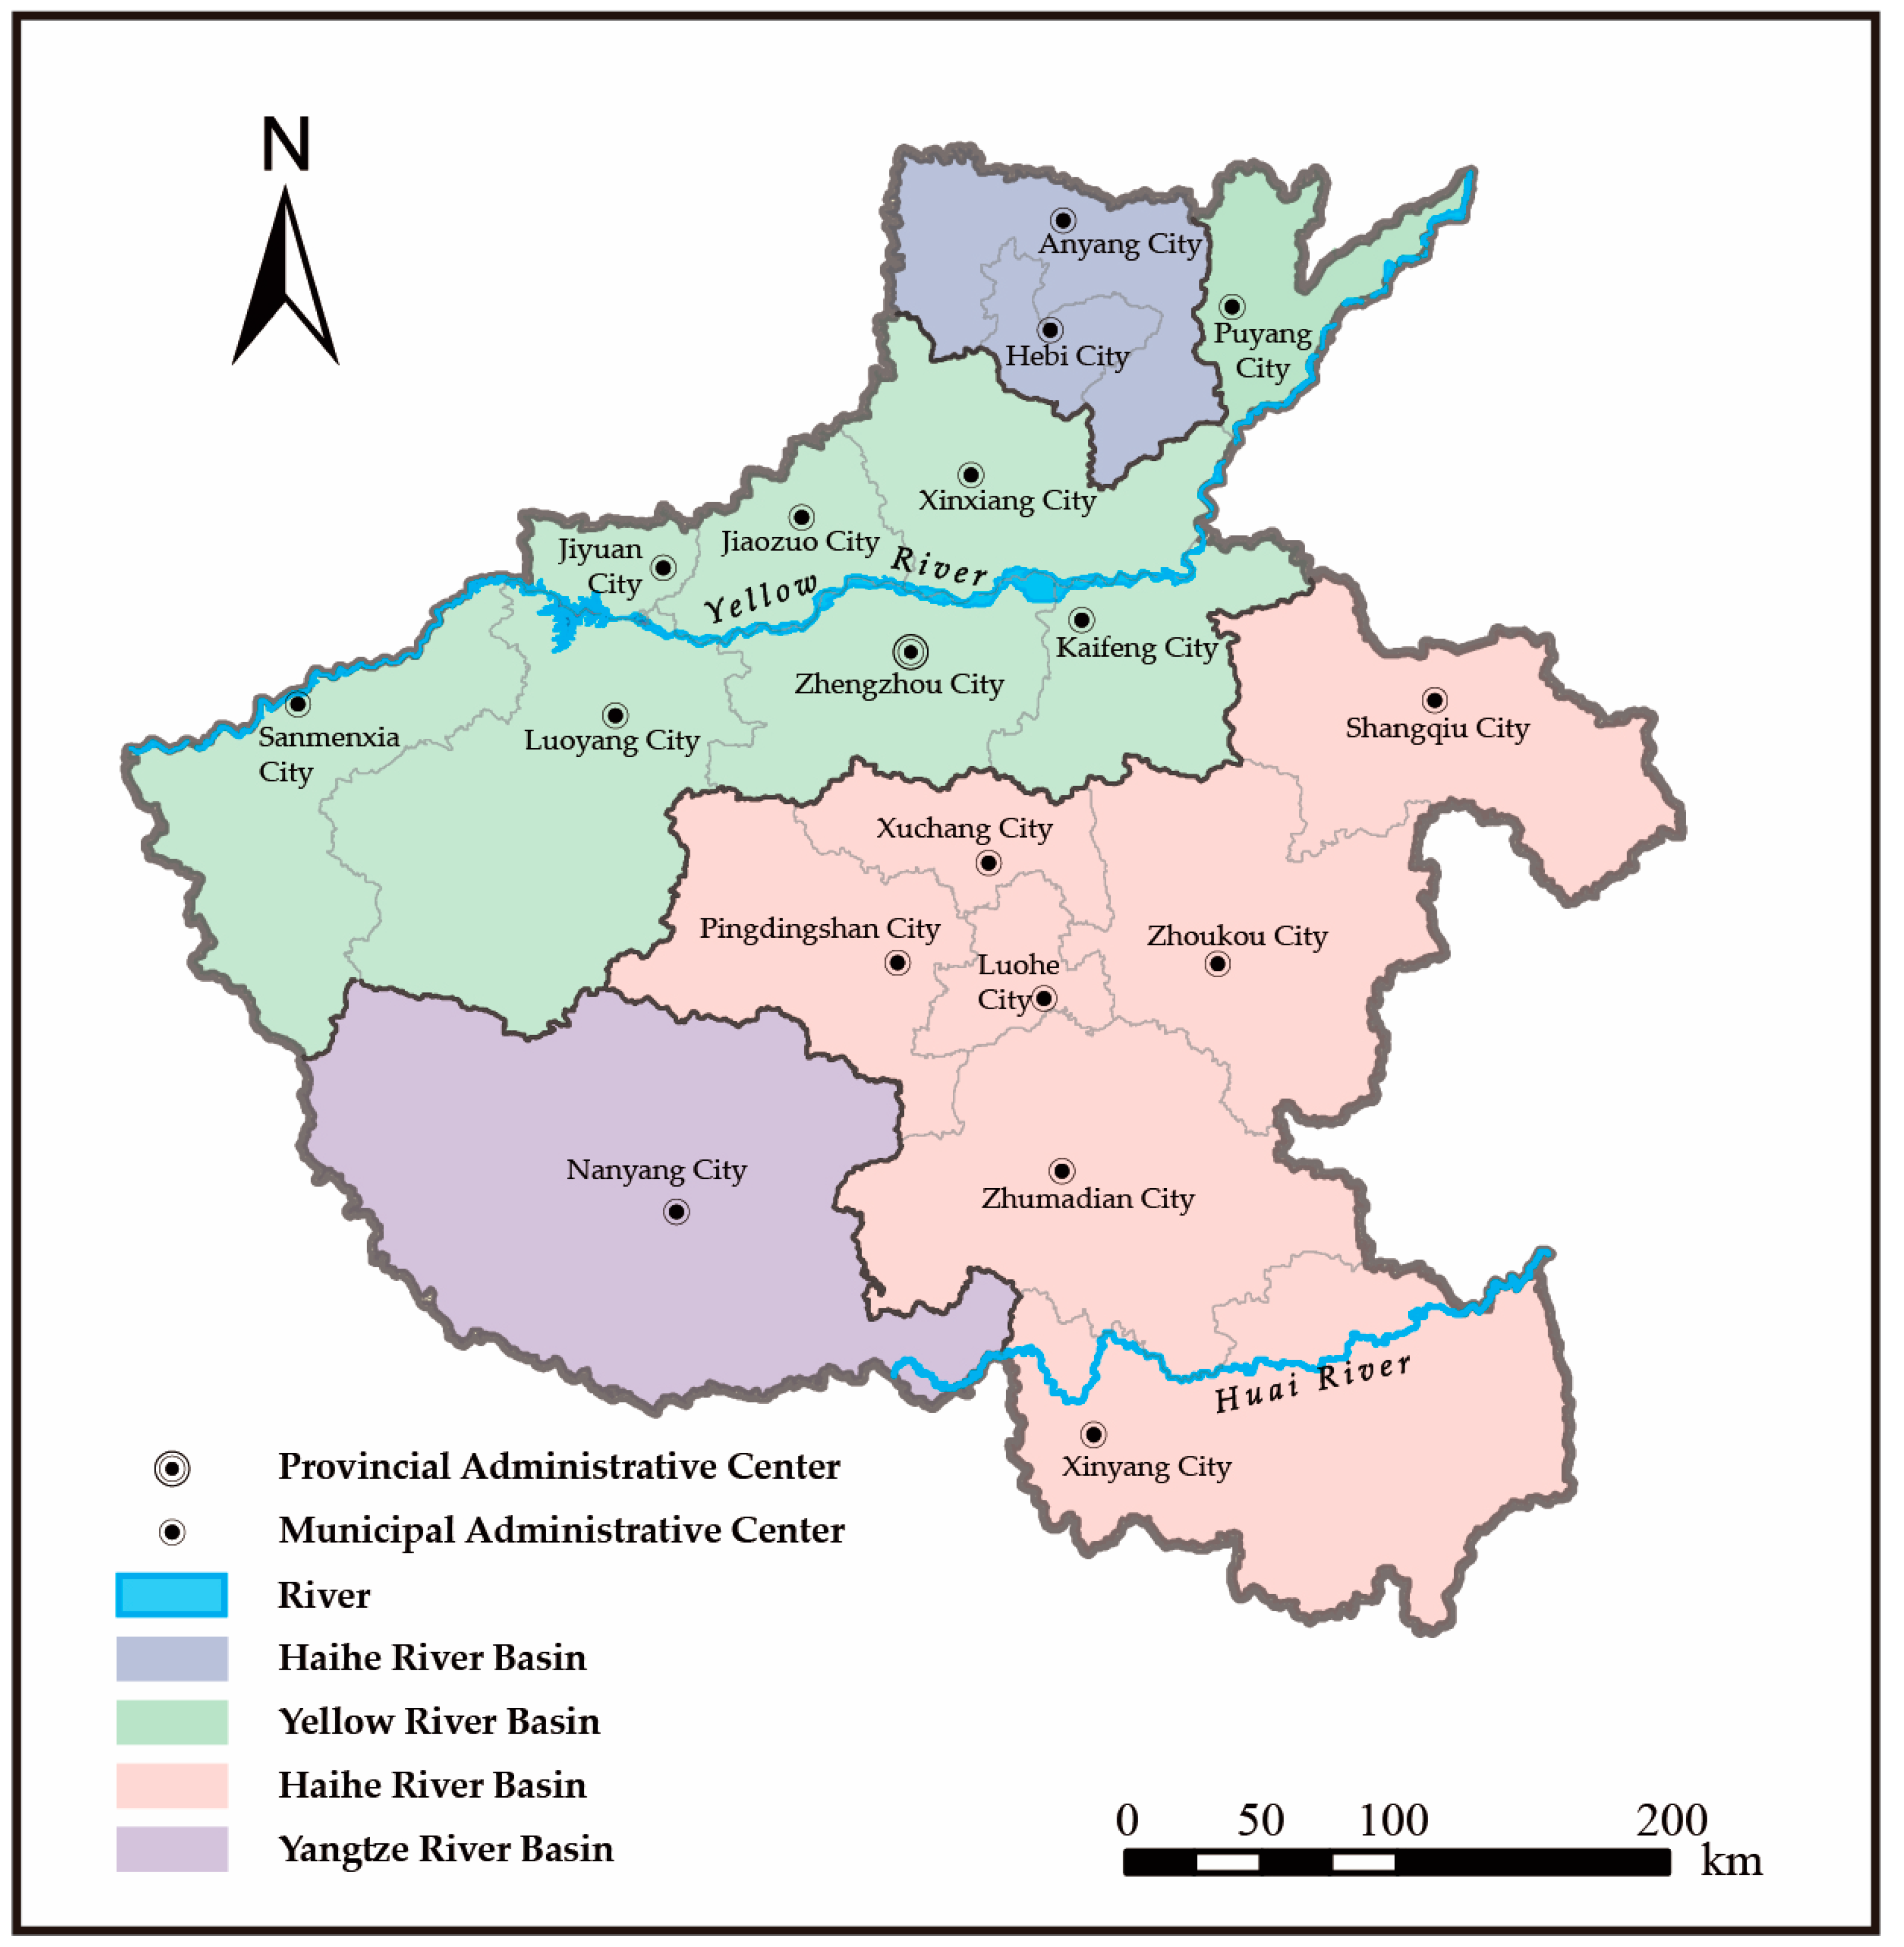
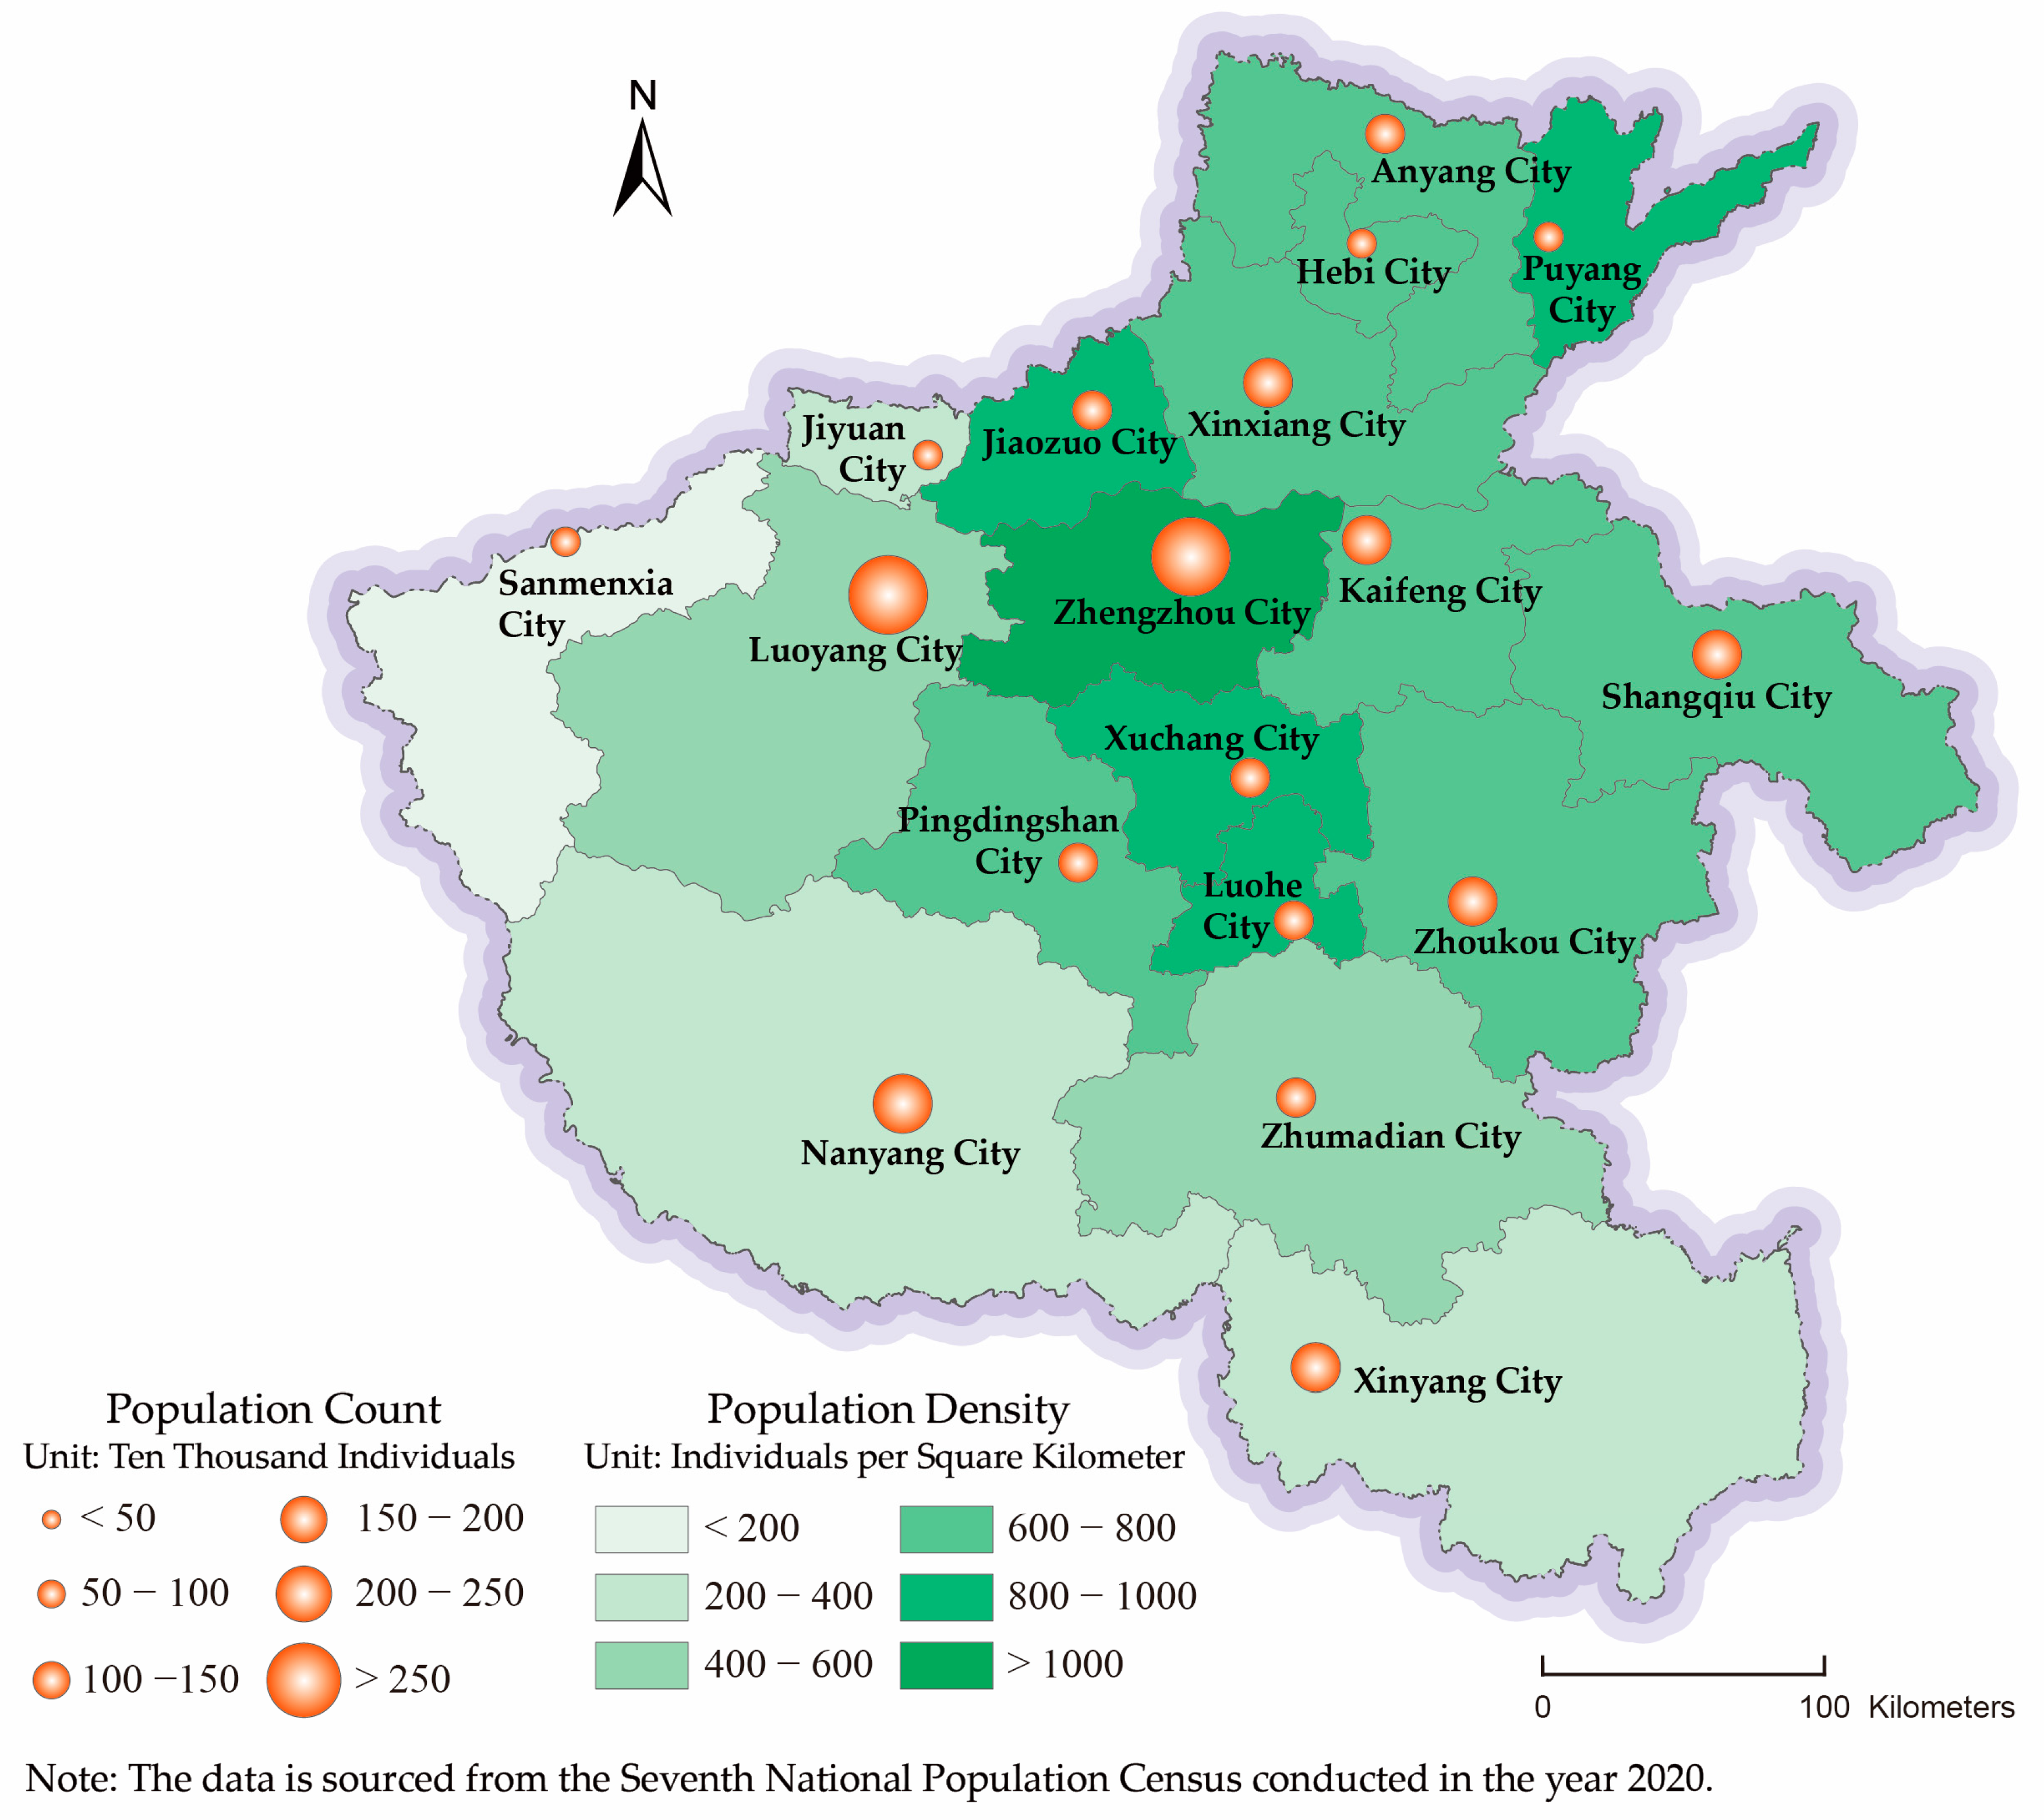
2.1. Study Area

Located in the central-eastern region of China (110°21′ E–116°39′ E; 31°23′ N–36°22′ N), Henan Province spans 167,000 km2 and comprises 18 prefecture-level cities. With an annual water resource averaging 40.35 billion m3, the province experiences an approximate average temperature of 14.8 °C and a mean annual precipitation of 771.3 mm. In 2020, Henan’s permanent population was recorded at 99.3655 million. The climatic and geographical conditions favor the cultivation of diverse crops, yet the province is endowed with limited water resources. The per capita water resource stands at around 440 m3, merely one-fifth of the national average and one-twentieth of the global figure, marking severe water scarcity by international benchmarks [41,42,43]. The province exhibits a west-to-east declining terrain. The Taihang Mountains, Funiu Mountains, and the confluence of Tongbai and Funiu Mountains encircle the north, west, and south, respectively, shaping pivotal watersheds for the Yellow, Huai, and Yangtze River systems. Three primary heavy rainfall centers are recognized: the Dabie Mountains in the south, the Tongbai-Funiu Mountains in the west, and the Taihang Mountains to the north. The brief hill-to-plain transition, devoid of a substantial buffer capacity, means intense rainfall episodes channel floodwaters into these river systems. This leads to overflows into the plains, triggering significant flooding [44,45,46]. Moreover, Henan’s precipitation displays spatiotemporal disparities, with localized droughts being recurrent annually and province-wide droughts manifesting sporadically, impacting economic and social progression. The image’s watershed delineation methodology is attributed to Zhang et al. [40], as delineated in their research.
A watershed represents a sophisticated confluence of natural and economic systems spanning multiple regions, covering vast expanses, and implicating broad water security concerns [10,27,28]. Consequently, there is a growing emphasis on its water resource vulnerability (WRV). Henan Province uniquely spans the Huang-Huai-Hai River basin, holding a pivotal role in China’s water network configuration. Notably, there are distinct variations in regional development, ecological conservation, and resource exploration and utilization among different basins within the province, leading to pronounced imbalances in basin development. In the present study, while referring to prior research findings and drawing from the “Planning for the Integrated Governance of Water Resources, Water Ecology, Water Environment, and Water Disasters in Henan Province (2021–2035)”, the four basins within Henan Province are primarily delineated using the surface watershed area, also taking into account the coherence of administrative boundaries (as depicted in Figure 1). The data for this research are bifurcated into two segments: water resource data and socio-economic metrics. The former are sourced from the “Henan Province Water Resources Bulletin” spanning 2000–2020, while the latter are derived from the “Henan Statistical Yearbook” covering 2001–2021. Data not readily available underwent computations or extrapolations using relevant formulas or connotations.

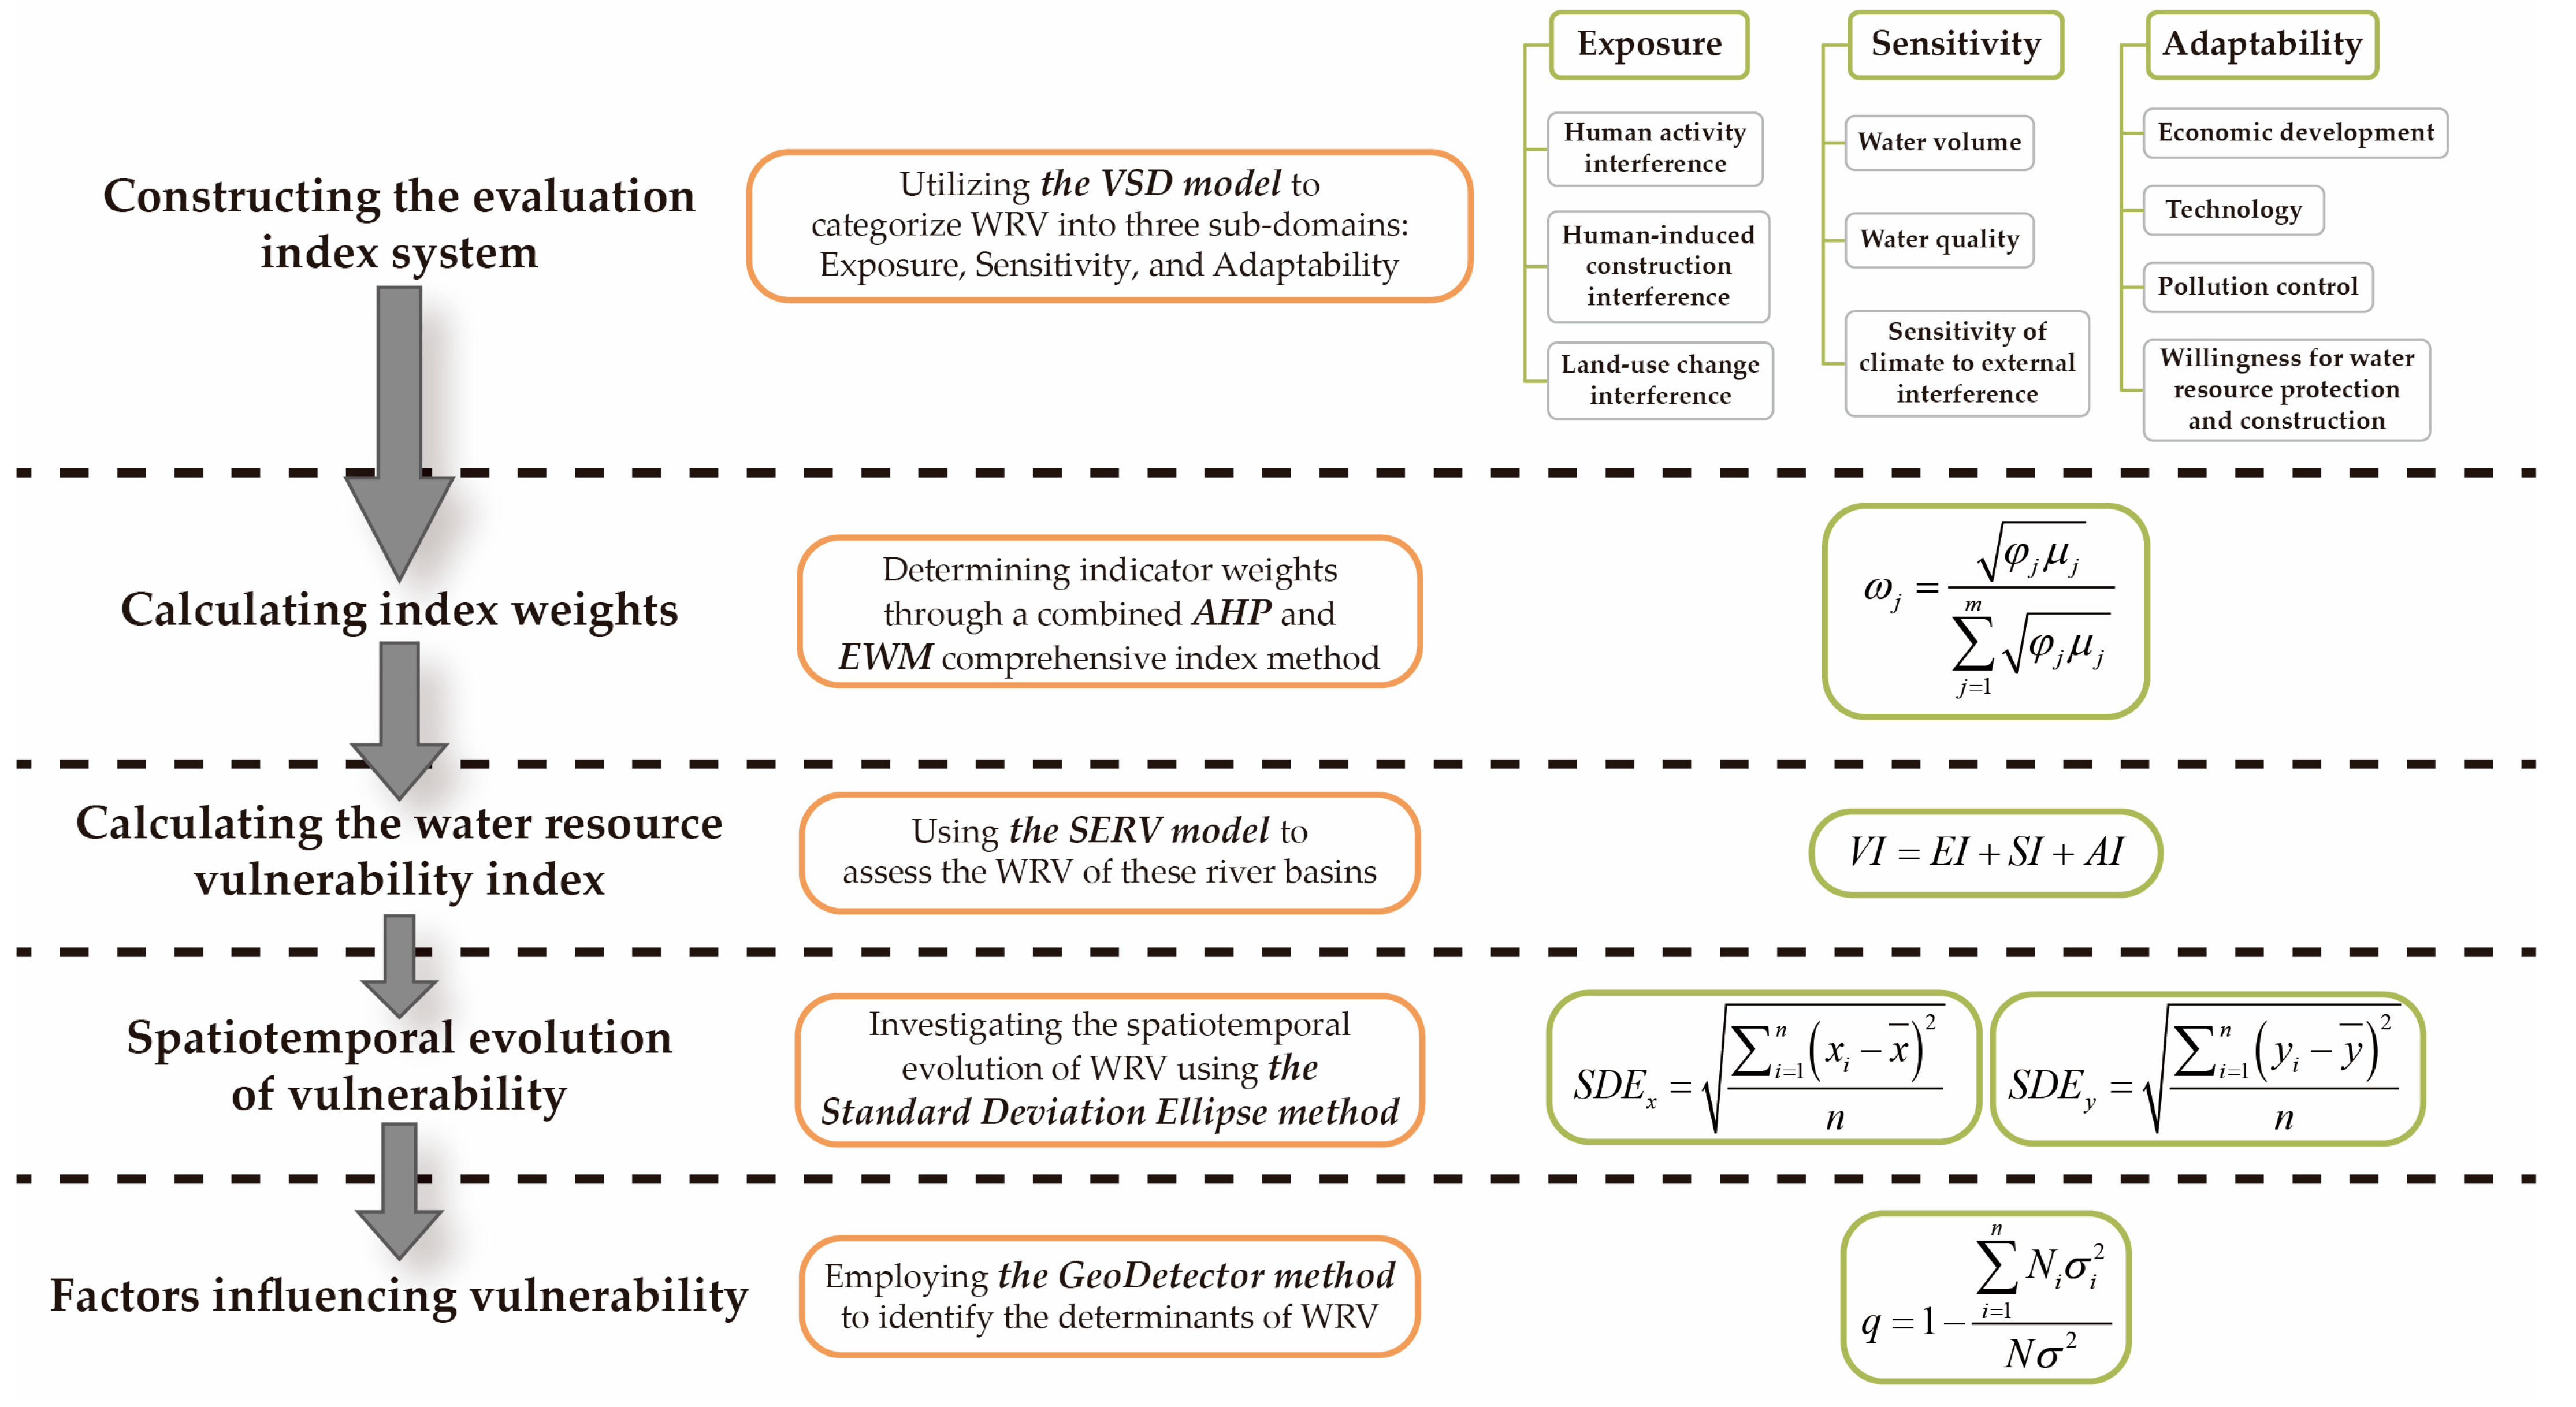
2.2. Research Flowchart and Its Brief Introduction

This study employed a tripartite decomposition of vulnerability into exposure, sensitivity, and adaptive capacity to encapsulate the intrinsic characteristics of the socio-ecological system. Guided by the fundamental principles of the VSD vulnerability assessment framework [20,24,47,48,49,50,51,52], the entire data curation and result simulation process was orchestrated (as illustrated in Figure 2). Inspired by the SERV model’s approach to indicator selection [17,25,53], a holistic array of quantifiable vulnerability assessment metrics was devised. Drawing from the water resource data across the four river basins in Henan Province and annual statistical records from various municipalities, pertinent and applicable indicators were subsequently identified. The SERV model was utilized to assess the WRV of these river basins, with associated weights determined through both the analytic hierarchy process (AHP) and the entropy weight method (EWM) [54,55,56]. The standard deviational ellipse method [57,58,59] facilitated an examination of spatiotemporal dynamics and overarching trends. In conclusion, the GeoDetector method [60,61,62] was harnessed to probe the determinants influencing WRV.

2.3. Construction of Water Resource Vulnerability Index System

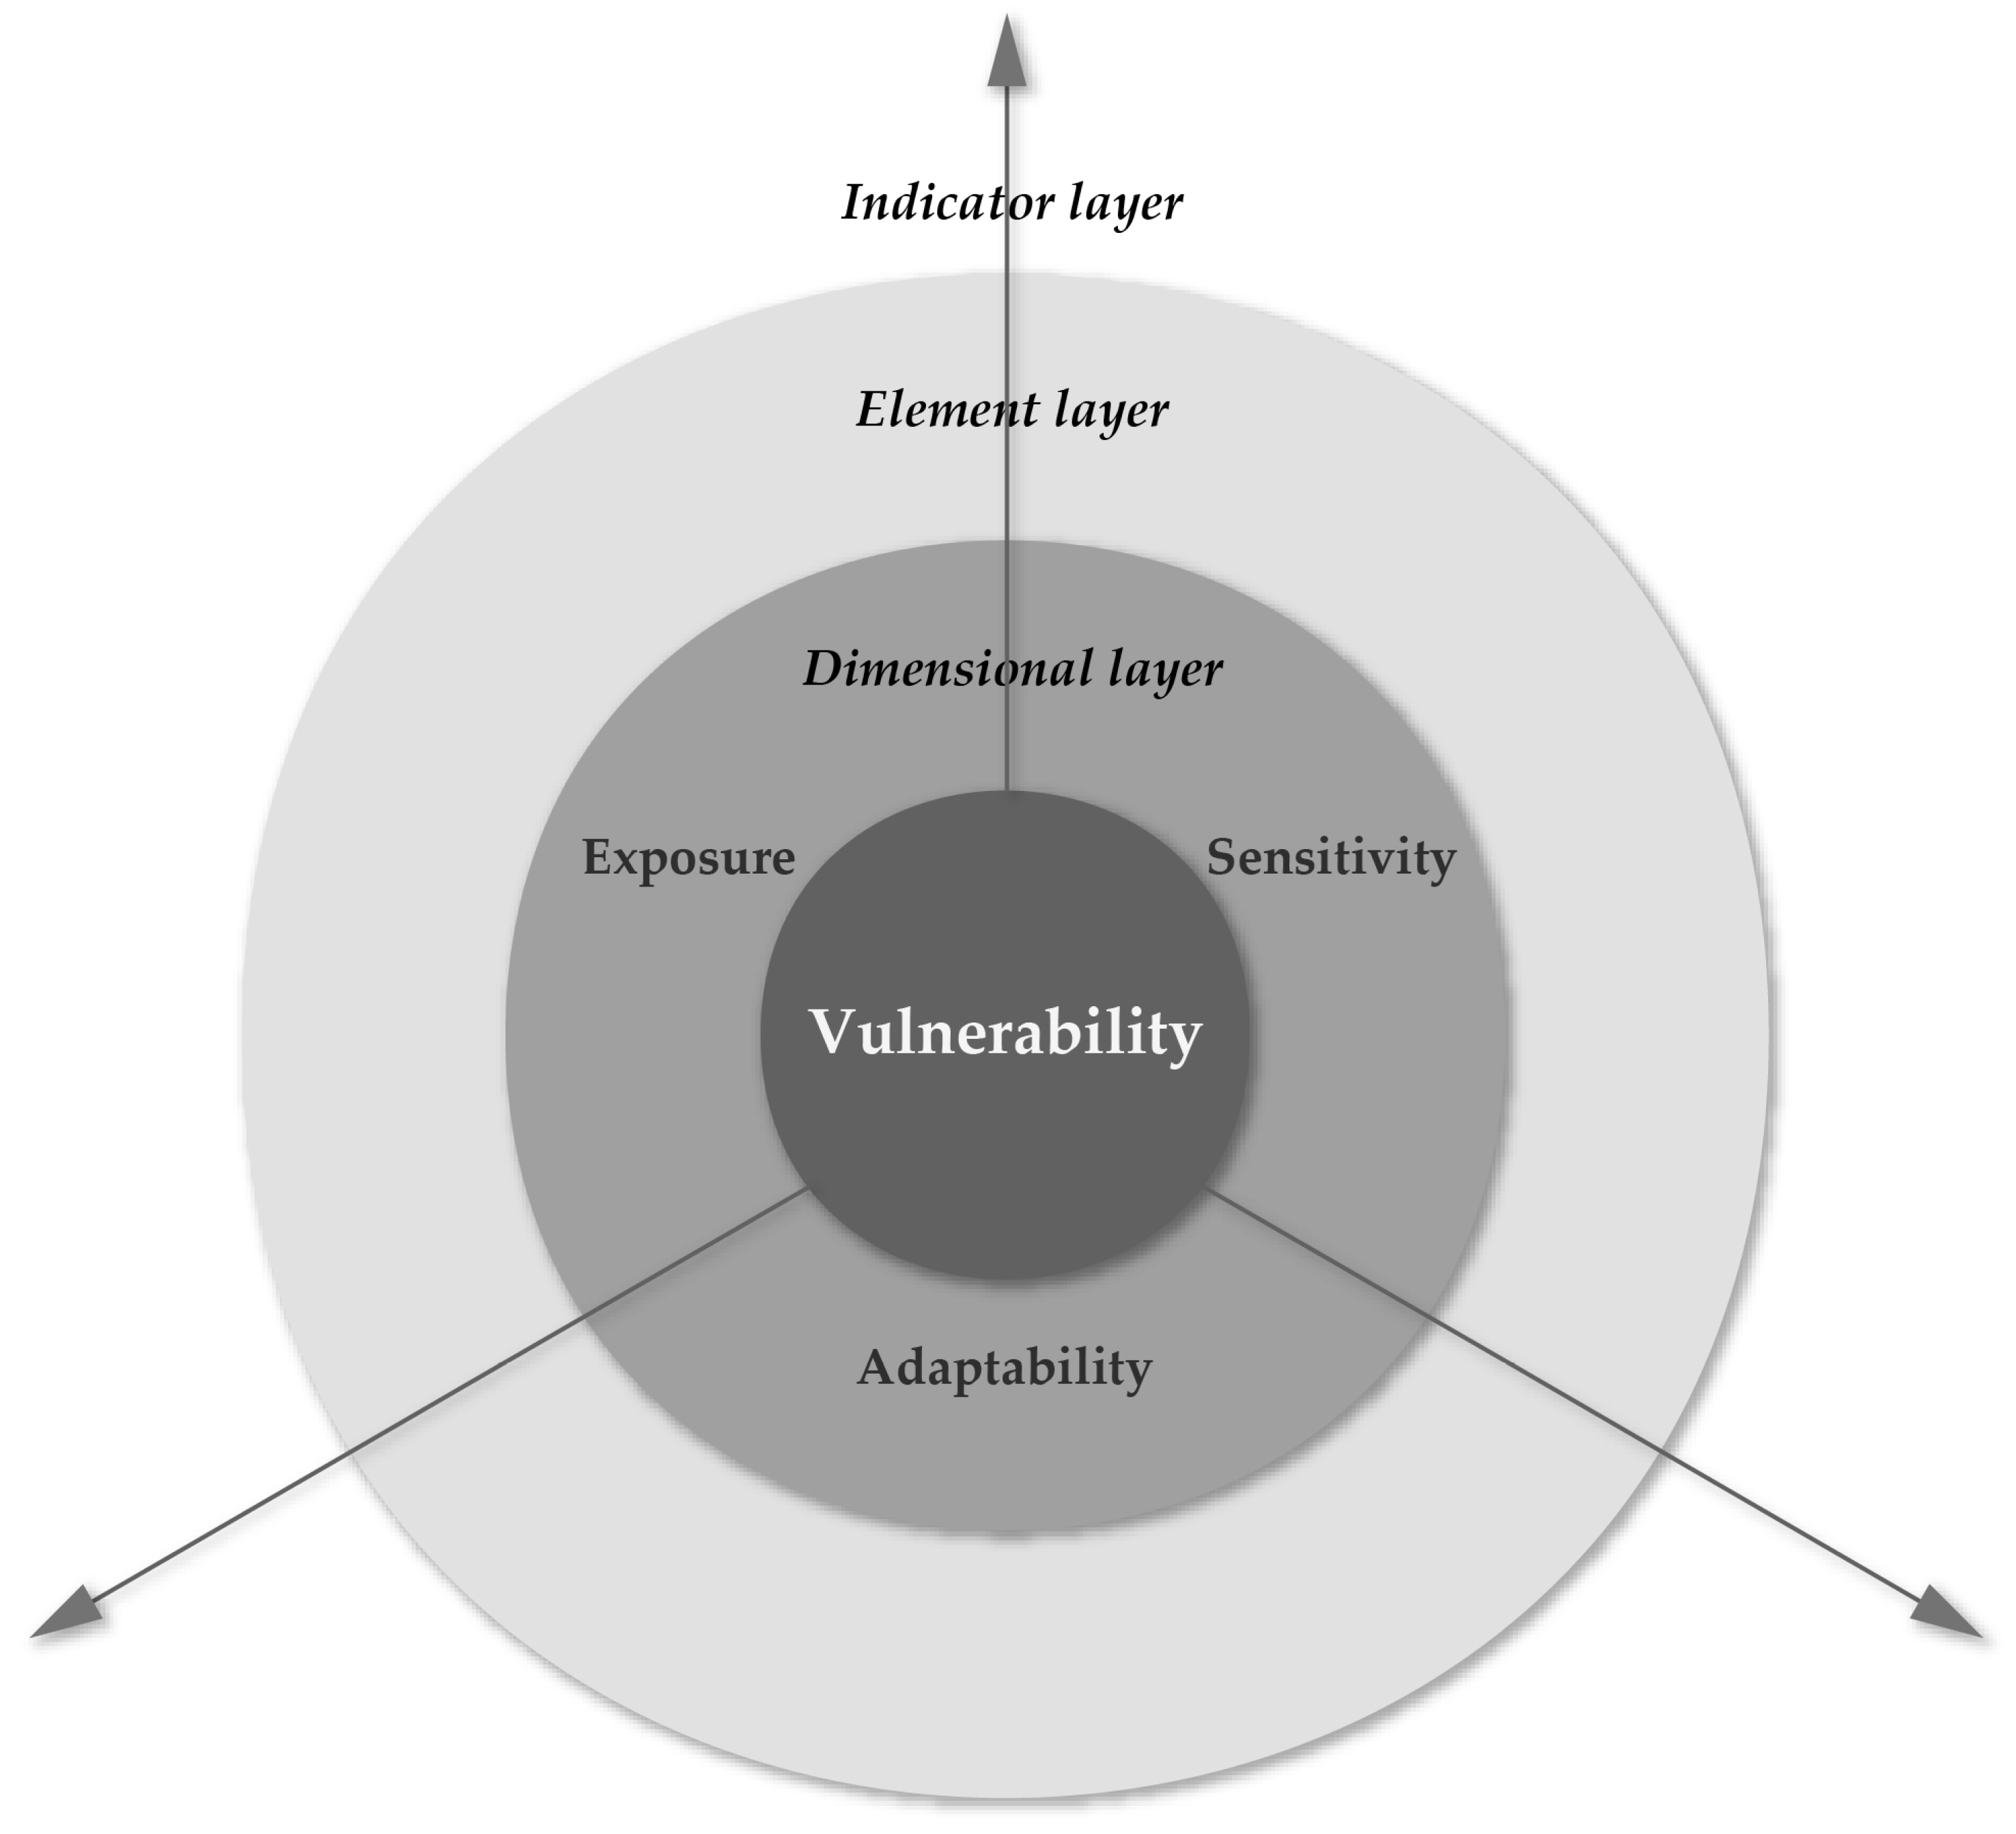
2.3.1. VSD Integration Framework and SERV Vulnerability Model

Uncertainties and ambiguities are frequently encountered in conventional approaches to risk assessment when forming evaluation criteria [20,47]. Addressing this, the VSD model, influenced by the comprehensive framework of the U.S. Public Space Plan [24], categorizes vulnerability into three facets: exposure, sensitivity, and adaptability. This division allows for the wholesale delivery of a comprehensive map showing how vulnerability has its many faces (spatiotemporally), with changes and characteristics that are expressed by sociohydrological susceptibility [48,49,50,51,52].
The VSD model has demonstrated its effectiveness as a methodology for conducting vulnerability assessments, attributed to its robust design and structure. The model exhibits the following key features: (1) Three-dimensional assessments: VSD emphasizes exposure, sensitivity, and adaptability, maintaining clear distinctions and a strict hierarchy of data evaluation [17] (criterion layer—element layer—indicator). Refer to Figure 3, which synthesizes the various aspects of this organizational network, providing a comprehensive overview of the vulnerability of our human–environment system to specific hazards [24]. (2) Defined exposure units: VSD necessitates the explicit specification of potential hazards and consequences, discouraging superficial treatment in favor of detailed evaluation. Through the delineation of spatial and temporal scopes, VSD facilitates the identification and assessment of variations among exposure units across different locations and times [54,63]. (3) Scope delineation and adjustment: the model employs preliminary scope delineation in initial assessment stages, allowing iterative refinement and enhancement in subsequent evaluations [21,64]. This approach mitigates oversimplification and enhances assessment quality. (4) Comprehensive measurement: VSD accommodates both quantitative measures, such as precipitation differentials, and qualitative assessments, like political relations. This versatility enables the model to encompass a broad spectrum of data types [8,15]. These design elements collectively bestow upon VSD a comprehensive and adaptable framework that is crucial for effectively discerning subtle variances in vulnerability. Consequently, researchers can achieve a profound understanding of vulnerability traits in human–environment systems under diverse conditions.
Counteracting the constraints of earlier vulnerability studies, the SERV model amalgamates indicators from natural environments, socio-economic factors, spatial attributes, and location-specific criteria to evaluate regional vulnerability [53]. This integration forges a direct bridge between theoretical constructs and disaster risk studies, sidestepping the pitfalls of relying on generic data markers and tackling the concerns of spatial disparity and indicator dependency. The model emphasizes the selection of indicators that capture the interactive effects between sensitivity and adaptability, recognizing the connectivity among vulnerability components [25]. Importantly, the SERV model posits that vulnerability hotspots might not invariably overlap with exposure zones, shedding light on strategic resource allocation and adaptive strategy development at a regional scale. By recalibrating the perspective on spatial vulnerability determinants, the SERV model aids in the conception of bespoke disaster mitigation tactics and orchestrates their rollout [17]. Leveraging both the VSD framework and the SERV model, this research amplifies the precision and spatial relevance of vulnerability evaluation, propelling a deeper comprehension of water resource vulnerabilities.
The model incorporates three distinct dimensions for computation. The formula designated for static vulnerability calculation is presented below [25,53]:
V I = E I + S I + A I
E I i = j = 1 m r E , i j ω E , j S I i = j = 1 m r S , i j ω S , j A I i = j = 1 m r A , i j ω A , j
where W V I i , E I i , S I i , and A I i are the water resource vulnerability, exposure, sensitivity, and adaptive capacity indices for the first evaluation target, respectively. E I i , S I i , and A I i can be obtained by multiplying the standardized values of the indicators by the corresponding indicator weights; r E , i j , r S , i j , and r A , i j are the standardized values of the indicators in the three dimensions; ω E , j , ω S , j , and ω A , j are the final weights of the different indicators in the different dimensions.

2.3.2. Selection of Water Resource Vulnerability Indicators

Informed by the VSD model, this research constructs a water resource vulnerability assessment model, distinguishing it into three pivotal dimensions, exposure, sensitivity, and adaptability [24], each encapsulating its unique attributes and nuances. The focal point of this water resource vulnerability assessment is the intertwined system of water resources and socio-economic variables. Perturbations mainly stem from climate change and human-induced activities [17,52]. Specifically:
(1)
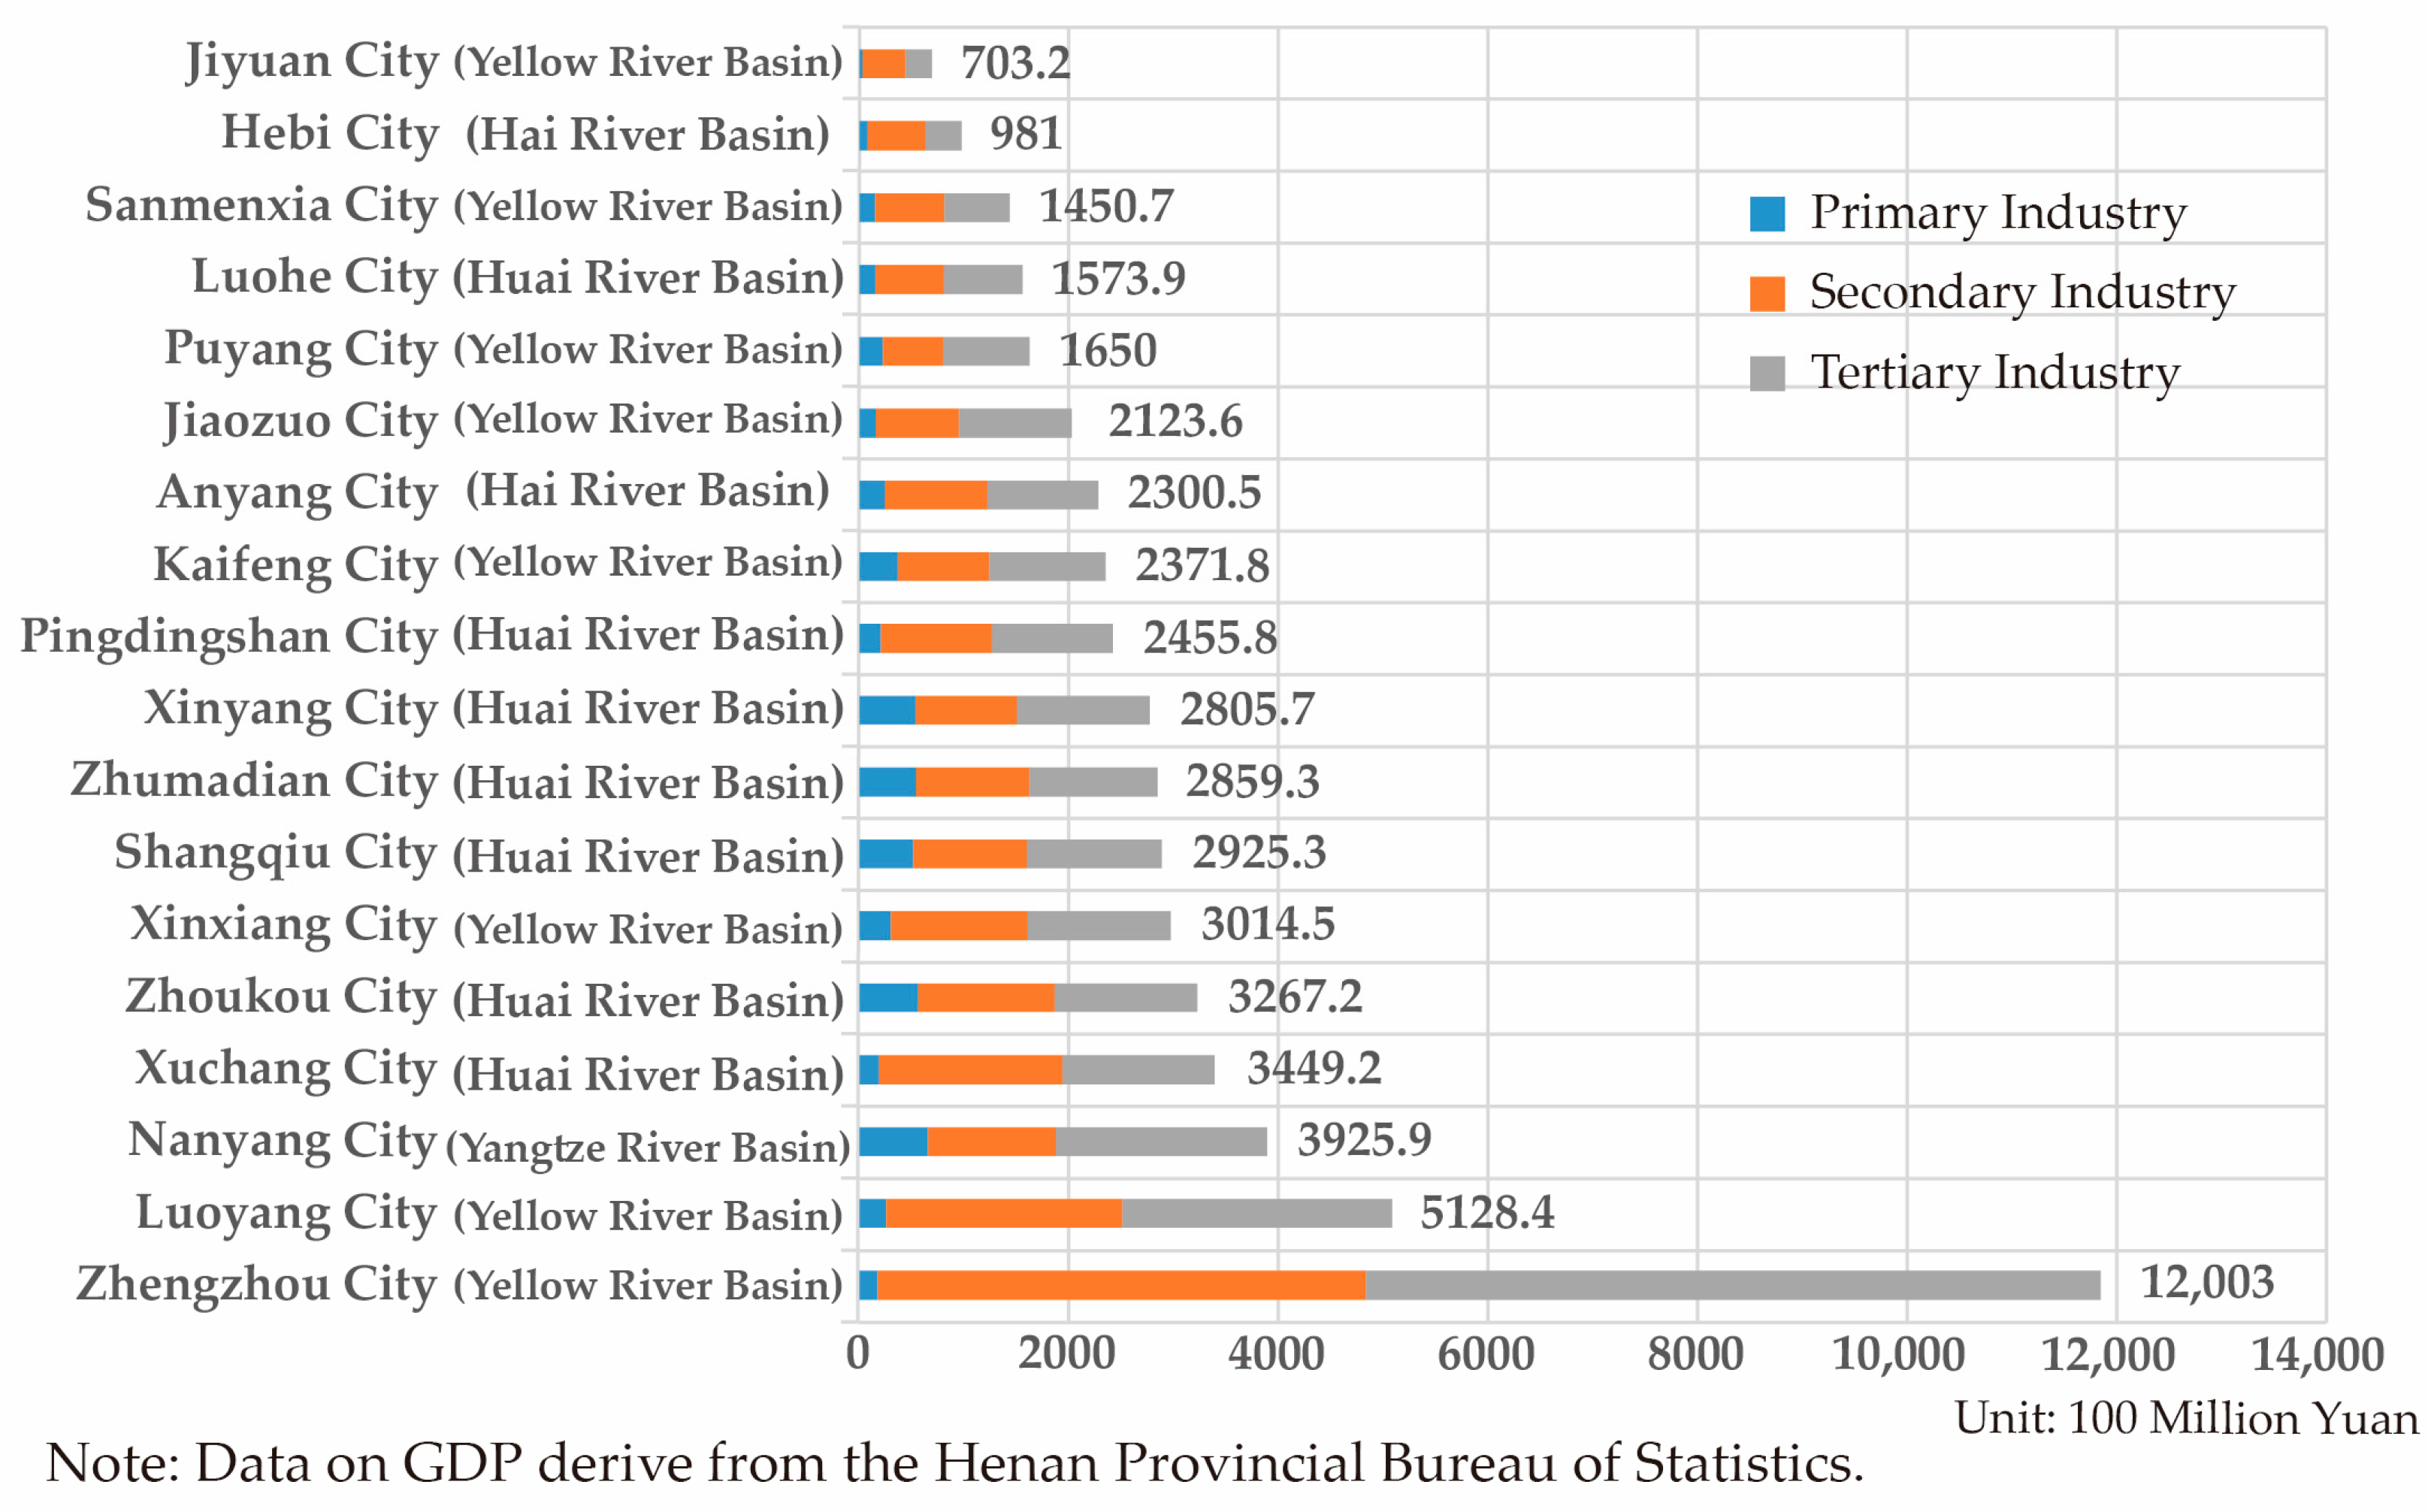
Exposure: This dimension captures the extent to which a system is exposed to external perturbations or stresses [17,63,65]. Elevated exposure intensifies the propensity for water-centric adversities. Within the designated study region, primary sources of exposure are rooted in human endeavors, epitomized by factors such as population dispersion, industrial alignments, and land utilization patterns.
(2)
Sensitivity: This gauges the potential impact, be it detrimental or beneficial, on a unit due to stressors [54,66]. The magnitude of such effects is contingent upon the nature of exposure and intrinsic system attributes. In the examined region, sensitivity predominantly emerges from aspects like water insufficiency, contamination, and recurrent water-centric calamities. These are intrinsically linked with natural resource circumstances and climatic shifts.
(3)
Adaptability: This dimension underscores the resilience and recuperative capacity of a water resource system when confronted with stressors and their subsequent repercussions [15,21,64]. Enhancement in adaptability can be channeled through deliberate human interventions or adaptive stewardship. Components such as recuperation duration, the scope of recovery, and rate of restoration typify adaptability. Within the study’s purview, factors like socio-economic progression and investments towards ecological endeavors offer insights into adaptability [8].
A heightened degree of exposure and sensitivity escalates vulnerability scores, signifying augmented vulnerability. Conversely, robust adaptability is indicative of diminished vulnerability scores and consequential vulnerability reduction [25,53]. In light of principles emphasizing the scientific rigor and impartiality of indicator selection, combined with data accessibility, a compendium of 32 indicators was curated to establish the water resource vulnerability metric for the quartet of river basins in Henan Province (refer to Table 1) building on extant scholarly contributions.
To guarantee data availability, it is essential to perform an effectiveness test for the indicators. Given the prevalent high correlation among socio-economic data, this study employs the commonly used redundancy degree (RD) [67,68] to assess the independence and redundancy of the indicators. The formula for calculating the RD is as follows:
R D = i = 1 n j = 1 n r i j n n 2 n
Lower values of RD indicate reduced redundancy and increased independence among indicator data. Given that socio-economic data relationships in empirical research are not entirely separable, an RD value less than 0.5 is deemed satisfactory for research purposes. Upon calculation, the RD of the selected indicators in this study falls within the range of 0.128 to 0.150, meeting the criterion of RD < 0.5. Consequently, this suggests the data are suitable for use.

2.4. Data Source and Standardization

2.4.1. Data Source

To guarantee data quality and availability, this study utilized information obtained from the Henan Province Water Authority [69] and the Henan Province Bureau of Statistics [70]. The data for this research are bifurcated into two segments: water resource data and socio-economic metrics. The former were sourced from the “Henan Province Water Resources Bulletin” spanning 2000–2020, while the latter were derived from the “Henan Statistical Yearbook” covering 2001–2021. Data not readily available underwent computations or extrapolations using relevant formulas or connotations.

2.4.2. Data Standardization

Due to the varied dimensionality of indicator data, comparability was impacted. To ensure data consistency in the vulnerability assessment of water resource systems, standardization through dimensionless processing was required. Accordingly, the min–max method [71,72] was utilized. It is crucial to acknowledge the distinct effects of positive and negative indicators on the evaluation outcomes. For positive indicators, a larger value indicates a higher degree of WRV, whereas for negative indicators, the relationship is inverse.
The processing for positive indicators is as follows:
r i , j = x i , j min x i , j max x i , j min x i , j
The processing for negative indicators is as follows:
r i , j = max x i , j x i , j max x i , j min x i , j

2.5. Determination of Weights Using Combined Weighting Method

In this study, the VSD model was employed to select three criteria, ten factors, and thirty-two indicators. Given the varying significance of each indicator, it became imperative to assign appropriate weights. To facilitate this, we integrated the analytic hierarchy process (AHP) with the entropy weight method (EWM) [54]. Through this approach, both subjective and objective weights were computed. The comprehensive weight was then derived by invoking the principle of minimum information entropy, aligned with the Lagrange mean value theorem.
It is crucial, during the weighting of indicators, to account for the inherent statistical patterns and the authoritative significance of the data. By amalgamating AHP and EWM, which synergizes subjective with objective weighting strategies, the constraints associated with singular weighting methodologies are surmounted. This conjoined weighting technique is termed the combination weighting method. The equation to determine the combined weight is presented subsequently [55,56].
ω j = φ j μ j j = 1 m φ j μ j
In the equation, φ j and u j represent the weights assigned to the j-th indicator, derived using the AHP and the EWM, respectively. The term ω j denotes the comprehensive weight for the j-th indicator.

2.6. Spatial Feature Analysis Using Standard Deviational Ellipse

The standard deviational ellipse (SDE) stands as a spatial statistical technique shedding light on the multifaceted characteristics of geographic features from both a comprehensive and spatial standpoint. In the context of this study, we deployed the SDE to delineate the spatial distribution and directional traits of WRV across the four prominent river basins within Henan Province [58]. The SDE critically assesses the holistic spatial distribution features and their spatiotemporal evolution via its foundational elements, encompassing distribution range, centroid, major axis, minor axis, and orientation angle [57]. The SDE method illustrates the evolutionary trend and directional pattern of the spatial distribution of WRV. By analyzing the centroid movement and variations in the orientation angle of the SDE, a more intuitive comprehension of the spatial dynamic characteristics of WRV is attained. This facilitates the identification of underlying causes and trends of changes.
The distribution range within the SDE encapsulates the degree of concentration or dispersion inherent to a geographic feature’s spatial spread [59]. The centroid serves as the gravitational midpoint of this distribution, pinpointing the relative locus of the feature’s spatial distribution. Conversely, the major and minor axes demarcate the extent of feature dispersion along the primary and secondary trajectories, respectively. A pronounced discrepancy between these axes signifies a marked directional attribute within the geographic feature. The orientation angle elucidates the predominant directional trend of development.
The standard deviational ellipse is given as [58]:
S D E x = i = 1 n x i x ¯ 2 n
S D E y = i = 1 n y i y ¯ 2 n
where x i and y i are the coordinates for feature i , x ¯ , y ¯ represents the median center for the features, and n is equal to the total number of features.

2.7. Factor Analysis Using GeoDetector

Geographic phenomena, characterized by their spatial variations, are frequently modulated by either natural determinants or socio-economic conditions [61]. The quest to understand the underlying mechanisms of their genesis and to scrutinize the contributing factors is of paramount importance. While classical statistical methods offer insights, GeoDetector stands out, addressing the pervasive concerns of multicollinearity and endogeneity within these factors. Unlike traditional statistical models that confine themselves to multiplicative interactions, GeoDetector innovatively leverages spatial overlays to juxtapose the metrics of individual factors against their compounded values. This approach not only renders it resilient to multicollinearity but also adeptly mitigates the endogeneity issue [60,62].
Within the scope of this investigation, our emphasis lies in harnessing GeoDetector’s factor detection modality to dissect the variables at play. Factor detection aims to illuminate the explanatory prowess of these variables over the spatial fluctuation contours of the dependent variable, quantified through the q value. GeoDetector effectively evaluates the explanatory power of various factors on WRV, thereby identifying the key determinants influencing WRV. This analysis assists in discerning which factors are spatially critical, offering guidance to decision makers in prioritizing aspects for consideration. The computational schema for the q value is delineated below [61]:
q = 1 i = 1 n N i σ i 2 N σ 2
where n is the stratum count in the x-layer, N is the number of mapping units in the study area, σ i 2 is the variance of R in the ith stratum, and σ 2 is the variance of R in the entire area. Large values of the index q indicate a large contribution of the x-layer to landslide occurrence.

3. Results

3.1. Spatiotemporal Characteristics of WRV in the Four Basins

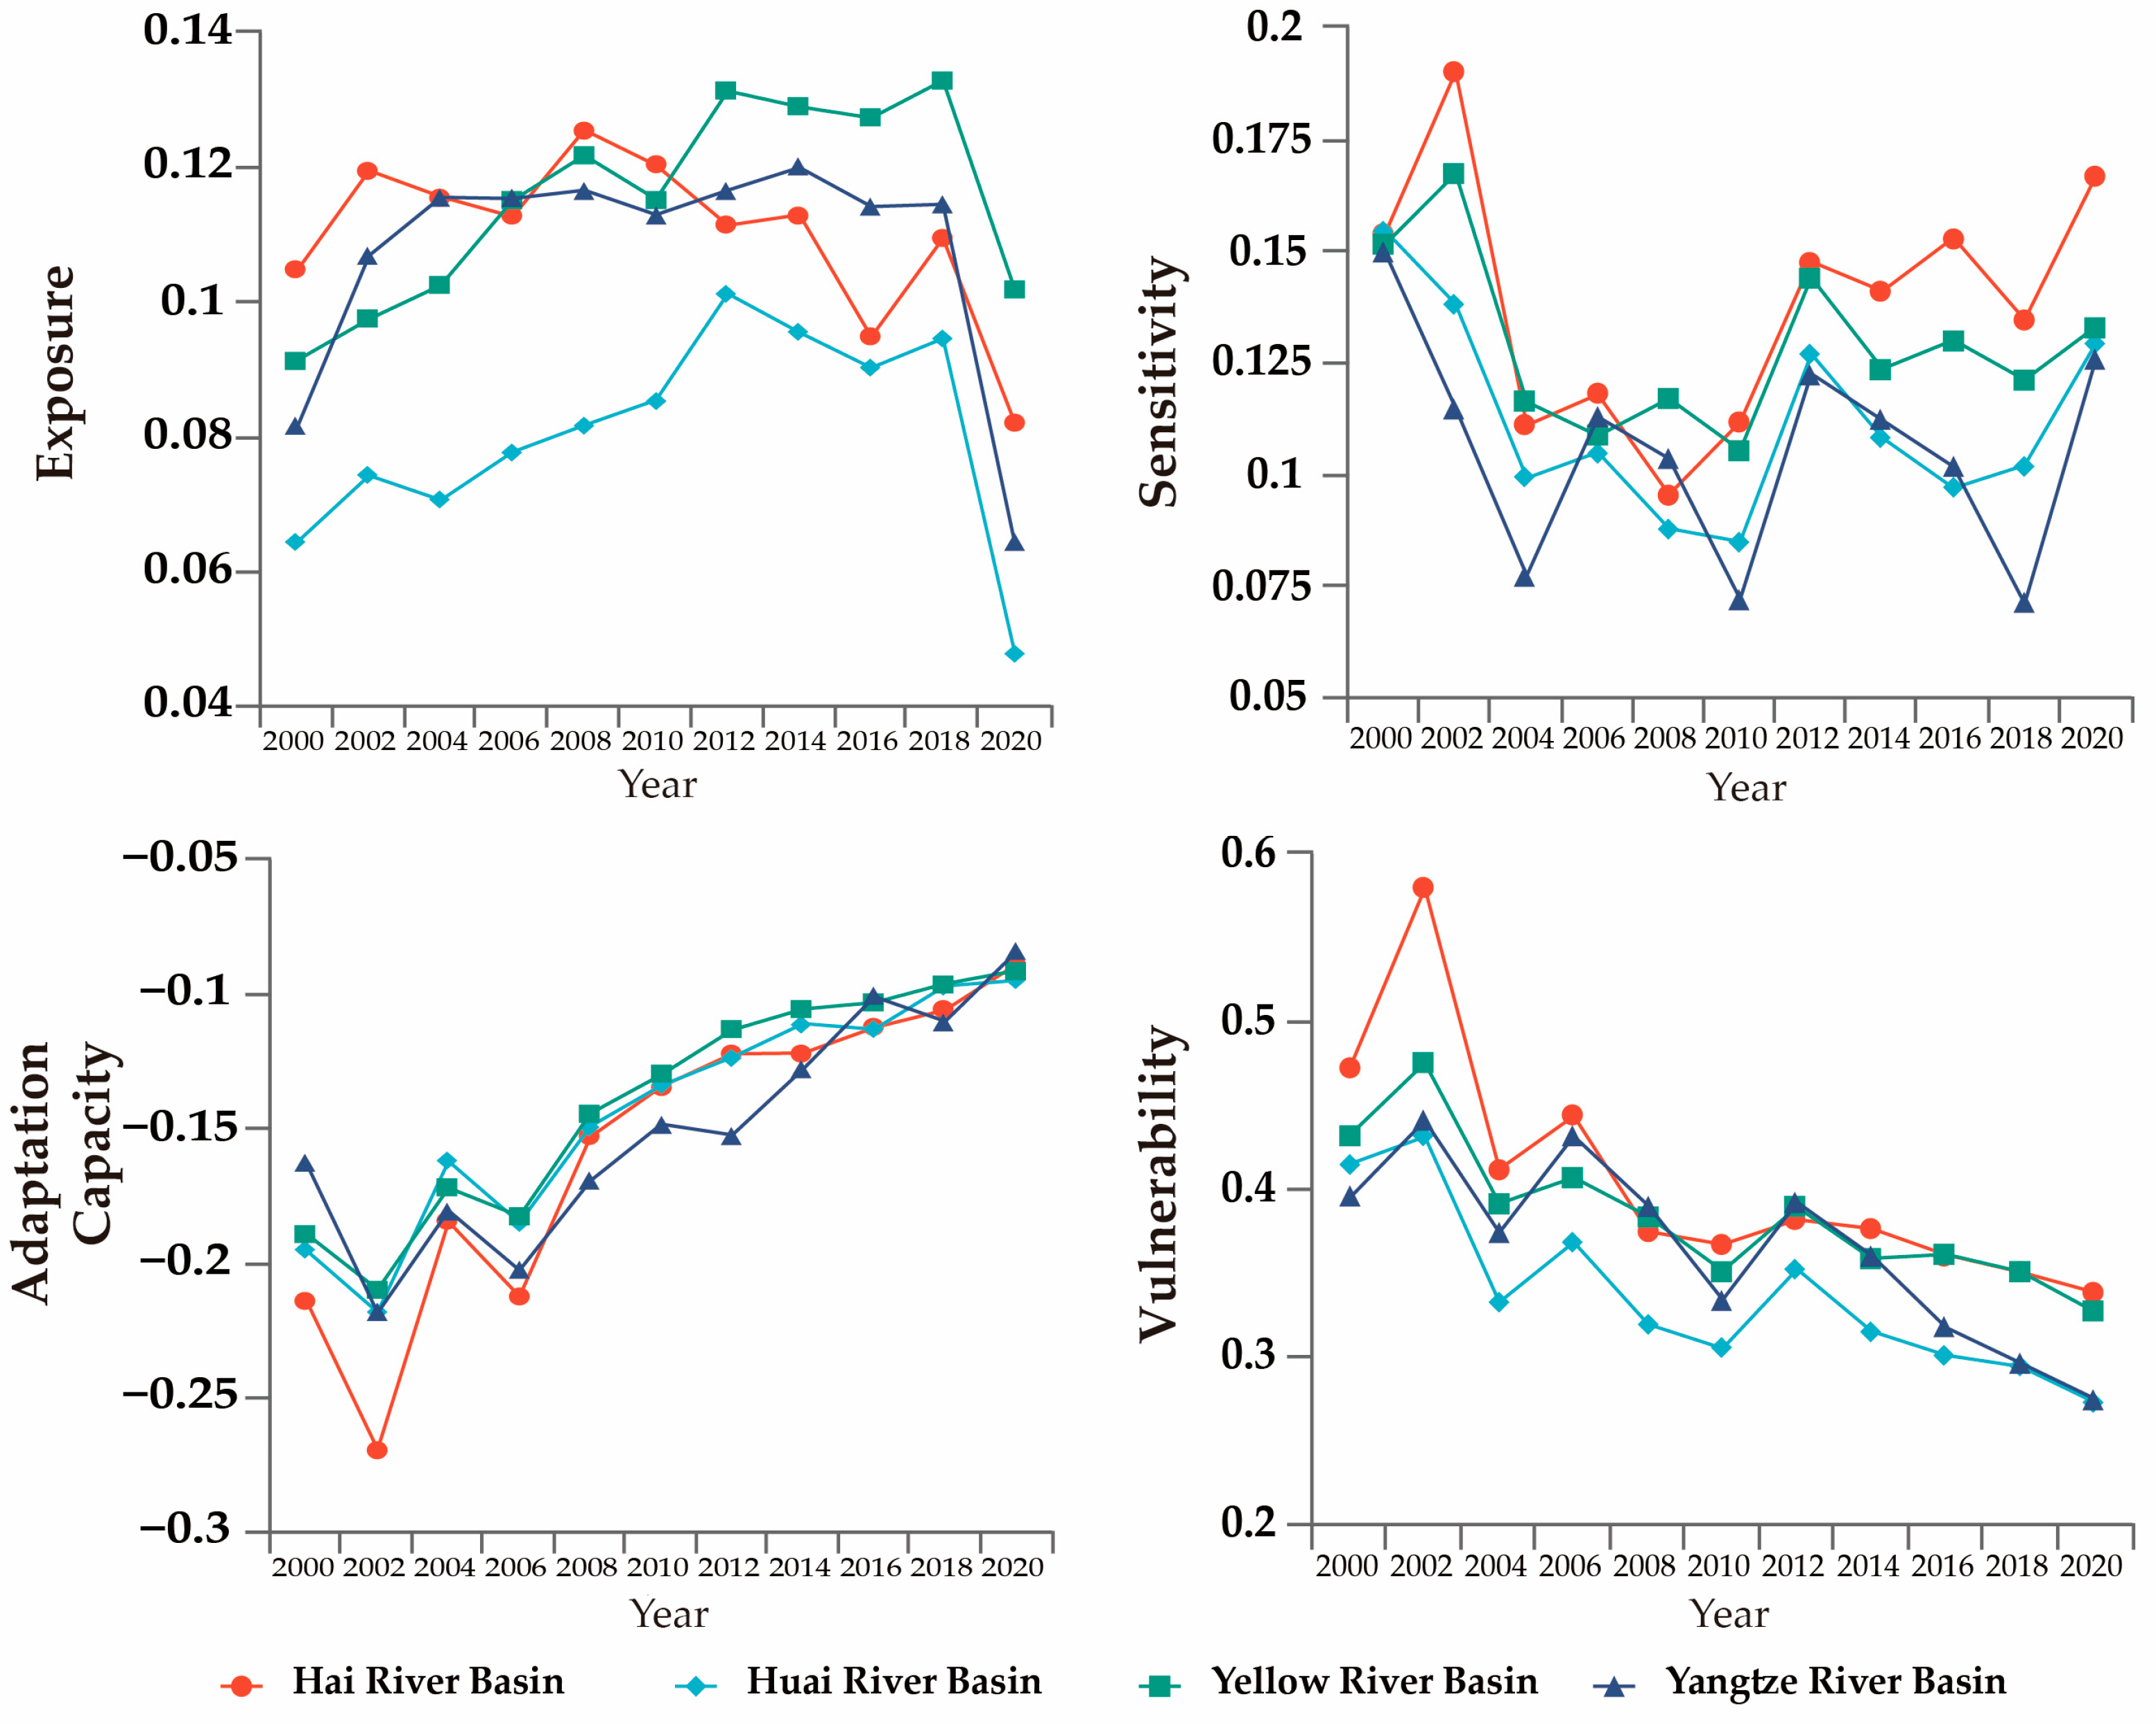
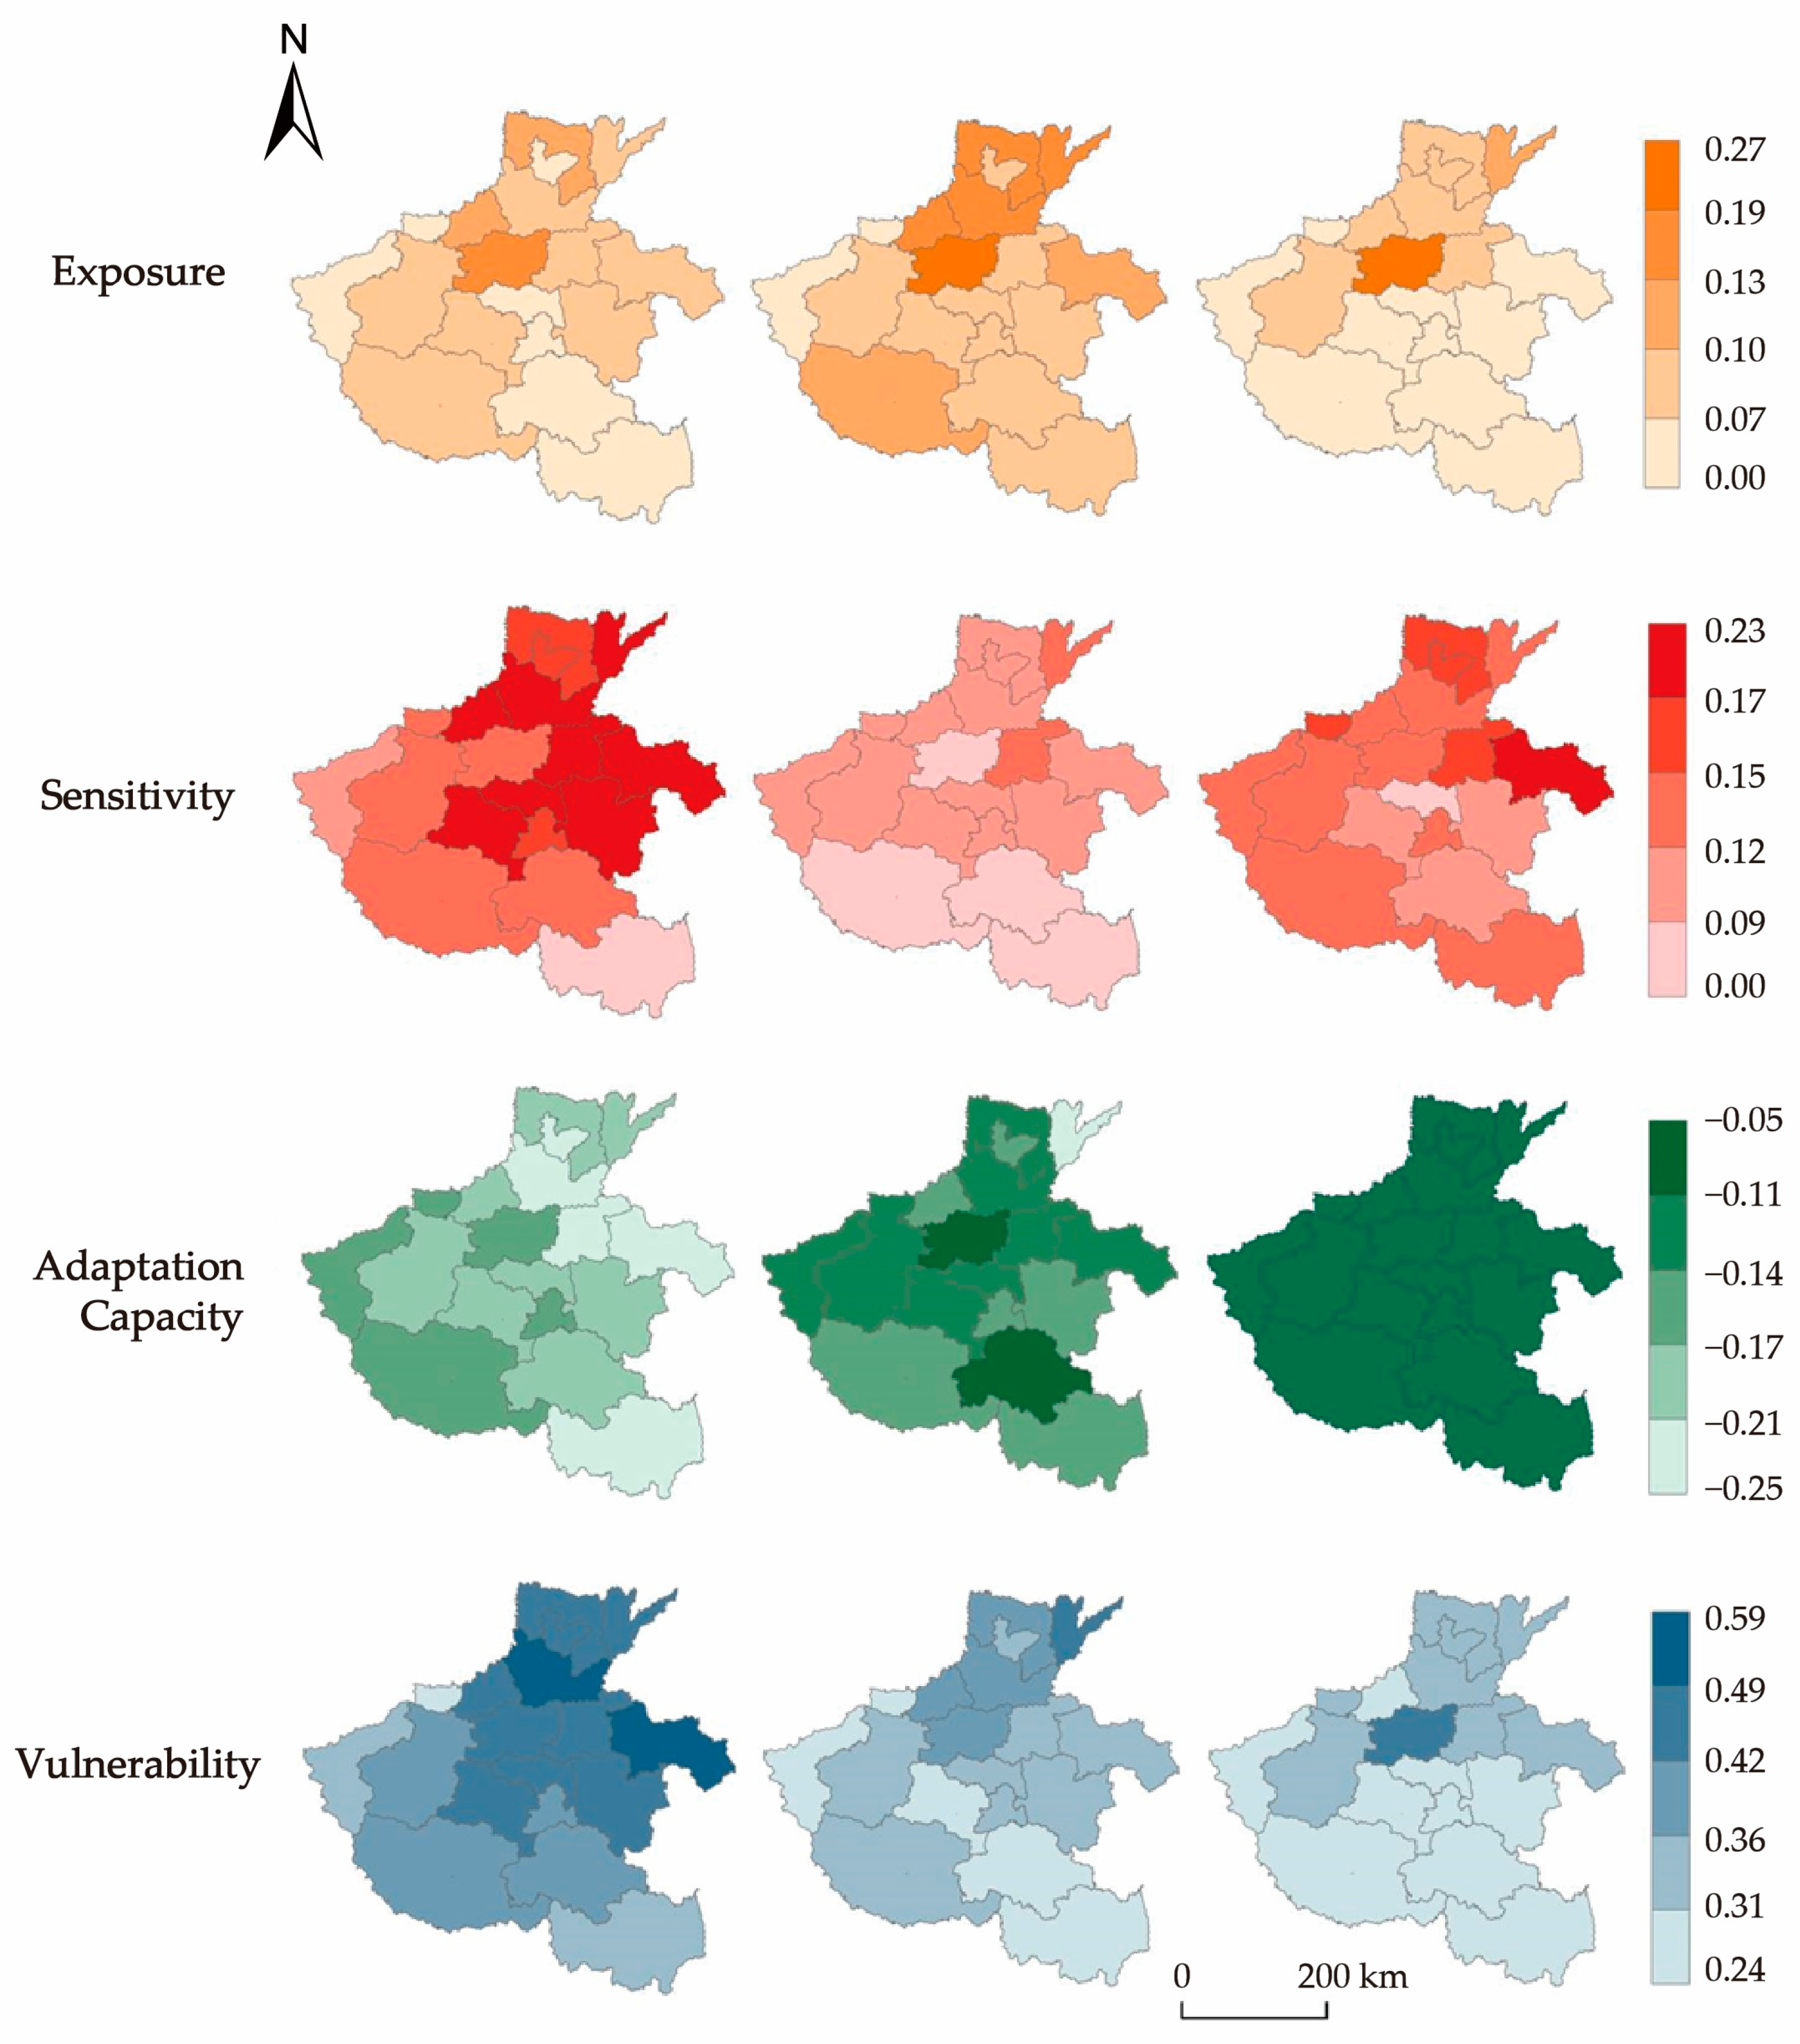
3.1.1. Spatiotemporal Changes in the Exposure, Sensitivity, Adaptive Capacity, and Vulnerability Index of WRV in the Four Basins

From 2000 to 2018, the exposure index of the four river basins exhibited a fluctuating upward trend. Notably, the Yellow River basin achieved the highest exposure index value of 0.1313 in 2012, surpassing all other basins throughout the study period. From 2018 to 2020, the exposure markedly declined in all four river basins, reaching their lowest values in 2020. Precisely, the Huai River basin exhibited the lowest exposure, measuring 0.0478. Sensitivity experienced an initial decrease from 2000 to 2004, followed by intermittent fluctuations until 2020. Specifically, the Hai River basin experienced the most substantial fluctuation, while the Yellow River basin had the least. The four river basins exhibited a pattern of initial increase followed by a decrease from 2000 to 2006, and after 2006, they consistently maintained an upward trend. The Hai River basin had the most significant increase, while the other basins experienced relatively similar increases. The vulnerability of each basin fluctuated from 2000 to 2020, indicating an overall decreasing trend. The Hai River basin recorded the highest average vulnerability value, and the average vulnerability rankings of the four basins were as follows: Hai River basin > Yellow River basin > Yangtze River basin > Huai River basin.

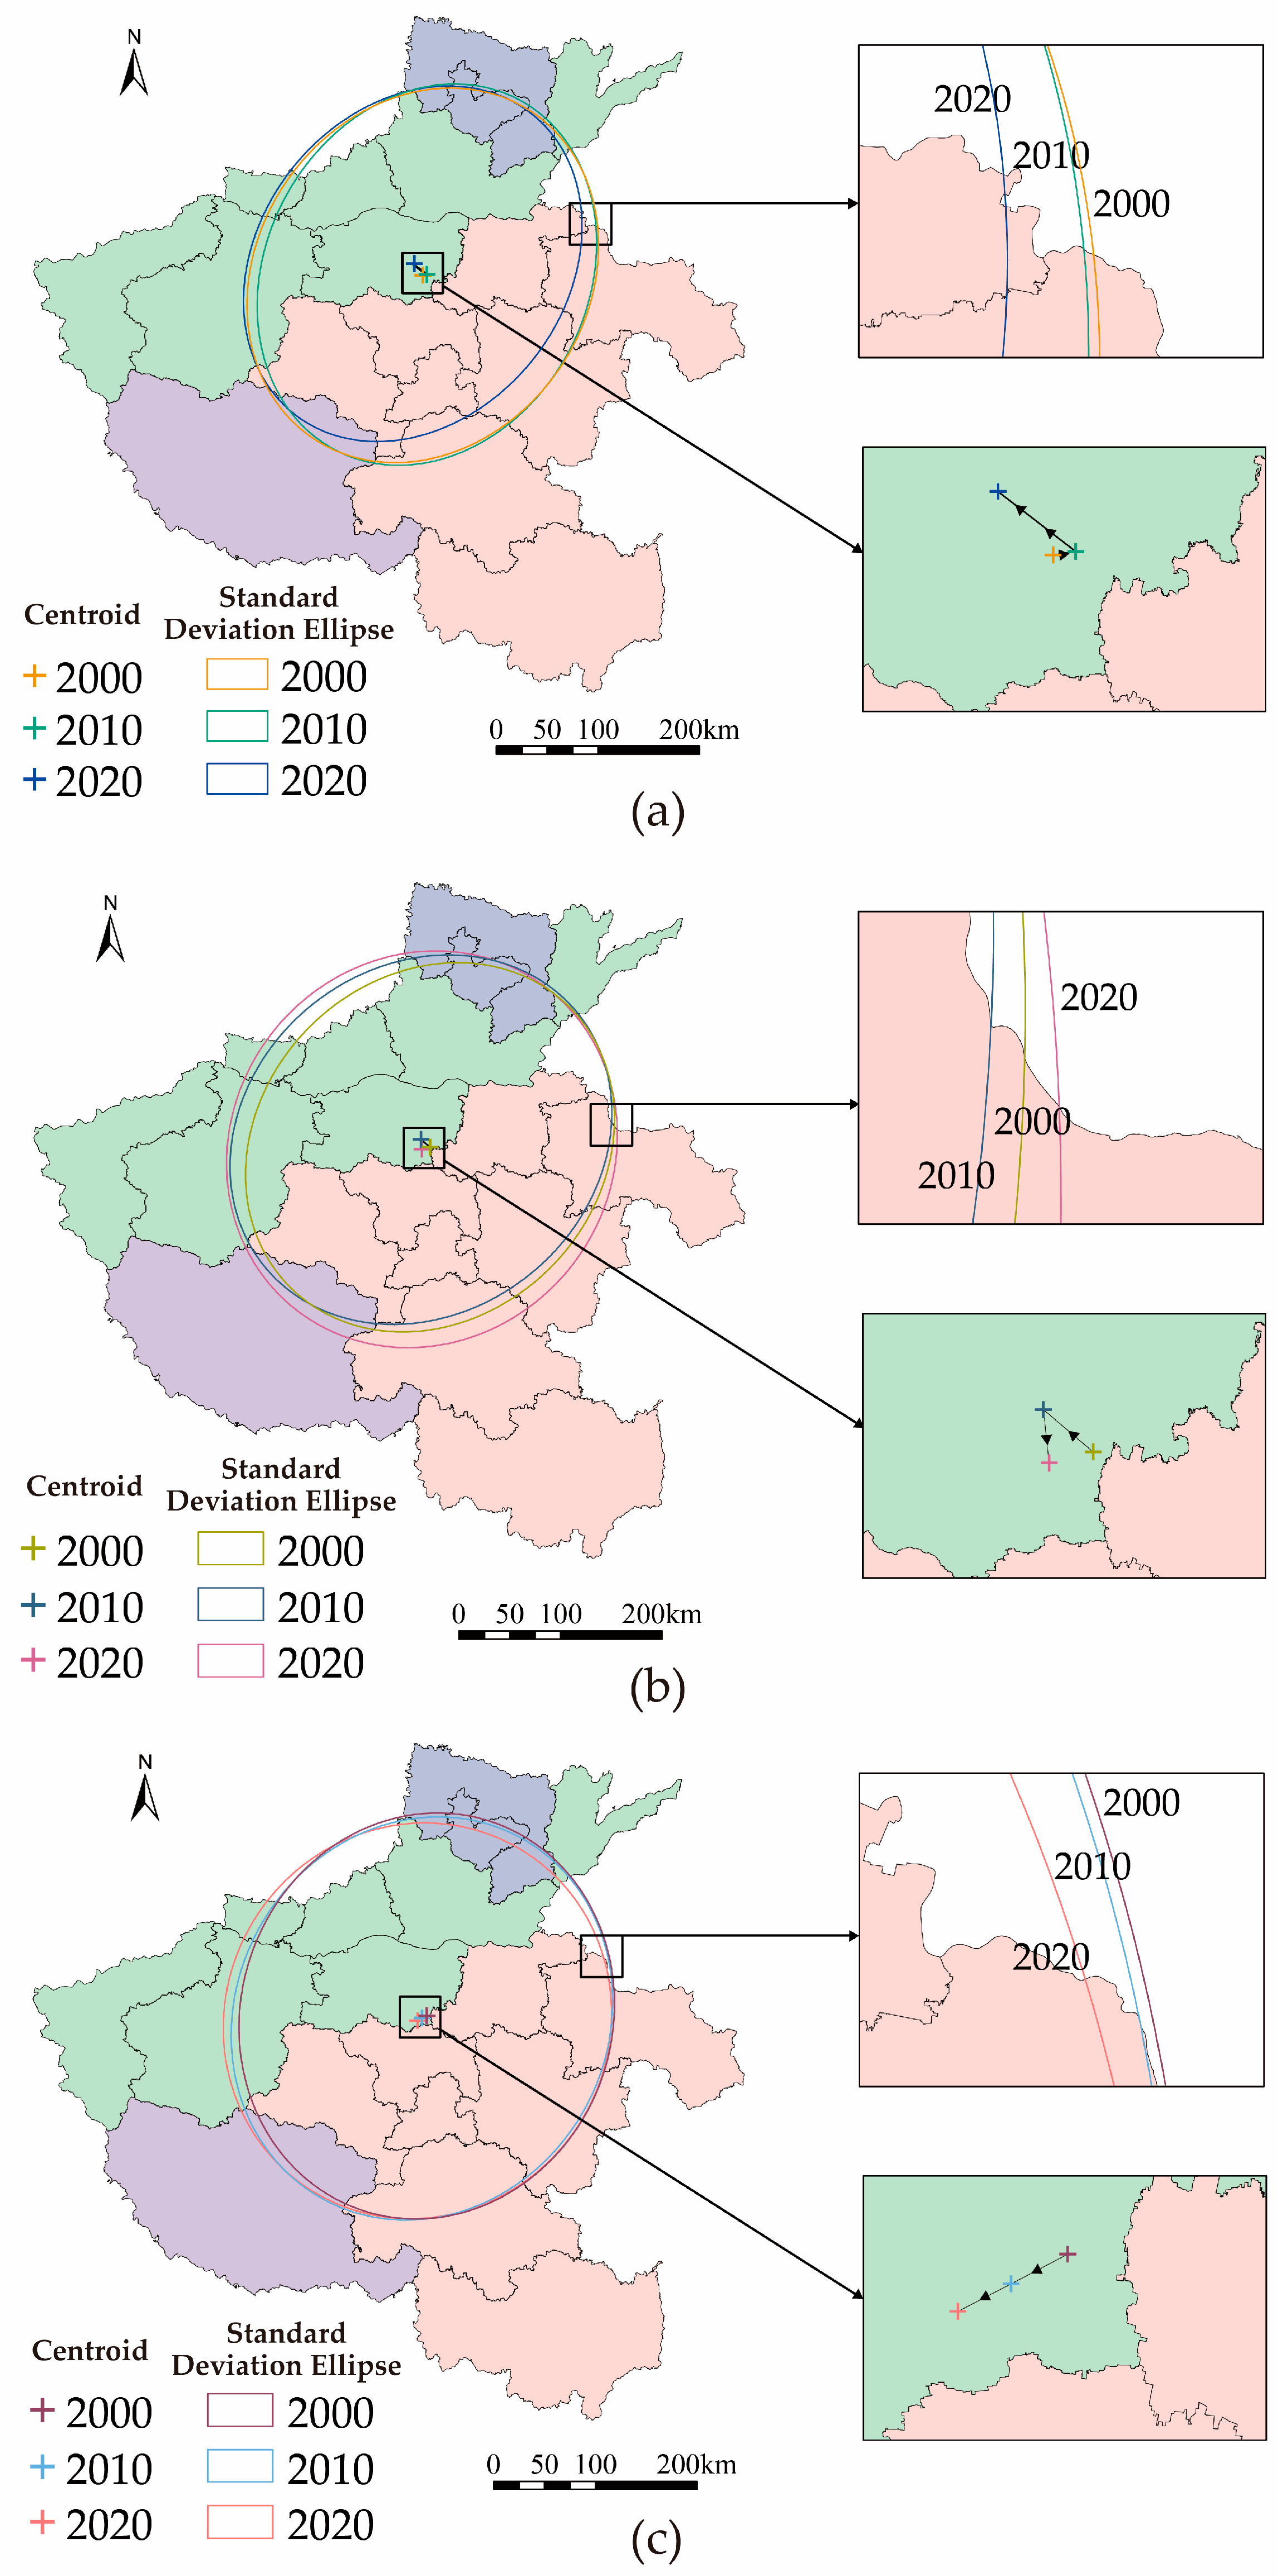
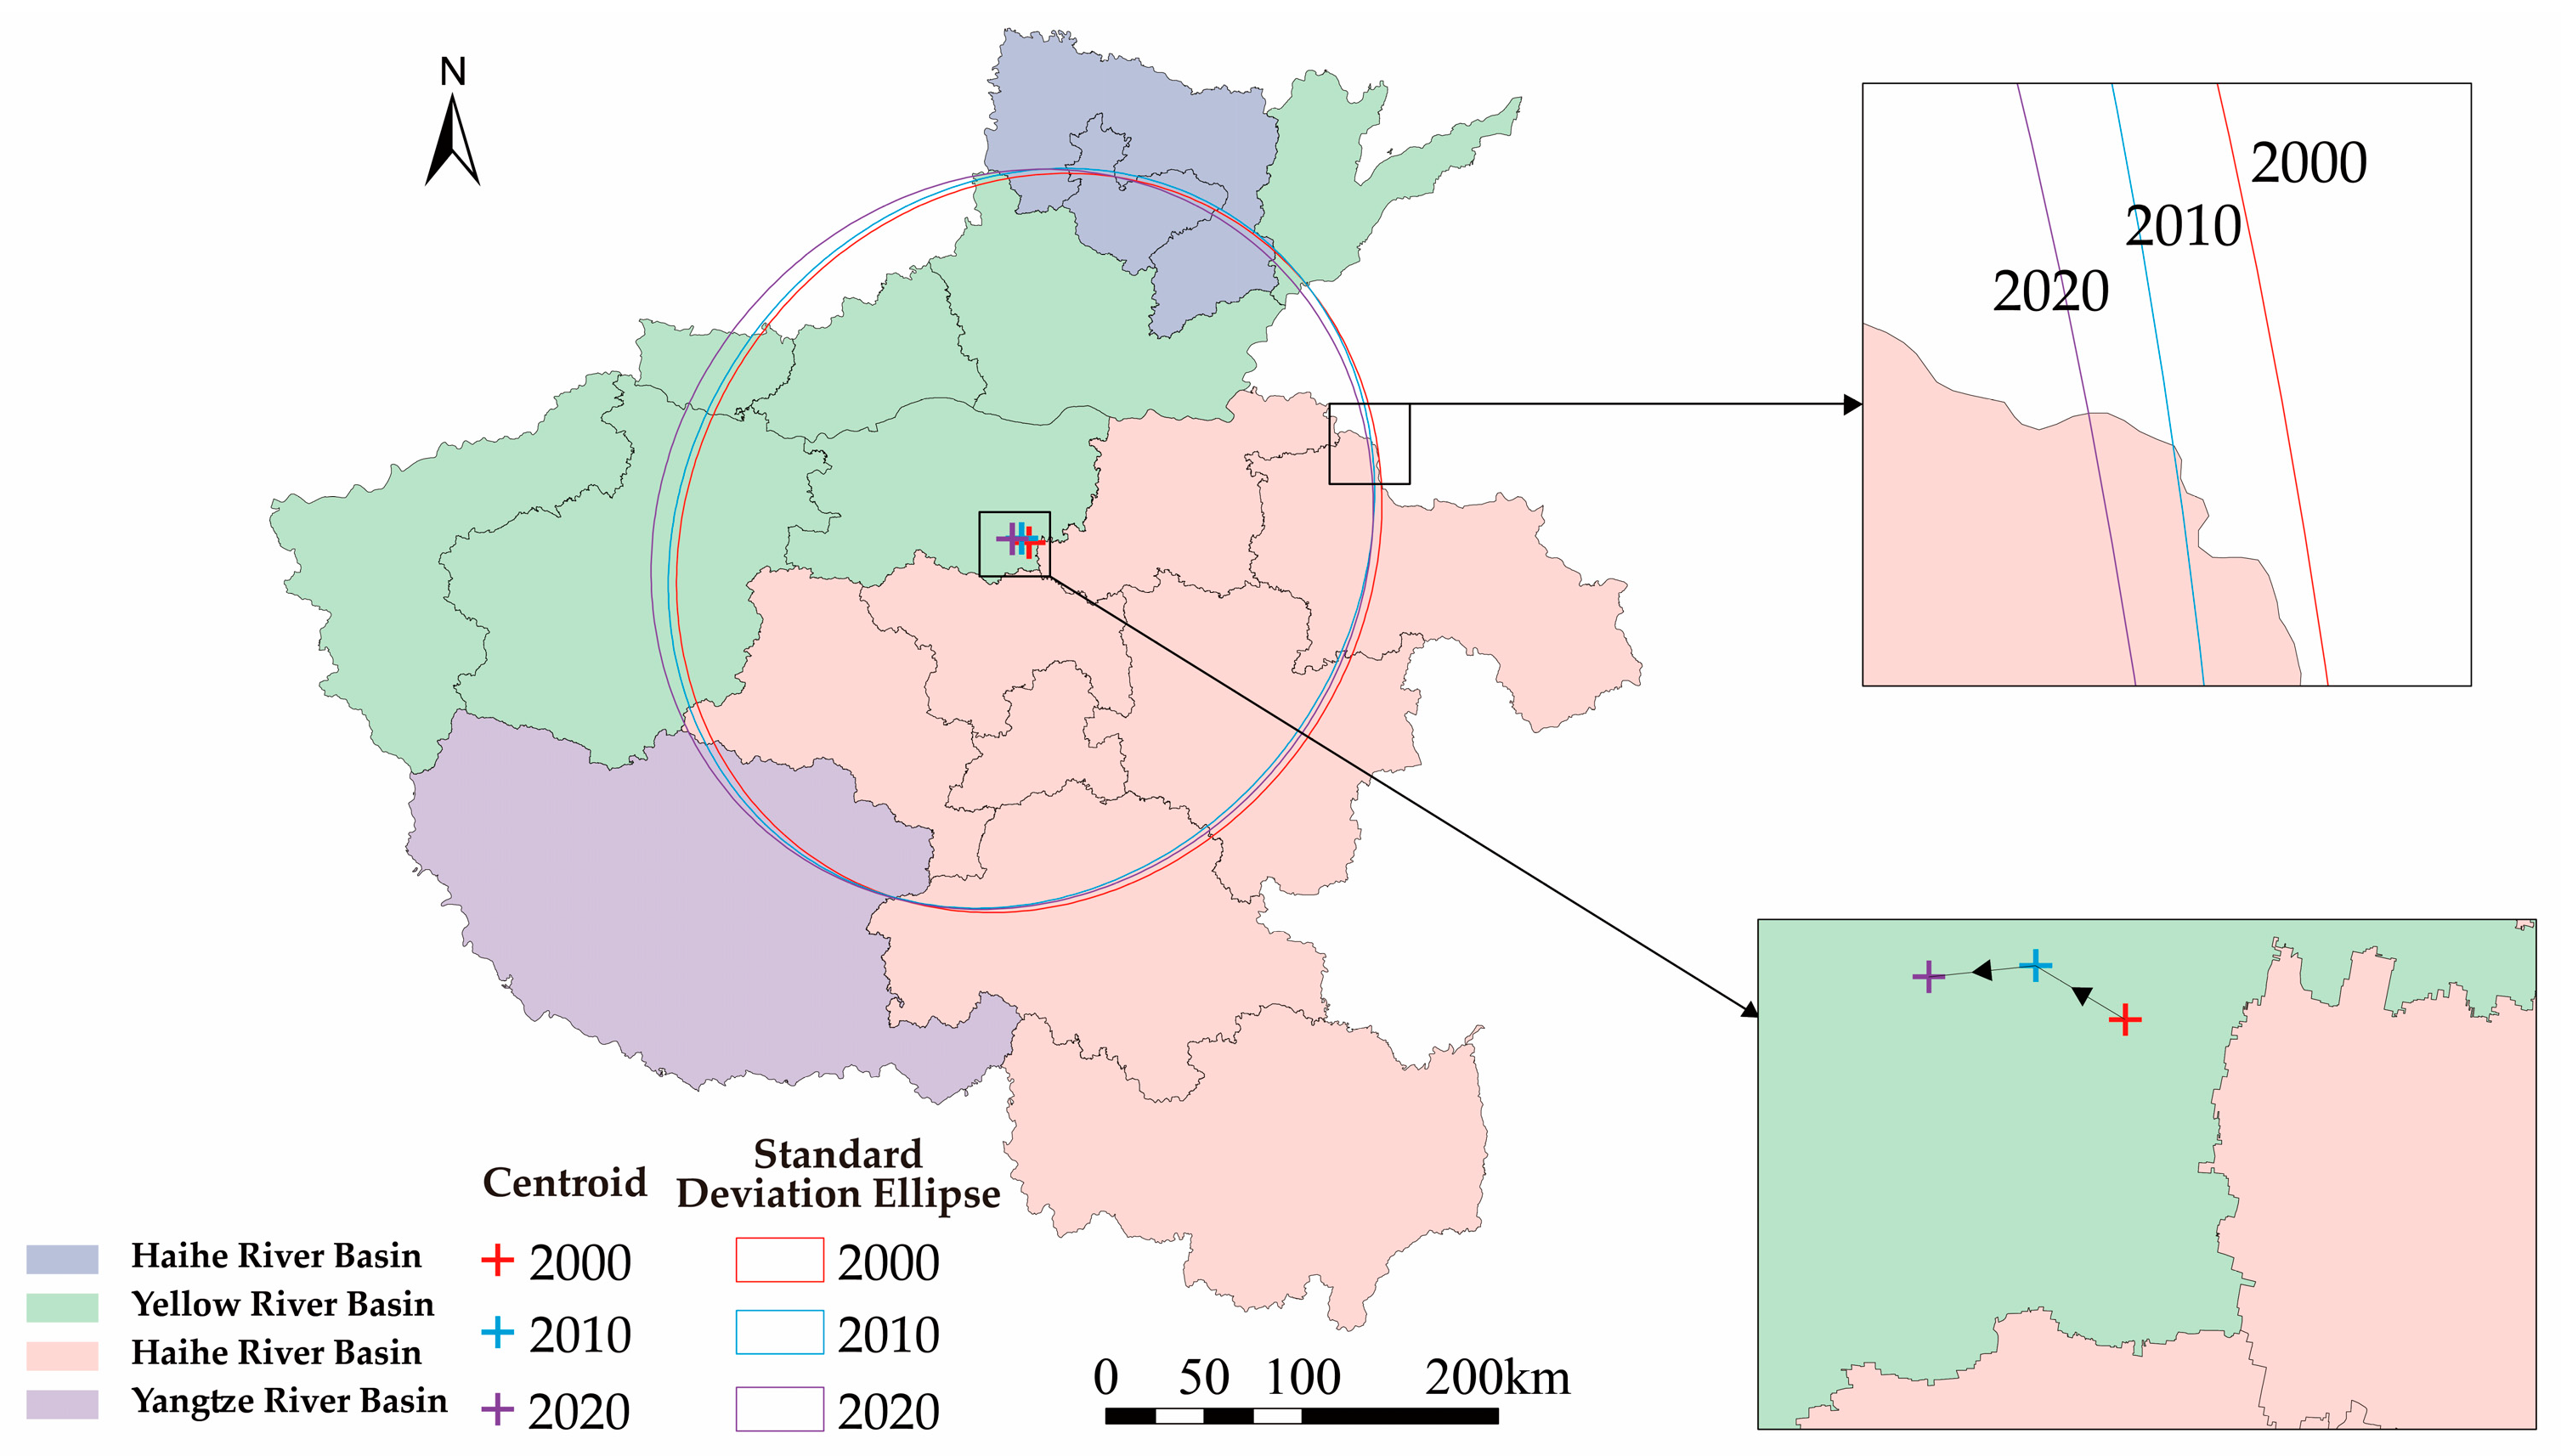
3.1.2. Spatial Variations in the Centroids of WRV’s Exposure, Sensitivity, Adaptive Capacity, and Vulnerability Index in the Four Basins

This study investigated the temporal evolution characteristics of water resource vulnerability within Henan Province’s four river basins. Analyses focused on representative years: 2000, 2010, and 2020. Water resources systems across 18 cities in Henan Province were ranked according to their exposure, sensitivity, adaptability, and vulnerability into five categories: high, medium high, middle, medium low, and low. The gravity center standard deviational ellipse model was utilized to trace the center of gravity migration of these water systems for the aforementioned years (Table 2). In the context of WRV across these basins, “migration of centroid” denotes the directional movement and displacement of the centroid of water resource nodes [57,58]. This movement is quantified through a centroid-focused standard deviational ellipse, offering a perspective into the spatial vulnerabilities’ evolution. Figure 4 and Figure 5 details the temporal and spatial dynamics of the exposure, sensitivity, adaptability, and vulnerability of these water systems in the province’s four river basins. Correspondingly, Figure 6 and Figure 7 depict the migration trajectories of their gravity centers.
(a) Exposure: From 2000 to 2020, Zhengzhou City remained the gravitational center of water resource exposure across Henan Province’s four river basins. This center shifted 976 km westward and 1128 km northward. Table 2 illustrates the direction angle of the standard deviational ellipse for water resource adaptation capacity within these basins. The predominant orientation progressed from the north(east) to the south(west). Over the twenty-year span, the orientation angle consistently grew, transitioning from eastward to westward, aligning with the province-wide spatial pattern of exposure. Distinctly, the Yellow River and Hai River basins exhibited greater exposure spatial characteristics than the Huai River and Yangtze River basins. This discrepancy was pronounced in 2020, particularly in cities within the Yellow River basin, such as Zhengzhou, Jiaozuo, Xinxiang, Kaifeng, and Puyang, and Anyang City within the Hai River basin.
(b) Sensitivity: From 2000 to 2020, the centroid representing water resource sensitivity in the four river basins of Henan Province was identified in Zhengzhou City. This centroid migrated 784 km westward and 194 km southward. As detailed in Table 2, the orientation angle of the standard deviational ellipse representing water resource adaptation capacity in these river basins shifted from north(east) to south(west). Over the two-decade span, this angle consistently increased, transitioning from east to west, mirroring the province’s spatial trend of “high north to low south”. Such data underscore that the sensitivity in the Hai River and Yellow River basins surpasses that in the Yangtze River and Huai River basins.
(c) Adaptation capacity: Our analysis from 2000 to 2020 investigated the centroid of water resource adaptability across the four river basins of Henan Province. Originally positioned in Zhengzhou City, this centroid shifted 907 km westward and 474 km southward over the study period. The standard deviational ellipse for the adaptation capacity of water resources in these river basins exhibited a distribution transition from the northeast to the southwest. Between 2000 and 2020, there was a progressive increase in the orientation angle, shifting from east to west. This aligns with the spatial distribution characterized as “low northeast and high southwest”. Predominantly, regions demonstrating heightened adaptability were located in the Yellow and Huai River basins, with Zhengzhou, the provincial capital, standing out in particular.
From 2000 to 2020, the vulnerability index depicted a discernible spatial pattern characterized as “high northeast and low southwest” throughout the province (Figure 5). Notably, the Hai River basin and the Yellow River basin displayed pronounced vulnerability. Figure 7 delineates the standard deviational ellipse and the trajectory of the vulnerability centroid for water resources across the four river basins in Henan Province over the two-decade span. Situated in Zhengzhou City within the Yellow River basin from 2000 to 2020, this centroid was proximal to both Xuchang and Kaifeng, which are integral to the Huai River basin. Concurrently, the centroid coordinates underwent a shift of 867 km westward and 188 km northward, indicating a drift toward the middle reaches of the Yellow River. The directional distribution of the standard deviational ellipse for water resource vulnerability in the aforementioned basins transitioned from the northeast (leaning eastward) to the southwest (leaning westward). Over the period from 2000 to 2020, there was a consistent increase in the orientation angle, evolving from eastward to westward, mirroring the “high northeast and low southwest” spatial configuration.

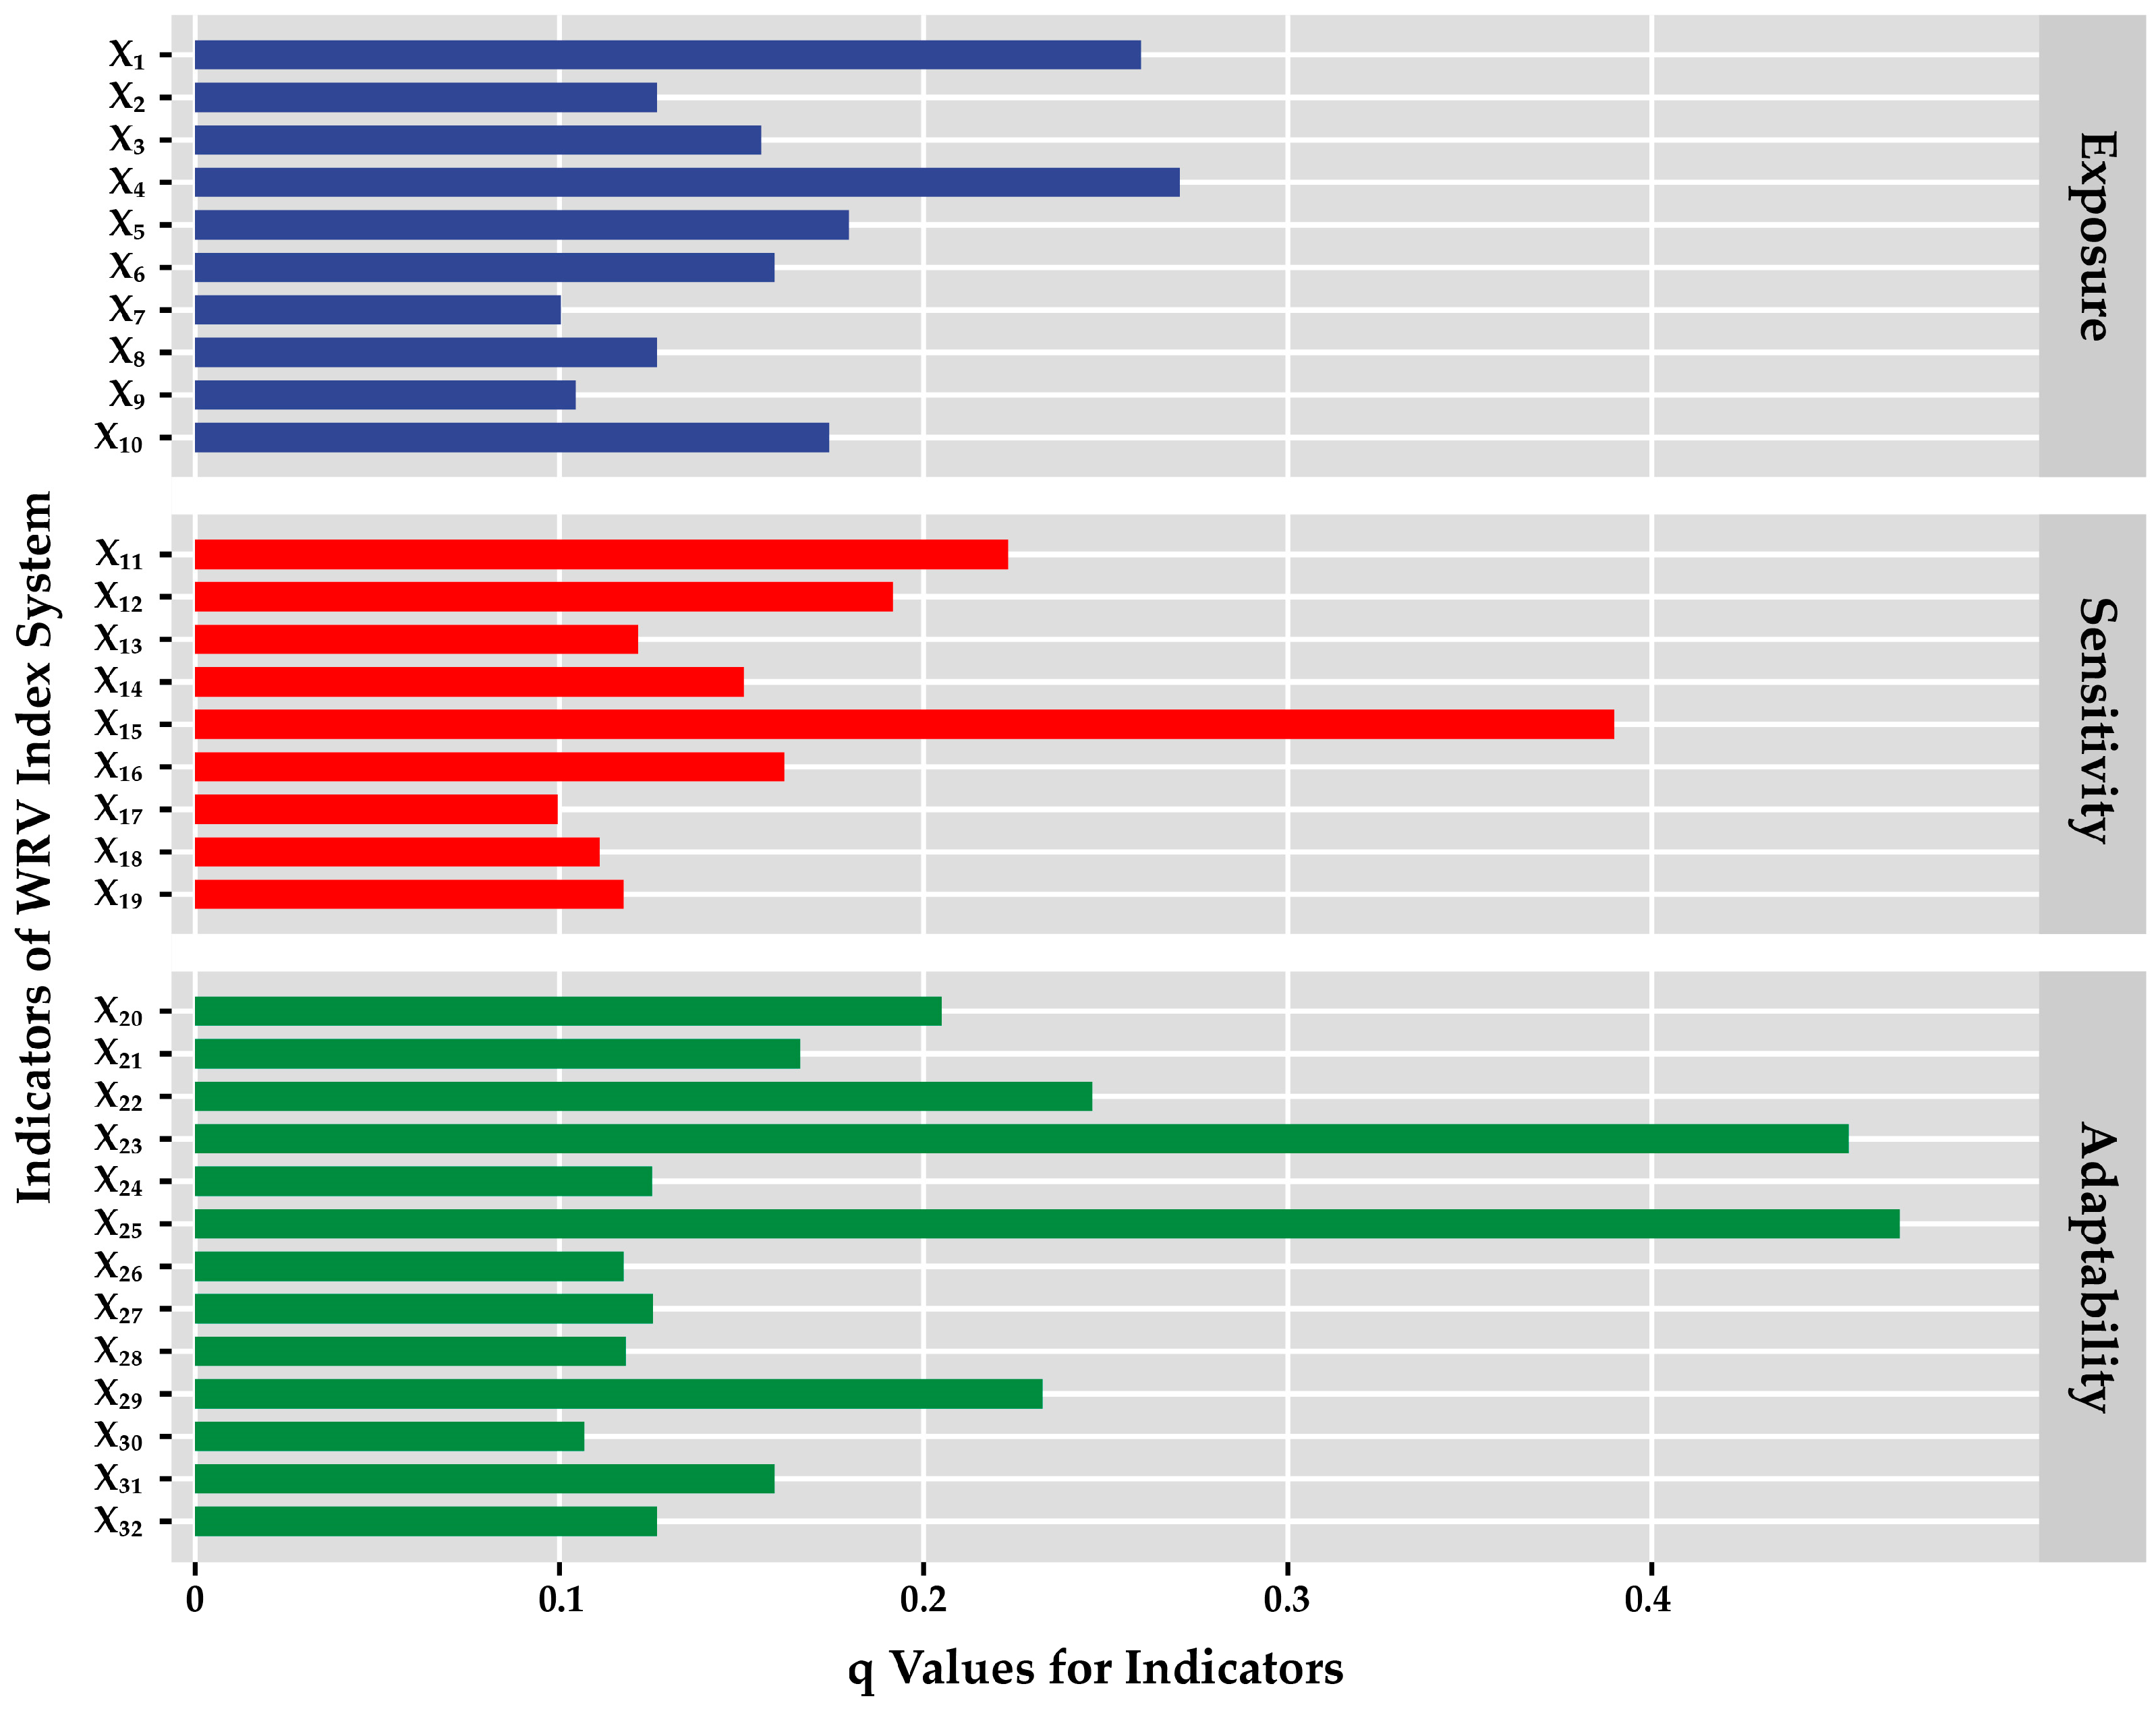
3.2. Factors Influencing WRV in the Four River Basins

The water resource system’s vulnerability within the four river basins was shaped by a multitude of determinants. This study investigated the ramifications of exposure, sensitivity, and adaptability on water resource vulnerability, grounded in the aforementioned classification. Analyses were conducted for three distinct years, 2000, 2010, and 2020, utilizing the natural discontinuity method for discretizing the influential factors [61]. Table 3 shows the results of the factor detector, where the q value represents the explanatory power of the influencing factor on the vulnerability of water resources.
In the mid-2000s, among the four basins, the highest sensitivity q value was observed at 0.74, followed by the adaptive capacity at 0.54, and the lowest exposure q value at 0.44. This highlights that the system’s sensitivity played a pivotal role in influencing the vulnerability of the four basins, while exposure impacts remained minimal. By 2010, the hierarchy of influencing factors shifted to exposure > sensitivity > adaptive capacity, emphasizing the amplified impact of exposure on WRV during this phase. In 2020, the q values for exposure and sensitivity were closely aligned at 0.73 and 0.74, respectively, whereas adaptive capacity lagged at 0.3. These data underscore the pronounced impact of both exposure and sensitivity on the basins’ water resource vulnerability compared to adaptive capacity. From 2000 to 2020, a discernible surge in exposure was juxtaposed against a decline in sensitivity, marked by a cumulative elevation of 0.29 in exposure q values over this two-decade span.
The GeoDetector analysis revealed that all 32 indicators across the three subsystems influenced the spatial distribution pattern of WRV, as illustrated in Figure 8. In the exposure category, the water resource development and utilization rate (X4), with a q value of 0.27, markedly impacted WRV. This was followed by population density (X1) with a q value of 0.25, suggesting that areas with a higher population density and greater water resource development and utilization rates are more susceptible to increased exposure of the water resource system. Concerning sensitivity, the water quality of urban centralized drinking water source (X15) exerted the most significant impact, evidenced by a q value of 0.39, indicating that deteriorating water quality notably heightened WRV sensitivity. Water resources per capita (X11), with a q value of 0.22, also substantially influenced sensitivity, implying that a reduction in regional water resources amplified sensitivity to changes in water resources. Regarding adaptability, the urban wastewater treatment rate (X25), with an explanatory power of 0.47, emerged as the most influential, denoting that higher urban wastewater treatment rates enhanced regional adaptability to WRV. Furthermore, water consumption per 10,000 yuan of GDP (X23), with a q value of 0.45, significantly affected adaptability, reflecting greater efficiency in water resource utilization.

4. Discussion

4.1. Spatiotemporal Pattern of WRV’s Exposure, Sensitivity, Adaptability, and Vulnerability Indices in the Four Basins

4.1.1. Spatiotemporal Pattern of the Exposure Index in the WRV

Exposure, being the foremost determinant, witnessed a marked escalation between 2000 and 2018. A significant demographic influx coupled with urban land expansion predominantly drove this trend. Yet, the advent of the novel coronavirus pandemic between 2018 and 2020 catalyzed an unexpected dip in exposure across these basins. This dip was attributable mainly to the interim cessation of urban industrial [73] and agricultural [74] endeavors within these river territories. Especially notable are Zhengzhou, Jiaozuo, Xinxiang, Kaifeng, and Puyang in the Yellow River basin, with Anyang in the Hai River basin exhibiting particularly pronounced performance. These metropolitan regions, characterized by dense populations, advanced urbanization, industrial concentrations, and significant urban hubs, consequently reported a surge in their exposure indices [63,66]. Figure 8 illustrates that the primary driving factors for WRV were the water resource development and utilization rate (X4) and population density (X1). A high population density escalates water demand, whereas an increased water resource development and utilization rate signifies extensive exploitation of water resources, rendering the region more vulnerable to WRV impacts. Moreover, industrial wastewater discharge (X5) also contributed to WRV, intensifying the degree of exposure.
Recurring meteorological calamities like floods and droughts plague the Yellow River basin [27,44,75]. Its unique topographical features, where riverbeds occasionally stand elevated compared to urban and agrarian zones, render it prone to flooding. Furthermore, certain cities and river stretches in this basin fail to adhere to flood prevention benchmarks, intensifying flood management challenges. Similarly, the Hai River basin often contends with intense rainfalls and flash floods, culminating in recurrent water-related crises [16,76]. These basins identify meteorological catastrophes as their dominant external disruptors. Specifically, the extreme rainfall episodes in 2016 and 2021 induced acute flooding [77]. Such climatic adversities profoundly impacted both the Yellow and Hai River basins, underscoring the imperative for robust flood countermeasures and bolstered disaster resistance. Conversely, the Huai River and Yangtze River basins demonstrated comparatively subdued exposure. Even with extant flood hazards, these basins encountered diminished meteorological disaster threats relative to their counterparts [78,79], attributable to their infrequent encounters with flash floods and torrential rains. Moreover, concerning the water usage structure, agricultural water utilization exceeded 50% in the Huai River basin, Hai River basin, and Yangtze River basin. The inefficient use of agricultural water was another factor influencing exposure.

4.1.2. Spatiotemporal Pattern of the Sensitivity Index in the WRV

The subsequent component, sensitivity, initially descended from 2000 to 2004 and thereafter oscillated until 2020. This variability emanated from the government’s renewed focus on nurturing ecological civilization, with an accent on water resource sustainability [80,81]. However, enduring challenges like water-related calamities, over-exploitation of water assets, pervasive contamination, and associated dilemmas persistently influenced the river basins’ dynamics. The analysis conducted using GeoDetector revealed that WRV was significantly influenced by the water quality of urban centralized drinking water source (X15). A decline in the quality of water sources escalated the sensitivity of the water resource system, thereby heightening the populace’s vulnerability to WRV. Furthermore, a reduction in water resources per capita (X11) potentially increased the region’s sensitivity to changes in water resources, amplifying WRV sensitivity. Similarly, a decrease in groundwater resources per capita (X12) may lead to heightened dependency on water resources, consequently increasing the sensitivity to WRV.
Cities within the Hai River basin, such as Anyang City and Hebi City, along with Xinxiang City, Jiaozuo City, Kaifeng City, Shangqiu City, and Puyang City in the Yellow River basin, are distinguished by a high population density and expansive cultivated land, as shown in Figure 9. Consequently, the demand for water resources in these regions is heightened. Yet, factors like scarce annual rainfall, extensive groundwater extraction, and suboptimal water quality accentuate the sensitivity of these basins [75,78]. Conversely, Zhumadian City, Pingdingshan City, Xuchang City, and Zhoukou City situated in the Huai River basin, and Nanyang City in the Yangtze River basin, can adequately meet their consumption and residential water needs owing to local rainfall and water resource reserves. Their water resource sensitivity was comparatively diminished. The Huai River and Yangtze River basins, rich in total water resources and with a commendable per capita water resource allocation, exhibited decreased sensitivity to water resource supply instabilities [82,83]. While the Huai River basin confronts challenges like excessive groundwater extraction and a disparity between water supply and demand [41,42], and the Yangtze River basin contends with inefficient water consumption [79,84,85], the general water resource provision remained fairly stable. This stability shielded these basins from severe perturbations triggered by external determinants.

4.1.3. Spatiotemporal Pattern of the Adaptation Capacity Index in the WRV

The GeoDetector results demonstrate that the adaptability of WRV was predominantly influenced by the urban wastewater treatment rate (X25) and water consumption per 10,000 yuan of GDP (X23). A high urban wastewater treatment rate signifies robust sewage treatment infrastructure, thereby enhancing the region’s adaptability to WRV. Conversely, low water consumption per 10,000 yuan of GDP indicates elevated water resource utilization efficiency, contributing to improved adaptability. Furthermore, a higher per capita disposable income of urban residents (X22) suggests greater capacity for residents to implement adaptive measures, thus affecting WRV adaptability to a notable degree. In brief, the progressive strides in scientific and technological frameworks, refined water resource management, augmented urban sewage treatments, and bolstered government financial injections into water conservation collectively fortified the resilience across these river basins [30,64]. Consequently, the overarching water resource vulnerability within these basins persistently dwindled annually. This propitious descent in vulnerability emanated from the synchronized synergy of exposure, sensitivity, and adaptive mechanisms, cumulatively diminishing the water resource system’s proneness to assorted perturbations [17,24]. As depicted in Figure 10, cities within the Yellow and Huai River basins exhibited higher GDPs. Notably, the provincial capital, Zhengzhou, significantly outpaced other municipalities in terms of GDP. These locales, marked by thriving economies, impressive GDPs, substantial fiscal revenues, competent governmental response mechanisms, and robust water resource protection measures, exhibited superior adaptability [83,86].
Conversely, the Hai River basin, despite its economic stature and size, demonstrated reduced adaptability in comparison to the other basins. This reduced adaptability can be attributed to challenges like extensive groundwater extraction and flood management. The Hai and Yangtze River basins overall manifested reduced vulnerability concerning water resources. Yet, the Hai River basin, given its finite water resource availability coupled with intensive urbanization [76,77], displayed diminished adaptability. In contrast, the Yangtze River basin, enriched with vast water resources and adaptive supply frameworks [82,84,87], showcased superior adaptability.

4.1.4. Spatiotemporal Pattern of the Vulnerability Index in the WRV

From 2000 to 2020, the four river basins in Henan Province witnessed a significant decrease in the vulnerability index of water resources. The decline in vulnerability resulted from the intricate interplay of three key factors: exposure, sensitivity, and water resource vulnerability (WRV). Table 3 reveals that in the mid-2000s, the highest sensitivity (q value: 0.74) significantly influenced vulnerability, followed by adaptive capacity (q value: 0.54), and exposure had the lowest impact (q value: 0.44). By 2010, factors influencing WRV shifted to prioritize exposure > sensitivity > adaptive capacity. Such a trend can be largely ascribed to China’s meteoric economic ascension and burgeoning urbanization rates [88], intensifying water resource demands for domestic, industrial, and agricultural purposes, thereby magnifying the vulnerability in the basins. This finding aligns with the research of Qin et al. [31], which suggests that the swift economic development in China has led to escalating demand for water resources and intensified development efforts, thereby exacerbating the discrepancy between water supply and demand. Human activities are increasingly becoming the primary factor influencing water resource changes. In several Chinese basins, the dominant factors affecting water resource variations have transitioned from climatic changes to the progressively significant influence and control exerted by human activities. In 2020, exposure and sensitivity exhibited similar q values (0.73, 0.74), while adaptive capacity lagged at 0.3. This emphasizes the substantial impact of exposure and sensitivity on WRV compared to adaptive capacity. Over 2000–2020, exposure surged, and sensitivity declined, leading to a cumulative 0.29 increase in exposure q values. This implies that factors such as water demand, along with variations in water quality and quantity within the four basins, outweighed concerns about water resource conservation. While the government consistently instituted measures to combat water pollution and develop protective infrastructures [89], the tangible outcomes of these endeavors necessitated extended durations to manifest, elucidating the subdued influence of adaptive capacity.
The Yellow River and Hai River basins exhibited enhanced water resource vulnerability, primarily due to the complex interaction between exposure and sensitivity factors. Initially, these basins faced elevated exposure levels, consistently encountering meteorological adversities such as floods, droughts, and intense precipitation events [75,90,91]. Such climatic extremities frequently induced variability in the water supply, jeopardizing the stability of the basins’ water resource frameworks [91,92]. Such climatic extremes often induce variability in the water supply, threatening the stability of the basins’ water resource frameworks. Secondly, the prominent sensitivity in these basins emerged from limitations in total water availability, in conjunction with high population densities, rapid urbanization, and vigorous industrial activities. This intersection aggravated the water supply–demand nexus. In the Yellow River basin, complexities were amplified by challenges such as over-extraction of groundwater, diminished water quality, and ecological conservation issues [78,83]. Simultaneously, in the Hai River basin, legacy industrial bases additionally jeopardized water quality and availability [77,91,92]. In stark contrast, the Huai River and Yangtze River basins exhibited reduced water resource vulnerability owing to their comparatively abundant water reserves and subdued sensitivity dynamics. Within the Huai River domain, substantial total water assets and favorable per capita water availability alleviated sensitivity to supply disruptions [90,93]. Although concerns regarding over-exploitation of groundwater and supply–demand imbalances lingered, the overall water supply balance remained relatively stable. In the Yangtze River catchment, its plentiful water reserves, coupled with considerable annual water conveyance capabilities, provided resilience against significant external supply deviations [84,85]. Despite challenges in water utilization efficiency, the comprehensive water supply framework remained relatively stable and less vulnerable to external perturbations.

4.2. Application of WRV Evaluation: Identifying the Focus of Water Resource Adaptive Management

Previous studies have shown that measured ranking of WRV is an important basis for adaptive management of water resources (Figure 1), and thus, the evaluation must re-main objective [1,38]. There is much to be learned from this study about the weak spots and strengths of Henan Province’s water infrastructure. It makes the trends of WRV clear and provides a scientific basis for decision making about water resource management in Henan Province. The results can provide decision makers with an overall picture of risks to and challenges for water resources in the various basins, so that problems may be anticipated proactively and appropriate remedial measures taken. This is particularly the case when it comes to factors such as population growth and urbanization, where the works of other scholars have indicated a relationship [31]. The study also provides direction for long-term water resource planning and flood prevention measures. Considering multiple basins, the comprehensive assessment reveals regional variations in WRV, allowing for the formulation of more targeted, basin-specific management policies that cater to the diverse environments and development statuses of each basin. This approach is pivotal in progressing towards a water secure future for the region, ensuring the well-being of its populace, and fostering the sustainable development of both economic and ecological aspects.
In our previous analyses, we undertook a comprehensive examination of water resource vulnerability and its underlying determinants within Henan Province’s four primary river basins: the Huai, Yellow River, Hai, and Yangtze. Adapting our methodology to the distinct characteristics of each basin, we delineated a set of strategies and measures designed to attain equilibrium between water supply and demand, propel hydraulic development, fortify environmental safeguards for water ecosystems, and institute a resilient governance framework for effective basin management (Table 4).

5. Conclusions

This study focused on the Huai River, Yangtze River, Hai River, and Yellow River basins in Henan Province, undertaking a comprehensive evaluation of WRV utilizing the VSD model. The assessment incorporated indicators of exposure, sensitivity, and adaptability to determine water security and sustainability in these regions, particularly in the context of population growth, urbanization, and other key determinants. By employing techniques such as the composite weighting method, SDE model, and GeoDetector, the research investigated the spatiotemporal evolution characteristics and influencing factors of WRV from 2000 to 2020. The findings of the study reveal:
(1)
An analysis of spatiotemporal trends highlighted a consistent reduction in WRV from 2000 to 2020. Significantly, vulnerability was positively correlated with exposure, while a negative correlation was observed with adaptability. The temporal trend of exposure initially indicated an increase, followed by a subsequent decrease, exhibiting a spatial pattern described as “higher in the northeast and lower in the southwest”. Sensitivity initially decreased and then stabilized over time, with a spatial distribution characterized by “higher in the north and lower in the south”. Adaptability demonstrated a consistently increasing temporal trend, along with a spatial pattern of “lower in the northeast and higher in the southwest”. Consequently, the overall vulnerability showed a decreasing trend over time and was spatially “higher in the northeast and lower in the southwest”.
(2)
There were marked differences among the four basins regarding WRV. In each basin, WRV was shaped by the interaction and mutual influence of three dimensions: exposure, sensitivity, and adaptability. The Yellow River and Hai River basins displayed heightened WRV, primarily due to the intricate interplay between exposure and sensitivity factors. In contrast, the Huai River and Yangtze River basins, characterized by relatively lower population density and more abundant water resources, exhibited lower WRV. Consequently, it is essential to manage each watershed adaptively, taking into account its distinct characteristics. This includes implementing management measures such as balancing water resource supply and demand, enhancing protection of the water environment, and refining watershed governance mechanisms.
In summation, these findings possess profound ramifications for water resource planning and regional sustainable development. By grasping the spatiotemporal intricacies of water vulnerability and its influential drivers, it enables policymakers to tailor strategies bolstering water security, attenuating potential threats, and endorsing environmental conservation. Such initiatives are quintessential for ensuring a resilient water future for Henan’s river basins, propelling socio-economic growth in the province.

Author Contributions

Conceptualization, Z.T.; Data curation, R.Z.; Formal analysis, R.Z., Y.W. and J.Y.; Funding acquisition, Z.T.; Investigation, R.Z.; Methodology, L.W. and Y.W.; Project administration, Z.T.; Supervision, Z.T. and L.W.; Validation, R.Z.; Visualization, R.Z., J.Y., and D.C.; Writing—original draft, R.Z. and L.W.; Writing—review & editing, R.Z., L.W., and Y.W. All authors have read and agreed to the published version of the manuscript.

Funding

The research received funding from the Central Guided Local Science and Technology Development Funds Program under grant number 211201004 and the Joint Fund of Henan Province Science and Technology R&D Program under grant number 225200810057.

Data Availability Statement

For the publicly available data, interested parties can access them through the Henan Province Water Authority (https://slt.henan.gov.cn/bmzl/szygl/szygb/—accessed on 23 October 2022) and the Henan Province Bureau of Statistics (https://tjj.henan.gov.cn/tjfw/tjsj/—accessed on 23 October 2022).

Acknowledgments

The authors would like to acknowledge all of the reviewers and editors.

Conflicts of Interest

The authors declare no conflicts of interest.

References

  1. Yuan, Y.; Zheng, Y. Progress and future prospects of water resources vulnerability at home and abroad. J. Arid Land Resour. Environ. 2022, 36, 116–125. [Google Scholar]
  2. Bakker, K.; Morinville, C. The governance dimensions of water security: A review. Philos. Trans. R. Soc. A-Math. Phys. Eng. Sci. 2013, 371, 20130116. [Google Scholar] [CrossRef] [PubMed]
  3. Adger, W.N. Vulnerability. Glob. Environ. Chang. 2006, 16, 268–281. [Google Scholar] [CrossRef]
  4. Birch, E.L. Climate Change 2014: Impacts, Adaptation, and Vulnerability. J. Am. Plan. Assoc. 2014, 80, 184–185. [Google Scholar] [CrossRef]
  5. Chen, Y.; Moufouma-Okia, W.; Masson-Delmotte, V.; Zhai, P.; Pirani, A. Recent Progress and Emerging Topics on Weather and Climate Extremes Since the Fifth Assessment Report of the Intergovernmental Panel on Climate Change. Annu. Rev. Environ. Resour. 2018, 43, 35–59. [Google Scholar] [CrossRef]
  6. Gu, S.; Jenkins, A.; Gao, S.-J.; Lu, Y.; Li, H.; Li, Y.; Ferrier, R.C.; Bailey, M.; Wang, Y.; Zhang, Y.; et al. Ensuring water resource security in China; the need for advances in evidence-based policy to support sustainable management. Environ. Sci. Policy 2017, 75, 65–69. [Google Scholar] [CrossRef]
  7. Chen, W.; Chen, Y.; Feng, Y. Assessment and Prediction of Water Resources Vulnerability Based on a NRS-RF Model: A Case Study of the Song-Liao River Basin, China. Entropy 2021, 23, 882. [Google Scholar] [CrossRef]
  8. Xiao, A.; Long, J.; Wu, J.; Wang, W. Using VSD Model to Analyze Water Resource Vulnerability in Wet Mountain Region: Taking Xiangxi Tujiazu & Miaozu Autonomous Prefecture as an Example. J. Irrig. Drain. 2022, 41, 45–53. [Google Scholar]
  9. Yang, F.; Zheng, L.; Qian, H.; Liu, F.; Wang, H. Vulnerability assessment of urban water resources based on DPSIR model: A case study of Xi’an City. J. Water Resour. Water Eng. 2020, 31, 77–84. [Google Scholar]
  10. Kim, H.J.; Cho, K.; Kim, Y.; Park, H.; Lee, J.W.; Kim, S.J.; Chae, Y. Spatial Assessment of Water-Use Vulnerability under Future Climate and Socioeconomic Scenarios within a River Basin. J. Water Resour. Plan. Manag. 2020, 146, 05020011. [Google Scholar] [CrossRef]
  11. Pietrucha-Urbanik, K.; Rak, J. Water, Resources, and Resilience: Insights from Diverse Environmental Studies. Water 2023, 15, 3965. [Google Scholar] [CrossRef]
  12. Rak, J.R.; Pietrucha-Urbanik, K. An Approach to Determine Risk Indices for Drinking Water-Study Investigation. Sustainability 2019, 11, 3189. [Google Scholar] [CrossRef]
  13. Dong, Y.; Zhou, W.; Wang, X.; Lu, Y.; Zhao, P.; Li, X. A new assessment method for the vulnerability of confined water: W-F&PNN method. J. Hydrol. 2020, 590, 125217. [Google Scholar] [CrossRef]
  14. Gao, S.; Luo, Y.; Yang, T. Research on Analysis and Evaluation Method of Vulnerability of Water Resources System. IOP Conf. Ser. Earth Environ. Sci. 2019, 233, 042026. [Google Scholar] [CrossRef]
  15. Wei, S.; Lin, K.; Huang, L.; Yao, Z.; Bai, X.; Chen, Z. Assessing the Vulnerability of Water Resources System Using VSD-SD Coupling Model: A Case of Pearl River Delta. Water 2022, 14, 1103. [Google Scholar] [CrossRef]
  16. Xia, J.; Shi, W.; Chen, J.; Hong, S. Study on vulnerability of water resources and its adaptive regulation under changing environment A case of Haihe River Basin. Water Resour. Hydropower Eng. 2015, 46, 27–33. [Google Scholar]
  17. Chen, J.; Yang, X.; Yin, S.; Wu, K. The vulnerability evolution and simulation of the social-ecological systems in the semi-arid area based on the VSD framework. Acta Geogr. Sin. 2016, 71, 1172–1188. [Google Scholar]
  18. Demirkesen, A.C.; Evrendilek, F. Compositing climate change vulnerability of a Mediterranean region using spatiotemporally dynamic proxies for ecological and socioeconomic impacts and stabilities. Environ. Monit. Assess. 2017, 189, 29. [Google Scholar] [CrossRef]
  19. Lin, Z.; Liu, B.; Wu, Y.; Peng, S. Assessment of water resource vulnerability of the Pearl River Delta metropolitan under environment change. Acta Sci. Nat. Univ. Sunyatseni 2018, 57, 8–16. [Google Scholar]
  20. Wang, X.; Ma, F.B.; Li, J.Y. Water Resources Vulnerability Assessment based on the Parametric-system Method: A Case Study of the Zhangjiakou Region of Guanting Reservoir Basin, North China. Procedia Environ. Sci. 2012, 13, 1204–1212. [Google Scholar] [CrossRef]
  21. Huo, T.; Zhang, X.; Zhou, Y.; Chen, W. Evaluation and correlation analysis of spatio-temporal changes of ecological vulnerability based on VSD model: A case in Suzhou section, Grand Canal of China. Acta Ecol. Sin. 2022, 42, 2281–2293. [Google Scholar]
  22. Chen, Y.; Feng, Y.; Zhang, F.; Wang, L. Assessing Water Resources Vulnerability by Using a Rough Set Cloud Model: A Case Study of the Huai River Basin, China. Entropy 2019, 21, 14. [Google Scholar] [CrossRef] [PubMed]
  23. Haak, L.; Pagilla, K. The Water-Economy Nexus: A Composite Index Approach to Evaluate Urban Water Vulnerability. Water Resour. Manag. 2020, 34, 409–423. [Google Scholar] [CrossRef]
  24. Polsky, C.; Neff, R.; Yarnal, B. Building comparable global change vulnerability assessments: The vulnerability scoping diagram. Glob. Environ. Chang.-Hum. Policy Dimens. 2007, 17, 472–485. [Google Scholar] [CrossRef]
  25. Frazier, T.G.; Thompson, C.M.; Dezzani, R.J. A framework for the development of the SERV model: A Spatially Explicit Resilience-Vulnerability model. Appl. Geogr. 2014, 51, 158–172. [Google Scholar] [CrossRef]
  26. Chen, J.; Yang, X.; Yin, S.; Wu, K.; Deng, M.; Wen, X. The vulnerability evolution and simulation of social-ecological systems in a semi-arid area: A case study of Yulin City, China. J. Geogr. Sci. 2018, 28, 152–174. [Google Scholar] [CrossRef]
  27. Chen, Y.; Feng, Y. Assessment and Prediction of Water Resources Vulnerability in River Basin Based on RS-SVR Model: A Case Study of the Yellow River Basin. Resour. Environ. Yangtze Basin 2020, 29, 137–149. [Google Scholar]
  28. Liu, Q.; Chen, Y. Vulnerability prediction of basin water resources based on rough set and bp neural networka case of huaihe basin. Resour. Environ. Yangtze Basin 2016, 25, 1317–1327. [Google Scholar]
  29. Pandey, V.P.; Babel, M.S.; Shrestha, S.; Kazama, F. Vulnerability of freshwater resources in large and medium Nepalese river basins to environmental change. Water Sci. Technol. 2010, 61, 1525–1534. [Google Scholar] [CrossRef]
  30. Chen, Y.; Feng, Y.; Zhang, F.; Yang, F.; Wang, L. Assessing and Predicting the Water Resources Vulnerability under Various Climate-Change Scenarios: A Case Study of Huang-Huai-Hai River Basin, China. Entropy 2020, 22, 333. [Google Scholar] [CrossRef]
  31. Qin, J.; Ding, Y.-J.; Zhao, Q.-D.; Wang, S.-P.; Chang, Y.-P. Assessments on surface water resources and their vulnerability and adaptability in China. Adv. Clim. Chang. Res. 2020, 11, 381–391. [Google Scholar] [CrossRef]
  32. Feng, Y.; He, D. Transboundary water vulnerability and its drivers in China. J. Geogr. Sci. 2009, 19, 189–199. [Google Scholar] [CrossRef]
  33. Kuang, Y.; Li, H.; Xia, J.; Yang, Z. Impacts of climate change on transboundary water resources and adaptation management framework. Progress. Inquisitiones De Mutat. Clim. 2018, 14, 67–76. [Google Scholar]
  34. Zhong, S.; Elzarka, H. Retrospective Evaluation of the Vulnerability of Watershed Sustainable Water Development Using a Time-Series-Based Space Geometry Model: Xiang Jiang Watershed, China. J. Hydrol. Eng. 2021, 26, 05021023. [Google Scholar] [CrossRef]
  35. Zhao, Y.; Xu, X.; Li, X. Evaluation of Water environmental System Vulnerability in Jiangsu Province Based on Weight-Varying Gray Cloud Model. Resour. Environ. Yangtze Basin 2018, 27, 2463–2471. [Google Scholar]
  36. Li, M.-H.; Tseng, K.-J.; Tung, C.-P.; Shih, D.-S.; Liu, T.-M. Assessing water resources vulnerability and resilience of southern Taiwan to climate change. Terr. Atmos. Ocean. Sci. 2017, 28, 67–81. [Google Scholar] [CrossRef]
  37. Garnier, M.; Holman, I. Critical Review of Adaptation Measures to Reduce the Vulnerability of European Drinking Water Resources to the Pressures of Climate Change. Environ. Manag. 2019, 64, 138–153. [Google Scholar] [CrossRef]
  38. Xia, J.; Shi, W.; Luo, X.; Hong, S.; Ning, L.; Gippel Christopher, J. Revisions on water resources vulnerability and adaption measures under climate change. Adv. Water Sci. 2015, 26, 279–286. [Google Scholar]
  39. Zuo, Q.T.; Li, W.; Zhao, H.; Ma, J.X.; Han, C.H.; Luo, Z.L. A Harmony-Based Approach for Assessing and Regulating Human-Water Relationships: A Case Study of Henan Province in China. Water 2021, 13, 32. [Google Scholar] [CrossRef]
  40. Zhang, L.; Qiu, S.; Yan, L.; Du, J.; Shen, H.; Zhang, R. Coupling and Coordination Analysis of Water Resources Utilization and Economic and Social Development in Henan Province from the Perspective of Basin. Areal Res. Dev. 2022, 41, 14–19. [Google Scholar]
  41. Xu, W.; Wang, Z.; Zhang, T. Spatial Heterogeneity Analysis of Water Environment in the Huaihe River Basin of Henan Province. Wetl. Sci. 2017, 15, 425–432. [Google Scholar]
  42. Xu, Y.; Yu, L.; Lyu, X.; Fan, P. Ecological restoration modes for Huaihe River basin of Henan, China. Chin. J. Environ. Eng. 2017, 11, 143–150. [Google Scholar]
  43. Jiao, S.; Cui, S.; Wang, A.; Zhao, R.; Yin, Y.; Zhang, J.; Li, Z. Response Relationship Between Urbanization Process and Water Resource Utilization in Henan Province. Res. Soil Water Conserv. 2020, 27, 239–246. [Google Scholar]
  44. Yan, L.; Zhao, Y.; Qiu, S.; Fu, Q. Construction and Evaluation of High-quality Development Index System in the Yellow River Basin: Take Henan Section as an Example. Areal Res. Dev. 2022, 41, 37–43. [Google Scholar]
  45. Yang, Q.; Tang, Q.; Zhang, Y. Spatiotemporal Changes of Water Quality in Huai River Basin(Henan Section) and Its Correlation with Land Use Patterns. Res. Environ. Sci. 2019, 32, 1519–1530. [Google Scholar]
  46. Li, X.; Yu, L.; Lu, X.; Xu, Y.; Hao, Z. Health assessment of aquatic ecosystem in Huai River Basin (Henan section) based on B-IBI. Chin. J. Ecol. 2018, 37, 2213–2220. [Google Scholar]
  47. Daly, D.; Dassargues, A.; Drew, D.; Dunne, S.; Goldscheider, N.; Neale, S.; Popescu, I.; Zwahlen, F. Main concepts of the “European approach” to karst-groundwater-vulnerability assessment and mapping. Hydrogeol. J. 2002, 10, 340–345. [Google Scholar] [CrossRef]
  48. Acosta-Michlik, L.; Espaldon, V. Assessing vulnerability of selected farming communities in the Philippines based on a behavioural model of agent’s adaptation to global environmental change. Glob. Environ. Chang.-Hum. Policy Dimens. 2008, 18, 554–563. [Google Scholar] [CrossRef]
  49. Huo, Y.; Wang, L.; Jiao, S.; Teng, J. Water pollution driving forces and pollution prevention measures priority of medium/small-sized cities in southern China. China Environ. Sci. 2009, 29, 1052–1058. [Google Scholar]
  50. Wang, W.; Jin, J.; Ding, J.; Li, Y. A new approach to water resources system assessment—Set pair analysis method. Sci. China Ser. E Technol. Sci. 2009, 52, 3017–3023. [Google Scholar] [CrossRef]
  51. Xiang, H. Research on Construction and Application of Index System for Regional Water Security Assessment; Jinan Universtiy: Guangzhou, China, 2011. [Google Scholar]
  52. Tu, J.; Luo, S.; Yang, Y.; Qin, P.; Qi, P.; Li, Q. Spatiotemporal Evolution and the Influencing Factors of Tourism-Based Social-Ecological System Vulnerability in the Three Gorges Reservoir Area, China. Sustainability 2021, 13, 4008. [Google Scholar] [CrossRef]
  53. Frazier, T.; Thompson, C.; Dezzani, R. Development of a spatially explicit vulnerability-resilience model for community level hazard mitigation enhancement. In Disaster Management and Human Health Risk III; Brebbia, C.A., Ed.; WIT Press: Southampton, UK, 2013; pp. 13–24. [Google Scholar]
  54. Gong, J.; Jin, T.; Cao, E.; Wang, S.; Yan, L. Is ecological vulnerability assessment based on the VSD model and AHP-Entropy method useful for loessial forest landscape protection and adaptative management? A case study of Ziwuling Mountain Region, China. Ecol. Indic. 2022, 143, 109379. [Google Scholar] [CrossRef]
  55. Khashei-Siuki, A.; Sharifan, H. Comparison of AHP and FAHP methods in determining suitable areas for drinking water harvesting in Birjand aquifer. Iran. Groundw. Sustain. Dev. 2020, 10, 100328. [Google Scholar] [CrossRef]
  56. Zou, T.; Chang, Y.; Chen, P.; Liu, J. Spatial-temporal variations of ecological vulnerability in Jilin Province (China), 2000 to 2018. Ecol. Indic. 2021, 133, 108429. [Google Scholar] [CrossRef]
  57. Guo, K.; Yuan, Y.B. Research on Spatial and Temporal Evolution Trends and Driving Factors of Green Residences in China Based on Weighted Standard Deviational Ellipse and Panel Tobit Model. Appl. Sci. 2022, 12, 8788. [Google Scholar] [CrossRef]
  58. Wuyan, F.; Yong, Z. Based on ARCGIS-SDE Spatial Evolution Trend of Industrial Clusters Space. Appl. Mech. Mater. 2015, 733, 982–985. [Google Scholar] [CrossRef]
  59. Moore, T.W.; McGuire, M.P. Using the standard deviational ellipse to document changes to the spatial dispersion of seasonal tornado activity in the United States. NPJ Clim. Atmos. Sci. 2019, 2, 21. [Google Scholar] [CrossRef]
  60. An, M.; Xie, P.; He, W.; Wang, B.; Huang, J.; Khanal, R. Spatiotemporal change of ecologic environment quality and human interaction factors in three gorges ecologic economic corridor, based on RSEI. Ecol. Indic. 2022, 141, 109090. [Google Scholar] [CrossRef]
  61. Wang, J.; Xu, C. Geodetector: Principle and prospective. Acta Geogr. Sin. 2017, 72, 116–134. [Google Scholar]
  62. Liu, Y.; Zhang, W.; Zhang, Z.; Xu, Q.; Li, W. Risk factor detection and landslide susceptibility mapping using Geo-Detector and Random Forest Models: The 2018 Hokkaido eastern Iburi earthquake. Remote Sens. 2021, 13, 1157. [Google Scholar] [CrossRef]
  63. Li, X.; Huang, Z.; Chen, J.; Wang, X.; Wei, J. Preliminary assessment of Tieshangang Bay mangrove ecosystem vulnerability based on VSD model. J. Trop. Oceanogr. 2018, 37, 47–54. [Google Scholar]
  64. Chen, F.; Li, Z.; Dong, S.; Ren, Y.; Li, J.; Rykov Pavel, V. Evaluation of ecological vulnerability in gully-hilly region of Loess Plateau based on VSD ModelA case of Lintao county. J. Arid Land Resour. Environ. 2018, 32, 74–80. [Google Scholar]
  65. Dang, E.; Hu, W.; Chen, G.; Ma, Z.; Cehn, B.; Chen, Z.; Liu, W. Ecological vulnerability assessment of coastal zone in Dongshan county based on VSD model. Mar. Environ. Sci. 2017, 36, 296–302. [Google Scholar]
  66. Li, J.; Zhang, J.; Si, Y.; Liu, Y.; Liu, Q.; Lu, W. System analysis of Xiangshan bay ecological vulnerability assessment system based on VSD model. Mar. Environ. Sci. 2017, 36, 274–280. [Google Scholar]
  67. Fu, Y.; Liu, Y. The RST Evaluation Method of Indicator System Validity and Its Application. Manag. Rev. 2009, 21, 91–95,112. [Google Scholar]
  68. Hu, X.; Zhang, L. Research on the integration level measurement and optimization path of industrial chain, innovation chain and service chain. J. Innov. Knowl. 2023, 8, 100368. [Google Scholar] [CrossRef]
  69. Henan Province Water Authority. Henan Province Water Resources Bulletin, Henan Province, China. Available online: https://slt.henan.gov.cn/bmzl/szygl/szygb/ (accessed on 23 October 2022).
  70. Henan Province Bureau of Statistics. Henan Provincial Statistical Yearbook, Henan Province, China. Available online: https://tjj.henan.gov.cn/tjfw/tjsj/ (accessed on 23 October 2022).
  71. Murthy, C.S.; Laxman, B.; Sai, M.V.R.S. Geospatial analysis of agricultural drought vulnerability using a composite index based on exposure, sensitivity and adaptive capacity. Int. J. Disaster Risk Reduct. 2015, 12, 163–171. [Google Scholar] [CrossRef]
  72. Xu, H. Assessment of agricultural drought vulnerability and identification of influencing factors based on the entropy weight method. Agric. Res. Arid Areas 2016, 34, 198–205. [Google Scholar]
  73. Tan, L.; Wu, X.; Guo, J.; Santibanez-Gonzalez, E.D.R. Assessing the Impacts of COVID-19 on the Industrial Sectors and Economy of China. Risk Anal. 2022, 42, 21–39. [Google Scholar] [CrossRef]
  74. Okolie, C.C.; Ogundeji, A.A. Effect of COVID-19 on agricultural production and food security: A scientometric analysis. Humanit. Soc. Sci. Commun. 2022, 9, 64. [Google Scholar] [CrossRef]
  75. Cui, K.; Liu, D.; Li, X. Evaluation on Social Vulnerability to Flood Hazards in He’nan Section of Yellow River Basin. Bull. Soil Water Conserv. 2021, 41, 304–310. [Google Scholar]
  76. Xiang-yi, D.; Yang-Wen, J.I.A.; Hao, W.; Cun-Wen, N.I.U. Impacts of Climate Change on Water Resources in the Haihe River Basin and Corresponding Countermeasures. J. Nat. Resour. 2010, 25, 604–613. [Google Scholar]
  77. Cheng, S.; Xie, J.; Ma, N.; Liang, S.; Guo, J.; Fu, N. Variations in Summer Precipitation According to Different Grades and Their Effects on Summer Drought/Flooding in Haihe River Basin. Atmosphere 2022, 13, 1246. [Google Scholar] [CrossRef]
  78. Jiang, Y.; Hao, Z.; Feng, S.; Zhang, Y.; Zhang, X.; Fu, Y.; Hao, F. Spatiotemporal evolution characteristics in compound hot-dry events in Yangtze River and Yellow River basins. Water Resour. Prot. 2023, 39, 70–77. [Google Scholar]
  79. Fang, L.; Xu, D.; Wang, L.; Niu, Z.; Zhang, M. The study of ecosystem services and the comparison of trade-off and synergy in Yangtze River Basin and Yellow River Basin. Geogr. Res. 2021, 40, 821–838. [Google Scholar]
  80. Gong, S.; Xiao, Y.; Zheng, H.; Xiao, Y.; Ouyang, Z. Spatial patterns of ecosystem water conservation in China and its impact factors analysis. Acta Ecol. Sin. 2017, 37, 2455–2462. [Google Scholar]
  81. Li, R.; Huang, X.; Liu, Y. Spatio-temporal differentiation and influencing factors of China’s urbanization from 2010 to 2020. Acta Geogr. Sin. 2023, 78, 777–791. [Google Scholar]
  82. Xu, J.; Yuan, Z. Drought Characteristics of Changjiang River Basin in 2022 and Drought Mitigation Response Pattern under New Circumstances. J. Yangtze River Sci. Res. Inst. 2023, 40, 1–8. [Google Scholar]
  83. Wei, J.; Li, Z.; Dong, Y. Legalization of Environmental Safety Assessment System in the Yellow River Basin Based on Pressure-State-Response (PSR) Model. Environ. Monit. China 2023, 39, 19–28. [Google Scholar]
  84. Pan, B.; Liu, X. A Review of Water Ecology Problems and Restoration in the Yangtze River Basin. J. Yangtze River Sci. Res. Inst. 2021, 38, 1–8. [Google Scholar]
  85. Zhang, J.; Wang, G.; Jin, J.; He, R.; Liu, C. Evolution and variation characteristics of the recorded runoff for the major rivers in China during 19562018. Adv. Water Sci. 2020, 31, 153–161. [Google Scholar]
  86. Cai, J.; Varis, L.; Yin, H. China’s water resources vulnerability: A spatio-temporal analysis during 2003–2013. J. Clean. Prod. 2017, 142, 2901–2910. [Google Scholar] [CrossRef]
  87. Li-ping, Z.; Jun, X.I.A. Situation and problem analysis of water resource security in China. Resour. Environ. Yangtze Basin 2009, 18, 116–120. [Google Scholar]
  88. Guan, X.; Wei, H.; Lu, S.; Dai, Q.; Su, H. Assessment on the urbanization strategy in China: Achievements, challenges and reflections. Habitat Int. 2018, 71, 97–109. [Google Scholar] [CrossRef]
  89. Yang, Q.; Gao, D.; Song, D.; Li, Y. Environmental regulation, pollution reduction and green innovation: The case of the Chinese Water Ecological Civilization City Pilot policy. Econ. Syst. 2021, 45, 100911. [Google Scholar] [CrossRef]
  90. Yang, C.; Yu, Z.; Hao, Z.; Zhang, J.; Zhu, J. Impact of climate change on flood and drought events in Huaihe River Basin, China. Hydrol. Res. 2012, 43, 14–22. [Google Scholar] [CrossRef]
  91. Ren, J.; Wang, W.; Wei, J.; Li, H.; Li, X.; Liu, G.; Chen, Y.; Ye, S. Evolution and prediction of drought-flood abrupt alternation events in Huang-Huai-Hai River Basin, China. Sci. Total Environ. 2023, 869, 161707. [Google Scholar] [CrossRef]
  92. Shi, X.; Ding, H.; Wu, M.; Zhang, N.; Shi, M.; Chen, F.; Li, Y. Effects of different types of drought on vegetation in Huang-Huai-Hai River Basin, China. Ecol. Indic. 2022, 144, 109428. [Google Scholar] [CrossRef]
  93. Sun, R.; Yuan, H.; Liu, X.; Jiang, X. Evaluation of the latest satellite–gauge precipitation products and their hydrologic applications over the Huaihe River basin. J. Hydrol. 2016, 536, 302–319. [Google Scholar] [CrossRef]
Figure 1. Distribution map of four river basins in Henan Province.
Water 16 00149 g001
Figure 2. Approach and methodology for WRV assessment under the VSD evaluation framework.
Water 16 00149 g002
Figure 3. Illustration of the VSD model.
Water 16 00149 g003
Figure 4. Temporal change chart of water resource exposure, sensitivity, adaptation capacity, and vulnerability index for four river basins of Henan Province.
Water 16 00149 g004
Figure 5. Spatial distribution map of water resource system exposure, sensitivity, adaptation capacity, and vulnerability index for four river basins of Henan Province from 2000 to 2020.
Water 16 00149 g005
Figure 6. Centroid migration path and standard deviational ellipse of the three-dimensional layers of WRV for four river basins of Henan Province from 2000 to 2020: (a) exposure; (b) sensitivity; (c) adaptation capacity. Note: Black triangles along the black lines represent the direction of centroid migration.
Water 16 00149 g006
Figure 7. Centroid migration path and standard deviational ellipse of WRV for four river basins of Henan Province from 2000 to 2020. Note: Black triangles along the black lines represent the direction of centroid migration.
Water 16 00149 g007
Figure 8. Detection results of the influencing factors of WRV spatial evolution.
Water 16 00149 g008
Figure 9. Population distribution in Henan Province.
Water 16 00149 g009
Figure 10. The industrial composition of the gross domestic product (GDP) in the 18 cities of Henan Province in the year 2020.
Water 16 00149 g010
Table 1. Water resource vulnerability index system of the four river basins in Henan Province.
Dimensional LayerElement LayerIndicator LayerImpact
Directions
ExposureHuman activity interferencePopulation density (X1)Positive
Domestic water consumption per capita (X2)Positive
Total wastewater discharge (X3)Positive
Water resource development and utilization rate (X4)Positive
Human-induced construction interferenceIndustrial wastewater discharge (X5)Positive
Agricultural irrigation water consumption per mu (X6)Positive
Consumption of chemical fertilizer by 100% effective component per mu (X7)Positive
Consumption of chemical pesticides per mu (X8)Positive
Land-use change interferenceBuilt-up area (X9)Positive
Cultivated land area (X10)Positive
SensitivityWater volumeWater resources per capita (X11)Negative
Groundwater resources per capita (X12)Negative
Water production modulus (X13)Negative
Water qualityWater quality excellence rate in watershed (X14)Negative
Water quality of urban centralized drinking water source (X15)Negative
Water quality of urban groundwater (X16)Negative
Sensitivity of climate to external interferenceWater production coefficient (X17)Negative
Absolute value of coefficient of variation in annual precipitation (X18)Positive
Proportion of rainfall during flood season (X19)Positive
AdaptabilityEconomic developmentPer capita GDP (X20)Negative
Local general budgetary revenue (X21)Negative
Per capita disposable income of urban residents (X22)Negative
TechnologyWater consumption per 10,000 yuan of GDP (X23)Positive
Water consumption rate (X24)Positive
Pollution controlUrban wastewater treatment rate (X25)Negative
Treatment capacity of wastewater treatment plants (X26)Negative
Length of drainage pipes (X27)Negative
Density of drainage pipes (X28)Negative
Willingness for water resource protection and constructionProportion of expenditure on agriculture, forestry, and water conservancy to local general budgetary expenditure (X29)Negative
Number of water, environmental, and public facility management personnel per 10,000 people (X30)Negative
Coverage rate of green areas in built-up areas (X31)Negative
Water-saving irrigation machinery per 100 mu (X32)Negative
Notes: (1) The metric “water resource development and utilization rate” (X4) quantifies the magnitude of water resource exploitation and utilization within a delineated region or watershed. Typically, it is articulated as the quotient of cumulative water consumption over the entire pool of accessible water resources. (2) The metric “water production modulus” (X13) is calculated by dividing the aggregate water resources of the study area by its total land area. The examination of this metric enables us to comprehend the volume of water resources accessible per unit area, facilitating the evaluation of the abundance of water resources in the specified region. (3) “Water quality excellence rate in watershed” (X14) designates the fraction of surface water within a specific watershed that aligns with or surpasses the water quality criteria stipulated in the National Standard for Surface Water Environmental Quality (GB 3838-2002). This encompasses Class I (excellent water), Class II (good water), and Class III (slightly polluted water). This metric’s foundation is in the “assessment method for surface water environmental quality”, where the proportions of water entities conforming to various water quality designations are determined using monitoring data. (4) The metric “water production coefficient” (X17) signifies the ratio between total water resources and rainfall volume, elucidating the degree to which rainfall contributes to comprehensive water resources. (5) As per the Henan Provincial Water Resources Bulletin, the “proportion of rainfall in the flood season” (X19) pertains exclusively to the interval spanning June through September annually.
Table 2. 2000–2020 standard deviational elliptic parameters of water resource system in four river basins of Henan Province.
Water Resource SubsystemYearLongitude of Center of Gravity (°E)Latitude of Center of Gravity (°N)Standard Deviation (km) along the X Axis Standard Deviation (km) Along the Y AxisArea of an Ellipse
(10,000 km2)
Direction AngleShape Index
Exposure2000113.8034.49161.46191.669.7234.130.84
2010113.8334.49157.43192.929.5427.460.82
2020113.7134.57149.95186.708.7938.480.80
Sensitivity2000113.8634.45166.11193.0210.0744.910.86
2010113.7834.50169.06196.5110.4451.460.86
2020113.7934.43185.08198.9511.5739.180.93
Adaptation Capacity2000113.8334.40181.27199.5111.3618.500.91
2010113.7934.38181.57200.6411.4428.860.90
2020113.7534.36187.20194.9611.4732.650.96
Vulnerability2000113.8434.43173.28194.8710.6033.020.89
2010113.8034.45171.86196.4910.6134.660.87
2020113.7634.45177.91194.9510.9036.990.91
Table 3. Factor detection results.
Water Resource SubsystemExposureSensitivityAdaptability
20000.44150.73960.5352
20100.86040.51280.4252
20200.73420.74060.3042
Table 4. Suggestions for adaptive management of WRV in the Yellow-Huai-Hai-Yangtze River basins.
BasinSuggestions for Adaptive Management of WRV in the Yellow-Huai-Hai-Yangtze River Basins
Huai
River
Basin
(1)
Agricultural water resource management: Actively promote water-saving agricultural practices, emphasizing the enhancement of agricultural water use efficiency. Employ technological innovations and policy frameworks to drive the sustainable development of agriculture.
(2)
Water resource development: Strategically plan and construct new reservoirs and water diversion projects to meet the water needs of industries, agriculture, and urban residents in the Huai River basin and surrounding areas. Concurrently, implement measures to safeguard groundwater resources, mitigating the risk of over-extraction.
(3)
Water ecological environment protection: Solidify main river embankments, wipe out obstructions where they exist, and guarantee safety of the water ecology. It is only with this approach that the aquatic environment can be guaranteed long-term sustainability.
Yellow
River
Basin
(1)
Adjustment of industrial and agricultural water use: Advocate water-saving practices through pricing mechanisms and industrial access regulations. Allocate industrial and agricultural water resources judiciously to ensure sustainable water utilization.
(2)
Water ecological governance: Develop comprehensive governance plans encompassing land reclamation control, afforestation initiatives, embankment reinforcement, etc. to address geological and soil erosion challenges in the Yellow River basin. Simultaneously, utilize dredged sediment to establish a sustainable cycle.
(3)
Urban planning and waterlogging issues: Integrate urban planning with basin-wide governance strategies to effectively tackle urban waterlogging challenges. This integration will ensure the secure management of heavy rainfall and floods, aligning with broader urban development goals.
Hai
River
Basin
(1)
Control of industrial water use: In the industrial sector, conduct thorough evaluations of industries with high water consumption to drive industrial transformation and promote the rational use of industrial water resources.
(2)
River channel dredging: Focus on dredging long-neglected and obstructed river channels to ensure unimpeded water flow, thereby reducing flood risks.
(3)
Intensive use of water resources: Support the concentrated development of industrial clusters, enhance water resource utilization efficiency through technological advancements, and foster sustainable economic growth.
Yangtze
River
Basin
(1)
Flood prevention and embankment reinforcement: Perform comprehensive inspections of main river channels to identify potential risk points. Ensure that embankments have adequate flood prevention capacity and enhance overall flood prevention measures.
(2)
Water resource development: Utilizing the abundant water resources of the Yangtze River basin, create favorable conditions for the development of inland water transport.
(3)
Guarantee of water supply: Facilitate the concentrated development of central cities, intensify inter-basin water transfer initiatives, fully utilize the South-to-North Water Diversion Project, and ensure a reliable water supply.
Disclaimer/Publisher’s Note: The statements, opinions and data contained in all publications are solely those of the individual author(s) and contributor(s) and not of MDPI and/or the editor(s). MDPI and/or the editor(s) disclaim responsibility for any injury to people or property resulting from any ideas, methods, instructions or products referred to in the content.

