Article

Assessing the Impacts of Future Climate and Land-Use Changes on Streamflow under Multiple Scenarios: A Case Study of the Upper Reaches of the Tarim River in Northwest China

1
College of Hydrology and Water Resources, Hohai University, Nanjing 210098, China
2
School of Hydraulic Engineering, Wanjiang University of Technology, Ma’anshan 243000, China
3
Department of Civil, Construction and Environmental Engineering (Dept 2470), North Dakota State University, P.O. Box 6050, Fargo, ND 58108-6050, USA
*
Author to whom correspondence should be addressed.
Water 2024, 16(1), 100; https://doi.org/10.3390/w16010100
Submission received: 28 November 2023 / Revised: 24 December 2023 / Accepted: 24 December 2023 / Published: 27 December 2023
(This article belongs to the Special Issue Advances in Ecohydrology in Arid Inland River Basins)

Abstract

:
Climate change and land use/cover change (LUCC) are two major factors that alter hydrological processes. The upper reaches of the Tarim River, situated in the northwest region of China, experience a dry and less rainy climate and are significantly influenced by human activities. This study comprehensively assessed the impacts of individual and combined climate changes and LUCCs on streamflow. Three general circulation models (GCMs) were utilized to predict future climate changes under three shared socioeconomic pathways (SSP119, SSP245, and SSP585). Cellular Automata–Markov (CA–Markov) was employed to predict future LUCC under three scenarios (i.e., ecological protection, historical trend, and farmland development). Streamflow for the period 2021–2050 was simulated using the calibrated MIKE SHE model with multiple scenarios. The results showed that from 2021 to 2050, increments in both average annual precipitation and average annual temperature under the three SSPs were predicted to lead to an increased streamflow. In comparison to the conditions observed in 2000, under three LUCC scenarios for 2030, the grassland area decreased by 1.04% to 1.21%, while the farmland area increased by 1.97% to 2.26%, resulting in reduced streamflow. The related changes analysis indicated that the variation in streamflow during winter is most significant, followed by spring. The study predicted that climate change would increase streamflow, while LUCC would decrease it. Due to the greater impact of LUCC, considering the combined effect of both factors, runoff would decrease. The contribution analysis indicated that climate change contributed between −7.16% and −18.66%, while LUCC contributed between 107.16% and 118.66%.

1. Introduction

Climate change and land use/land cover change (LUCC) play a significant role in hydrological variations. Variations in precipitation and temperature due to climate change have impacts on streamflow [1]. LUCC alters streamflow by affecting evapotranspiration, interception, and infiltration. Simultaneously, the interactions between climate and land use make hydrological processes even more complex [2]. The assessment of streamflow responses to climate change and LUCC is crucial for water resources management [3,4,5].
Many studies have quantified impacts of climate change on streamflow with the aid of General Circulation Model (GCM) [6,7,8]. Due to the presence of some uncertainty, multiple GCMs are often used in research to reduce errors in simulating scenarios compared to real conditions [9,10,11]. Currently, there have been various findings on how climate change affects streamflow among different basins. Meanwhile, projections indicated increased streamflow in the future for the Yuan River Basin [12] and Yangtze River Basin [13] in China in response to escalating temperatures and precipitation levels. Conversely, in the Songkhram River Basin, Thailand [14], and the Amu Darya River Basin [15], streamflow responded differently to climate change. The integration of representative concentration pathways (RCPs) with shared socioeconomic pathways (SSPs) in the latest Coupled Model Intercomparison Project Phase 6 (CMIP6) enhances the realistic simulation of future scenarios [16,17,18].
At the same time, as human activities continue to intensify, the impacts of LUCC on streamflow have also been the subject of extensive research [19,20]. Zhang, et al. [21] concluded that the continuous expansion of cities would lead to a significant increase in streamflow. Additionally, different land-management measures, such as land reclamation or “Grain for Green” [22], have different impacts on streamflow [23,24,25]. Therefore, predicting future LUCC under different scenarios and determining its impact on streamflow is important. The CA–Markov model, integrating Cellular Automata (CA) and the Markov Chain, is currently the most commonly used approach in predicting future land use [26,27,28,29,30].
Previous research has predominantly concentrated on the separate effects of climate change or LUCC on runoff, often relying on historical data [31,32,33]. Research on comprehensive studies about how runoff will change in the future under the combined impacts of climate change and LUCC remains limited. The Tarim River, situated in the arid northwest region of China, is the country’s largest inland river [34,35], yet there is still a lack of research on this aspect within its basin. To implement more scientific management of the valuable water resources, it is crucial to precisely assess the impacts of future climate change and LUCC on streamflow.
To fill this research gap, this study employed multi-GCMs to predict future climate change and utilized the CA–Markov model to project future LUCC. Three climate change scenarios (SSP119, SSP245, and SSP585), three LUCC scenarios (i.e., ecological protect, history trend, and farmland development), and nine integrated scenarios were established. The hydrological model was established by coupling MIKE SHE with MIKE 11, followed by separate streamflow simulations for each of the 15 scenarios. Furthermore, the study analyzed the individual and combined influences of climate change and LUCC on streamflow using metrics such as the relative change rate (RCA) and contribution rate (Figure 1).

2. Methodology

2.1. MIKE SHE Model

MIKE SHE is a grid-based model that uses physics-based algorithms to represent distributed processes of the hydrological cycle [36]. MIKE SHE was developed to model water movement, including overland flow, snow melting, rivers and lakes, and unsaturated and saturated flow [37]. The overland flow simulation used a two-dimensional diffusive wave approximation by the finite-difference method. The modified degree–day method was used to simulate snow melting, where the starting times of snowfall and snowmelt were determined by setting threshold temperatures. The characteristic functions of the degree–day method are determined on a time scale based on a day [38]. It has been proved to be accurate of the physically based models [39]. The unsaturated flow was quantified by a two-layer water-balance method. The saturated flow was modeled using a numerical finite-difference scheme.
The rivers and lakes model was based on the one-dimensional unsteady flow Saint–Venant equations. Using MIKE SHE and MIKE 11 [40], the dynamic coupling model of surface water and groundwater was established. In the coupled modeling system, data exchange between two models was achieved through shared storage space, where simulation can be simultaneous in both MIKE SHE and MIKE 11 [41].

2.2. CA–Markov Model

CA–Markov combines the dual advantages of simulating complex spatial dynamic changes through Cellular Automata (CA) models and making long-term predictions using Markov models. The model is widely applied in simulating the dynamic changes in land use and cover structures over long sequences [29,42,43].
The Markov chain is a stochastic probability model characterized by the current state being only related to the preceding state [44]. Additionally, it is discrete in both time series and events [45]. Equation (1) describes the properties of the Markov chain:
V t + 1 = V t × P i j
P i j = P 11 P 12 P 1 n P 21 P 22 P 2 n P n 1 P n 2 P n n 0 P i j 1
where V t and V t + 1 denote the system state at time t and t + 1 , respectively. Meanwhile, P i j is the probability of transitioning from state i to state j in the subsequent time period.
The CA is a dynamic model that is discrete in both time and space [46]. The principle is to predict the state of the next time step by utilizing specific transformation rules based on the current state of individual cells and their neighboring states in the cellular automaton [47]. The model can be defined as follows:
S ( t ,   t + 1 ) = f ( S ( t ) ,   N )
where S denotes a set of cellular states within the field N , while t and t + 1 are consecutive time periods. The transition rule of the cell is denoted as f .

2.3. Accuracy Evaluation

Calibration and validation are pivotal in enhancing model accuracy, significantly reducing the uncertainty stemming from their intricate iterative equations [48]. To gauge model performance, two widely adopted metrics (the Nash–Sutcliffe efficiency coefficient (NSE) [49,50,51] and Root Mean Square Error (RMSE) [52]) were utilized. They are defined as follows:
N S E = 1 i = 1 n ( Q o b s , i Q s i m , i ) 2 i = 1 n ( Q o b s , i Q ¯ o b s ) 2
R M S E = 1 n i = 1 n ( Q o b s , i Q s i m , i ) 2
where Q o b s , i and Q s i m , i refer to the observed and simulated streamflow on the i-th day (m3/s), respectively. Meanwhile, Q o b s and Q s i m are the mean observed and simulated head values throughout the simulation period (m3/s), with n indicating the total number of time steps [53].
The accuracy assessment of land-use prediction involves testing with indicators. One such indicator is the Kappa index, originally introduced by Cohen [54]. This index assesses the consistency between measured data and simulated result. It is a commonly used criterion for assessing the relationship between simulated data of land use map and actual data [42,55].
K a p p a = P 0 P c P p P c
where P 0 is the observed agreement rate between the reference map and the simulation results. Meanwhile, P c stands for the expected proportion of correct simulations in a random scenario. On the other hand, P p denotes the proportion of correct simulations in the ideal classification case, typically considered as 1.

2.4. Separating Effects of Climate Change and LUCC

Following streamflow forecasting, it becomes essential to analyze the subsequent impacts of climate changes and LUCC on streamflow. The quantitative assessment of the contributions made by these changes to streamflow involves calculations using the following formulas:
Q L , C = Q L , C Q b a s e l i n e
where Q L , C is the overall change in future streamflow compared to the baseline, Q L , C denotes the streamflow projected under future climate and land-use scenarios, Q b a s e l i n e stands for the streamflow during the baseline period.
η L = Q L , b a s e l i n e Q b a s e l i n e Q L , C
η C = Q b a s e l i n e , C Q b a s e l i n e Q L , C
where η L and η C are the contribution of LUCC and climate changes to streamflow, respectively. Q L , b a s e l i n e is the streamflow under future land-use scenarios and baseline climate conditions. Similarly, Q b a s e l i n e , C is the streamflow under the baseline land-use scenario and future climate change conditions.

3. Study Area and Data
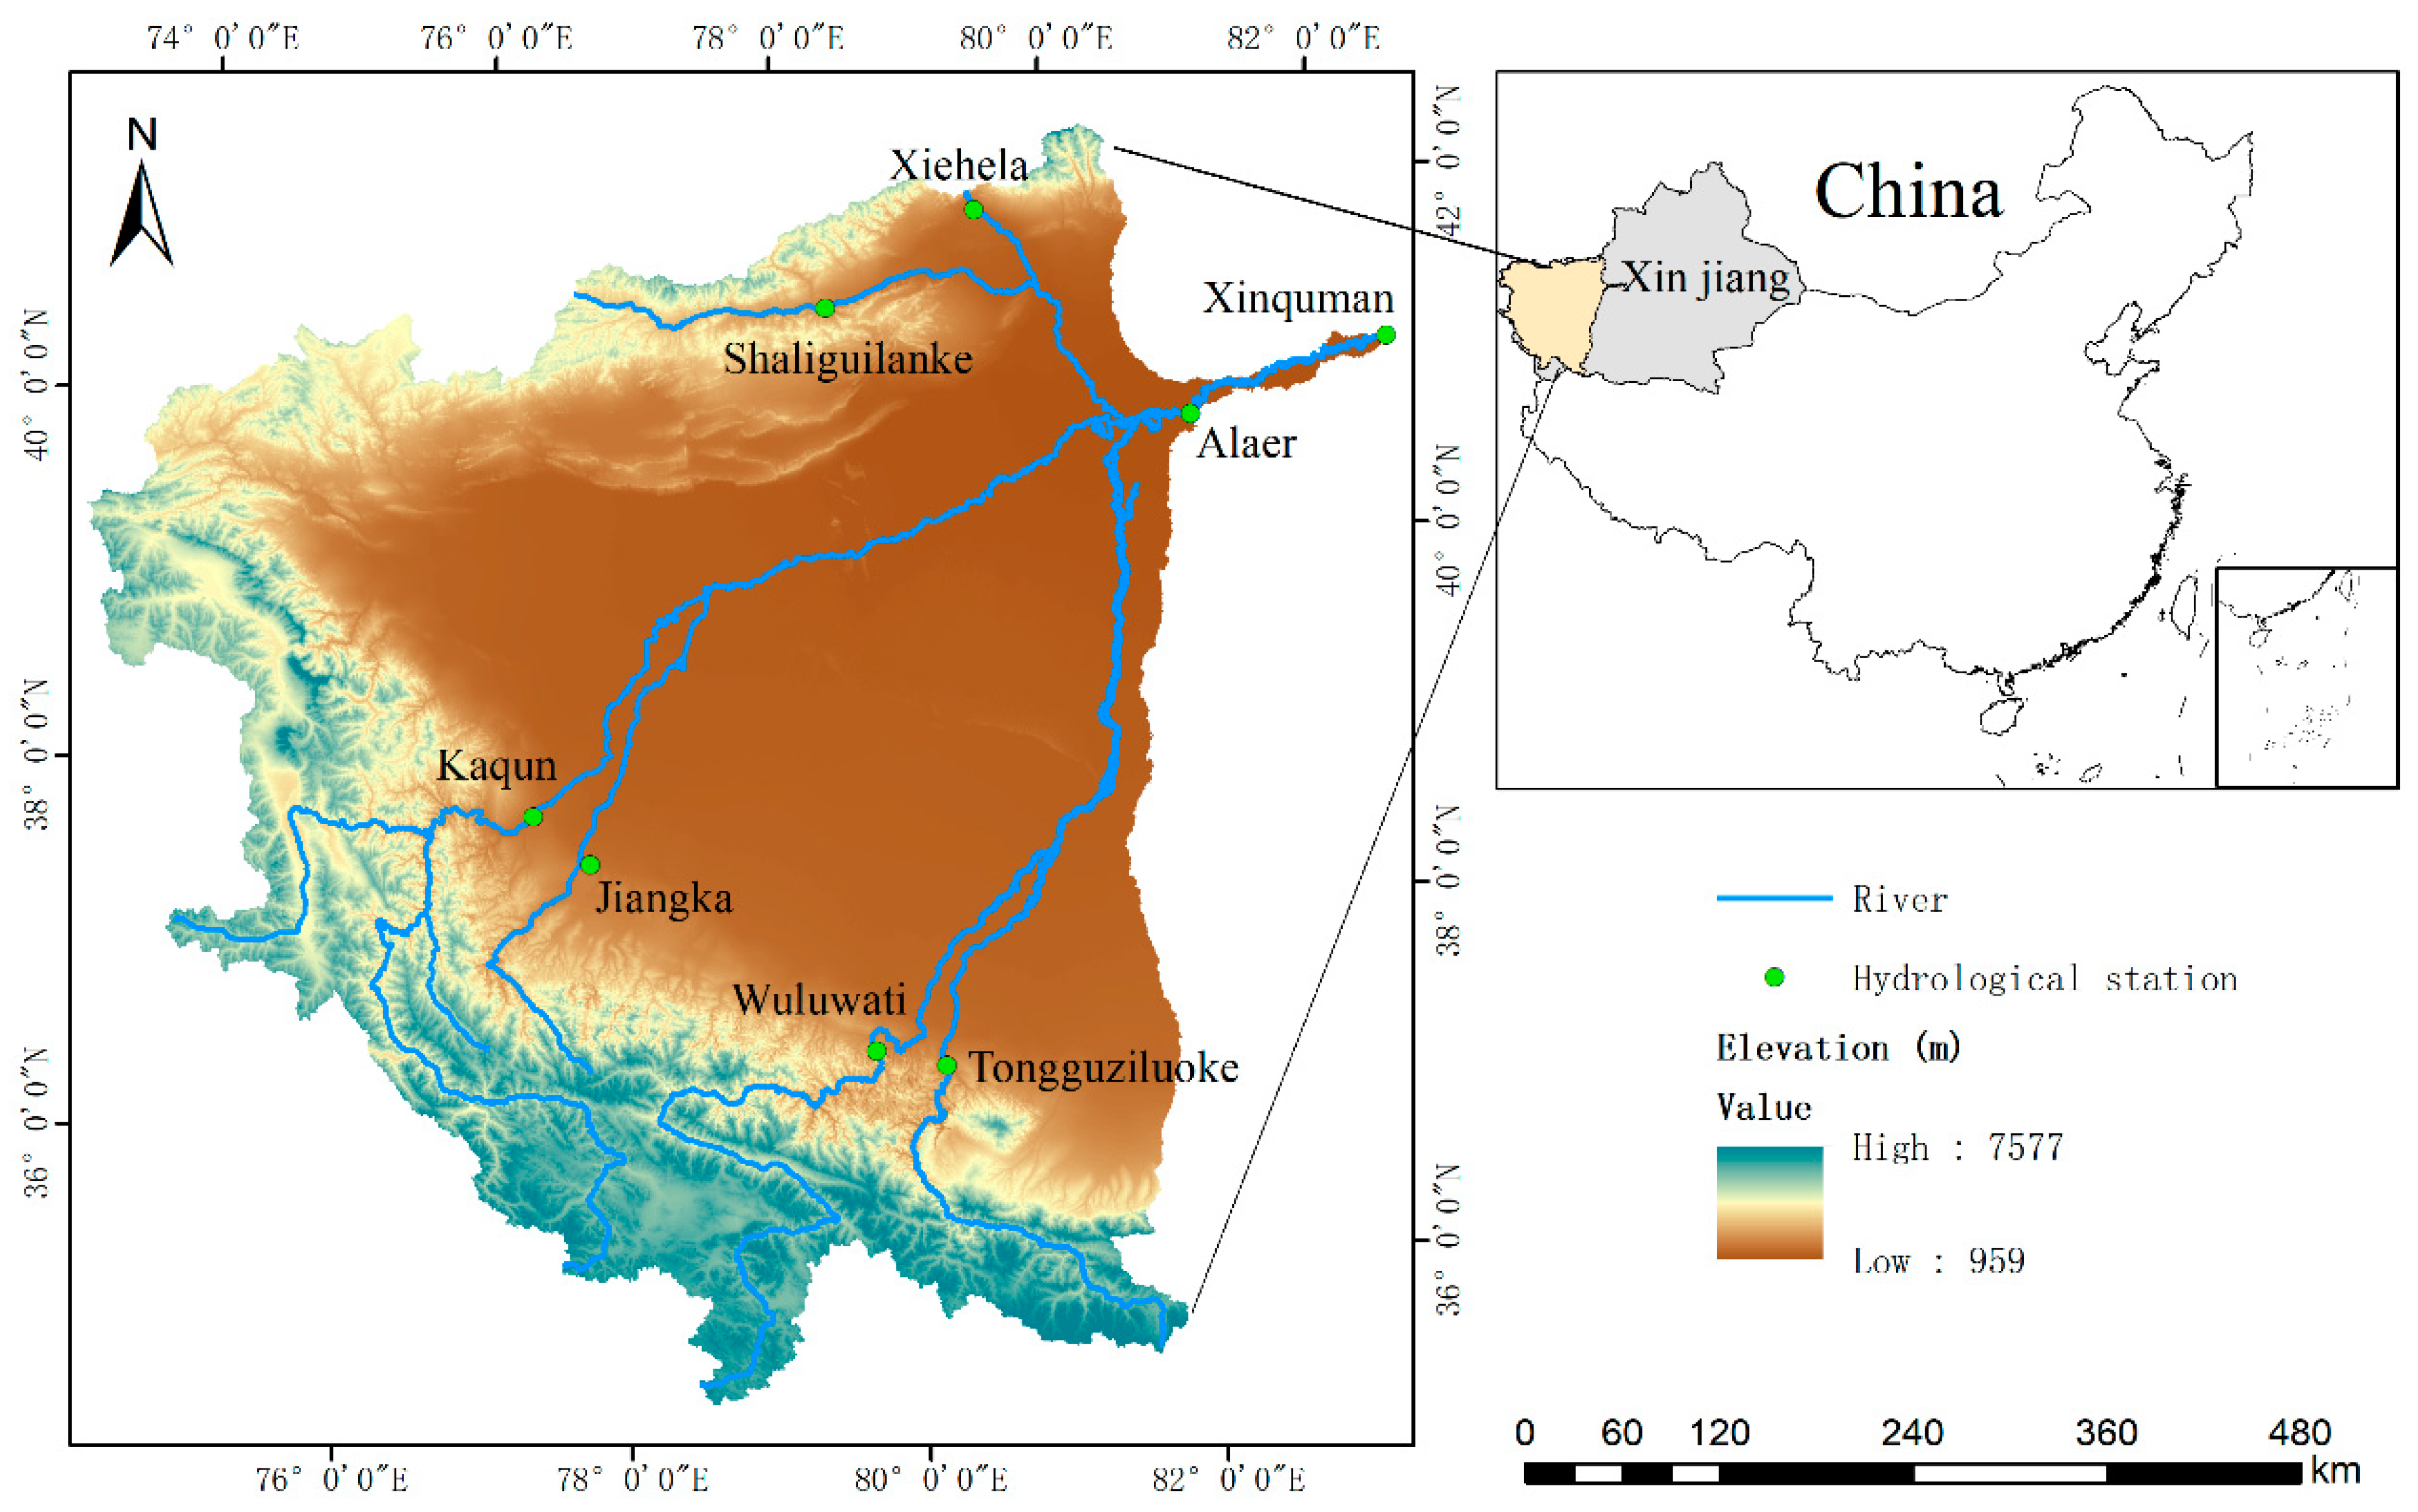
3.1. Study Area

The Tarim River (Northwest China, Xinjiang Uygur Autonomous Region) is the longest inland river in the country [34]. Dominated by the typical continental temperate arid climate, the Tarim River Basin (TRB) is a typical water-shortage area with mean annual precipitation of less than 116 mm, an annual mean temperature of about 10 °C, and potential evapotranspiration of up to 2200 mm per year [56,57]. Except for summer precipitation in mountains, seasonal snowmelt and glacier melt dominate the runoff in the TRB. Thus, flow characteristics are sensitive to climate change [58].
As shown in Figure 2, the study area is located in the upper reaches of the Tarim River Basin (URTRB), covering an expanse of 3.43 × 10⁵ km2. This region comprises the Aksu, Yerqiang, and Hetian Rivers, as well as the mainstream above the Xinquman hydrological station. Among them, the Aksu River is the main source of the TRB, contributing about 73.2% of the water supply [59]. In such an ecological fragile area, with the long-term development and utilization, streamflow processes and land-use patterns have changed greatly [60,61]. The contradiction between economic development and ecological protection poses an unprecedented challenge to the management of the river basin.

3.2. Data

The hydrological data used in this study included: (1) The discharge data collected by six hydrological stations in the source stream (i.e., Xiehela, Shaliguilanke, Kaqun, Jiangka, Wuluwati, and Tongguziluoke) and two hydrological stations in the mainstream (i.e., Alaer and Xinquman); and (2) The water level data of the Xinquman hydrological station in the lower reaches. These hydrological data during ~1985–2014 were monitored and provided by the Tarim River Basin Authority.
All climate data (from 12 meteorological stations during ~1985–2014), including precipitation, temperature, and evaporation, were provided by the China Meteorological Data-Sharing Service System. We used the Thiessen polygon method to deal with the data of each station and obtained the average value of the meteorological data in the study area. The future climate change data were acquired from the National Tibetan Plateau Data Center (http://data.tpdc.ac.cn, accessed on 1 December 2023). The data were downscaled by Peng, et al. [62] using the Delta method [63,64] and have been widely used [65,66,67]. These monthly scale meteorological data were derived from three climate models: EC–Earth3, GFDL–ESM4, and MRI–ESM2–0 under SSP119, SSP245, and SSP585 scenarios with a spatial resolution of 30 s × 30 s from 2021–2050.
The Digital Elevation Model (DEM) data in this study were obtained from the Landsat series images available on the Geospatial Data Cloud (https://www.gscloud.cn, accessed on 1 December 2023). The DEM, with a resolution of 90 m, served as the primary data source for characterizing the terrain and river network within the catchment. Land-use data for this study were sourced from the Resource and Environment Science and Data Center at the Chinese Academy of Sciences (https://www.resdc.cn, accessed on 1 December 2023). The remote-sensing images were utilized to analyze changes in land-use patterns in the study area. In this study, the categories were reclassified as cropland, forest, grassland, built-up land, unused land, and water bodies. Soil type and soil depth were based on data of Harmonized World Soil Database (HWSD). Using the SPAW hydrology 6.02.75 software, the soil types were reclassified based on soil attributes into 13 different categories.

3.3. Scenario Design

Three LUCC scenarios, representing a spectrum of tradeoffs between ecological preservation and farmland development, were introduced to examine the impact of diverse land-use policies on streamflow. These scenarios include ecological protection (EP), historical trends (HT), and farmland development (FD).
(1)
EP Scenario. The scenario enacts ecological conservation, keeping the area of farmland and urban space unchanged while gradually expanding the grassland and forest areas each year.
(2)
HT Scenario. This scenario indicates that future land use remains unaffected by any policy influence and continues to develop along historical trends.
(3)
FD Scenario. This scenario assumes that human activities are steadily increasing, with farmland land and urban areas experiencing gradual expansion.
A total of nine different scenarios have been created by combining climate and land-use/cover changes. We assemble SSPs with EP as EPs (i.e., EP119, EP245, and EP585); HT as HTs (i.e., HT119, HT245, and HT585); and FD as FDs (i.e., FD119, FD245, and FD585).

4. Result and Discussion

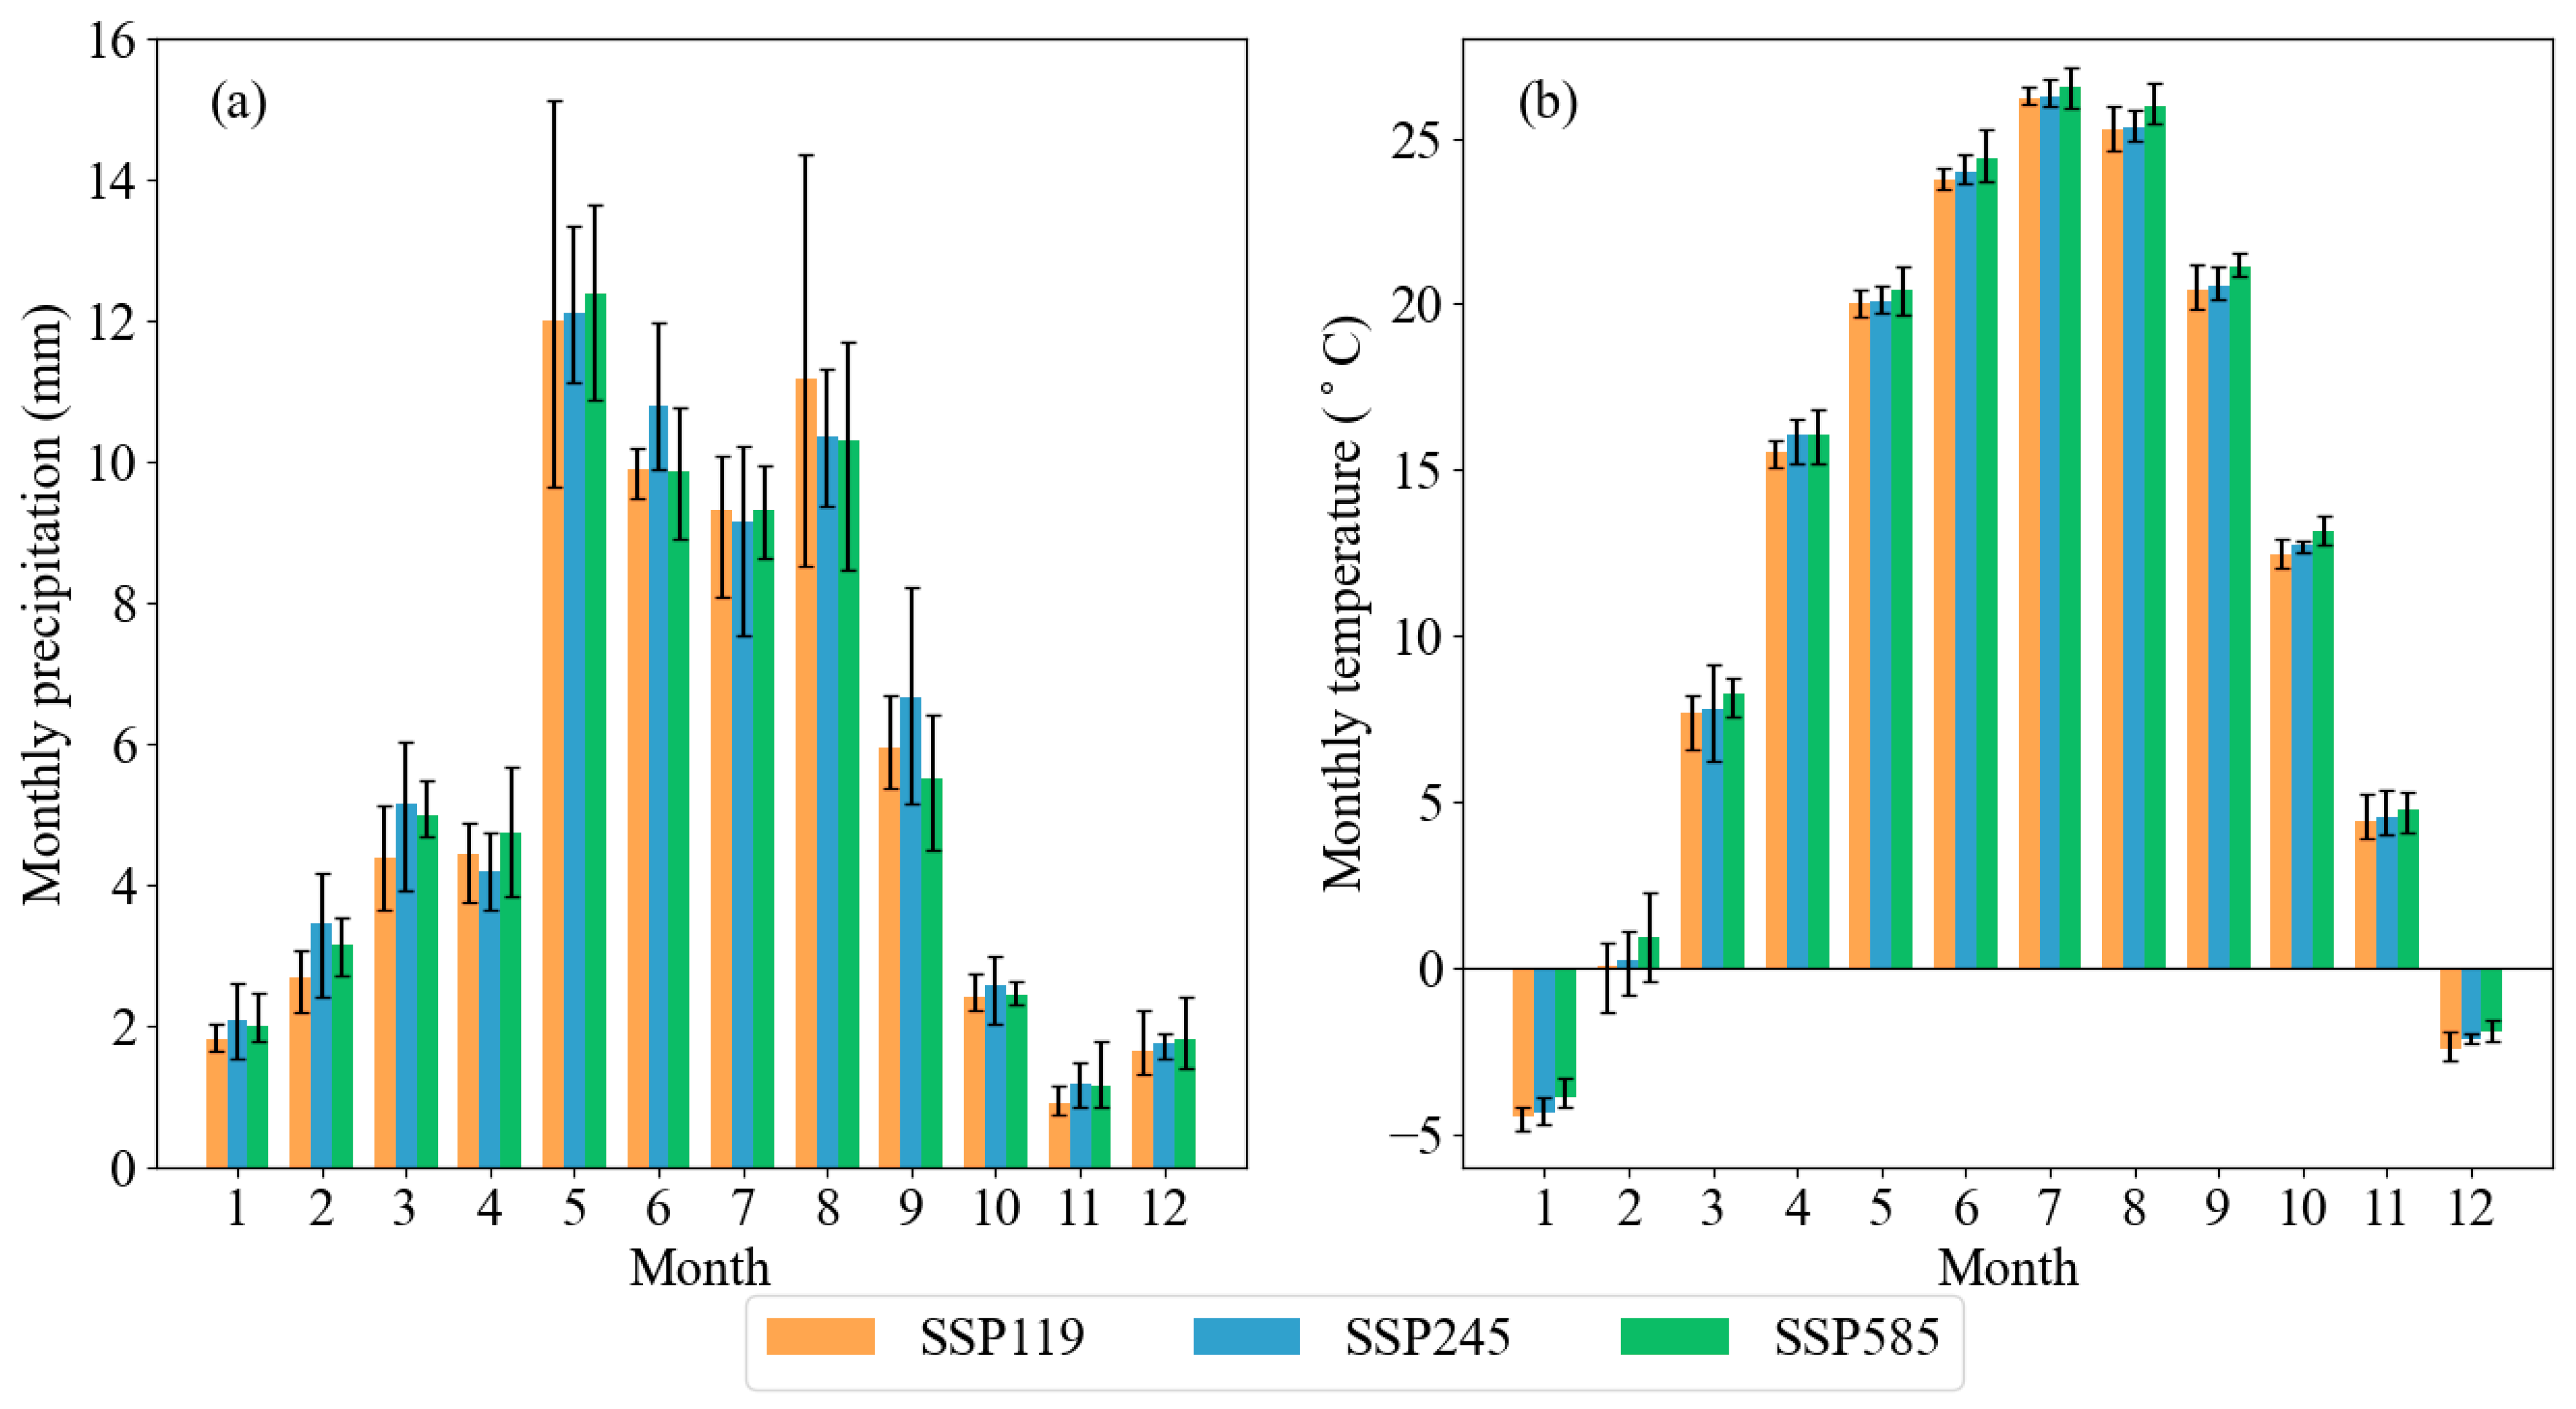
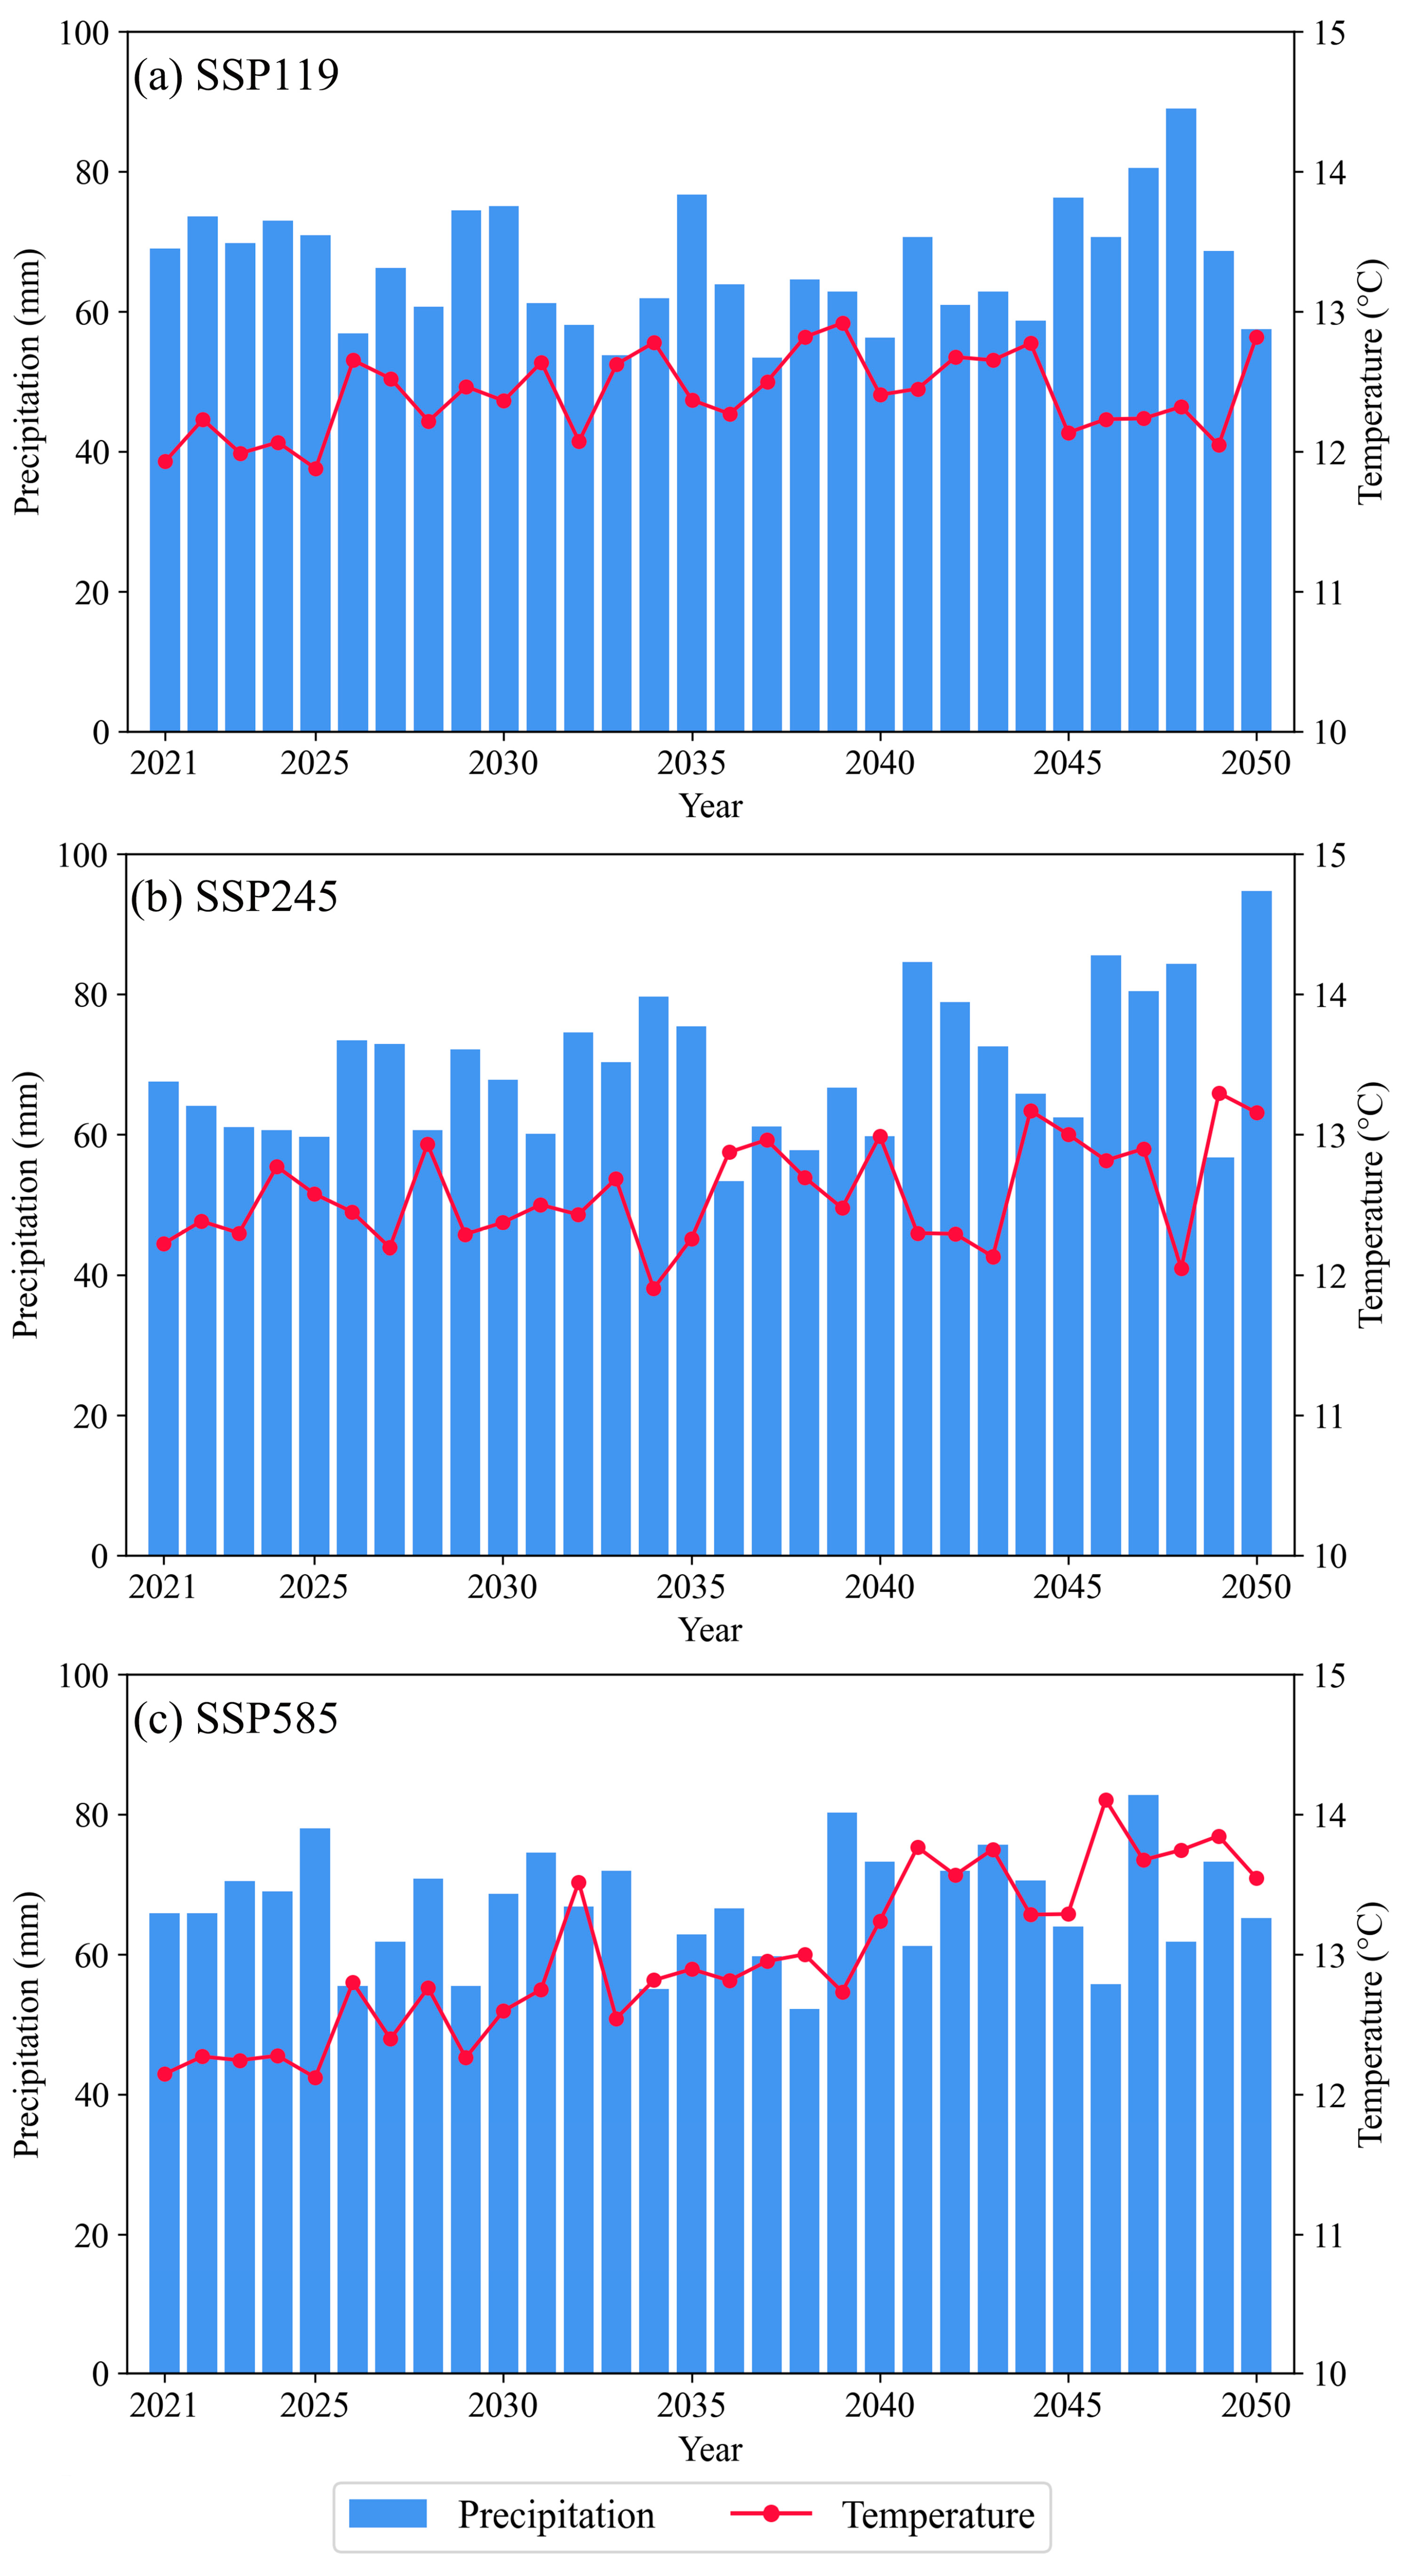
4.1. Climate Change Scenarios

To reduce the uncertainty of future climate data, this study employed the average values of the EC–Earth3, GFDL–ESM4, and MRI–ESM2–0 models as the basis for analyzing future climate data. As shown in Figure 3, the bar chart represents the mean monthly precipitation and temperatures for the period from 2021 to 2050 over URTRB. The error bars depict the range of the multi-model ensemble. The multi-model ensemble range for the monthly temperature is small. In contrast, for monthly precipitation, it is much larger. This indicates that, across various SSP scenarios, monthly temperatures exhibit more similarity, while there is a greater degree of uncertainty in monthly precipitation. Precipitation in the URTRB is extremely unevenly distributed throughout the year, with very little rainfall in the spring and winter, leading to drought conditions. In contrast, precipitation during the summer season is significantly higher, accounting for 49% to 51% of the annual total, and it can easily lead to flooding. At the same time, temperatures vary significantly across different months, with a difference of about 30 °C between the highest and lowest temperatures. January, February, March, November, and December all have temperatures below freezing, which is why precipitation primarily occurs in the form of snow. It is not surprising that the monthly average temperature increases with the increase in radiation intensity.
Figure 4 shows the future precipitation and temperature under various SSP scenarios for the period from 2021–2050. The overall temperature exhibited a notable upward trend. The rising temperature helps to melt snow in mountainous areas, so as the melting snow replenishes runoff, it also helps with vegetation growth. At the same time, there is no significant change in precipitation. The annual average precipitation under SSP245 is 69.48 mm, slightly higher than 66.59 mm under SSP119 and 67.69 mm under SSP585.

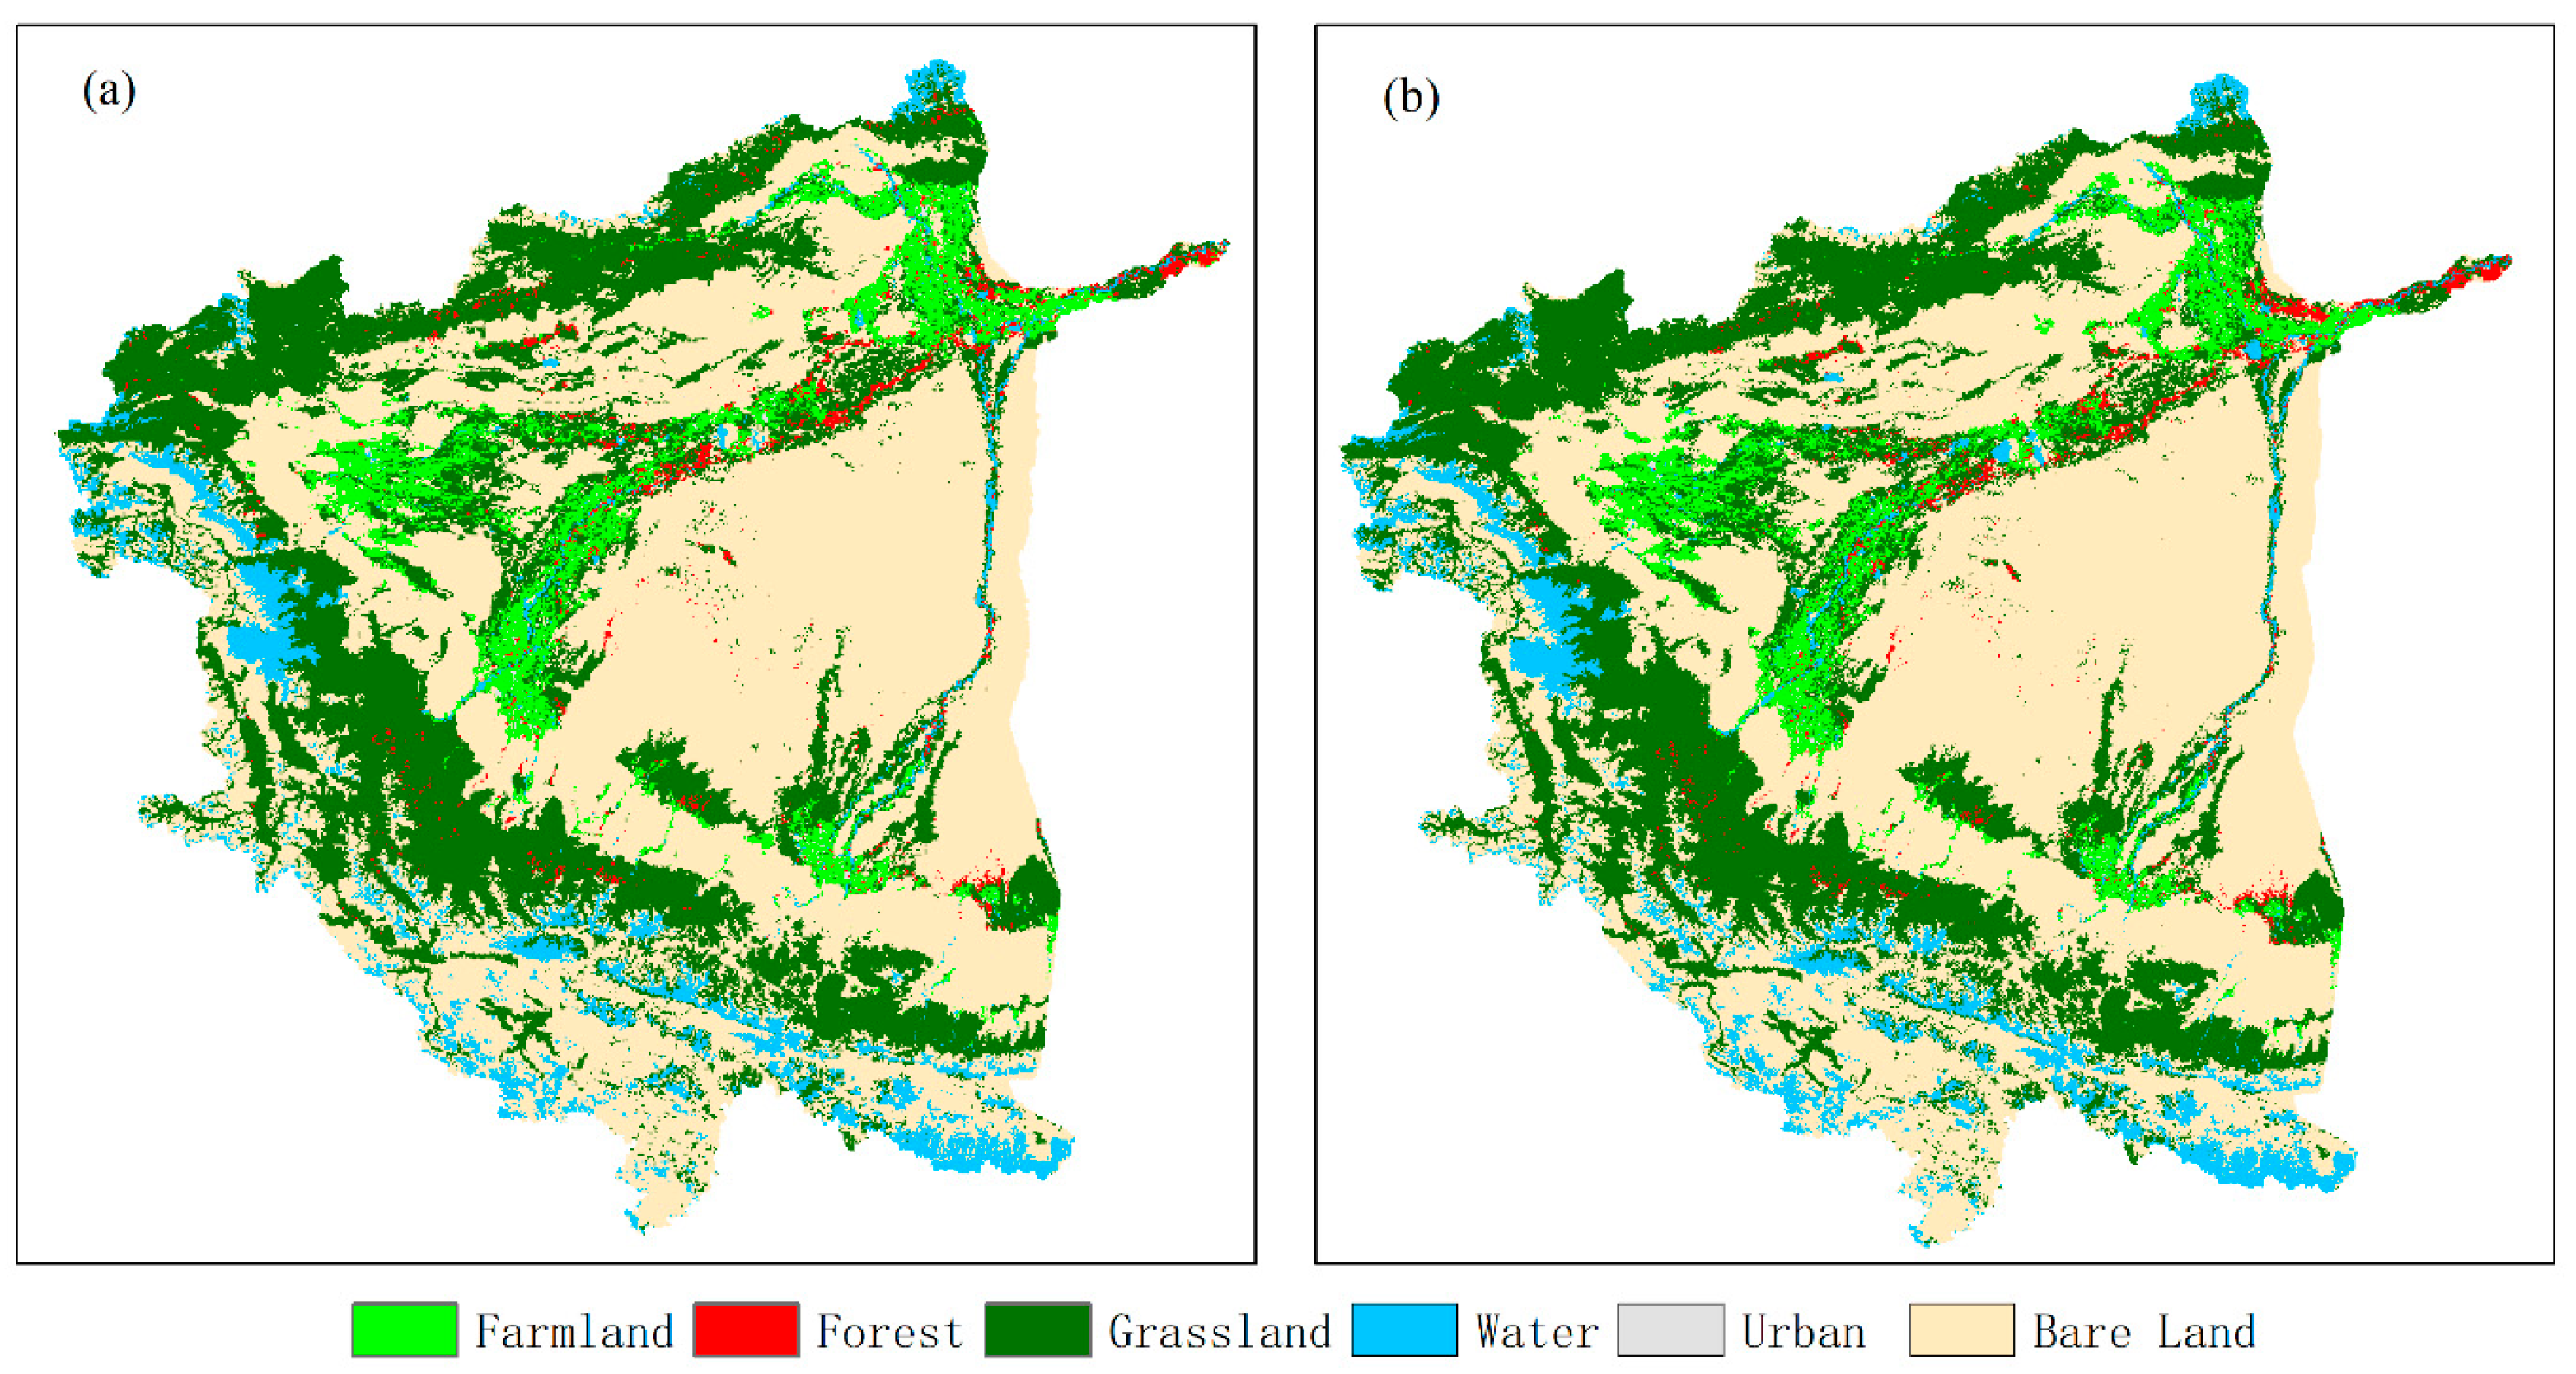
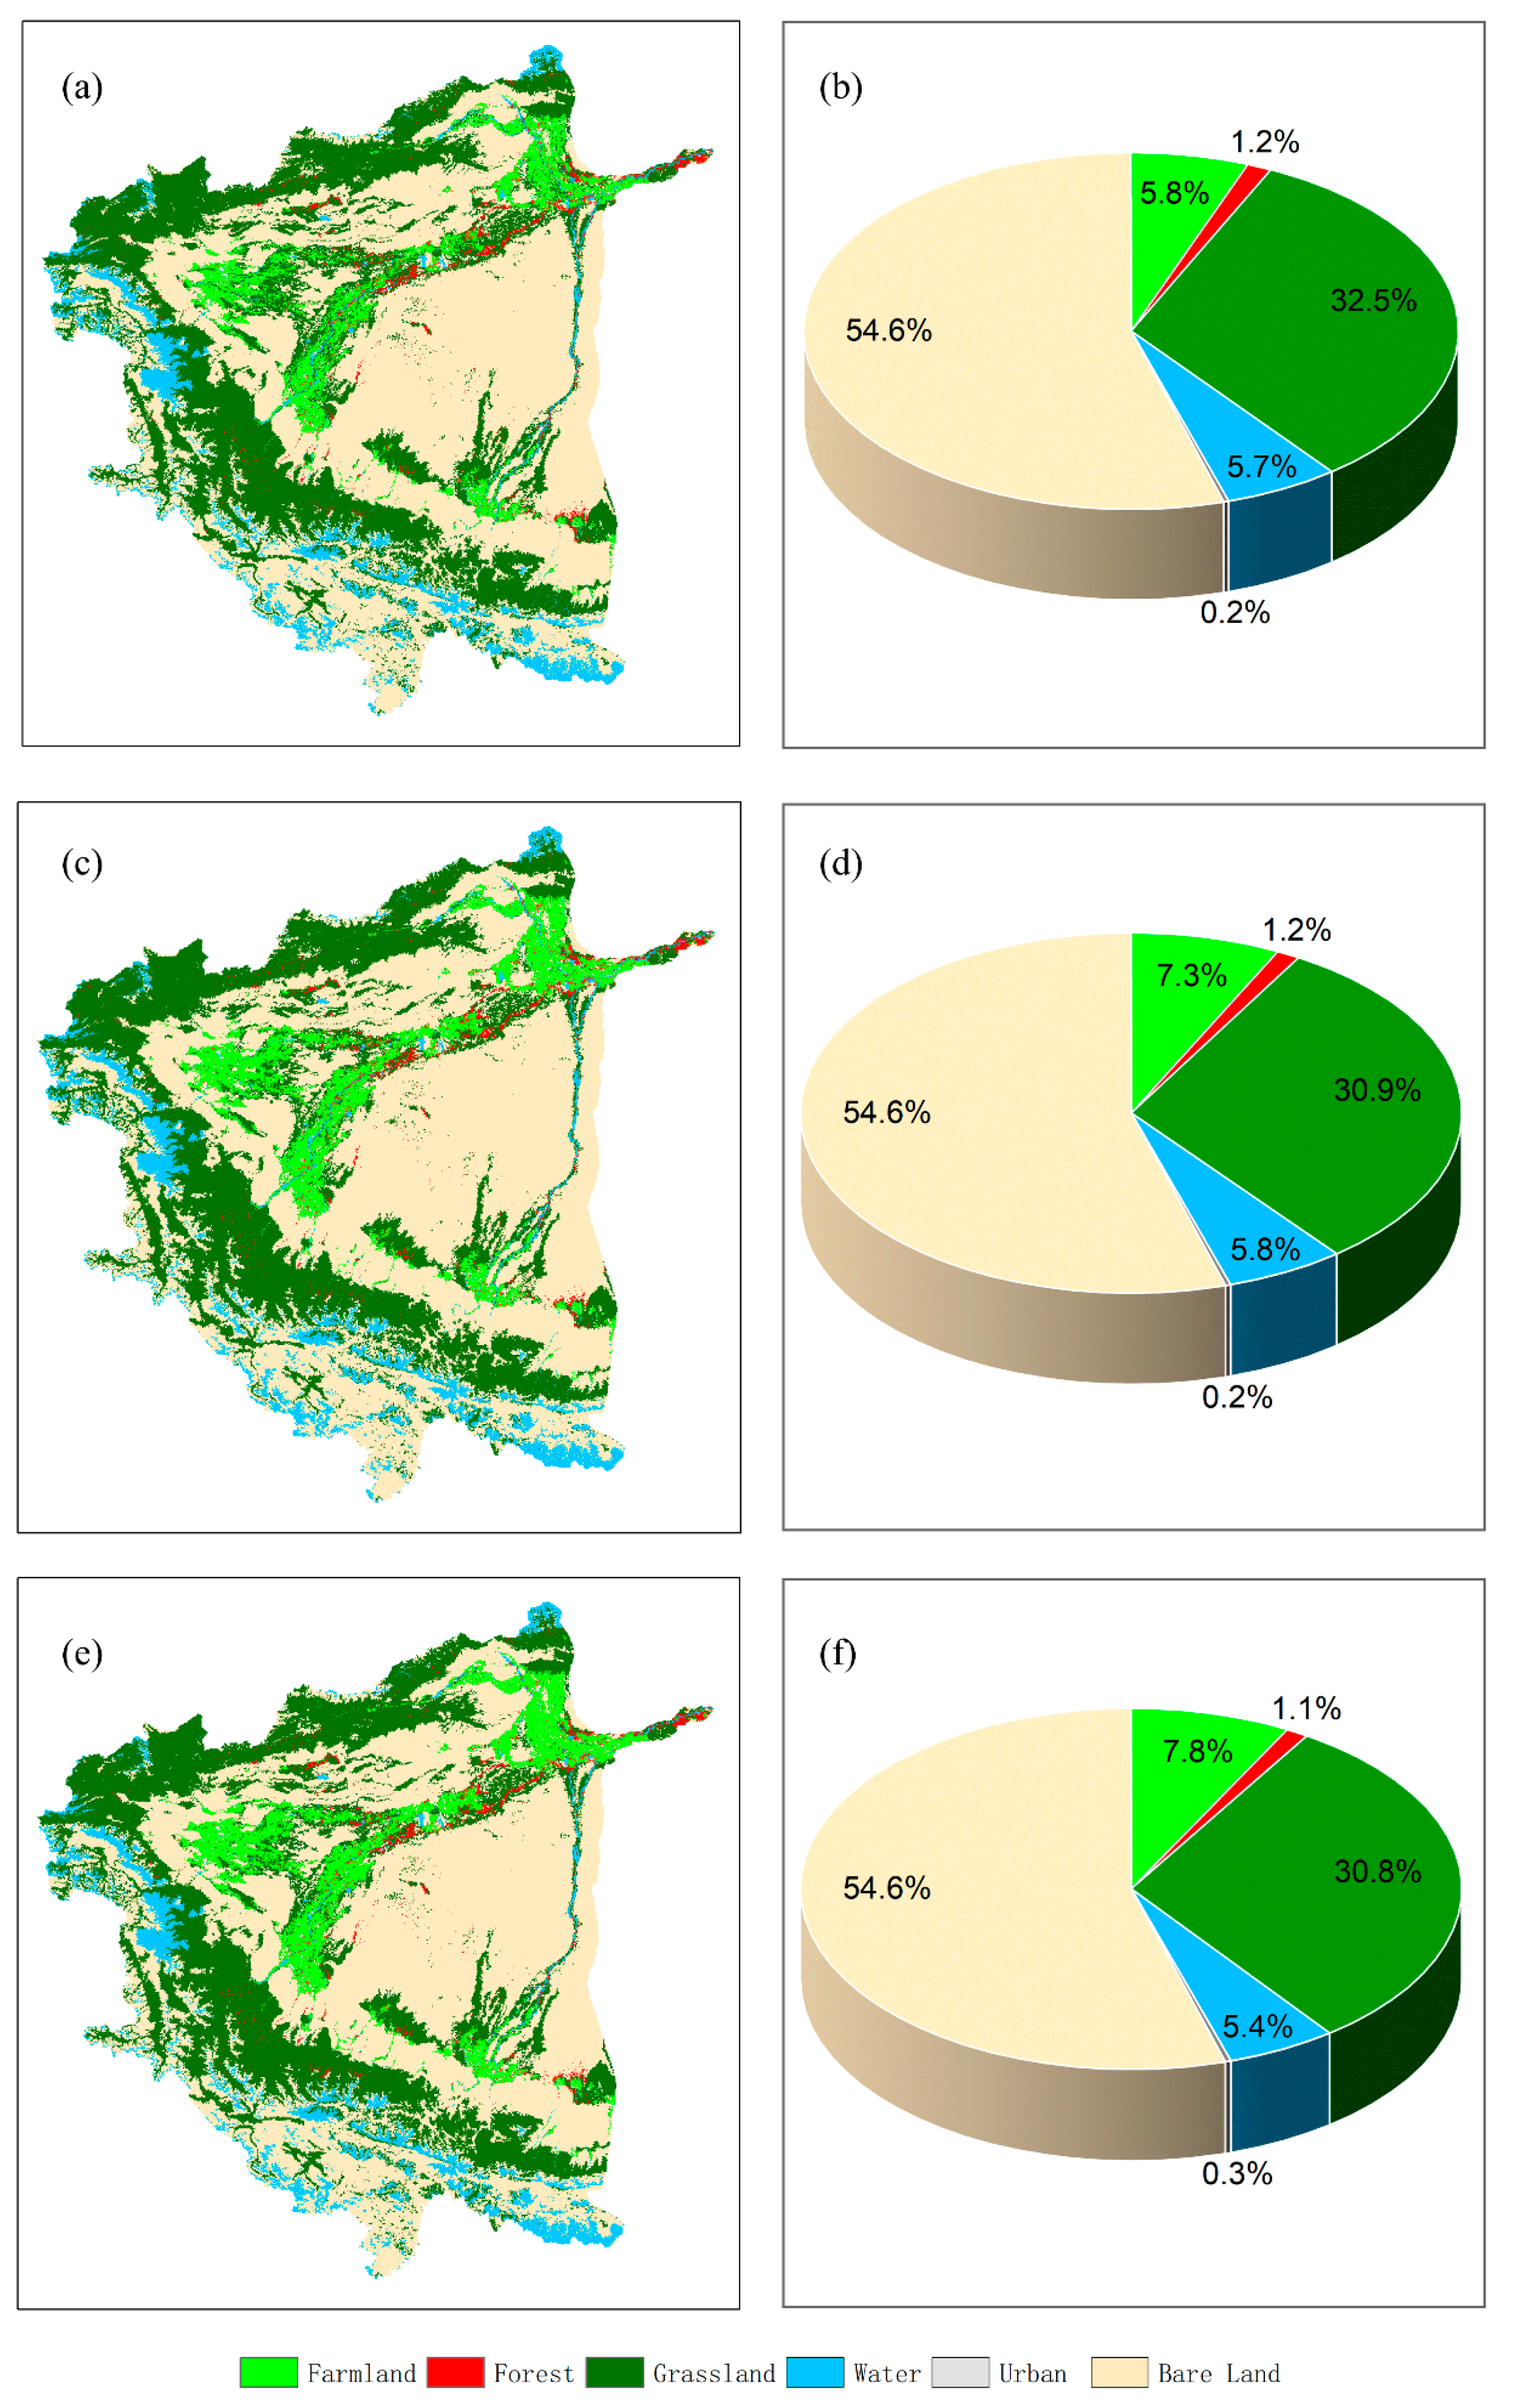
4.2. Land Use Change Scenarios

The CA–Markov model was used to simulate 2010 land-use patterns, leveraging data from 2000 as a basis. As shown in Figure 5, the Kappa value is 0.87, indicating that the simulated and measured land-use projections demonstrate satisfactory agreement.
As shown in Figure 6, the CA–Markov model was employed to simulate the LUCC under the three scenarios in 2030. Under the influence of different land-use policies, the conversion probabilities between different types of land use have changed. Comparing the land-use/cover simulation result of URTRB in 2030 with those in 2000, we concluded that after 30 years of change, the proportion of farmland in the study area increased by 2.03%, forest decreased by 0.22%, grassland decreased by 1.14%, water bodies increased by 0.02%, urban areas increased by 0.03%, and bare land decreased by 0.66%. Under the influence of human activities, a significant amount of grassland, forest, and bare land has been developed into farmland. When comparing the simulated results of land use/cover across the three scenarios for 2030, noticeable differences in both quantity and spatial distribution among the patterns were evident. Compared to the HT scenario, in the EP scenario, there has been a 1.5% reduction in farmland, a 1.4% increase in grassland, and a 0.1% increase in forest. This indicates that through ecological protection efforts, the expansion of arable land has been reduced, leading to a greater transformation of barren land into grassland and forest. Meanwhile, in the FD scenario, farmland increased by 0.5% compared to the HT scenario while forest decreased by 0.1%, grassland decreased by 0.2%, and water bodies decreased by 0.3%. This indicates that if human activities intensify further, there will be more grassland and forest reclaimed as farmland. This would have a negative impact on the local ecological environment. Therefore, in the EP scenario, the expansion of grasslands and forests has a promoting effect on desert ecology. Moreover, excessive water resource usage will lead to a significant reduction in water bodies.

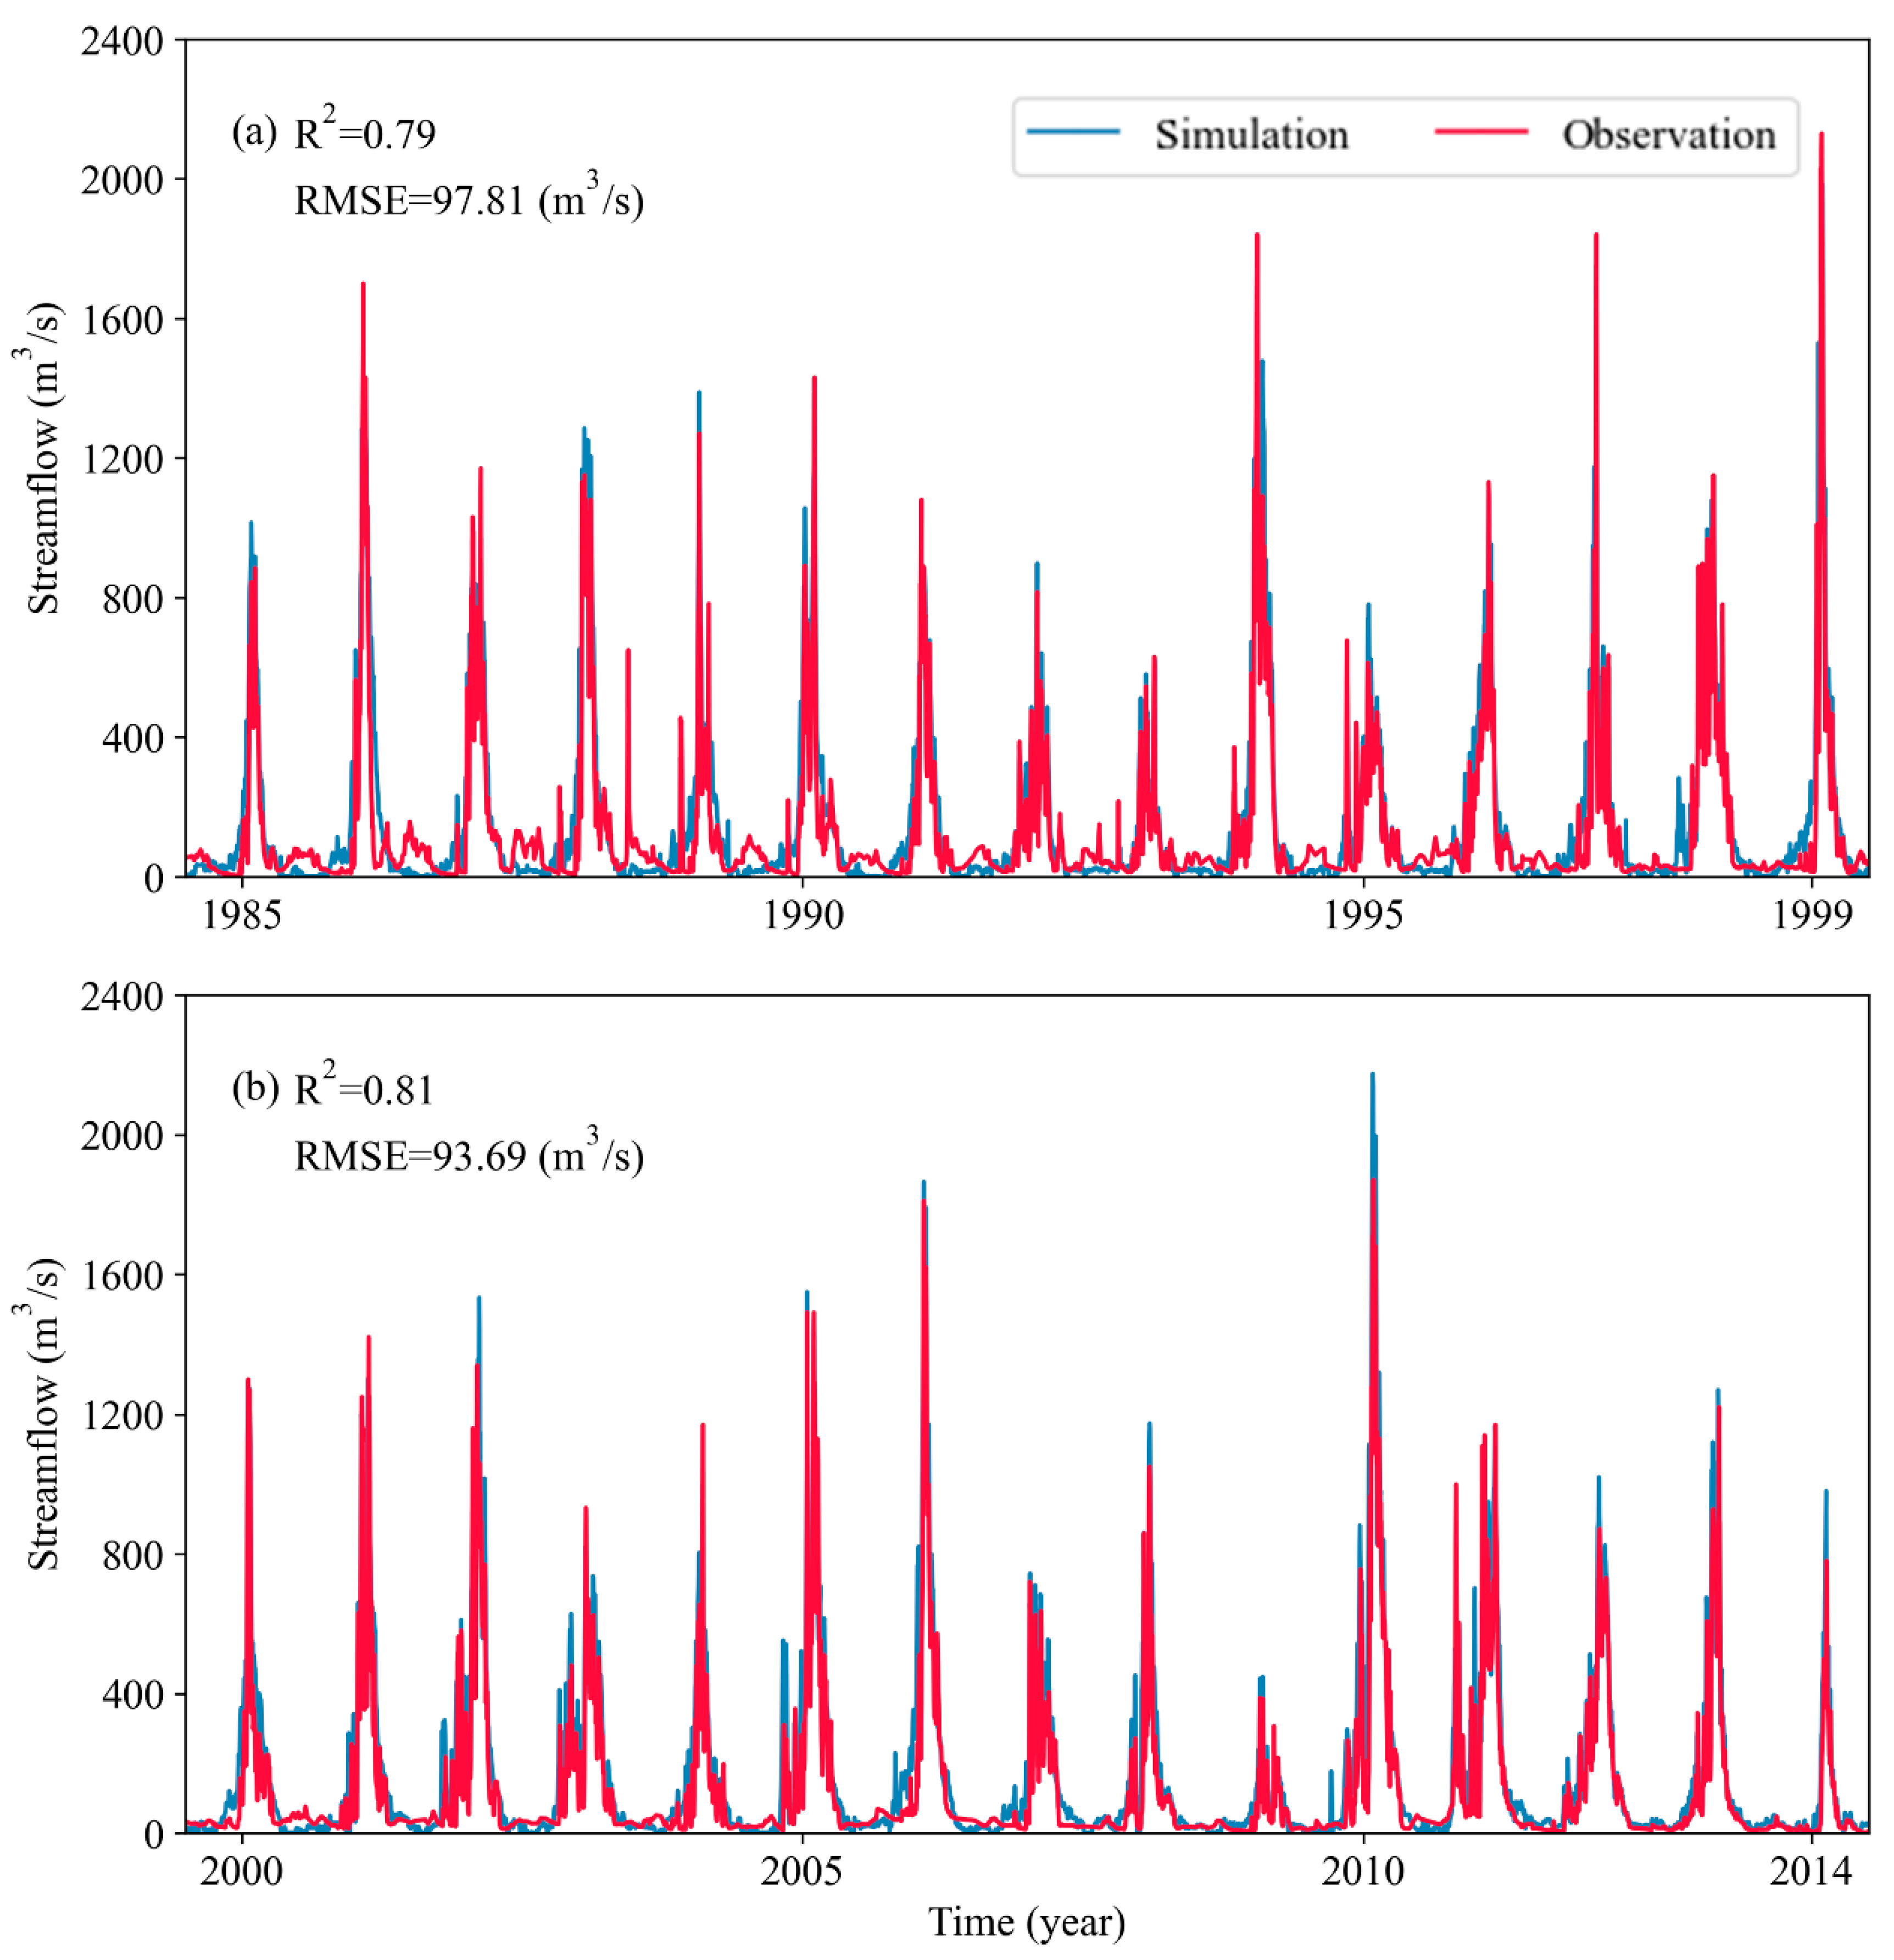
4.3. Calibration and Validation of MIKE SHE Model

The MIKE SHE model was calibrated and validated at a monthly scale for the periods of 1985–1999 and 2000–2014, respectively. Various parameters were calibrated through manual calibration (Table 1). The results indicated a good fit between observed and simulated streamflow, with NSE values of 0.79 and 0.81 and RMSE values of 97.81 m3/s and 93.81 m3/s for the calibration and validation periods, respectively. The hydrological model fits well for both low and peak flow conditions as shown in Figure 7. According to the criteria outlined in Moriasi, Gitau, Pai, and Daggupati [52], the simulation results during both the calibration and validation periods consistently met the “Very Good” standard. They suggested that the MIKE SHE model was deemed suitable for simulating streamflow in the URTRB.

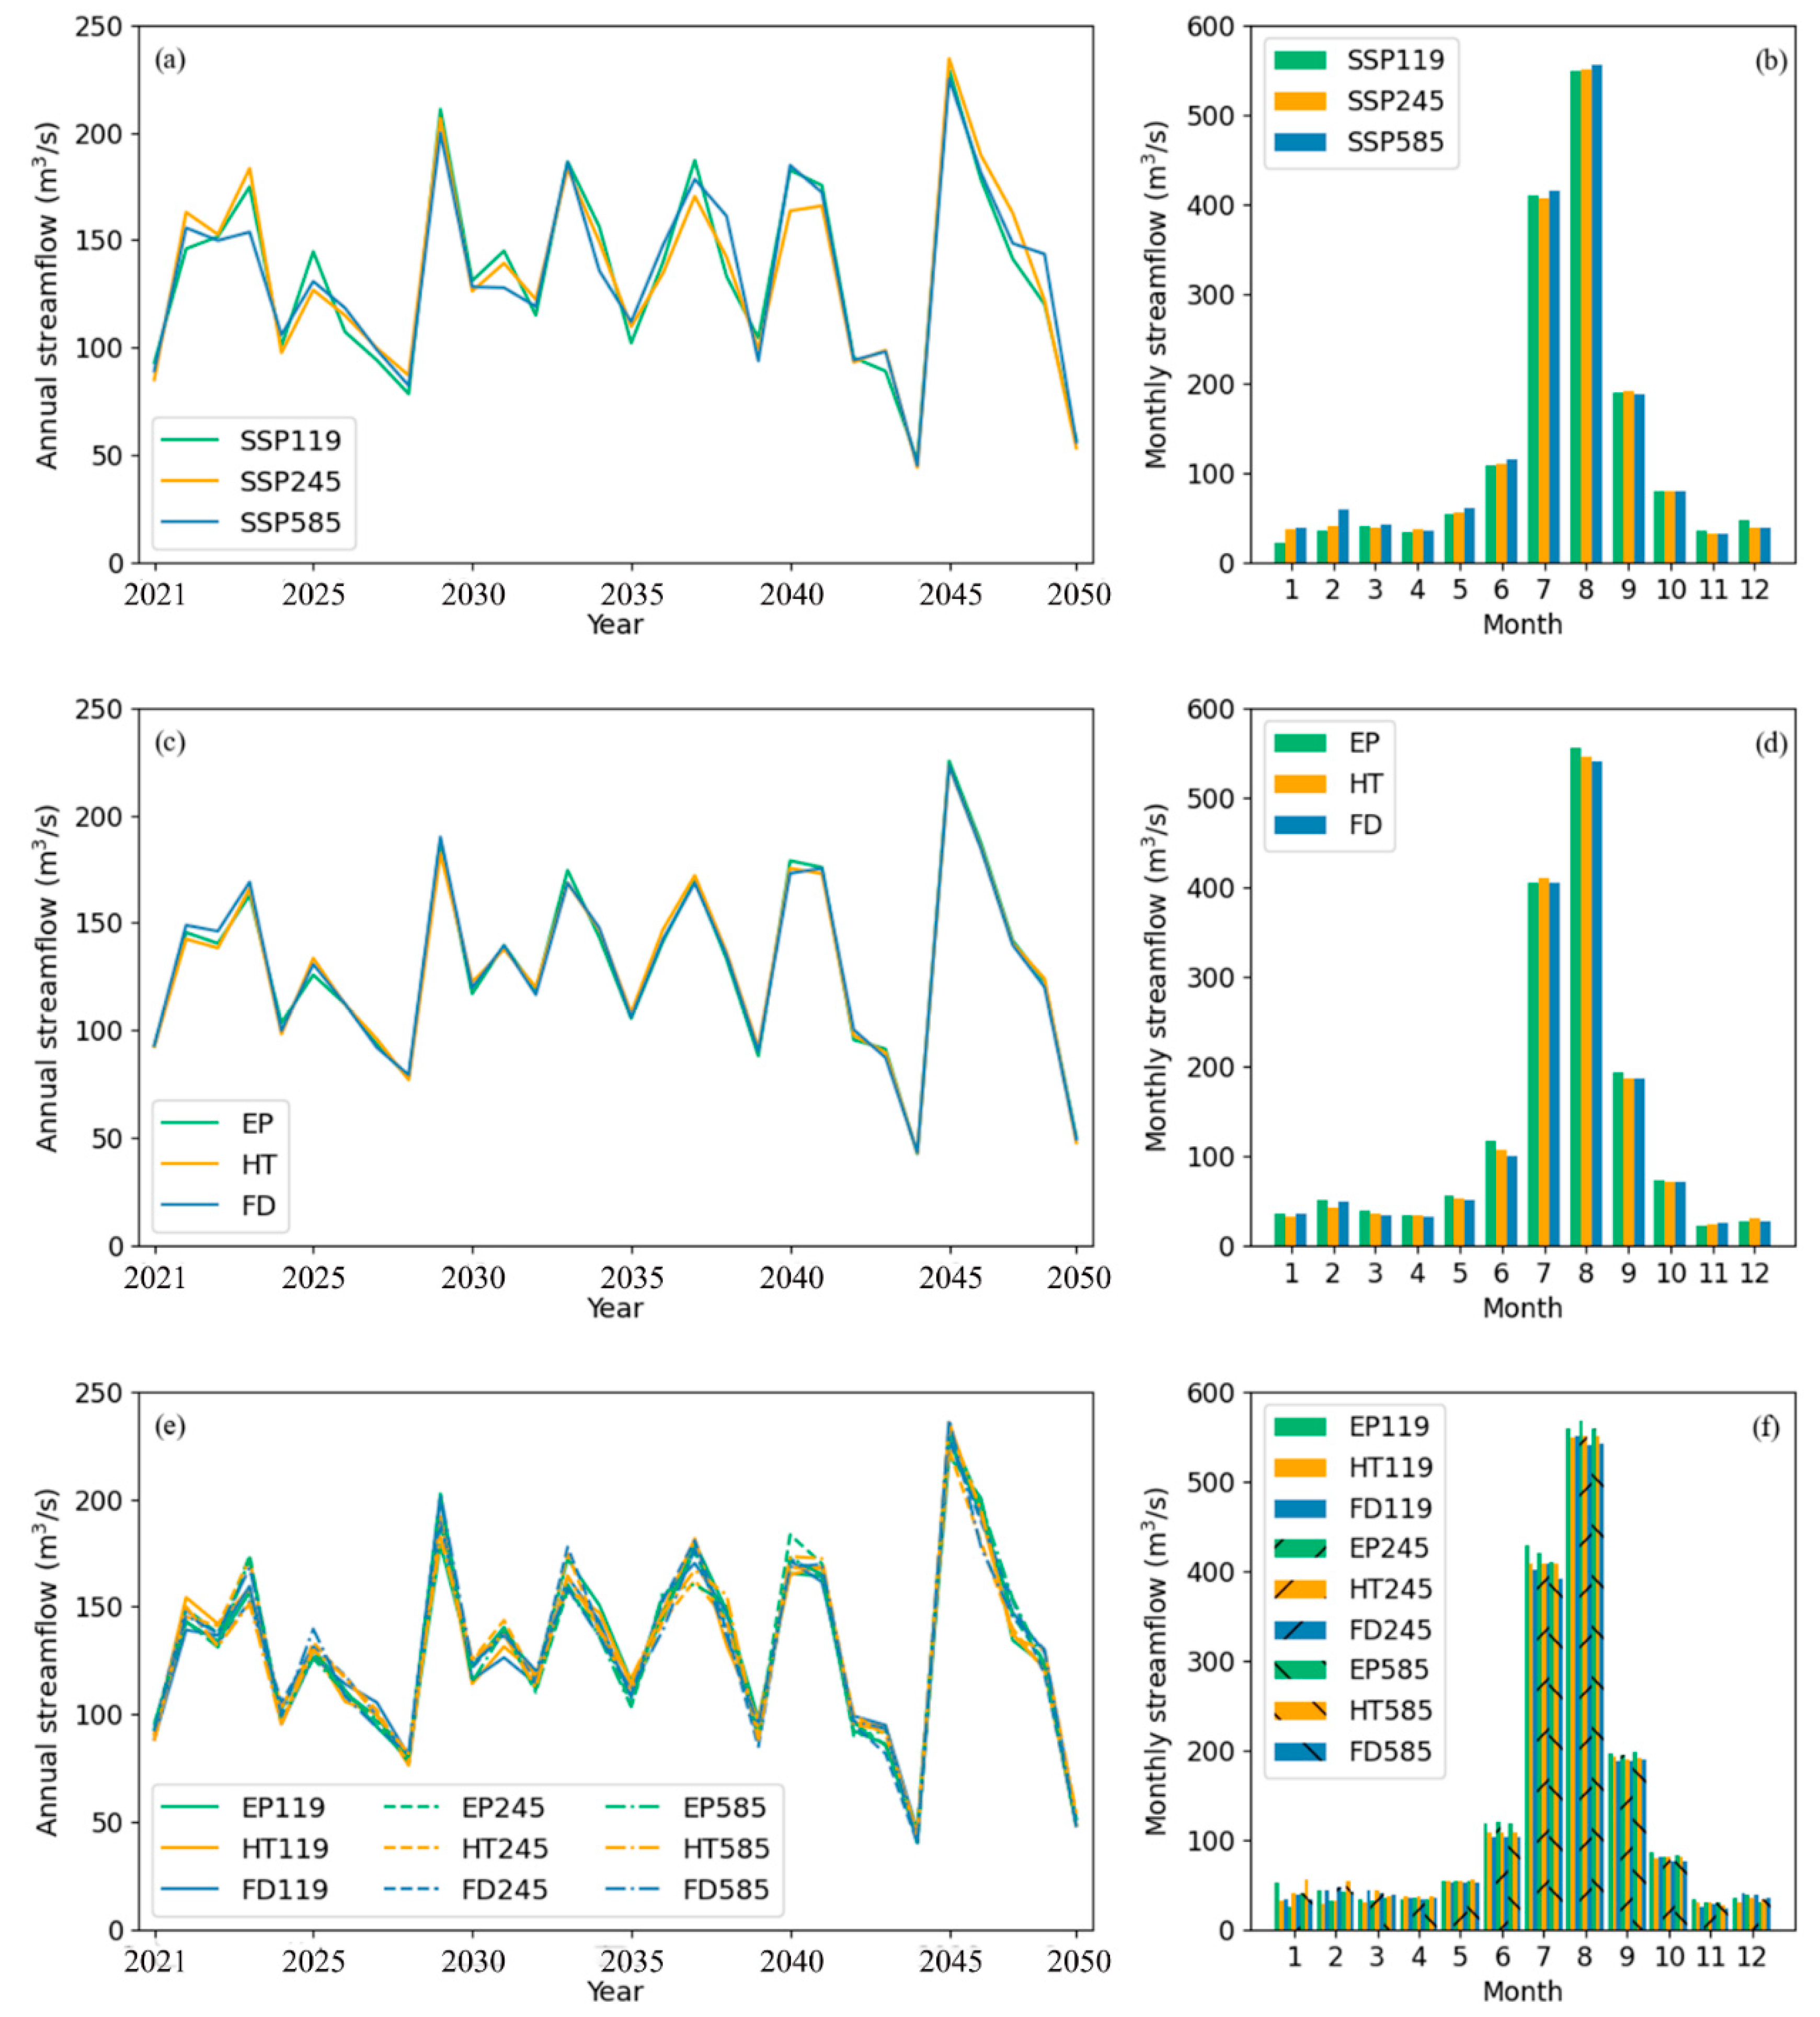
4.4. Streamflow Response Modelling under Multiple Scenarios

4.4.1. Under Varying Climate Change Scenarios

We used the calibrated MIKE SHE model to predict long-term (2021–2050) streamflow only under climate change, LUCC, and their combinations. From 1985–2014, the annual streamflow was 133.51 m3/s. Due to climate influences, the annual streamflow from 2021–2050 ranges from 135.62 to 138.21 m3/s, representing an increase of 1.6% to 3.5% compared to the 1985–2014 period. In all scenarios, there is a trend of increased streamflow. This outcome is attributed to the fact that the streamflow in URTRB is derived from melting snow, and as a result, streamflow increases with rising precipitation and temperatures.
Figure 8b shows that the monthly streamflow in URTRB is unevenly distributed, with a significant difference in streamflow between the summer flood season and the other three seasons. During the flood season from June to September in the period from 1985–2014, the average streamflow was 312.33 m3/s, accounting for 79.52% of the total annual streamflow. From 2021 to 2050, the monthly streamflow variation within the year may decrease. The average monthly streamflow in the eight months outside the flood season has increased by 1.19% to 10.08% compared to the years 1976–2005, resulting in the flood season’s total streamflow accounting for 76.73% to 78.23% of the total streamflow, which represents a decrease of 1.29% to 2.79%.

4.4.2. Under Varying Land Use/Cover Change Scenarios

Figure 8c,d illustrated the annual and monthly streamflow variations under LUCC. Under three LUCC scenarios, as grassland and forests are converted to farmland to varying extents and bare land decreases, there is a decreasing trend in streamflow from 2021 to 2050, with a mean annual streamflow ranging from 129.48 to 130.69 m3/s. The expansion of farmland areas is significantly under the FD scenario. In the period from 2021–2050, the mean annual streamflow shows a decrease of 2.86% compared to the period from 1985–2014. Due to EP’s ecological conservation efforts, the degree of conversion from farmland to forests has been reduced, resulting in a higher mean annual streamflow compared to HT and FD, but it is still lower than the baseline period.
Intra-annual monthly streamflow still exhibits the situation where the monthly streamflow during the summer flood season is significantly higher than in other months, but the gap has decreased. Summer season streamflow accounts for approximately 78.24% of the total stream, which is 3.28% less than the baseline period. This may be due to the fact that the growing season of crops in farmlands primarily occurs during the summer, making their impact on summer streamflow more pronounced.

4.4.3. Under Varying Combined Climate and Land Use/Cover Change Scenarios

Figure 8e,f showed the annual and monthly streamflow variations under combined climate change and LUCC scenarios. Over the period from 2021–2050, the streamflow exhibits a decreasing trend in these combined scenarios, with a mean annual streamflow ranging from 129.67 to 130.32 m3/s. This represents a variation of 2.39–2.87% compared to the period from 1985–2014. The mean annual streamflow is highest under EPs, followed by that under HTs and FDs. Additionally, the alteration characteristics of annual streamflow remain similar under different LUCCs. The annual runoff fluctuation between the comprehensive scenarios is greater than that of the LUCC scenario and smaller than that of the climate change scenario.

5. Discussion

In this study, we analyzed the separate and combined impacts of climate change and LUCC on the alteration of the mean monthly streamflow in the URTRB. We employed multi-GMSs to reduce uncertainties between different SSPs. The RCA of streamflow, attributed to climate change, LUCC, and their combination, was defined as the ratio of the streamflow change under SSPs, LUCC (EP, HT, and FD), and combined conditions (EPs, HTs, and FDs) from 2021–2050 relative to the standard deviation of streamflow from 1985–2014. Refer to Figure 9 for the presented results.
Climate change, a key factor influencing variations in streamflow, results in an augmented streamflow due to the heightened radiation intensity. Its impact on streamflow is mainly manifested in the increase of precipitation and rising temperatures. Under the influence of SSP119, SSP245, and SSP585, the mean RCA is 0.12, 0.11, and 0.18, respectively. During the months of May to September, when runoff is relatively concentrated, the impact of climate change on runoff is smaller, with a mean RCA of only 0.01. However, during the dry season, runoff is more significantly affected by climate change mainly due to the increase in snowmelt following a rise in temperature, which supplements the runoff in the dry season.
In addition, the changes in flow induced by EP, HT, and FD are different, with mean RCAs of 0.28, 0.19, and 0.29, respectively. The RCA under LUCC is larger than that under climate change, which indicates that the impact of LUCC on streamflow is greater than that of climate change. Due to extensive farmland expansion, FD has the greatest land-use change, so its impact on streamflow is greater than EP and HT.
As seen from Figure 9, the streamflow changes in EPs are smaller than those in HTs and FDs. This is because, under ecological protection, the expansion of farmland is significantly restricted and grassland and forests are effectively preserved, resulting in a relatively smaller impact on streamflow compared to the baseline period. Wang, et al. [68] found that the streamflow increases when farmland was converted into forests, which is consistent with the conclusion of this study. The streamflow shows significant changes in both spring and winter. Upon comparing it with Figure 8, it is found that the main reason for this is an increase in spring streamflow and a decrease in winter streamflow.
The impacts of climate change and LUCC on the annual streamflow were then quantified. The results showed that the combined effect of both resulted in a decrease of 3.18–3.84 m3/s in the mean annual streamflow. The change in annual mean streamflow is primarily driven by LUCC (Table 2). Specifically, climate change increases annual streamflow by 0.27–0.60 m3/s, contributing from −18.67% to −7.16%, while LUCC leads to a decrease in annual streamflow by 3.78–4.11 m3/s, with a contribution ranging from 107.16% to 118.67%. In different years and months, the results may vary. The dominant effects of LUCC identified in our study align with findings from prior research in the Yihe River [69], Beiluo River [70], and Luanhe River, China [20]. The opposite was found in Heihe River, China [33,71], where climate change is the dominant factor in runoff variation.

6. Conclusions

This study projected future climate change and LUCC by designing multiple scenarios. Through the establishment of a hydrology response model, it quantified and characterized the individual and combined impacts of climate change and LUCC on the future streamflow variation in the upper reach of the Tarim River Basin. The main conclusions can be summarized as follows:
(1)
Analysis showed that in this study area, compared to the period from 1985 to 2014, the climate from 2021 to 2050 was expected to be warmer and wetter.
(2)
From 2021 to 2050, the FD scenario is expected to experience the most pronounced expansion of agricultural land among all scenarios. Similarly, HT, due to consistent human activity trends, also exhibits a significant conversion of grasslands and forests into farmland. Only EP has curbed the extensive expansion of farmland, thereby protecting the ecological environment.
(3)
Alterations in mean annual streamflow were primarily influenced by LUCC, while the impact of climate change reduced the influence attributed to LUCC on streamflow. Climate change increases runoff (contribution: −18.67% to −7.16%), while LUCC decreases runoff (contribution: 107.16% to 118.67%), and the combined effect reduces runoff.
(4)
In the future, streamflow would shift towards the beginning of the year with increased spring streamflow and decreased winter streamflow, which contributes to the growth of vegetation in the study area.
This study is valuable for predicting climate change and LUCC under various scenarios and understanding the diverse impacts on streamflow in the URTRB. It is beneficial for managers to take proactive measures and devise better responses in the face of environmental changes. The Tarim River is a typical inland river in arid areas. Studying the impact of upstream climate change and LUCC on runoff can serve as a reference for water resource management in other basins with similar conditions.

Author Contributions

Conceptualization, L.X.; Methodology, Q.H., M.Y. and S.L.; Software, Q.H. and S.L.; Validation, L.X.; Formal analysis, X.C.; Investigation, T.Q. and M.Y.; Resources, T.Q., Y.L. and X.C.; Data curation, L.X.; Writing – original draft, Q.H.; Supervision, Y.L.; Funding acquisition, Q.H. and L.X. All authors have read and agreed to the published version of the manuscript.

Funding

This study was supported by the National Key Research and Development Program of China (2023YFC3206800), Xinjiang Production and Construction Corps (No. 2022BC001), National Scientific Foundation of China (No. 51779074), Graduate Research and Innovation Projects of Jiangsu Province (No. SJKY19_0473).

Data Availability Statement

The data presented in this study are available on request from the corresponding author. The data are not publicly available due to data confidentiality.

Conflicts of Interest

The authors declare that they have no known competing financial interests or personal relationships that could have appeared to influence the work reported in this paper.

References

  1. Chen, Y.; Shu, L.; Li, H.; Opoku, P.A.; Li, G.; Xu, Z.; Qi, T. Identification of Preferential Recharge Zones in Karst Systems Based on the Correlation between the Spring Level and Precipitation: A Case Study from Jinan Spring Basin. Water 2021, 13, 48. [Google Scholar] [CrossRef]
  2. Qi, T.; Shu, L.; Li, H.; Wang, X.; Opoku, P.A. Water Distribution from Artificial Recharge via Infiltration Basin under Constant Head Conditions. Water 2021, 13, 1052. [Google Scholar] [CrossRef]
  3. Zuo, D.; Chen, G.; Wang, G.; Xu, Z.; Han, Y.; Peng, D.; Pang, B.; Abbaspour, K.C.; Yang, H. Assessment of changes in water conservation capacity under land degradation neutrality effects in a typical watershed of Yellow River Basin, China. Ecol. Indic. 2023, 148, 110145. [Google Scholar] [CrossRef]
  4. Zhai, R.; Tao, F. Climate Change in China Affects Runoff and Terrestrial Ecosystem Water Retention More Than Changes in Leaf Area Index and Land Use/Cover Over the Period 1982–2015. J. Geophys. Res.-Biogeosci. 2021, 126, e2020JG005902. [Google Scholar] [CrossRef]
  5. Shi, S.; Yu, J.; Wang, F.; Wang, P.; Zhang, Y.; Jin, K. Quantitative contributions of climate change and human activities to vegetation changes over multiple time scales on the Loess Plateau. Sci. Total Environ. 2021, 755 Pt 2, 142419. [Google Scholar] [CrossRef]
  6. Robertson, D.E.; Chiew, F.H.S.; Potter, N. Adapting rainfall bias-corrections to improve hydrological simulations generated from climate model forcings. J. Hydrol. 2023, 619, 129322. [Google Scholar] [CrossRef]
  7. Bhadoriya, U.P.S.; Mishra, A.; Singh, R.; Chatterjee, C. Implications of climate change on water storage and filling time of a multipurpose reservoir in India. J. Hydrol. 2020, 590, 125542. [Google Scholar] [CrossRef]
  8. Gao, J.; Sheshukov, A.Y.; Yen, H.; Douglas-Mankin, K.R.; White, M.J.; Arnold, J.G. Uncertainty of hydrologic processes caused by bias-corrected CMIP5 climate change projections with alternative historical data sources. J. Hydrol. 2019, 568, 551–561. [Google Scholar] [CrossRef]
  9. Wang, B.; Deveson, E.D.; Waters, C.; Spessa, A.; Lawton, D.; Feng, P.; Liu, D.L. Future climate change likely to reduce the Australian plague locust (Chortoicetes terminifera) seasonal outbreaks. Sci. Total Environ. 2019, 668, 947–957. [Google Scholar] [CrossRef]
  10. Lee, S.; Qi, J.; McCarty, G.W.; Yeo, I.-Y.; Zhang, X.; Moglen, G.E.; Du, L. Uncertainty assessment of multi-parameter, multi-GCM, and multi-RCP simulations for streamflow and non-floodplain wetland (NFW) water storage. J. Hydrol. 2021, 600, 126564. [Google Scholar] [CrossRef]
  11. Wang, B.; Gray, J.M.; Waters, C.M.; Anwar, M.R.; Orgill, S.E.; Cowie, A.L.; Feng, P.; Liu, D.L. Modelling and mapping soil organic carbon stocks under future climate change in south-eastern Australia. Geoderma 2022, 405, 115442. [Google Scholar] [CrossRef]
  12. Wen, X.; Liu, Z.; Lei, X.; Lin, R.; Fang, G.; Tan, Q.; Wang, C.; Tian, Y.; Quan, J. Future changes in Yuan River ecohydrology: Individual and cumulative impacts of climates change and cascade hydropower development on runoff and aquatic habitat quality. Sci. Total Environ. 2018, 633, 1403–1417. [Google Scholar] [CrossRef] [PubMed]
  13. Su, B.; Huang, J.; Zeng, X.; Gao, C.; Jiang, T. Impacts of climate change on streamflow in the upper Yangtze River basin. Clim. Chang. 2016, 141, 533–546. [Google Scholar] [CrossRef]
  14. Sangam, S.; Binod, B.; Manish, S.; Shrestha, P.K. Integrated assessment of the climate and landuse change impact on hydrology and water quality in the Songkhram River Basin, Thailand. Sci. Total Environ. 2018, 643, 1610–1622. [Google Scholar]
  15. Xu, Z.P.; Li, Y.P.; Huang, G.H.; Wang, S.G.; Liu, Y.R. A multi-scenario ensemble streamflow forecast method for Amu Darya River Basin under considering climate and land-use changes. J. Hydrol. 2021, 598, 126276. [Google Scholar] [CrossRef]
  16. Yeh, S.-W.; Wang, G.; Cai, W.; Park, R.J. Diversity of ENSO-Related Surface Temperature Response in Future Projection in CMIP6 Climate Models: Climate Change Scenario Versus ENSO Intensity. Geophys. Res. Lett. 2022, 49, e2021GL096135. [Google Scholar] [CrossRef]
  17. Sreeparvathy, V.; Srinivas, V.V. Meteorological flash droughts risk projections based on CMIP6 climate change scenarios. Npj Clim. Atmos. Sci. 2022, 5, 77. [Google Scholar] [CrossRef]
  18. Su, B.; Huang, J.; Mondal, S.K.; Zhai, J.; Wang, Y.; Wen, S.; Gao, M.; Lv, Y.; Jiang, S.; Jiang, T.; et al. Insight from CMIP6 SSP-RCP scenarios for future drought characteristics in China. Atmos. Res. 2021, 250, 105375. [Google Scholar] [CrossRef]
  19. Zhang, H.; Meng, C.; Wang, Y.; Wang, Y.; Li, M. Comprehensive evaluation of the effects of climate change and land use and land cover change variables on runoff and sediment discharge. Sci. Total Environ. 2020, 702, 134401. [Google Scholar] [CrossRef]
  20. Wu, L.; Zhang, X.; Hao, F.; Wu, Y.; Li, C.; Xu, Y. Evaluating the contributions of climate change and human activities to runoff in typical semi-arid area, China. J. Hydrol. 2020, 590, 125555. [Google Scholar] [CrossRef]
  21. Zhang, Y.; Xia, J.; Yu, J.; Randall, M.; Zhang, Y.; Zhao, T.; Pan, X.; Zhai, X.; Shao, Q. Simulation and assessment of urbanization impacts on runoff metrics: Insights from landuse changes. J. Hydrol. 2018, 560, 247–258. [Google Scholar] [CrossRef]
  22. Xu, Z.G.; Xu, J.T.; Deng, X.Z.; Huang, J.K.; Uchida, E.; Rozelle, S. Grain for green versus grain: Conflict between food security and conservation set-aside in China. World Dev. 2006, 34, 130–148. [Google Scholar] [CrossRef]
  23. Wang, X.; He, K.; Dong, Z. Effects of climate change and human activities on runoff in the Beichuan River Basin in the northeastern Tibetan Plateau, China. Catena 2019, 176, 81–93. [Google Scholar] [CrossRef]
  24. Yang, W.; Long, D.; Bai, P. Impacts of future land cover and climate changes on runoff in the mostly afforested river basin in North China. J. Hydrol. 2019, 570, 201–219. [Google Scholar] [CrossRef]
  25. Ji, L.; Duan, K. What is the main driving force of hydrological cycle variations in the semiarid and semi-humid Weihe River Basin, China? Sci. Total Environ. 2019, 684, 254–264. [Google Scholar] [CrossRef] [PubMed]
  26. Yin, Z.; Feng, Q.; Zhu, R.; Wang, L.; Chen, Z.; Fang, C.; Lu, R. Analysis and prediction of the impact of land use/cover change on ecosystem services value in Gansu province, China. Ecol. Indic. 2023, 154, 110868. [Google Scholar] [CrossRef]
  27. Wang, Q.; Xu, Y.; Wang, Y.; Zhang, Y.; Xiang, J.; Xu, Y.; Wang, J. Individual and combined impacts of future land-use and climate conditions on extreme hydrological events in a representative basin of the Yangtze River Delta, China. Atmos. Res. 2020, 236, 104805. [Google Scholar] [CrossRef]
  28. Wang, Z.; Shu, L.; Xu, P.; Yin, X.; Lu, C.; Liu, B.; Li, Y. Influence of land use changes on the remaining available aquifer storage (RAAS): A case study of the Taoerhe alluvial-proluvial fan. Sci. Total Environ. 2022, 849, 104805. [Google Scholar] [CrossRef]
  29. Aguejdad, R. The Influence of the Calibration Interval on Simulating Non-Stationary Urban Growth Dynamic Using CA-Markov Model. Remote Sens. 2021, 13, 468. [Google Scholar] [CrossRef]
  30. Cao, C.; Sun, R.; Wu, Z.; Chen, B.; Yang, C.; Li, Q.; Fraedrich, K. Streamflow Response to Climate and Land-Use Changes in a Tropical Island Basin. Sustainability 2023, 15, 3941. [Google Scholar] [CrossRef]
  31. Wang, Q.; Cheng, L.; Zhang, L.; Liu, P.; Qin, S.; Liu, L.; Jing, Z. Quantifying the impacts of land-cover changes on global evapotranspiration based on the continuous remote sensing observations during 1982–2016. J. Hydrol. 2021, 598, 126231. [Google Scholar] [CrossRef]
  32. Farsi, N.; Mahjouri, N. Evaluating the Contribution of the Climate Change and Human Activities to Runoff Change under Uncertainty. J. Hydrol. 2019, 574, 872–891. [Google Scholar] [CrossRef]
  33. Yang, L.; Feng, Q.; Yin, Z.; Wen, X.; Si, J.; Li, C.; Deo, R.C. Identifying separate impacts of climate and land use/cover change on hydrological processes in upper stream of Heihe River, Northwest China. Hydrol. Process. 2017, 31, 1100–1112. [Google Scholar] [CrossRef]
  34. Liao, S.; Xue, L.; Dong, Z.; Zhu, B.; Zhang, K.; Wei, Q.; Fu, F.; Wei, G. Cumulative ecohydrological response to hydrological processes in arid basins. Ecol. Indic. 2020, 111, 106005. [Google Scholar] [CrossRef]
  35. Han, Q.; Xue, L.; Liu, Y.; Yang, M.; Chu, X.; Liu, S. Developing a multi-objective simulation-optimization model for ecological water conveyance in arid inland river basins. J. Hydrol. Reg. Stud. 2023, 50, 101551. [Google Scholar] [CrossRef]
  36. Abbott, M.B.; Bathurst, J.C.; Cunge, J.A.; O’connell, P.E.; Rasmussen, J. An introduction to the European Hydrological System—Systeme Hydrologique Europeen, “SHE”, 2: Structure of a physically-based, distributed modelling system. J. Hydrol. 1986, 87, 61–77. [Google Scholar] [CrossRef]
  37. Butts, M.B.; Payne, J.T.; Kristensen, M.; Madsen, H. An evaluation of the impact of model structure on hydrological modelling uncertainty for streamflow simulation. J. Hydrol. 2004, 298, 242–266. [Google Scholar] [CrossRef]
  38. Sengul, S.; Ispirli, M.N. Estimation and analysis of the Antecedent Temperature Index-Melt Rate (ATIMR) function using observed data from the Kirkgoze-Cipak Basin, Turkey. J. Hydrol. 2021, 598, 126484. [Google Scholar] [CrossRef]
  39. Gan, G.; Wu, J.; Hori, M.; Fan, X.; Liu, Y. Attribution of decadal runoff changes by considering remotely sensed snow/ice melt and actual evapotranspiration in two contrasting watersheds in the Tienshan Mountains. J. Hydrol. 2022, 610, 127810. [Google Scholar] [CrossRef]
  40. Thompson, J.R.; Sørenson, H.R.; Gavin, H.; Refsgaard, A. Application of the coupled MIKE SHE/MIKE 11 modelling system to a lowland wet grassland in southeast England. J. Hydrol. 2004, 293, 151–179. [Google Scholar] [CrossRef]
  41. Sahoo, G.B.; Ray, C.; Carlo, E.H.D. Calibration and validation of a physically distributed hydrological model, MIKE SHE, to predict streamflow at high frequency in a flashy mountainous Hawaii stream. J. Hydrol. 2006, 327, 94–109. [Google Scholar] [CrossRef]
  42. Yu, X.; Xiao, J.; Huang, K.; Li, Y.; Lin, Y.; Qi, G.; Liu, T.; Ren, P. Simulation of Land Use Based on Multiple Models in the Western Sichuan Plateau. Remote Sens. 2023, 15, 3629. [Google Scholar] [CrossRef]
  43. Lin, Z.; Peng, S. Comparison of multimodel simulations of land use and land cover change considering integrated constraints—A case study of the Fuxian Lake basin. Ecol. Indic. 2022, 142, 127810. [Google Scholar] [CrossRef]
  44. Iacono, M.; Levinson, D.; El-Geneidy, A.; Wasfi, R. Markov Chain Model of Land Use Change in the Twin Cities. TeMA J. Land Use Mobil. Environ. 2012, 8. [Google Scholar] [CrossRef]
  45. Zhang, Z.; Hoermann, G.; Huang, J.; Fohrer, N. A Random Forest-Based CA-Markov Model to Examine the Dynamics of Land Use/Cover Change Aided with Remote Sensing and GIS. Remote Sens. 2023, 15, 2128. [Google Scholar] [CrossRef]
  46. Liu, J.; Zhou, Y.; Wang, L.; Zuo, Q.; Li, Q.; He, N. Spatiotemporal Analysis and Multi-Scenario Prediction of Ecosystem Services Based on Land Use/Cover Change in a Mountain-Watershed Region, China. Remote Sens. 2023, 15, 2759. [Google Scholar] [CrossRef]
  47. Sanchayeeta, A.; Jane, S. Simulating Forest Cover Changes of Bannerghatta National Park Based on a CA-Markov Model: A Remote Sensing Approach. Remote Sens. 2012, 4, 3215–3243. [Google Scholar]
  48. Jalil, A.; Akhtar, F.; Awan, U.K. Evaluation of the AquaCrop model for winter wheat under different irrigation optimization strategies at the downstream Kabul River Basin of Afghanistan. Agric. Water Manag. 2020, 240, 106321. [Google Scholar] [CrossRef]
  49. McMichael, C.E.; Hope, A.S.; Loaiciga, H.A. Distributed hydrological modelling in California semi-arid shrublands: MIKE SHE model calibration and uncertainty estimation. J. Hydrol. 2006, 317, 307–324. [Google Scholar] [CrossRef]
  50. Qi, T.; Khanaum, M.M.; Boutin, K.; Otte, M.L.; Lin, Z.; Chu, X. Incorporating Wetland Delineation and Impacts in Watershed-Scale Hydrologic Modeling. Water 2023, 15, 2518. [Google Scholar] [CrossRef]
  51. Khanaum, M.M.; Qi, T.; Boutin, K.D.; Otte, M.L.; Lin, Z.; Chu, X. Assessing the Impacts of Wetlands on Discharge and Nutrient Loading: Insights from Restoring Past Wetlands with GIS-Based Analysis and Modeling. Wetlands 2023, 43, 103. [Google Scholar] [CrossRef]
  52. Moriasi, D.N.; Gitau, M.W.; Pai, N.; Daggupati, P. HYDROLOGIC AND WATER QUALITY MODELS: PERFORMANCE MEASURES AND EVALUATION CRITERIA. Trans. Asabe 2015, 58, 1763–1785. [Google Scholar]
  53. Van Liew, M.W.; Garbrecht, J. Hydrologic simulation of the Little Washita River Experimental Watershed using SWAT. J. Am. Water Resour. Assoc. 2003, 39, 413–426. [Google Scholar] [CrossRef]
  54. Cohen, J. A coefficient of agreement of nominal scales. Psychol. Bull. 1960, 20, 37–46. [Google Scholar] [CrossRef]
  55. Beroho, M.; Briak, H.; Cherif, E.K.; Boulahfa, I.; Ouallali, A.; Mrabet, R.; Kebede, F.; Bernardino, A.; Aboumaria, K. Future Scenarios of Land Use/Land Cover (LULC) Based on a CA-Markov Simulation Model: Case of a Mediterranean Watershed in Morocco. Remote Sens. 2023, 15, 1162. [Google Scholar] [CrossRef]
  56. Xue, L.; Bao, R.; Meixner, T.; Yang, G.; Zhang, J. Influences of topographic index distribution on hydrologically sensitive areas in agricultural watershed. Stoch. Environ. Res. Risk Assess. 2014, 28, 2235–2242. [Google Scholar] [CrossRef]
  57. Xue, L.; Zhang, H.; Yang, C.; Zhang, L.; Sun, C. Quantitative Assessment of Hydrological Alteration Caused by Irrigation Projects in the Tarim River basin, China. Sci. Rep. 2017, 7, 4291. [Google Scholar] [CrossRef] [PubMed]
  58. Chen, Y.; Li, W.; Deng, H.; Fang, G.; Li, Z. Changes in Central Asia’s Water Tower: Past, Present and Future. Sci. Rep. 2018, 6, 35458. [Google Scholar] [CrossRef]
  59. Xue, L.; Yang, F.; Yang, C.; Chen, X.; Zhang, L.; Chi, Y.; Yang, G. Identification of potential impacts of climate change and anthropogenic activities on streamflow alterations in the Tarim River Basin, China. Sci. Rep. 2017, 7, 8254. [Google Scholar] [CrossRef]
  60. Zhang, F.; Tiyip, T.; Feng, Z.D.; Kung, H.T.; Johnson, V.C.; Ding, J.L.; Tashpolat, N.; Sawut, M.; Gui, D.W. Spatio-temporal patterns of land use/cover changes over the past 20 years in the middle reaches of the tarim river, Xinjiang, China. Land Degrad. Dev. 2015, 26, 284–299. [Google Scholar] [CrossRef]
  61. Hou, Y.; Chen, Y.; Li, Z.; Li, Y.; Sun, F.; Zhang, S.; Wang, C.; Feng, M. Land Use Dynamic Changes in an Arid Inland River Basin Based on Multi-Scenario Simulation. Remote Sens. 2022, 14, 2797. [Google Scholar] [CrossRef]
  62. Peng, S.; Ding, Y.; Wen, Z.; Chen, Y.; Cao, Y.; Ren, J. Spatiotemporal change and trend analysis of potential evapotranspiration over the Loess Plateau of China during 2011–2100. Agric. For. Meteorol. 2017, 233, 183–194. [Google Scholar] [CrossRef]
  63. Peng, S. 1 km Multi-Scenario and Multi-Model Monthly Precipitation Data for China in 2021–2100. A Big Earth Data Platform for Three Poles. 2022. Available online: http://loess.geodata.cn/data/datadetails.html?dataguid=223722163526125&docid=1 (accessed on 1 December 2023).
  64. Ding, Y.; Peng, S. Spatiotemporal change and attribution of potential evapotranspiration over China from 1901 to 2100. Theor. Appl. Climatol. 2021, 145, 79–94. [Google Scholar] [CrossRef]
  65. Peng, D.; Lyu, J.; Song, Z.; Huang, S.; Zhang, P.; Gao, J.; Zhang, Y. Mercury budgets in the suspended particulate matters of the Yangtze River. Water Res. 2023, 243, 120390. [Google Scholar] [CrossRef] [PubMed]
  66. Li, X.; Zhang, K.; Li, X.; Verger, A. The Minimum Temperature Outweighed the Maximum Temperature in Determining Plant Growth over the Tibetan Plateau from 1982 to 2017. Remote Sens. 2023, 15, 4032. [Google Scholar] [CrossRef]
  67. He, Z.-W.; Tang, B.H. Spatiotemporal change patterns and driving factors of land surface temperature in the Yunnan-Kweichow Plateau from 2000 to 2020. Sci. Total Environ. 2023, 896, 165288. [Google Scholar] [CrossRef]
  68. Wang, H.; Sun, F.; Xia, J.; Liu, W. Impact of LUCC on streamflow based on the SWAT model over the Wei River basin on the Loess Plateau in China. Hydrol. Earth Syst. Sci. 2017, 21, 1929–1945. [Google Scholar] [CrossRef]
  69. Li, B.; Shi, X.; Lian, L.; Chen, Y.; Chen, Z.; Sun, X. Quantifying the effects of climate variability, direct and indirect land use change, and human activities on runoff. J. Hydrol. 2020, 584, 124684. [Google Scholar] [CrossRef]
  70. Yang, T.; Yang, X.; Jia, C. Detecting the main driving force of runoff change in the Beiluo River Basin, China. Environ. Sci. Pollut. Res. 2023, 30, 89823–89837. [Google Scholar] [CrossRef]
  71. Zhang, L.; Nan, Z.; Yu, W.; Zhao, Y.; Xu, Y. Comparison of baseline period choices for separating climate and land use/land cover change impacts on watershed hydrology using distributed hydrological models. Sci. Total Environ. 2018, 622, 1016–1028. [Google Scholar] [CrossRef]
Figure 1. Schematic of methodology.
Water 16 00100 g001
Figure 2. Location of the upper reaches of the Tarim River Basin (URTRB) and hydrological station river network.
Water 16 00100 g002
Figure 3. Mean monthly (a) precipitation and (b) temperature averaged over URTRB under different SSPs from 2021–2050. The error bars indicate the multi-model ensemble range.
Water 16 00100 g003
Figure 4. Annual average precipitation and temperature changes from 2021–2050.
Water 16 00100 g004
Figure 5. Actual land-use maps of 2010 (a) and simulated land-use maps of 2010 (b).
Water 16 00100 g005
Figure 6. Projected land use maps in 2030 under (a) EP, (c) HT, and (e) FD scenarios, and proportions of area of each land use/cover type under (b) EP, (d) HT, and (f) FD scenarios.
Water 16 00100 g006
Figure 7. Comparison of observed and simulated streamflow.
Water 16 00100 g007
Figure 8. Mean annual and monthly streamflow in URTRB from 2021–2050 under (a,b) Climate change, (c,d) LUCC, and (e,f) Combined climate change and LUCC.
Water 16 00100 g008
Figure 9. Monthly attribution of streamflow attributed to climate change, LUCC, and combined LUCC and climate change effects in URTRB.
Water 16 00100 g009
Table 1. Calibration results of model parameters.
ComponentsParametersUnitsCalibrated Values
Snow meltMelting temperature°C0
Degree–day coefficientmm°C/day0
Overland flowManning numberm1/3/s25
Detention storagemm4
RiverManning numberm1/3/s11
Leakage coefficientm/s1.47 × 10−7
Saturated zoneHorizontal hydraulic conductivitym/s1.25 × 10−3
Vertical hydraulic conductivitym/s1.25 × 10−4
Storage coefficientm−12.22 × 10⁻⁵
Specific yield-0.11
Table 2. Annual contributions of climate change and LUCC in URTRB.
ScenariosEP119EP245EP585HT119HT245HT585FD119FD245FD585
Climate change (%)7.1613.6716.1211.0914.4818.0811.4314.9418.66
LUCC (%)−107.16−113.67−116.12−111.09−114.48−118.08−11.43−114.94−118.66
Total (%)−100−100−100−100−100−100−100−100−100
Disclaimer/Publisher’s Note: The statements, opinions and data contained in all publications are solely those of the individual author(s) and contributor(s) and not of MDPI and/or the editor(s). MDPI and/or the editor(s) disclaim responsibility for any injury to people or property resulting from any ideas, methods, instructions or products referred to in the content.

