Article

Decoding Chambal River Shoreline Transformations: A Comprehensive Analysis Using Remote Sensing, GIS, and DSAS

1
Centre for Climate Change and Water Research, Suresh Gyan Vihar University, Jaipur 302017, Rajasthan, India
2
Graduate School of Agricultural and Life Sciences, The University of Tokyo, 1-1-1 Yayoi, Tokyo 113-8654, Japan
3
Institute for Global Environmental Strategies, Hayama 240-0115, Kanagawa, Japan
4
Department of Geography, School of Environment and Earth Sciences, Central University, Bathinda 151401, Punjab, India
5
Department of Geography, Gauhati University, Jalukbari 781014, Assam, India
*
Author to whom correspondence should be addressed.
Water 2023, 15(9), 1793; https://doi.org/10.3390/w15091793
Submission received: 30 March 2023 / Revised: 2 May 2023 / Accepted: 5 May 2023 / Published: 7 May 2023
(This article belongs to the Special Issue Advances in Hydrology: Flow and Velocity Analysis in Rivers)

Abstract

:
Illegal sand mining has been identified as a significant cause of harm to riverbanks, as it leads to excessive removal of sand from rivers and negatively impacts river shorelines. This investigation aimed to identify instances of shoreline erosion and accretion at illegal sand mining sites along the Chambal River. These sites were selected based on a report submitted by the Director of the National Chambal Sanctuary (NCS) to the National Green Tribunal (NGT) of India. The digital shoreline analysis system (DSAS v5.1) was used during the elapsed period from 1990 to 2020. Three statistical parameters used in DSAS—the shoreline change envelope (SCE), endpoint rate (EPR), and net shoreline movement (NSM)—quantify the rates of shoreline changes in the form of erosion and accretion patterns. To carry out this study, Landsat imagery data (T.M., ETM+, and OLI) and Sentinel-2A/MSI from 1990 to 2020 were used to analyze river shoreline erosion and accretion. The normalized difference water index (NDWI) and modified normalized difference water index (MNDWI) were used to detect riverbanks in satellite images. The investigation results indicated that erosion was observed at all illegal mining sites, with the highest erosion rate of 1.26 m/year at the Sewarpali site. On the other hand, the highest accretion was identified at the Chandilpura site, with a rate of 0.63 m/year. We observed significant changes in river shorelines at illegal mining and unmined sites. Erosion and accretion at unmined sites are recorded at −0.18 m/year and 0.19 m/year, respectively, which are minor compared to mining sites. This study’s findings on the effects of illegal sand mining on river shorelines will be helpful in the sustainable management and conservation of river ecosystems. These results can also help to develop and implement river sand mining policies that protect river ecosystems from the long-term effects of illegal sand mining.

1. Introduction

Mineral aggregates are the most mined material globally, with extraction sites near every city and town. According to UNEP (2014), it is estimated that between 32 and 50 billion metric tons of aggregate (sand and gravel) are extracted each year globally [1]. Over the past century, researchers specializing in river engineering have paid significant attention to the geomorphological phenomena of riverbank erosion, accretion, and riverbed degradation [2]. The activity of sand mining has the potential to impact river ecosystems both directly and indirectly. Direct impacts refer to the ecological consequences resulting from sand extraction activities. The phenomenon of indirect effects pertains to alterations in the ecosystem resulting from physical modifications in the river system due to the extraction of sand [3]. The term “riverbed degradation” pertains to the alterations in the riverbed, which adversely impact the river’s ecological balance. The principal process of riverbed degradation, commonly referred to as channel incision, involves the phenomenon of head cutting. The process of head cutting involves excavating a mining pit within the active channel, resulting in the creation of a nick point. This alteration to the streambed causes an increase in the local slope of the channel, subsequently enhancing the energy flow. The process of sand mining has a notable impact on the movement of sediment loads, resulting in alterations to both flow and sediment regimes.
Extracting sand from the riverbed results in modifying the thalweg line of the river channel in the direction of the mining location. This alteration causes the riverbank’s toe to be unstable as the line approaches the riverside. The act of mining results in significant alterations to the turbulence configuration of the flow along the riverbank, as indicated by Ref. [4]. Excavating pits results in a gradual erosion of the berm located at the bank toe, which increases the Reynolds shear stress (RSS) fields in the near-bank flow [5]. The erosive nature of the primary channel flow along the riverbank leads to the degradation of the channel, increasing the elevation of the exposed bank slope. The process of pit dredging generates more forceful ejection bursts, which in turn accelerates the erosion and transportation of sediment in the berm [5].
Bhattacharya et al. (2019) note that if mining is carried out extensively over a sizable flow length, flow depth will gradually diminish, causing the lower height of the bank to experience a higher velocity flow. This leads to the riverbank’s berm failing and toe erosion accelerating [4]. During high water flow, a nick point changes into a place where the riverbed starts to erode and moves steadily upstream, as shown in Figure 1. Bar skimming, the process of removing sand from the surface of a river, increases the width of the flow, which affects the riparian zone in the form of bank erosion, as shown in Figure 2 [6].
Bar skimming and pit excavation are the common methods for sand extraction [7] .Excavation of pits is more hazardous than bar skimming for sand mining from active channels. The streambed is lowered when mining pits are excavated in the active medium, producing nick points that can raise the slope of the channel locally. Channel flow energy increases at this region, and nick issues become a site of bed erosion at high monsoon flow rates, gradually spreading upstream through head cutting [8,9,10]. This process can mobilize a considerable amount of streambed sediments that are moved downstream and deposited in the excavated region. Head cuts sometimes spread into tributary channels and travel far upstream [11,12].
Nearby pits combined during the monsoon season can cause the streambed to descend more quickly, destabilizing riparian flora and riverbanks. Coarser sediments, such as gravel and sand, are left in these pits by sediment-filled water flowing downstream, meaning that it only transports a small amount of sediment. The hungry water leaving the pit may aggressively erode downstream sections, ultimately degrading the entire river channel system [7,13].
Upstream of the sand mining site, the riverbed tends to trap large amounts of silt due to higher shear stress close to pit or pool locations [14,15]. This segment experiences avulsion, a multi-channel riverbed, and channel aggradations (i.e., creation of bars and islands), leading to a loss of kinetic energy with decreasing shear stress. Channel cutting and thalweg shifting in midstream cause bank erosion and channel width expansion. The downstream portion shows a narrow, sinuous channel (single thalweg) with pool-riffle alteration for turbulence or sand deficit water flow [4].
The riverbanks demarcate the ecological transition zone between the river and the land. Riverbank erosion is a primary public concern that represents the magnitude of rainfall, soil properties, river morphology, and topography, which are heavily influenced by floods during the monsoon season [16]. Floods sometimes trigger sudden and dramatic shifts in river flow patterns. The assessment of river migration patterns due to accretion–erosion and its mitigation is most important due to the great significance of rivers for living beings. Although erosion and accretion occur naturally, human activities may significantly alter the rate at which they appear—the river’s morphology changes due to natural and human causes [17]. Riverbank erosion is the process by which sediment is stripped away from riverbanks in fast-moving water. Those parts of the bank that have been eroded tend to slide laterally into the channel or downriver. The deposition of suspended sediment near or on riverbanks when the flow velocity is low is known as accretion [18,19]. Tracking the river’s changing bank line has become increasingly important over the past few years. The upstream water rush causes erosion as well as the threatening collapse of bridges on the river, especially in the monsoon season. Several studies [17,20,21,22,23,24] have been carried out to study the morphological changes of different rivers, mainly the bank shifting and channel migration due to the erosion–accretion process.
In earlier studies [18,24,25], direct field measurements have been used to identify bank erosion rates. Afterward, topographical maps and aerial photographs were used for erosion–accretion studies [26,27]. Remote sensing and GIS have enabled detailed analyses of the bank accretion–erosion phenomenon [28,29,30,31,32]. Remote sensing with GIS integration is an efficient and economical technique to assess river channel migration. Spatio-temporal variations of accretion and erosion characteristics of the Chenab River (1999–2007; 2007–2011) were analyzed using digital image processing techniques and GIS tools. The right bank of this river was found majorly under erosion with a maximum (1,569,843 m2 and 1,486,160 m2) at the middle reaches during both periods. SRTM data validated these outputs from Landsat images to assess image classification accuracy [33]. Multi-temporal satellite images (Landsat M.S.S and T.M.) are widely used to analyze riverbank erosion–accretion. Short-term and long-term bank line shifting, migration patterns, and accretion–erosion were analyzed for the Dudhkumar River from 1973 to 2015. The accretion rate was very high compared to the erosion rate on both banks. Due to this, the island area started increasing after 1973, which reached the maximum in 2001, representing that the Dudhkumar River is highly meandering [16]. River management and development planning depend on constant observation of bank erosion. Riverbank hotspots were [17] studied on the Mekong River using various satellite images from Landsat 5,7,8 (1990–2020) and Sentinel-2 (2016–2021). Using the normalized difference water index (NDWI) and the modified normalized difference water index (MNDWI), they created a map showing the erosion rate.
Because riverbank erosion detection using satellite images is difficult at highly sensitive water level locations, it will lead to false riverbank line detection. The digital shoreline analysis system (DSAS v5.1) with other ArcMap tools was used to identify erosion rates and short- and long-term changes along the perpendicular of the river. The impact of climate change variability on bank erosion and floodplain deposition was studied in an 11 km segment of East River, Colorado, over 60 years by using hydrographs. There was a strong correlation between annual recession slope and erosion along the entire study segment of the river, representing that the faster snowmelt-dominated hydrographs decline, the more bank erosion occurs [20]. The Bosna River was studied to identify the changes in shape and position from 1958 to 2013. An 8.3430 km2 area of this riverbank was eroded, while a 10.7074 km2 area was subjected to accretion [2]. In India, the rivers that originated from the Himalayas have vigorously shifted in position and caused massive bank erosion. The bank erosion rate and accretion along a 35.30 km stretch of the Ram-Ganga River were studied over the past 91 years. Channel migration directions fluctuated at regular intervals across all periods. The morphological changes in the river due to bank erosion negatively affect many human lives by causing the loss of agricultural lands and other resources and causing them to become homeless [34]. It can cause extreme poverty in the region [2].
Therefore, effective mitigation techniques are needed to protect the river and riverine lands from erosion [35]. The unsustainable local sand mining practices lead to a loss of extracted bed aggregates that cannot be compensated for by natural sediment supplies from the upper reaches of rivers [36]. Therefore, developing an effective erosion management plan for such rivers is necessary.
The National Chambal Sanctuary, also known as the Chambal River Sanctuary, is a protected area in India in Rajasthan. It has a rich biodiversity, conservation efforts, tourism opportunities, and scientific research. But in the last few decades, India’s National Green Tribunal (NGT) has reported extensive sand mining on the Chambal River. The Chambal River is one of the most heavily mined rivers in India. Therefore, it is necessary to study the river shoreline changes at illegal sand mining sites on the Chambal River, which will play an essential role in conserving the Chambal River ecosystem and protecting endangered species. This research aims to evaluate Chambal Riverbank erosion and accretion at three illegal sand mining sites and compare the rate of erosion and accretion between the mining site and the unmined site. The DSAS tool is used for naturally occurring coastal or riverbank erosion and accretion. This study shows that DSAS can also be used to analyze the impact of illegal sand mining or man-made effects on riverbank lines.
The data presented here serve as a basis for understanding bank erosion and accretion resulting from excessive sand mining. The primary goal of this study is to provide valuable information to support better planning and management decisions for the protection and preservation of the unique ecosystem and biodiversity of the National Chambal Sanctuary.

2. Materials and Methods

In this section, we first discuss the characteristics of the study area, including its location and geology, to provide context for the data analysis. Subsequently, it provides detailed information about the specifications and sources of the data used in this study, including satellite imagery and topographic maps. To evaluate riverbank line erosion, we utilized the digital shoreline analysis system (DSAS v5.1) model, developed by the United States Geological Survey (USGS) and widely used for shoreline analysis. Additionally, we employed the normalized difference water index (NDWI) and modified normalized difference water index (MNDWI) to assess the water content and shoreline location of the study area. These methods were used to calculate shoreline change rates and identify areas of erosion and accretion, which will be presented and discussed in the results section.

2.1. Study Area

The Chambal River is a significant tributary of the Yamuna River, located in central and northern India. It has a length of about 1050 km and a drainage area of approximately 132,000 square kilometers. The river flows through a region with diverse geology consisting of igneous, metamorphic, and sedimentary rocks. The river basin is characterized by low to moderate relief, with hills and plateaus of sandstones, shale, and conglomerates. The river and its tributaries have carved deep gorges and valleys through the rocky terrain, creating a unique landscape supporting rich biodiversity. The National Chambal Sanctuary, established in 1979, is a protected area along the Chambal River in India, spanning approximately 5400 square kilometers and covering regions in Rajasthan, Madhya Pradesh, and Uttar Pradesh. The sanctuary was created to safeguard the critically endangered gharial crocodile, as well as other endangered species such as the red-crowned roof turtle, Indian skimmer, and sarus crane. It is also part of the larger Chambal Wildlife Sanctuary, covering an area of 7400 square kilometers. The Chambal River Basin has a subtropical climate, with hot summers and cool winters. The region receives most of its rainfall during the monsoon season from June to September, with average annual precipitation ranging from 500 to 800 mm. The river and its tributaries are fed by snowmelt and rainfall from the Aravalli and Vindhya mountain ranges, which helps to maintain a steady flow of water throughout the year. However, the river is also subject to periodic droughts, which can lead to low flow and increased vulnerability to sand mining. The study area for illegal sand mining comprises sand mining sites that were selected based on reports submitted by the Director of the National Chambal Sanctuary (NCS) and an Additional Director (Mines) to the National Green Tribunal [37].
Sewarpali, Jhiri, and Chandilpura sites are famous for illegal sand mining (Figure 3). Therefore, 1 km upstream and downstream of these three mining sites and the stretches between these mining sites were selected for the present study to calculate the erosion and accretion of the riverbank line. On the other hand, a 1 km river stretch of the Chambal River under the village Basai Neem was selected as an unmined site in order to compare the rate of bank erosion between the mining site and the unmined site. Moreover, while selecting the unmined sites, we considered other bank erosion factors, i.e., bank materials, meander geometry, hydraulic variables, etc., that are more or less similar to the selected mining site in order to avoid biases.

2.2. Datasets

To analyze the Chambal River shoreline erosion and accretion, Landsat imagery data (T.M., ETM+, and OLI) and Sentinel-2A/MSI from 1990 to 2020 were collected as shown in Table 1. These data were processed using ERDAS IMAGINE for layer stacking, image correction, and enhancement. The digital shoreline analysis system (DSAS v5.1) was utilized to estimate the migration rate of the river shoreline. The study also investigated the effectiveness of spectral indices such as NDWI and MNDWI to locate riverbank lines. The methodology employed in this study is illustrated in Figure 4. In order to analyze erosion and accretion along the Chambal River, three illegal sand mining spots were selected: Sewarpali (26°24′21.7″ N 77°27′06.5″ E), Jhiri (26°26′16.4″ N 77°33′36.8″ E), and Chandilpura (26°32′30.6″ N 77°45′00.7″ E), as shown in Figure 3.

2.3. Monitoring and Mapping River Shoreline Erosion and Accretion

2.3.1. DSAS Shoreline Analysis

The USGS’ digital shoreline analysis system (DSAS) version 5.1, an add-in to EsriArcGIS Desktop, can measure and analyze changes in river shoreline position over time. DSAS computes rate-of-change statistics for a time series of shoreline vector data. Three different statistics are used to determine where the shorelines have changed. The shoreline change envelope (SCE) reports a distance (in meters), not a rate. The SCE value represents the most significant distance among all the shorelines intersecting a given transect. The net shoreline moment (NSM) measures the elapsed time between the oldest and newest shorelines along each transect [38]. The endpoint rate (EPR) is calculated by dividing the distance (m) between two shorelines by the number of years between their respective dates by using Equation (1) [39]. SCE and NSM are used to characterize the alterations to the shoreline in the study area. EPR and LLR are used to determine the rate of river shoreline changes. The shoreline feature classes were created in Personal Geodatabase to digitize the river shorelines of different years. The date of the shoreline was added in the attribute table as MM/DD/YYYY. The river baseline is digitized from Google Earth, and the baseline feature class is also created in the same geodatabase.
E P R = ( D i s t a n c e   o f   s h o r e l i n e   ( 1990 ) D i s t a n c e   o f   S h o r e l i n e   ( 2020 ) ) 30   Y e a r s

2.3.2. Using Water Indices to Determine the Location of Streambanks

The normalized difference water index (NDWI) is an index employed in remote sensing to identify and map open water bodies, including wetlands and rivers. It has a value range of −1 to 1, with higher values indicating the presence of water, while lower values indicate the presence of non-water features such as vegetation or bare soil [40]. The Green-NIR band combination is utilized to compute NDWI, where NIR denotes the near-infrared spectral band and GREEN denotes the visible green spectral band. The use of NDWI may enhance the identification of water bodies in a satellite image [41].
With the help of Equation (2), NDWI was calculated:
N D W I = G r e e n N I R G r e e n + N I R
The MNDWI is a water index that enhances the detectability of open water by utilizing the green and SWIR bands. It also diminishes the features of urban areas associated with open water in other indices. Like NDWI, MNDWI values range from −1 to 1, where higher values indicate the presence of water, while lower values suggest non-water features such as vegetation or bare soil [42]. In MNDWI, areas with no water bodies are represented by negative values, while positive values indicate the presence of water bodies.
With the help of Equation (3), MNDWI was calculated:
M N D W I = G r e e n S W I R G r e e n + S W I R
MNDWI demonstrated a better visual representation of water and dense vegetation, while NDWI, a water index, was less effective in visually differentiating between water and vegetation (Figure 5). In NDWI, water, forests, and grasslands had the exact same pixel values. MNDWI improved the detection of water bodies such as rivers but could not distinguish between other land cover classes. We further analyzed the pixel values based on land cover classes to validate the visual observations. NDWI and MNDWI, being water-related indices, exhibit a better representation of water in their values. However, MNDWI appeared to be a more dependable indicator, as it was the only index among the three that effectively enhanced the water surfaces.

3. Results and Discussion

This section presents the main findings of the study, which aimed to quantitatively analyze shoreline erosion and accretion along the Chambal River using Landsat imagery data and the digital shoreline analysis system (DSAS) software. Specifically, the study focused on three illegal sand mining hotspots along the river: Sewarpali, Jhiri, and Chandilpura. The results of changes in shoreline distance, as assessed by the shoreline change envelope (SCE) and net shoreline movement (NSM), as well as the endpoint rate (EPR) calculations of shoreline accretion and erosion, are presented in this section. These findings provide valuable insights into the impact of illegal sand mining on river shoreline erosion and accretion in the Chambal River, which can inform efforts towards sustainable management and conservation of the National Chambal Sanctuary ecosystem and its resources.

3.1. Distance Change Measurement of Shoreline

The result of the shoreline change envelope (SCE) revealed that the distance of the river shoreline between the closest distance and most distantly located transects from the baseline Jhiri has a minimum SCE value of 10.86 m. Further, Jhiri had a maximum SCE value of 130.27 m (Table 2).
The net shoreline movement is calculated for all three illegal sand mining sites. As shown in Figure 6, NSM reports the distance between the oldest (1990) and youngest (2020) shorelines [43], with a negative distance indicating erosion and a positive distance indicating accretion in the river shoreline as shown in Figure 6. The percentage of all transects with negative and positive distances is mentioned in Table 3.

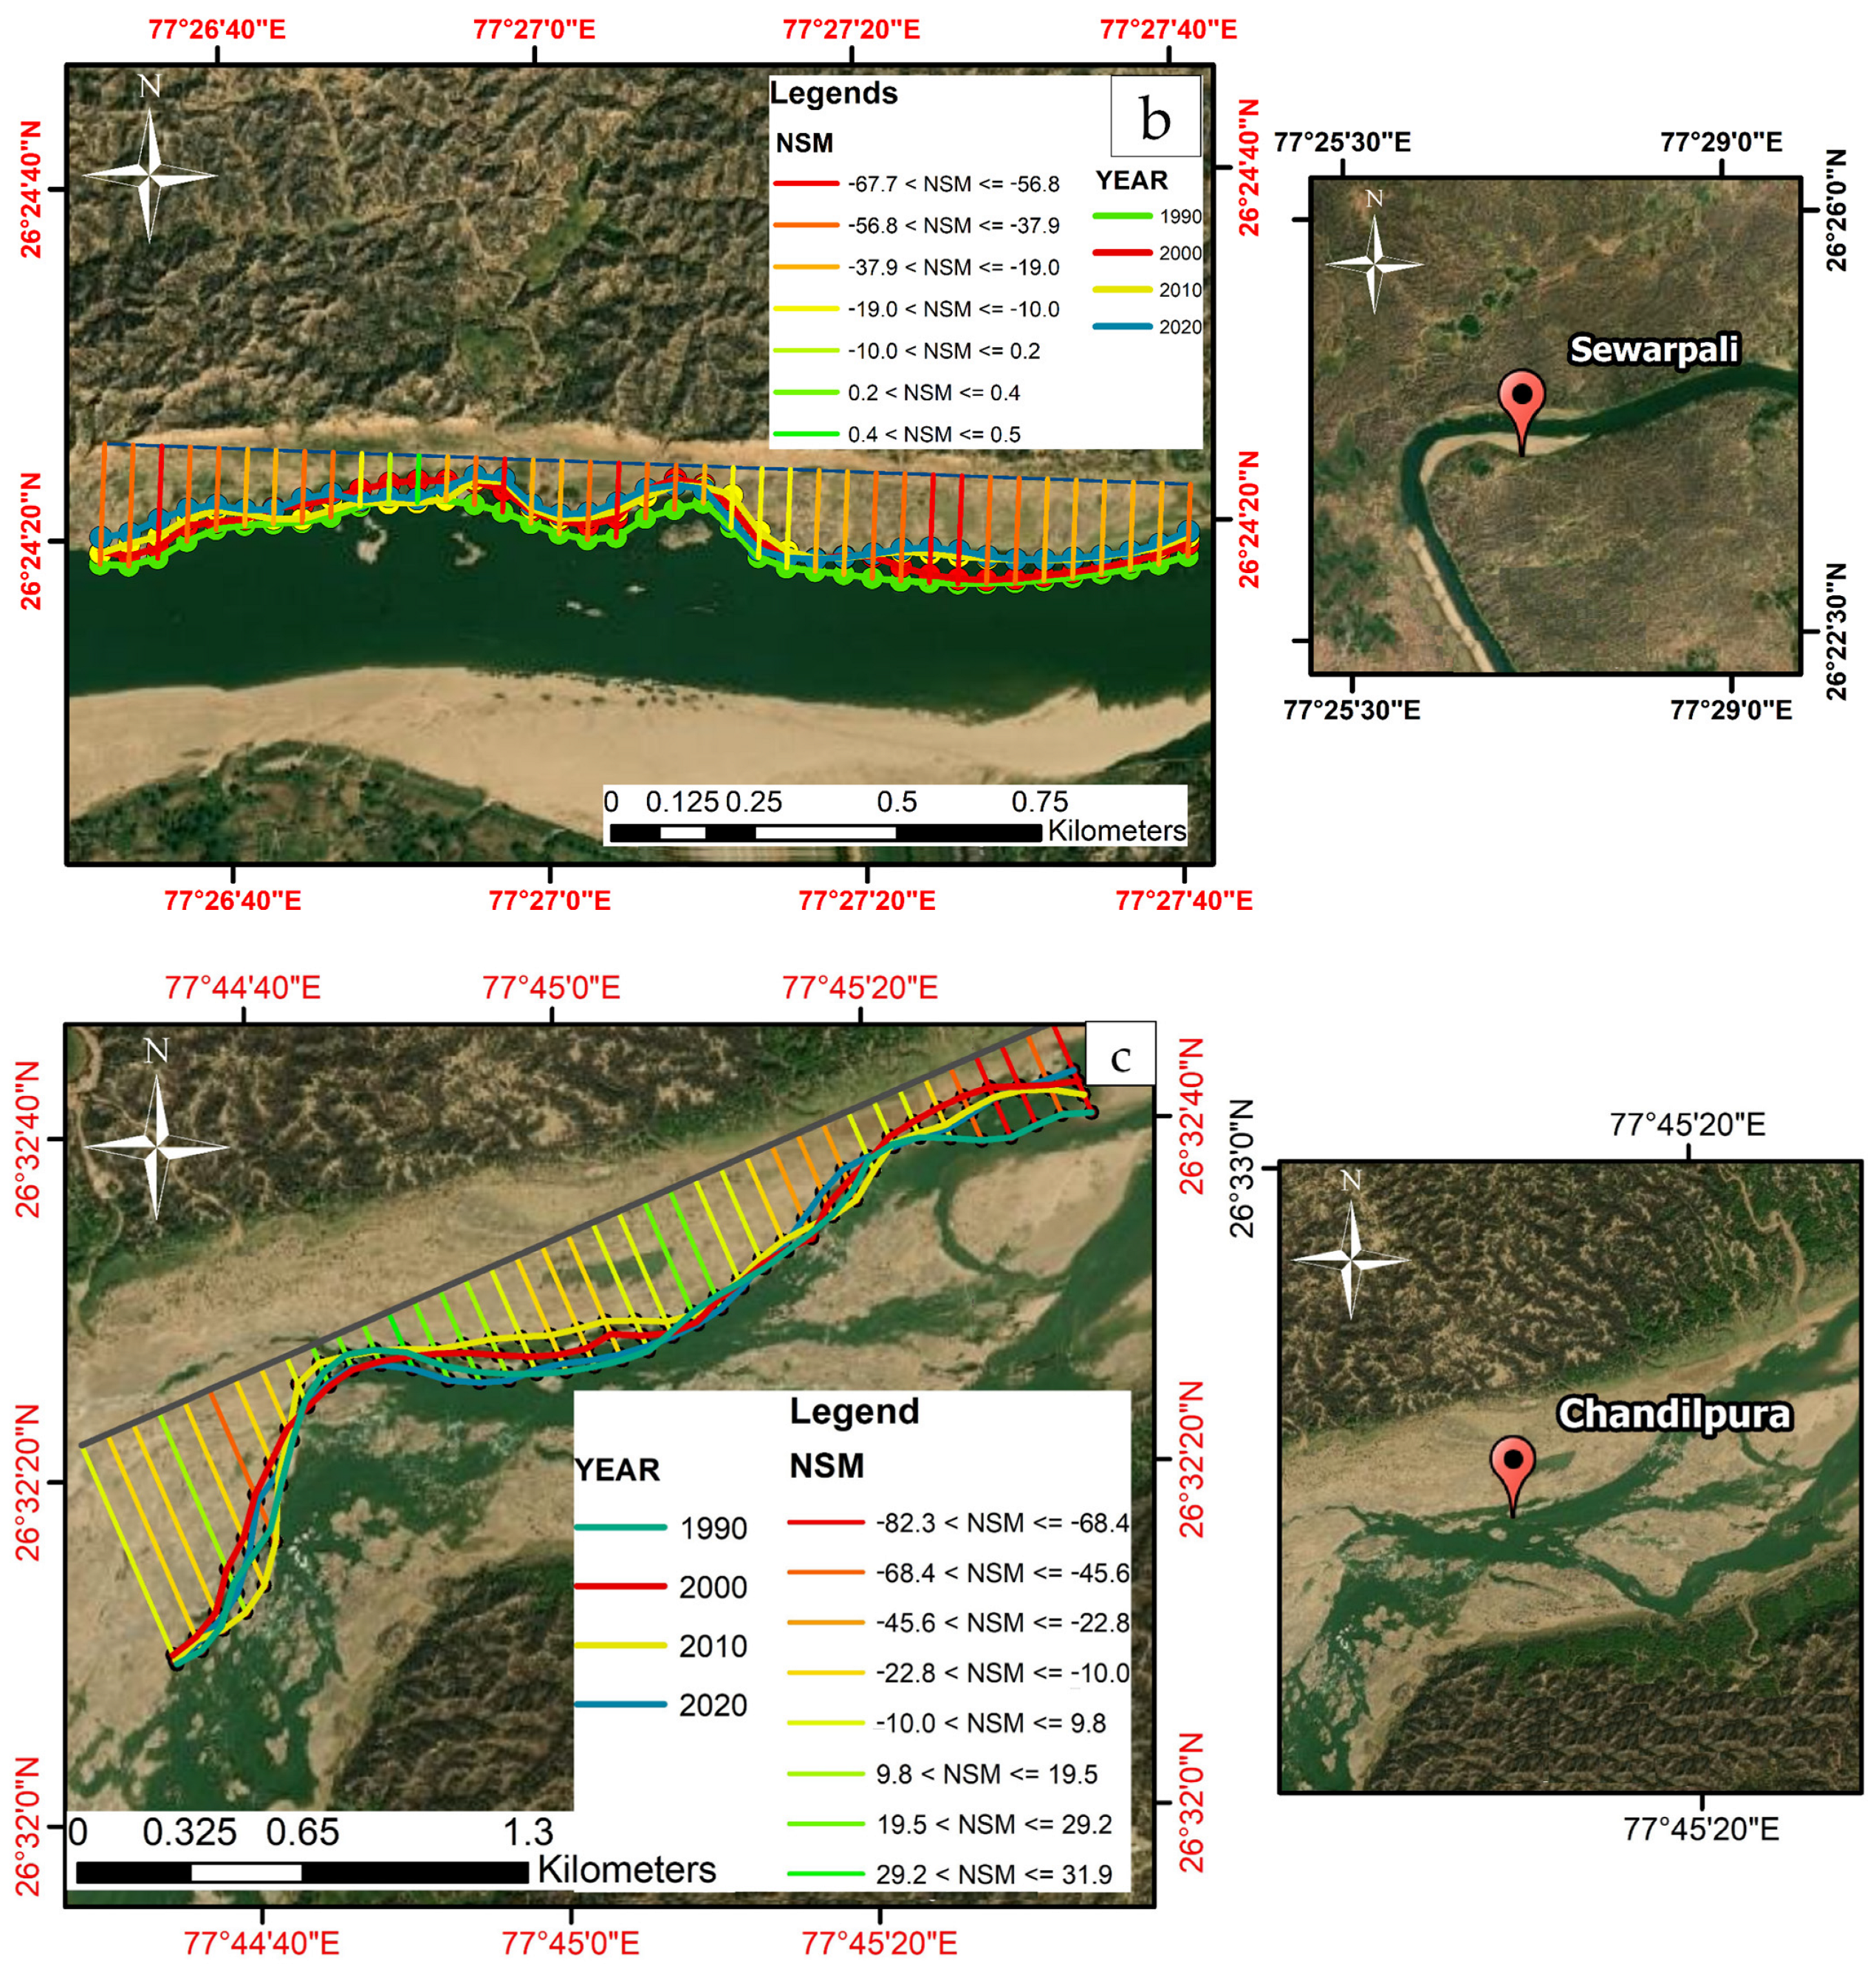
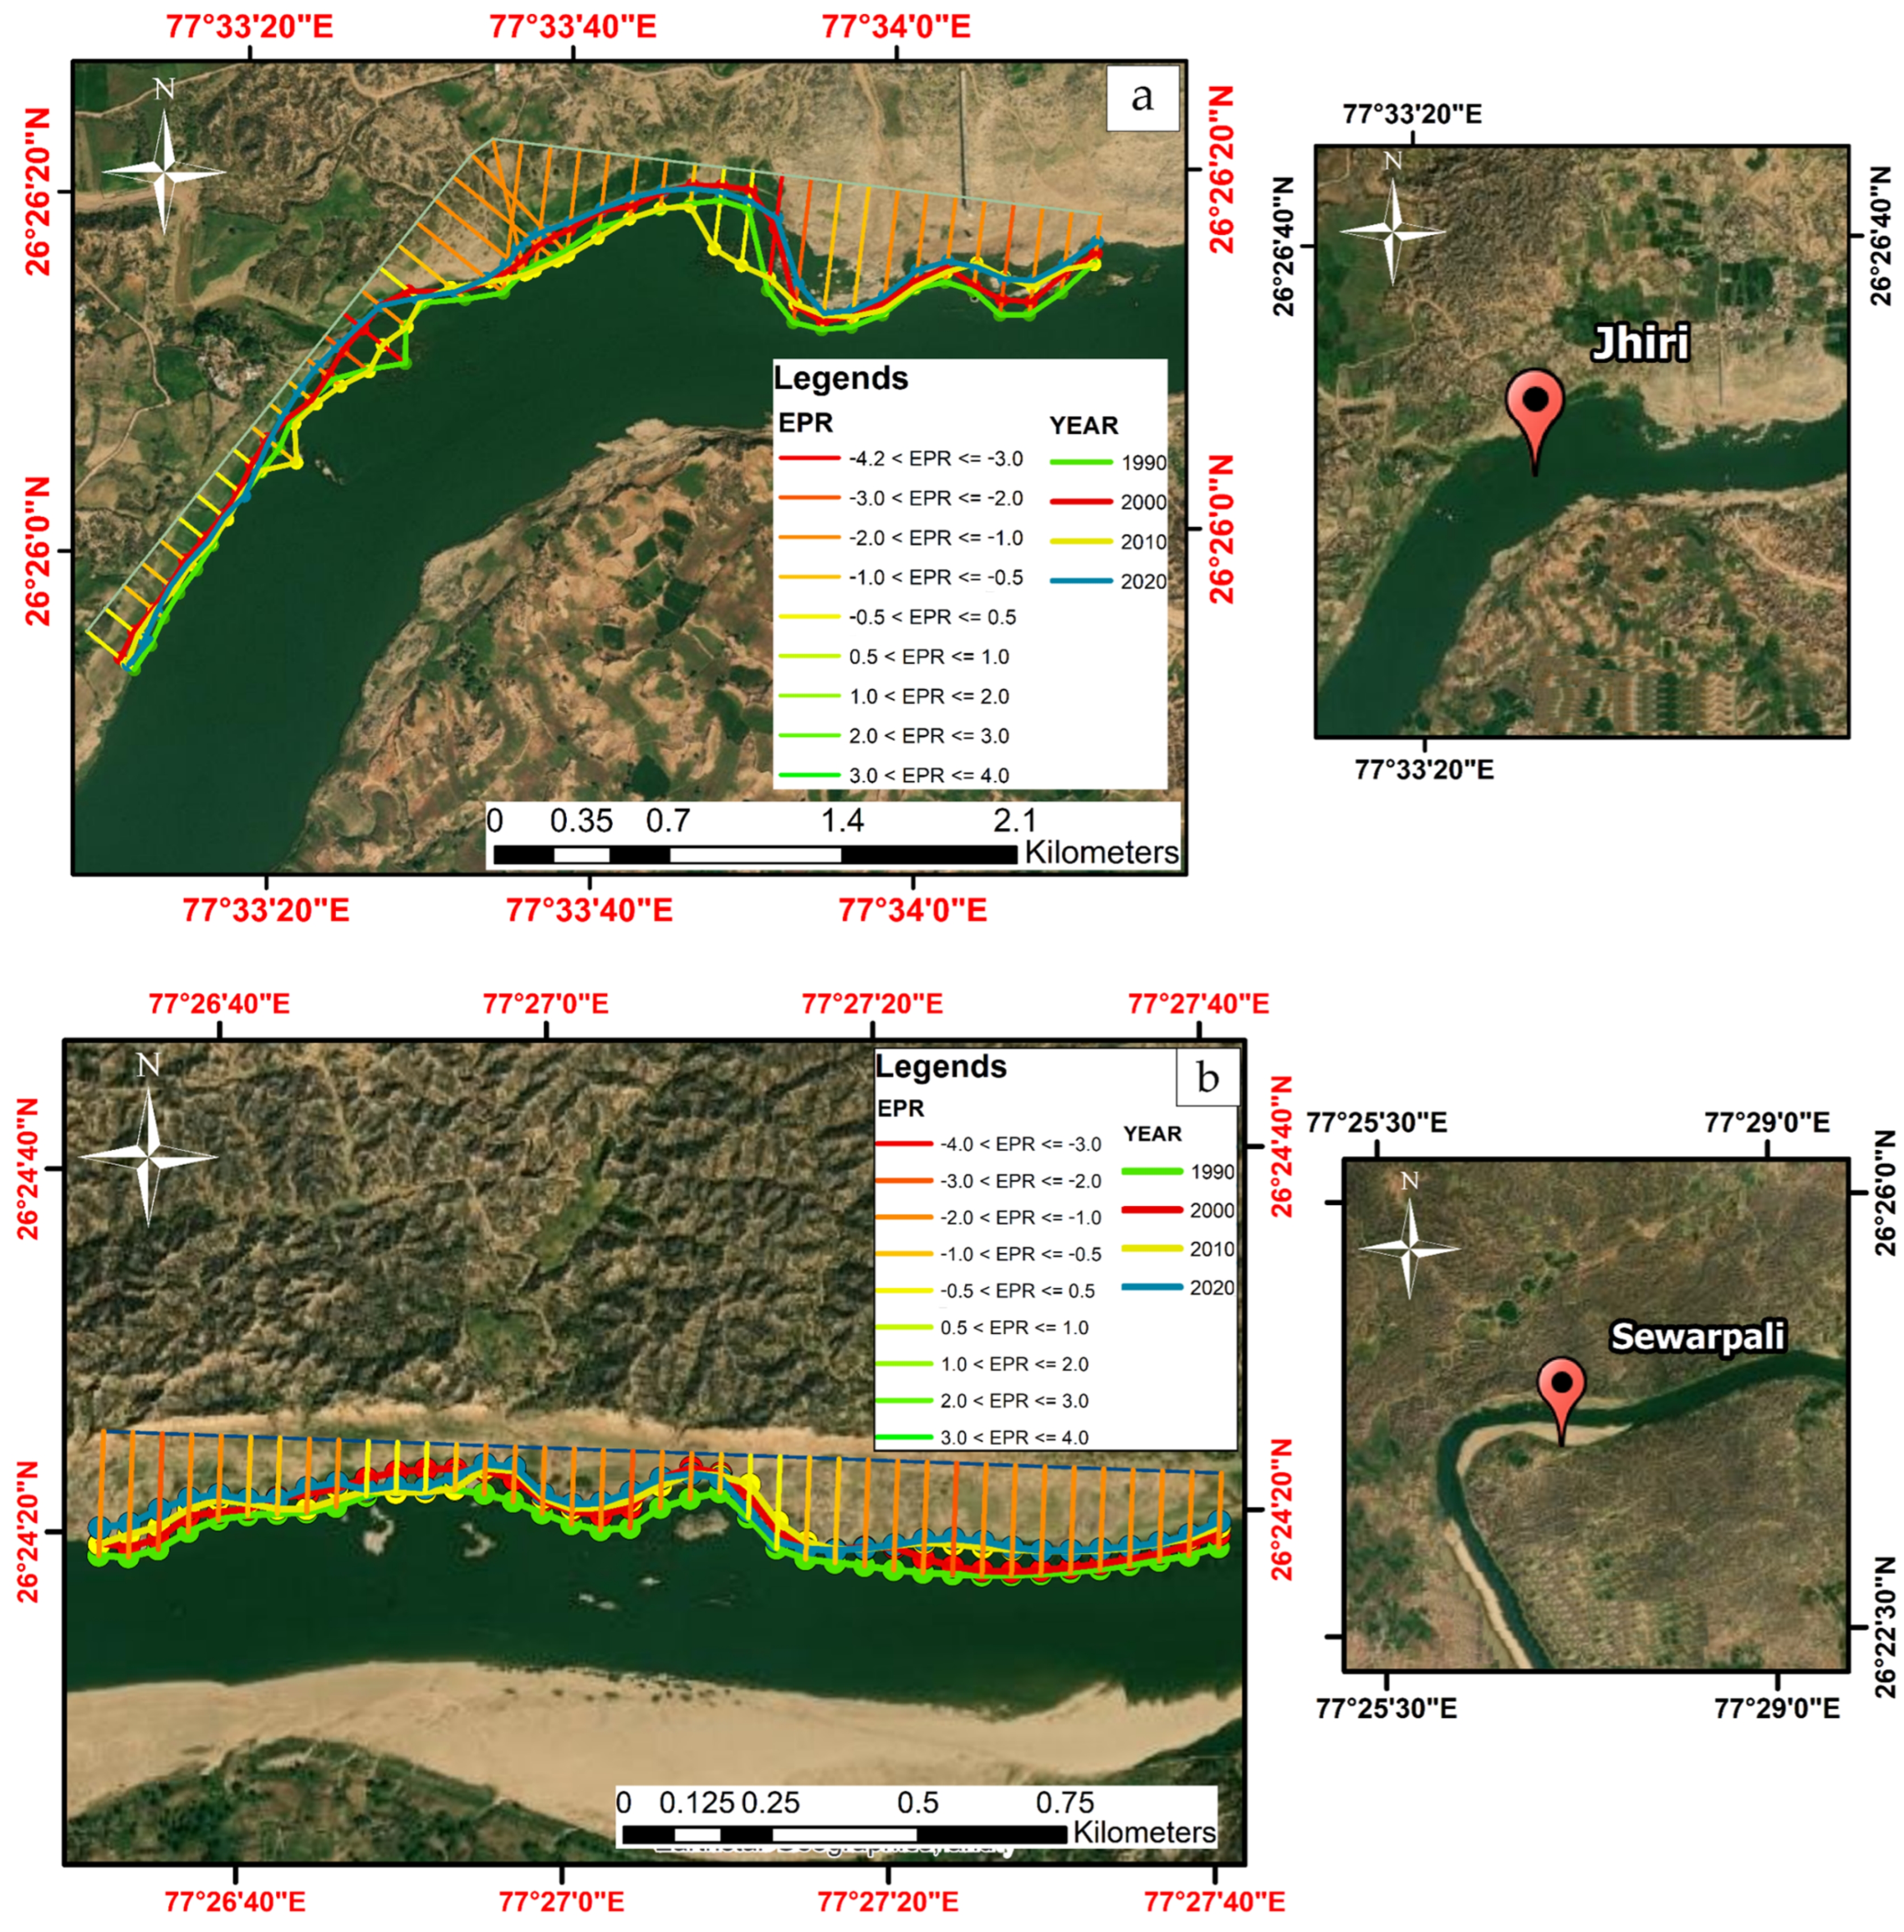
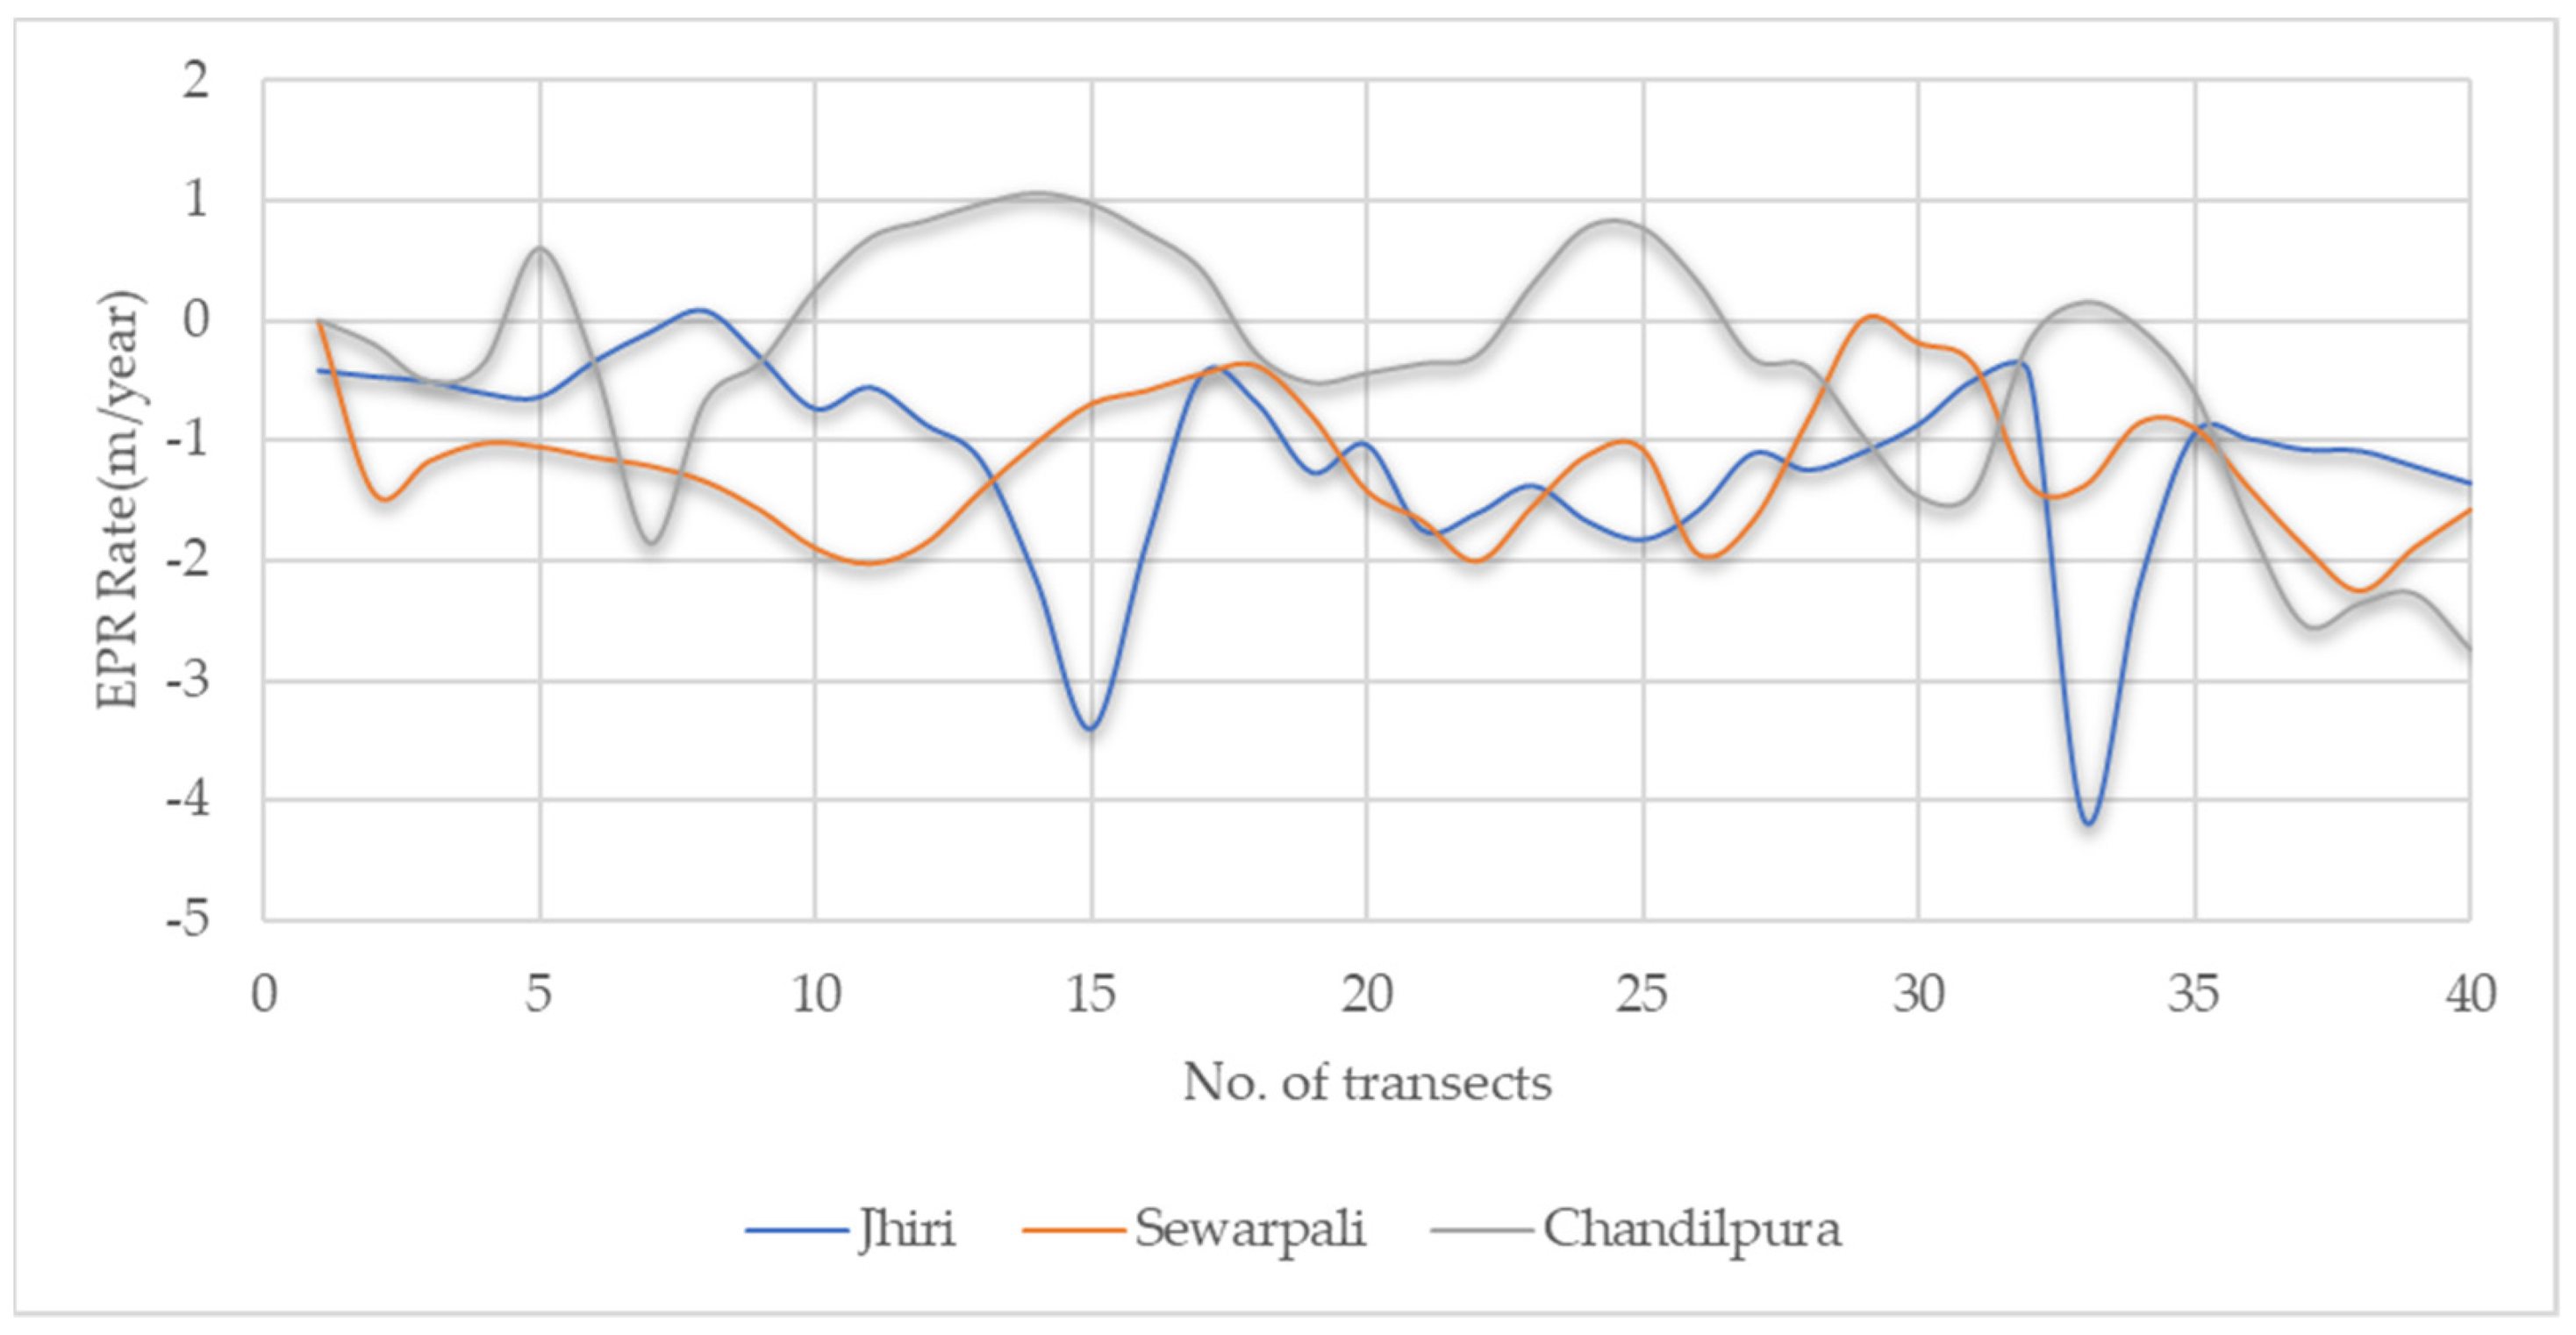
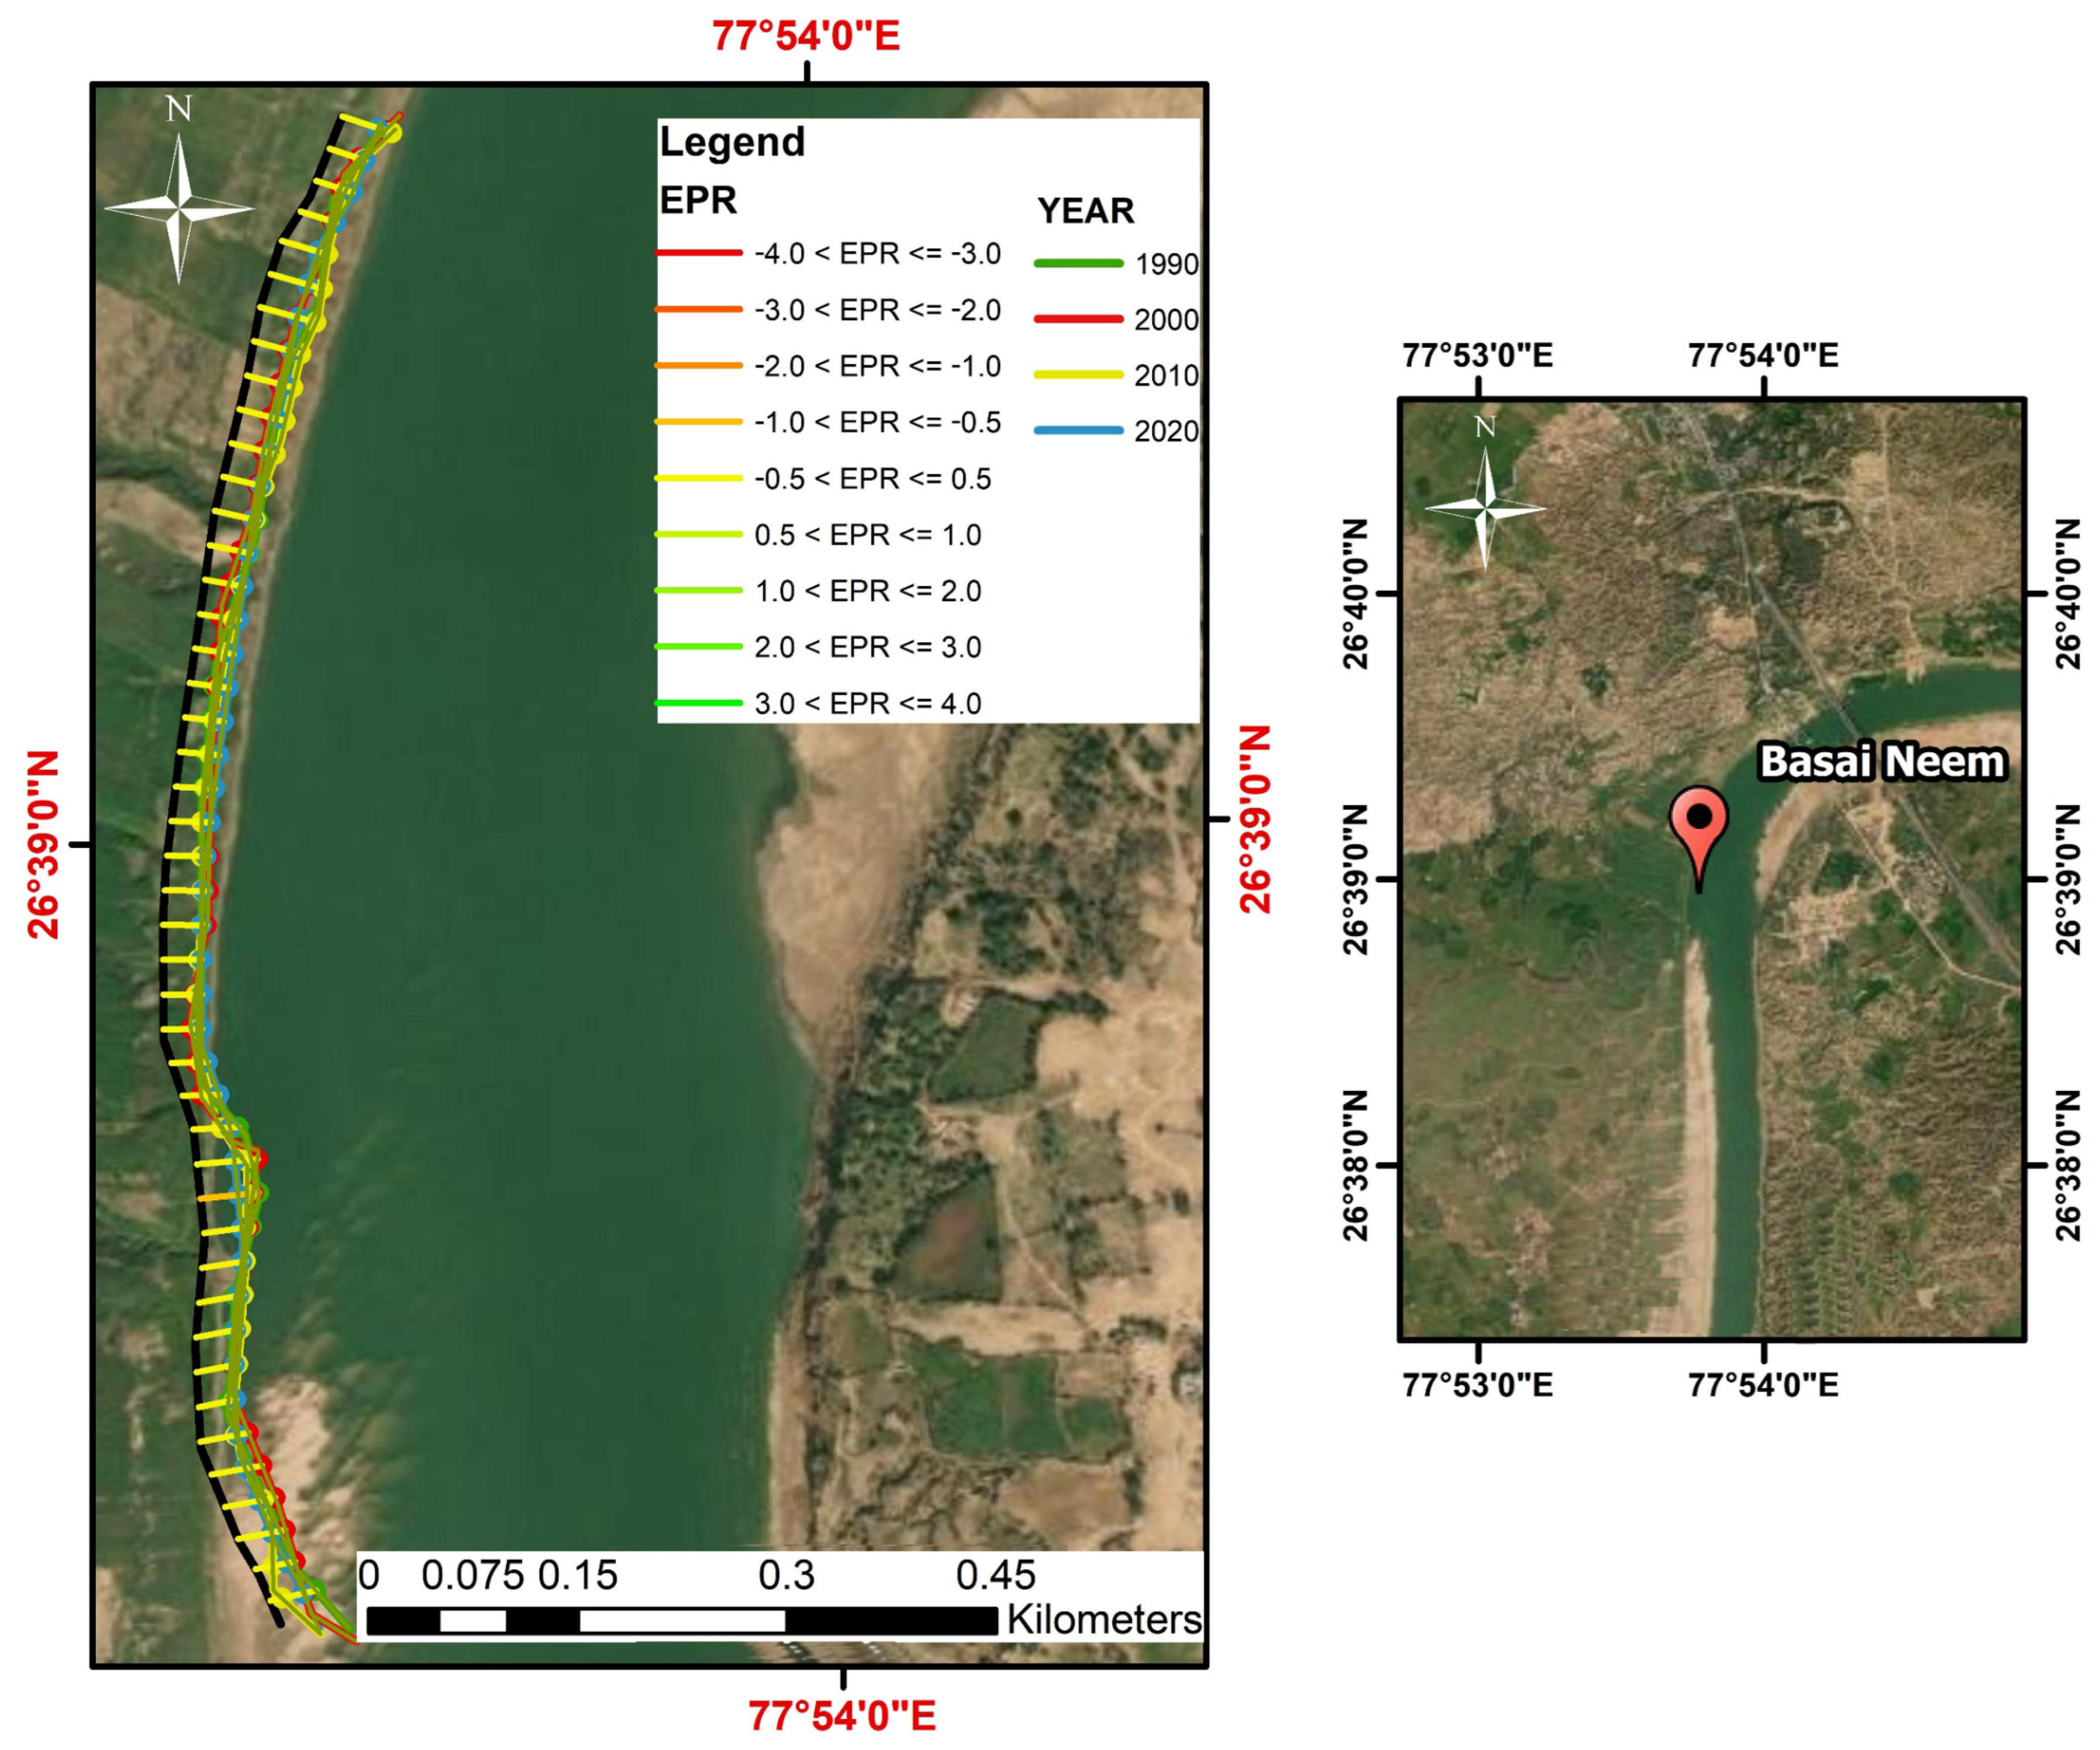
3.2. Estimation of River Shoreline Erosion and Accretion Rates

The EPR was determined by dividing the total distance by the time that the shoreline changed. This method determines movement yearly [38]. The endpoint rate map created for these three sand mining hotspots, as shown in EPR, showed riverbank erosion and accretion. The erosion and accretion rates of these three sand mining hotspots are shown in Figure 5, where a negative value indicates the erosion of the river shoreline and a positive value indicates the accretion along the shoreline. The erosion rate indicated the maximum value at the Sewarpali sand mining zone, which is calculated at 1.26 m per year, and the maximum accretion at the Chadilpura sand mining zone, which is 0.63 m per year. The endpoint rate profiles in the map profile also indicate the maximum erosion rate, as shown in Figure 7, and the comparative EPR rate, which shows the erosion and accretion of the riverbank, is shown in Figure 8.
The profiles display the change in elevation with respect to the distance from the starting point of the sand mining zone (Figure 7). These findings underscore the adverse impacts of sand mining on river geomorphology and emphasize the need for effective management strategies to mitigate these impacts and preserve the ecological health of the river.
The changes in river shorelines were studied in three areas where sand is illegally mined. The rate of river shoreline erosion was recorded at 0.96 m/year at Jhiri, 1.26 m/year at Sewarpali, and 0.93 m/year at Chandilpura. Along these illegal sand mining operations, river shoreline accretion is recorded at 0.43 m/year at Jhiri, 0.3 m/year at Sewarpali, and 0.63 m/year at Chandilpura. Sewarpali had the highest rate of shoreline erosion among the three sand mining areas along the Chambal River. These changes could significantly impact the ecosystem of the National Chambal Sanctuary and its crucial habitats by altering the river’s shoreline. We conducted a thorough comparative study with an unmined site along the Chambal River by using the National Factual and Action Taken report of a joint committee’s visit to the National Chambal Sanctuary stretch on 17 May 2022 as our primary reference [37]. Our study aimed to understand the effects of sand mining on riverbank erosion and the natural environment. The report confirms that the unmined site along the Chambal River has maintained its stability over the last 30 years. Our analysis also compared the unmined site with three illegal sand mining sites, which demonstrated that the bank erosion downstream only occurred at the locations of mining. We observed that erosion was most severe at the mining sites and not at the unmined site. The acceleration of bank erosion at the mining sites suggests that mining activities have a direct impact on the natural balance of the river and are responsible for the observed erosion. According to Bhattacharya et al. (2019) [4], sand mining areas have the potential to disrupt the channel’s sediment and bedload transfer and alter hydraulic responses. In the context of sand mining, the planform response indicates that thalweg shifting results in significant sandchar deposition in the upper course, significant channel incision results in riverbank erosion and expansion of the channel width in the middle course, and pool-riffle alteration results in the expansion of the channel and pit area in the lower course. Moreover, Ghosh et al. (2016) [44] found that changes in the erosional and depositional sequence due to excavation makes an area of the Damodar River, India, erosion-prone. However, the river tried to reduce its width through lateral deposition in this particular area for almost a hundred years. Hackney et al. (2020) [45] also stated that excessive sand mining in the Mekong River lowered the riverbed, which in turn led to the onset of riverbank instability, raising the likelihood of dangerous riverbank collapse. We calculated the average rates of shoreline erosion and river shoreline accretion at the unmined site to be −0.18 m/year and 0.19 m/year, respectively. These results indicate that the unmined site has maintained its stable state over the past 30 years, and the natural environment remains intact (Figure 8 and Figure 9). This erosion and loss of habitats and resources can lead to significant changes in land use and land cover (LULC). These findings are consistent with previous studies [46,47] that have shown the negative impacts of sand mining on riverbank erosion and the natural environment. This study provides valuable insights into the negative effects of sand mining on riverbank erosion and the natural environment and will be helpful in regulating and managing sand mining activities in the Chambal River Basin and other similar environments to minimize the damage to the ecosystem.
This Figure 10 displays the endpoint rate profile of an unmined site in the Chambal River Basin. The profile shows the change in elevation with respect to the distance from the starting point of the site. The profile displays a relatively stable elevation with only minor variations in the rate of change of elevation, indicating the site’s natural and undisturbed geomorphic conditions. This finding highlights the importance of preserving and protecting unmined sites as important reference areas for assessing the impacts of sand mining activities on river geomorphology and ecosystem health.
This Figure 11 presents a comparative analysis of the erosion and accretion rates at four study sites in the Chambal River Basin, including three sand mining sites and one unmined site. The estimated erosion and accretion rates for each site are shown, as determined by analyzing changes in land elevation over a defined period of time.
Moreover, the loss of land along the river shoreline could also impact the National Chambal Sanctuary and its important habitats by altering the composition of plant and animal communities and causing the loss of wildlife habitats [48,49,50]. The destruction of infrastructure along the river shoreline can result in economic losses and disruptions to essential services, potentially leading to the relocation of communities [51]. If the shoreline erosion continues, it may become necessary to implement beach nourishment projects to stabilize the river shoreline, but this could also impact the LULC along the Chambal River by changing the appearance of the riverbank line and altering the habitats of plants and animals [52].
The riverbanks in India are subject to constant changes, which can lead to various natural hazards such as flooding, erosion, and landslides [53,54]. The increase in human activities, such as deforestation, the construction of dams, and urbanization, have contributed significantly to altering the riverbanks’ flow and speed, leading to soil erosion and sedimentation. The changes can also cause the river to widen or narrow [55], affecting water flow [56], leading to increased flooding and causing severe damage to the surrounding areas [57]. Apart from this, changing riverbanks can also cause fluctuations in the water table levels, leading to ground instability and landslides [58,59,60,61]. These hazards can lead to significant damage to both the environment and human settlements. Therefore, it is crucial for the government and communities to take measures to prevent and mitigate these hazards through sustainable river management practices [62,63,64]. Sustainable river management practices can include measures such as afforestation along the riverbanks to reduce soil erosion, the construction of check dams to prevent flooding, and regular maintenance of existing dams to ensure their optimal functioning. Additionally, the government can also enforce regulations to limit human activities such as sand mining and indiscriminate construction along riverbanks, which contribute to the degradation of river ecosystems [65,66,67]. In conclusion, the changing riverbanks in India can cause significant natural hazards, leading to damage to the environment and human settlements. Sustainable river management practices can help prevent and mitigate these hazards, and it is essential for the government and communities to take proactive measures to ensure the sustainable use of rivers.

4. Conclusions

This research demonstrates the effectiveness and usefulness of satellite imagery and GIS in monitoring changes in river shorelines over time. The shoreline change envelope (SCE), net shoreline mesh (NSM), and endpoint rate (NSM) statics were used to examine the changes in the Chambal River’s shoreline at illegal sand mining sites between 1990 and 2020. The findings indicate that illegal sand mining activities pose a threat to the biodiversity of the Chambal National Sanctuary and could lead to the extinction of certain species and disruptions to the food chain and ecosystem. The findings demonstrated that three illegal sand mining sites—Sewarpali, Chandilpura, and Jhiri—at the Chambal National Sanctuary were subject to shoreline changes, with Sewarpali having the highest erosion rate of 1.26 m/year and Chandilpura having the highest accretion rate of 0.63 m/year. The erosion and accretion rates at the Jhiri sand mining site are recorded at −0.96 m/year and 0.43 m/year, respectively. The erosion and accretion rates observed at Basai Neem, specifically in areas that have not undergone sand mining activities, have been recorded as −0.18 m/year and 0.19 m/year, respectively. These rates are comparatively lower than those observed in regions that have gone through extensive illegal sand mining activities. The study found that illegal sand mining significantly impacts the Chambal River shoreline, leading to erosion in some areas and accretion in others. This can result in the loss of biodiversity, the endangerment of certain species, and disruptions to the food chain and ecosystem. The study highlights the need for further research, including hydrological studies, to better understand the impacts of illegal sand mining on river water flow, including changes in water levels, velocity, and sediment transport. Overall, this study provides important insights into the changes in the Chambal River shoreline and the impact of illegal sand mining. The findings of this study can inform future management and conservation efforts in the region and have implications for river management and conservation more broadly. Future studies are needed to conduct a hydrological study of the Chambal River to understand the impacts of illegal sand mining on the river’s water flow, including changes in water levels, velocity, and sediment transport. The main limitations of the present study are difficulties in obtaining Landsat images of higher resolution and availability data for the desired period and atmospheric conditions. Landsat 5 T.M. data from Landsat 7 ETM+ and Landsat 8 OLI are only available at 30 m resolution. This study is carried out only on a particular segment of the river (three spots). This study has several important implications. The results of this study have shown that satellite imagery and GIS approaches can effectively and accurately track changes in the river shoreline over time. This is important for the ongoing monitoring and management of river systems.

Author Contributions

Conceptualization, S.S. and S.K.S.; methodology, S.S.; software, S.S.; validation, S.K., D.K.P. and B.A.J.; formal analysis, S.K.S.; investigation, P.K.; resources, S.S.; data curation, G.M.; writing—original draft preparation, S.S.; writing—review and editing, G.M., J.D., D.S. and D.K.P.; visualization, G.M.; supervision, S.K.S. All authors have read and agreed to the published version of the manuscript.

Funding

This research received no external funding.

Data Availability Statement

The data are available from the first author upon reasonable request.

Conflicts of Interest

The authors declare no conflict of interest.

References

  1. Rentier, E.S.; Cammeraat, L.H. The environmental impacts of river sand mining. Sci. Total Environ. 2022, 838, 155877. [Google Scholar] [CrossRef] [PubMed]
  2. Lovric, N.; Tosic, R. Assessment of bank erosion, accretion and channel shifting using remote sensing and gis: Case study—Lower course of the bosna river. Quaest. Geogr. 2016, 35, 81–92. [Google Scholar] [CrossRef]
  3. Lahon, D.; Sahariah, D.; Debnath, J.; Nath, N.; Meraj, G.; Kumar, P.; Hashimoto, S.; Farooq, M. Assessment of Ecosystem Service Value in Response to LULC Changes Using Geospatial Techniques: A Case Study in the Merbil Wetland of the Brahmaputra Valley, Assam, India. ISPRS Int. J. Geo-Inf. 2023, 12, 165. [Google Scholar] [CrossRef]
  4. Bhattacharya, R.; Dolui, G.; Das Chatterjee, N. Effect of instream sand mining on hydraulic variables of bedload transport and channel planform: An alluvial stream in South Bengal basin, India. Environ. Earth Sci. 2019, 78, 303. [Google Scholar] [CrossRef]
  5. Arora, S.; Patel, H.K.; Lade, A.D.; Kumar, B. Turbulence structure and bank erosion process in a dredged channel. River Res. Appl. 2023, 39, 613–628. [Google Scholar] [CrossRef]
  6. Negros, R.G.O. Impacts of sand mining. 2019, pp. 1–7. Available online: http://ismenvis.nic.in/Database/Impacts-of-Sand-Mining_3466.aspx (accessed on 18 October 2022).
  7. Padmalal, D.; Maya, K. Sand Mining; Springer Science: Berlin/Heidelberg, Germany, 2014. [Google Scholar] [CrossRef]
  8. Garde, R.J.; Raju, K.G.R. Mechanics of Sediment Transportation and Alluvial Stream Problems; Wiley: New York, NY, USA, 1985. [Google Scholar]
  9. Collins, B.; Dunne, T. Gravel transport, gravel harvesting, and channel bed degradation in rivers draining the Southern Olympic Mountains, Washington, USA. Environ. Geol. Water Sci. 1989, 13, 213–224. [Google Scholar] [CrossRef]
  10. Kondolf, G.M. Geomorphic and environmental effects of instream gravel mining. Landsc. Urban Plan. 1994, 28, 225–243. [Google Scholar] [CrossRef]
  11. Hartfield, P. Headcuts and their effects on freshwater mussels. In Paper Presented at the UMRCC Symposium on Conservation and Management of Freshwater Mussels, Rock Island, Illinois; Upper Mississippi River Conservation Committee: Onalaska, WI, USA, 1993; pp. 131–141. [Google Scholar]
  12. Kondolf, G.M. Hungry water: Effects of dams and gravel mining on river channels. Environ. Manag. 1997, 21, 533–551. [Google Scholar] [CrossRef]
  13. Williams, G.P.; Wolman, M.G. Downstream effects of dams on alluvial rivers. US Geol. Surv. Prof. Pap. 1984, 1286, 89. [Google Scholar]
  14. Parker, G.; Klingeman, P.C.; McLean, D.G. Bedload and size distribution in paved gravel-bed streams. J. Hydraul. Eng. Div. ASCE 1982, 108, 544–571. [Google Scholar] [CrossRef]
  15. Meyer-Peter, E.; Müller, R. Formulas for Bed-Load Transport. In Proceedings of the IAHSR 2nd Meeting, Stockholm, Sweden, 7 June 1948. Appendix 2. [Google Scholar]
  16. Meraj, G.; Romshoo, S.A.; Yousuf, A.R.; Altaf, S.; Altaf, F. Assessing the influence of watershed characteristics on the flood vulnerability of Jhelum basin in Kashmir Himalaya. Nat. Hazards 2015, 77, 153–175. [Google Scholar] [CrossRef]
  17. Tha, T.; Piman, T.; Bhatpuria, D.; Ruangrassamee, P. Assessment of riverbank erosion hotspots along the mekong river in cambodia using remote sensing and hazard exposure mapping. Water 2022, 14, 1981. [Google Scholar] [CrossRef]
  18. Knighton, D. Fluvial Forms and Process; Edward Arnold Ltd.: London, UK, 1984. [Google Scholar]
  19. Selby, M.J. Book reviews: Morisawa, m. and hack, j.t. editors, 1985: Tectonic geomorphology. proceedings of the 15th annual binghamton geomorphology symposium. september 1984. boston: Allen and unwin. xiv + 390 pp. £25.00. Prog. Phys. Geogr. Earth Environ. 2016, 10, 620–623. [Google Scholar] [CrossRef]
  20. Sutfin, N.A.; Rowland, J.; Fratkin, M.; Stauffer, S.; Carroll, R.; Brown, W.; Williams, K.H. River bank erosion and lateral accretion linked to hydrograph recession and flood duration in a mountainous snowmelt-dominated system. Authorea Prepr. 2022. [Google Scholar] [CrossRef]
  21. Khoi, D.N.; Dang, T.D.; Pham, L.T.H.; Loi, P.T.; Thuy, N.T.D.; Phung, N.K.; Bay, N.T. Morphological change assessment from intertidal to river-dominated zones using multiple-satellite imagery: A case study of the vietnamesemekong delta. Reg. Stud. Mar. Sci. 2020, 34, 101087. [Google Scholar] [CrossRef]
  22. Hemmelder, S.; Marra, W.; Markies, H.; De Jong, S.M. Monitoring river morphology & bank erosion using uav imagery—A case study of the river buëch, hautes-alpes, France. Int. J. Appl. Earth Obs. Geoinf. 2018, 73, 428–437. [Google Scholar] [CrossRef]
  23. Baki, A.B.M.; Gan, T.Y. Riverbank migration and island dynamics of the braided jamuna river of the ganges-brahmaputra basin using multi-temporal landsat images. Quat. Int. 2012, 263, 148–161. [Google Scholar] [CrossRef]
  24. Takagi, T.; Oguchi, T.; Matsumoto, J.; Grossman, M.J.; Sarker, M.H.; Matin, M.A. Channel braiding and stability of the brahmaputra river, bangladesh, since 1967: Gis and remote sensing analyses. Geomorphology 2007, 85, 294–305. [Google Scholar] [CrossRef]
  25. Wolman, M.G. Factors influencing erosion of a cohesive river bank. Am. J. Sci. 1959, 257, 204–216. [Google Scholar] [CrossRef]
  26. Hooke, J.M. Magnitude and distribution of rates of river bank erosion. Earth Surf. Process. 1980, 5, 143–157. [Google Scholar] [CrossRef]
  27. Lawler, D.M.; Couperthwaite, J.; Bull, L.J.; Harris, N.M. Bank erosion events and processes in the upper severn basin. Hydrol. Earth Syst. Sci. 1997, 1, 523–534. [Google Scholar] [CrossRef]
  28. Winterbottom, S.; Gilvear, D. A gis-based approach to mapping probabilities of river bank erosion: Regulated river tummel, Scotland. Regul. Rivers-Res. Manag. 2000, 16, 127–140. [Google Scholar] [CrossRef]
  29. Mani, P.; Kumar, R.; Chatterjee, C. Erosion study of a part of majuli river-island using remote sensing data. J. Indian Soc. Remote Sens. 2003, 31, 12–18. [Google Scholar] [CrossRef]
  30. Bhakal, L.; Dubey, B.; Sarma, A.K. Estimation of bank erosion in the river brahmaputra near agyathuri by using geographic information system. J. Indian Soc. Remote Sens. 2005, 33, 81–84. [Google Scholar] [CrossRef]
  31. Yao, Z.; Ta, W.; Jia, X.; Xiao, J.; Yao, Z.; Ta, W.; Jia, X.; Xiao, J. Bank erosion and accretion along the ningxia-inner mongolia reaches of the yellow river from 1958 to 2008. Geomorphology 2011, 127, 99–106. [Google Scholar] [CrossRef]
  32. Bandyopadhyay, S.; Ghosh, K.; De, S.K. A proposed method of bank erosion vulnerability zonation and its application on the river haora, tripura, india. Geomorphology 2014, 224, 111–121. [Google Scholar] [CrossRef]
  33. Ch, M.H.; Ashraf, M.; Hamid, Q.; Sarwar, S.M.; Saqib, Z.A. Geospatial techniques for assessment of bank erosion and accretion in the maralaalexandria reach of the river chenab, Pakistan. Sains Malays. 2017, 46, 413–420. [Google Scholar] [CrossRef]
  34. Mukherjee, R.; Bilas, R.; Biswas, S.S.; Pal, R. Bank erosion and accretion dynamics explored by gis techniques in lower ramganga river, western uttarpradesh, india. Spat. Inf. Res. 2017, 25, 23–38. [Google Scholar] [CrossRef]
  35. Bhuyan, N.; Sharma, Y.; Sajjad, H.; Ahmed, R. Estimating bank line migration of the brahmaputra river in the middle brahmaputraoodplains of assam, india using digital shoreline analysis system (dsas). Res. Sq. 2022. [Google Scholar] [CrossRef]
  36. Jordan, C.; Tiede, J.; Lojek, O.; Visscher, J.; Apel, H.; Nguyen, H.Q.; Quang, C.N.X.; Schlurmann, T. Sand mining in the mekong delta revisited—Current scales of local sediment deficits. Sci. Rep. 2019, 91, 1–14. [Google Scholar] [CrossRef]
  37. “Factual and Action Taken Report of Joint Committee Date of Visit: 17th may 2022 Location: National Chambal Sanctuary Stretch”, (2) (2022). Available online: https://greentribunal.gov.in/sites/default/files/news_updates/Factual%20and%20Action%20Taken%20Report%20in%20OA%20No.%20248%20of%202022%20(In%20re%20News%20item%20pulished%20in%20The%20Hindu%20dated%2027.03.2022%20titled%20Digging%20up%20the%20Chambal).pdf (accessed on 29 March 2023).
  38. Debnath, J.; Sahariah, D.; Saikia, A.; Meraj, G.; Nath, N.; Lahon, D.; Annayat, W.; Kumar, P.; Chand, K.; Singh, S.K.; et al. Shifting Sands: Assessing Bankline Shift Using an Automated Approach in the Jia Bharali River, India. Land 2023, 12, 703. [Google Scholar] [CrossRef]
  39. Dereli, M.A.; Tercan, E. Assessment of shoreline changes using historical satellite images and geospatial analysis along the lake salda in turkey. Earth Sci. Inform. 2020, 13, 709–718. [Google Scholar] [CrossRef]
  40. Xu, H. Modification of normalized difference water index (ndwi) to enhance open water features in remotely sensed imagery. Int. J. Remote Sens. 2006, 27, 3025–3033. [Google Scholar] [CrossRef]
  41. McFeeters, S.K. The use of the Normalized Difference Water Index (NDWI) in the delineation of open water features. Int. J. Remote Sens. 1996, 17, 1425–1432. [Google Scholar] [CrossRef]
  42. Acharya, T.D.; Lee, D.H.; Yang, I.T.; Lee, J.K. Identification of water bodies in a landsat 8 oli image using a j48 decision tree. Sensors 2016, 16, 1075. [Google Scholar] [CrossRef]
  43. Natarajan, L.; Sivagnanam, N.; Usha, T.; Chokkalingam, L.; Sundar, S.; Gowrappan, M.; Roy, P.D. Shoreline changes over last five decades and predictions for 2030 and 2040: A case study from cuddalore, southeast coast of India. Earth Sci. Inform. 2021, 14, 1315–1325. [Google Scholar] [CrossRef]
  44. Ghosh, P.K.; Bandyopadhyay, S.; Jana, N.C.; Mukhopadhyay, R. Sand quarrying activities in an alluvial reach of Damodar River, Eastern India: Towards a geomorphic assessment. Int. J. River Basin Manag. 2016, 14, 477–489. [Google Scholar] [CrossRef]
  45. Hackney, C.R.; Darby, S.E.; Parsons, D.R.; Leyland, J.; Best, J.L.; Aalto, R.; Nicholas, A.P.; Houseago, R.C. River bank instability from unsustainable sand mining in the lower Mekong River. Nat. Sustain. 2020, 3, 217–225. [Google Scholar] [CrossRef]
  46. Debnath, J.; Sahariah, D.; Lahon, D.; Nath, N.; Chand, K.; Meraj, G.; Kumar, P.; Kumar, S.; Kanga, S.; Farooq, M. Assessing the impacts of current and future changes of the planforms of River Brahmaputra on its land use-land cover. Geosci. Front. 2023, 14, 101557. [Google Scholar] [CrossRef]
  47. Debnath, J.; Sahariah, D.; Lahon, D.; Nath, N.; Chand, K.; Meraj, G.; Farooq, M.; Kumar, P.; Kanga, S.; Singh, S.K. Geospatial modeling to assess the past and future land use-land cover changes in the Brahmaputra Valley, NE India, for sustainable land resource management. Environ. Sci. Pollut. Res. 2022, 1–24. [Google Scholar] [CrossRef]
  48. Taigor, S.R.; Rao, R.J. Habitat features of Aquatic animals in the National Chambal Sanctuary, Madhya Pradesh, India. Asian J. Exp. Biol. Sci. 2010, 1, 409–414. [Google Scholar]
  49. Upadhyay, R.K. Markers for global climate change and its impact on social, biological and ecological systems: A review. Am. J. Clim. Change. 2020, 9, 159. [Google Scholar] [CrossRef]
  50. Somaweera, R.; Nifong, J.; Rosenblatt, A.; Brien, M.L.; Combrink, X.; Elsey, R.M.; Grigg, G.; Magnusson, W.E.; Mazzotti, F.J.; Pearcy, A.; et al. The ecological importance of crocodylians: Towards evidence-based justification for their conservation. Biol. Reviews. 2020, 95, 936–959. [Google Scholar] [CrossRef] [PubMed]
  51. Wilbanks, T.J.; Fernandez, S. Climate Change and Infrastructure, Urban Systems, and Vulnerabilities: Technical Report for the US Department of Energy in Support of the National Climate Assessment; Island Press: Washington, DC, USA, 2014. [Google Scholar]
  52. Xu, N. Detecting coastline change with all available landsat data over 1986–2015: A case study for the state of Texas, USA. Atmosphere 2018, 9, 107. [Google Scholar] [CrossRef]
  53. Fayaz, M.; Meraj, G.; Khader, S.A.; Farooq, M.; Kanga, S.; Singh, S.K.; Kumar, P.; Sahu, N. Management of Landslides in a Rural–Urban Transition Zone Using Machine Learning Algorithms—A Case Study of a National Highway (NH-44), India, in the Rugged Himalayan Terrains. Land 2022, 11, 884. [Google Scholar] [CrossRef]
  54. Bera, A.; Meraj, G.; Kanga, S.; Farooq, M.; Singh, S.K.; Sahu, N.; Kumar, P. Vulnerability and Risk Assessment to Climate Change in Sagar Island, India. Water 2022, 14, 823. [Google Scholar] [CrossRef]
  55. Kleinhans, M.G.; Cohen, K.M.; Hoekstra, J.; IJmker, J.M. Evolution of a bifurcation in a meandering river with adjustable channel widths, Rhine delta apex, The Netherlands. Earth Surf. Process. Landf. 2011, 36, 2011–2027. [Google Scholar] [CrossRef]
  56. de Musso, N.M.; Capolongo, D.; Caldara, M.; Surian, N.; Pennetta, L. Channel changes and controlling factors over the past 150 years in the Basento river (southern Italy). Water 2020, 12, 307. [Google Scholar] [CrossRef]
  57. Li, H.; Xu, X.; Wu, M.; Liu, Z. Spatiotemporal evolution trajectory of channel morphology and controlling factors of Yongding River, Beijing, China. Water 2021, 13, 1489. [Google Scholar] [CrossRef]
  58. Kafle, L.; Xu, W.J.; Zeng, S.Y.; Nagel, T. A numerical investigation of slope stability influenced by the combined effects of reservoir water level fluctuations and precipitation: A case study of the Bianjiazhai landslide in China. Eng. Geol. 2022, 297, 106508. [Google Scholar] [CrossRef]
  59. Jaboyedoff, M.; Michoud, C.; Derron, M.H.; Voumard, J.; Leibundgut, G.; Sudmeier-Rieux, K.; Nadim, F.; Leroi, E. Human-induced landslides: Toward the analysis of anthropogenic changes of the slope environment. In Landslides and Engineered Slopes. Experience, Theory and Practice; CRC Press: Boca Raton, FL, USA, 2018; pp. 217–232. [Google Scholar]
  60. Tang, H.; Yong, R.; EzEldin, M.A. Stability analysis of stratified rock slopes with spatially variable strength parameters: The case of Qianjiangping landslide. Bull. Eng. Geol. Environ. 2017, 76, 839–853. [Google Scholar] [CrossRef]
  61. Zhang, M.; Dong, Y.; Sun, P. Impact of reservoir impoundment-caused groundwater level changes on regional slope stability: A case study in the Loess Plateau of Western China. Environ. Earth Sci. 2012, 66, 1715–1725. [Google Scholar] [CrossRef]
  62. McGranahan, G.; Balk, D.; Anderson, B. The rising tide: Assessing the risks of climate change and human settlements in low elevation coastal zones. Environ. Urban. 2007, 19, 17–37. [Google Scholar] [CrossRef]
  63. Adger, W.N.; Hughes, T.P.; Folke, C.; Carpenter, S.R.; Rockstrom, J. Social-ecological resilience to coastal disasters. Science 2005, 309, 1036–1039. [Google Scholar] [CrossRef] [PubMed]
  64. Al Masud, M.M.; Gain, A.K.; Azad, A.K. Tidal river management for sustainable agriculture in the Ganges-Brahmaputra delta: Implication for land use policy. Land Use Policy 2020, 92, 104443. [Google Scholar] [CrossRef]
  65. Meraj, G. Assessing the Impacts of Climate Change on Ecosystem Service Provisioning in Kashmir Valley India. Ph.D. Thesis, Suresh Gyan Vihar University, Jaipur, India, 2021. [Google Scholar]
  66. Meraj, G.; Singh, S.K.; Kanga, S.; Islam, M.N. Modeling on comparison of ecosystem services concepts, tools, methods and their ecological-economic implications: A review. Model. Earth Syst. Environ. 2021, 8, 15–34. [Google Scholar] [CrossRef]
  67. Meraj, G.; Farooq, M.; Singh, S.K.; Islam, M.N.; Kanga, S. Modeling the sediment retention and ecosystem provisioning services in the Kashmir valley, India, Western Himalayas. Model. Earth Syst. Environ. 2022, 8, 3859–3884. [Google Scholar] [CrossRef]
Figure 1. Illustration of a sand and gravel streambed and the impact of illegal sand mining. (a) Nick points, where the streambed is abruptly lowered due to pit excavation, can be seen. (b) Downstream from the nick point, the streambed deteriorates when flow rates are high due to the lack of sediment replenishment caused by the mining.
Water 15 01793 g001
Figure 2. Comparison of channel cross-sections. (a) shows a typical sand–gravel bar inside the low-flow channel, while (b) depicts the impact of uncontrolled mining resulting in a large shallow channel with severe bank erosion.
Water 15 01793 g002
Figure 3. Illegal sand mining sites along the Chambal River. (a) Map of India ap providing regional context, (b) illegal sand mining site in Dholpur and Morena regions within the Chambal River, and (c) inset showing stretch of illegal mining sites and unmined site. Map coordinates are UTM WGS 84.
Water 15 01793 g003
Figure 4. Flowchart diagram illustrating the methodology for evaluating erosion and accretion at mining sites. The diagram outlines the steps to analyze the satellite images and geospatial data, including spectral indices and a digital shoreline analysis system (DSAS) to calculate shoreline erosion and accretion rates.
Water 15 01793 g004
Figure 5. NDWI and MNDWI cover a 10 km riverbank buffer for 20 years. Remote sensing indices including the NDWI and MNDWI identify and map open water bodies such as rivers and wetlands and estimate water extent changes over time. (a) NDWI 2000, (b) MNDWI 2000, (c) NDWI 2010, (d) MNDWI 2010, (e) NDWI 2020, and (f) MNDWI 2020.
Water 15 01793 g005
Figure 6. Net shoreline movement profiles of Chambal River showing the changes in shoreline position over time, as calculated by the digital shoreline analysis system (DSAS) model. Panel (a) presents the profiles for Jhiri sand mining zones, panel (b) presents the profiles for Sewarpali sand mining zones, and panel (c) presents the profiles for Chandilpura sand mining zones.
Water 15 01793 g006aWater 15 01793 g006b
Figure 7. Endpoint Rate Profiles of Sand Mining Zones of the Chambal River. This figure presents the endpoint rate profiles of the three sand mining zones, namely (a) Jhiri (b) Sewarpali (c) Chandilpura.
Water 15 01793 g007aWater 15 01793 g007b
Figure 8. Comparative endpoint Rate of all transects of Sand Mining Zones.
Water 15 01793 g008
Figure 9. Comparative erosion and accretion rates at three study sites. This figure presents the estimated erosion and accretion rates for the three study sites as determined by the DSAS model. These estimates suggest notable variations in the study area’s geomorphic processes and sediment dynamics.
Water 15 01793 g009
Figure 10. Endpoint Rate Profile of Unmined Site (Basai Neem).
Water 15 01793 g010
Figure 11. Comparative Erosion and Accretion Rates at Four Study Sites, including Basai Neem (Unmined Site).
Water 15 01793 g011
Table 1. Data sources for the study of riverbank erosion and accretion along the Chambal River.
S. No.DataYear of AcquisitionResolution (Pixel Size) (m)UTM Zone
1Landsat 5 TM19903043R
2Landsat 7 ETM+20003043R
3Landsat 7 ETM+20103043R
4Sentinel-2A/MSI202010–2043R
5NGT Report for non-mining areas
Table 2. Minimum and maximum shoreline distance.
Sand Mining SitesNo. of
Transects
Transect
Spacing (m)
Minimum (m)Maximum
(m)
Jhiri445010.86130.27
Sewarpali405022.4567.68
Chandilpura415015.4296.68
Table 3. Percentage of net shoreline movement.
Sand Mining SitesNo. of
Transects
Transect
Spacing (m)
Percentage of All Transects
(Negative Distance)
Percentage of All Transects (Positive Distance)
Jhiri445097.73%2.27%
Sewarpali405097.44%2.56%
Chandilpura415064.1%2.56%
Disclaimer/Publisher’s Note: The statements, opinions and data contained in all publications are solely those of the individual author(s) and contributor(s) and not of MDPI and/or the editor(s). MDPI and/or the editor(s) disclaim responsibility for any injury to people or property resulting from any ideas, methods, instructions or products referred to in the content.

