Abstract
Soil salinization is a serious resource and ecological problem globally. The Weigan River–Kuqa River Delta Oasis is a key region in the arid and semi-arid regions of China with prominent soil salinization. The saline soils in the oasis are widely distributed over a large area, causing great harm to agricultural development and the environment. Remote sensing monitoring can provide a reference method for the management of regional salinization. We extracted the spectral indices and performed a correlation analysis using soil measurement data and Sentinel-2 remote sensing data. Then, two-dimensional feature space inversion models for soil salinity were constructed based on the preferred spectral indices, namely, the canopy response salinity index (CRSI), composite spectral response index (COSRI), normalized difference water index (NDWI), and green atmospherically resistant vegetation index (GARI). The soil salinity in a typical saline zone in the Weigan River–Kuqa River Delta Oasis was monitored and analyzed. We found that the inversion of the CRSI-COSRI model was optimal (R2 of 0.669), followed by the CRSI-NDWI (0.656) and CRSI-GARI (0.604) models. Therefore, a model based on the CRSI-COSRI feature space can effectively extract the soil salinization information for the study area. This is of great significance to understanding the salinization situation in the Weigan River–Kuqa River Delta Oasis, enriching salinization remote sensing monitoring methods, and solving the soil salinization problem in China.
1. Introduction
Today, soil salinization is a widespread soil degradation and land desertification phenomenon [1]. It is a negative result of the movement of soil salts caused by a combination of natural conditions such as different surface morphologies, climatic conditions, and hydrological factors [2,3]. It is also a global resource problem caused by a combination of irrational human activities that do not take into account the laws of nature and the increasingly fragile ecological environment [4,5]. Saline soils are widely distributed in China, especially in the arid and semi-arid provinces in northwestern China such as Gansu, Ningxia, and Xinjiang [6], where salinization is serious due to the influences of human and natural factors. This substantially restricts the development of the agricultural industry, the sustainable use of land resources, and the security and stability of the environment [7,8]. Therefore, the monitoring inversion of accurate salinization information and mastering the salinity of regional arable farmland are important goals that scholars have tried to support through research.
Accurate and rapid information on the soil salt distribution is an important prerequisite for achieving the goal of managing and utilizing saline soils on a large scale [9,10]. With the continuous innovation in remote sensing techniques and the improvement in the spectral and spatial resolution of remote sensing images, efficient, convenient, and multi-dimensional methods for monitoring salinity information have been developed [11]. Researchers have gradually found that the data carried by different remote sensing images can be used to identify, classify, and extract the salinization information for a more accurate quantitative inversion monitoring of parameters related to soil salinity in different regions [12]. As the research means of the inversion analysis of soil salinization based on remote sensing image data is gradually becoming common, it has become an important method for research on qualitative and quantitative soil salinization, dynamic analysis, information extraction, monitoring, and forecasting [13,14]. A remote sensing monitoring model was constructed with the aim of determining the correlations between the measured soil salt content and multiple remote sensing modeling factors [15]. Based on the research and analysis of many scholars in China and abroad, it has been found that the spectral feature space modeling method can be applied to construct a remote sensing soil salinity monitoring model [16,17,18]. Frontier research results have confirmed that the characteristic spatial models constructed based on remotely sensed parameters have a significant correlation with the soil salinity data. The construction of different combinations of eigenspace inversion models with different dimensions using quantitative indicators from different data sources is gradually becoming a mainstream tool for soil salinity monitoring [19]. For example, Jianli Ding et al. [20] extracted the modified soil adjusted vegetation index and moisture index from remote sensing images and constructed a two-dimensional feature space based on them. Their results showed that this two-dimensional feature space was well-correlated to the surface soil salinity in an oasis in an arid zone. Bing Guo et al. used the synergistic relationship between soil and vegetation to construct a two-dimensional feature space model and found that the model has the potential to monitor soil salinization in the Yellow River Delta region [21]. Juan Feng et al. [22] used the relationships between various factors such as the surface albedo to construct a feature space. Their results showed that this monitoring model based on surface albedo and the soil adjusted vegetation index could analyze the degree of soil salinization in their study area accurately and efficiently. Lingling Bian et al. [23] quantitatively explored the relationships between the soil salinity and several surface parameters in the Yellow River Delta region. Their results showed that this feature space model, constructed based on the salinity index and surface albedo, had a strong predictive ability and provided a favorable reference for the inversion of soil salinization in China’s seaside areas. It can be seen that the inversion results obtained by constructing monitoring models with different uses for study areas with different geographical features were significantly different [1,2]. It has become a hot topic in the field to calculate and select the spectral parameters of remote sensing images with high correlations to the soil salinity in a study area and to construct a specific feature space model based on them [24,25,26], in order to further improve the accuracy and efficiency of the inversion of the saline soils.
Therefore, with the objective of the monitoring and inversion of regional soil salinization, in this study, a typical saline zone in the Weigan River–Kuqa River Delta Oasis in Xinjiang was taken as the study area. Based on field soil data and Sentinel-2 remote sensing image data, we calculated and selected the optimal spectral index and then constructed a variety of different combinations of soil salinity two-dimensional feature spaces, quantified and analyzed the feature space scatter plot, constructed a soil salinity inversion model, and analyzed the spatial distribution of the soil salinity in the study area. We then conducted remote sensing monitoring of the soil salinity in a typical saline zone in the Weigan River–Kuqa River Delta Oasis. This is of great practical importance to further master advanced remote sensing technology monitoring methods, effectively manage and utilize land resources, and optimally promote the sustainable development of the oasis region.
2. Materials and Methods
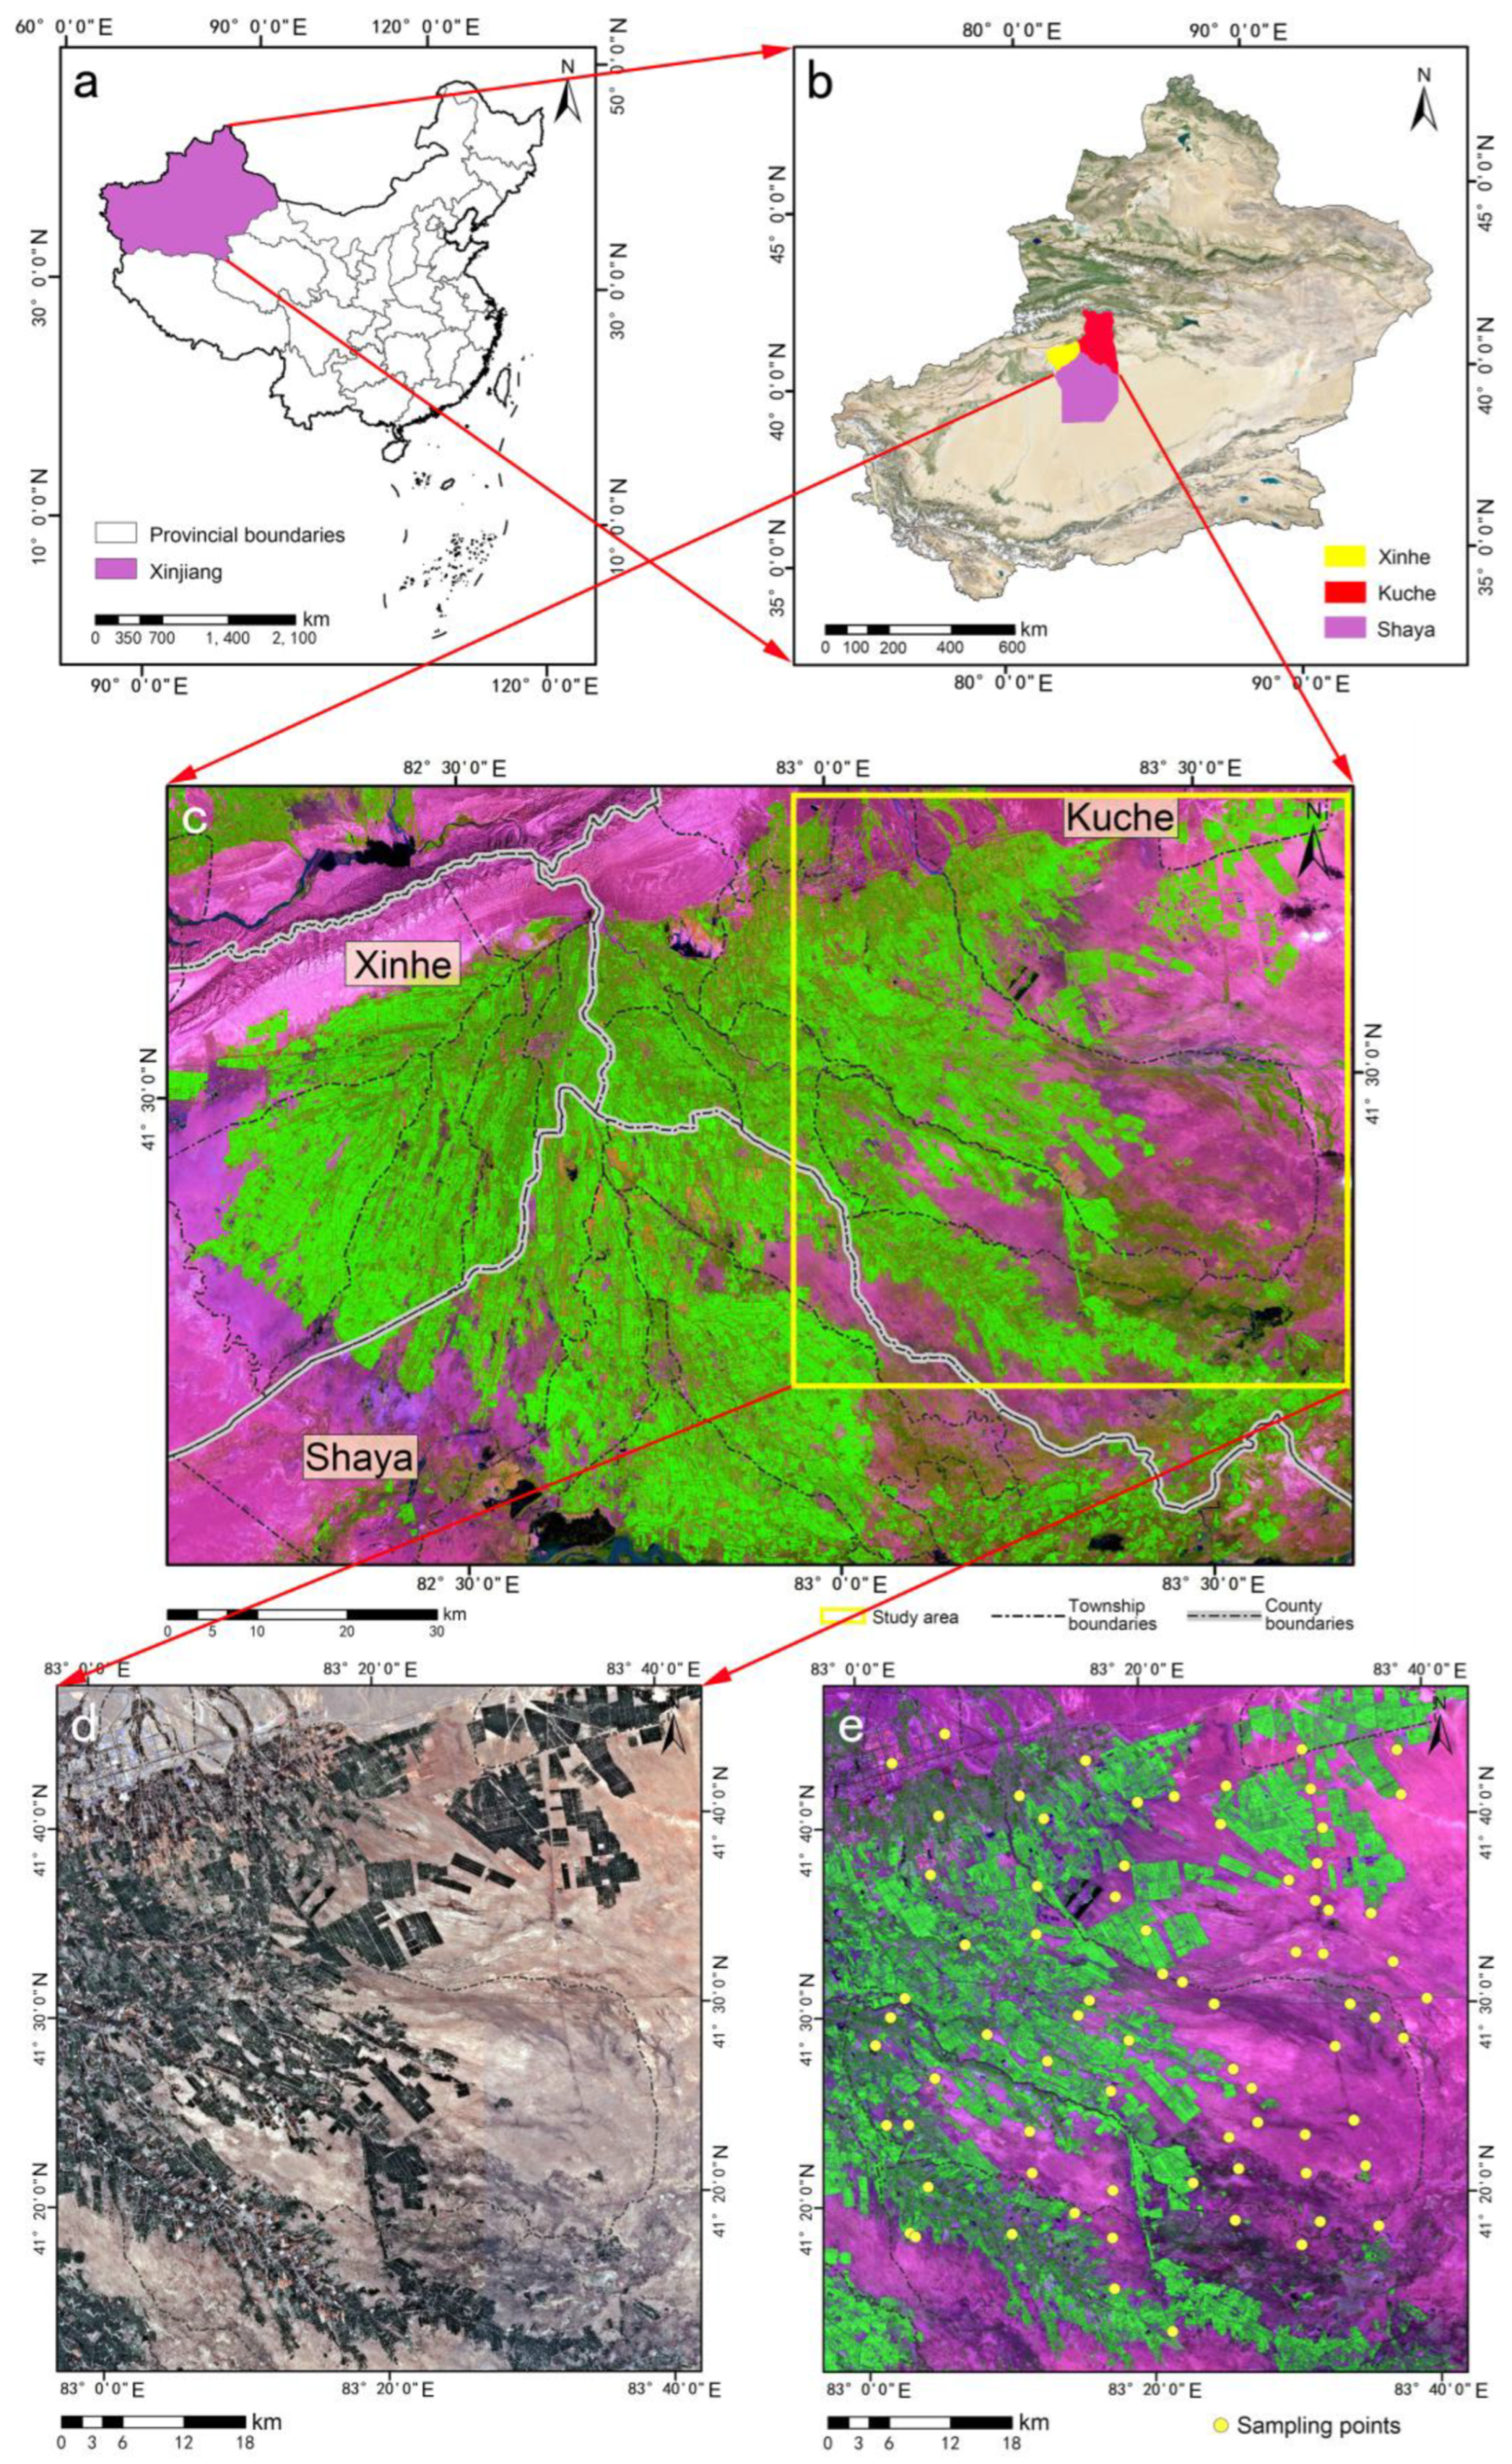
2.1. Study Area
The Weigan River–Kuqa River Delta Oasis is located in the Xinjiang Uygur Autonomous Region, China, covering the Xinhe, Kuche, and Shaya Counties. It is located in the southern part of the middle Tianshan Mountains and on the northern edge of the Tarim Basin in southern Xinjiang (Figure 1) and is a representative of typical oases in arid regions [20]. The study area in this typical saline zone is mainly located in Kuche County, where the climate is dry, precipitation is scarce and unevenly distributed, and the evaporation is much greater than the precipitation [27]. The salts in the groundwater and deep soil rise to the surface along soil capillaries under strong evaporation and accumulate, causing regional salinization of the soils. In addition, the lack of effective engineered drainage facilities inside the oasis has made it difficult to reasonably circulate the soil salinity inside the oasis, thus causing increased salinization and seriously affecting the development of oasis agriculture in the region.
Figure 1.
(a) Location of the study area in China. (b) Location of the study area in Xinjiang. (c) Sentinel-2 image of the Weigan–Kuqa River Delta Oasis. (d) Topographic map of the study area. (e) Distribution of the sampling sites in the study area.
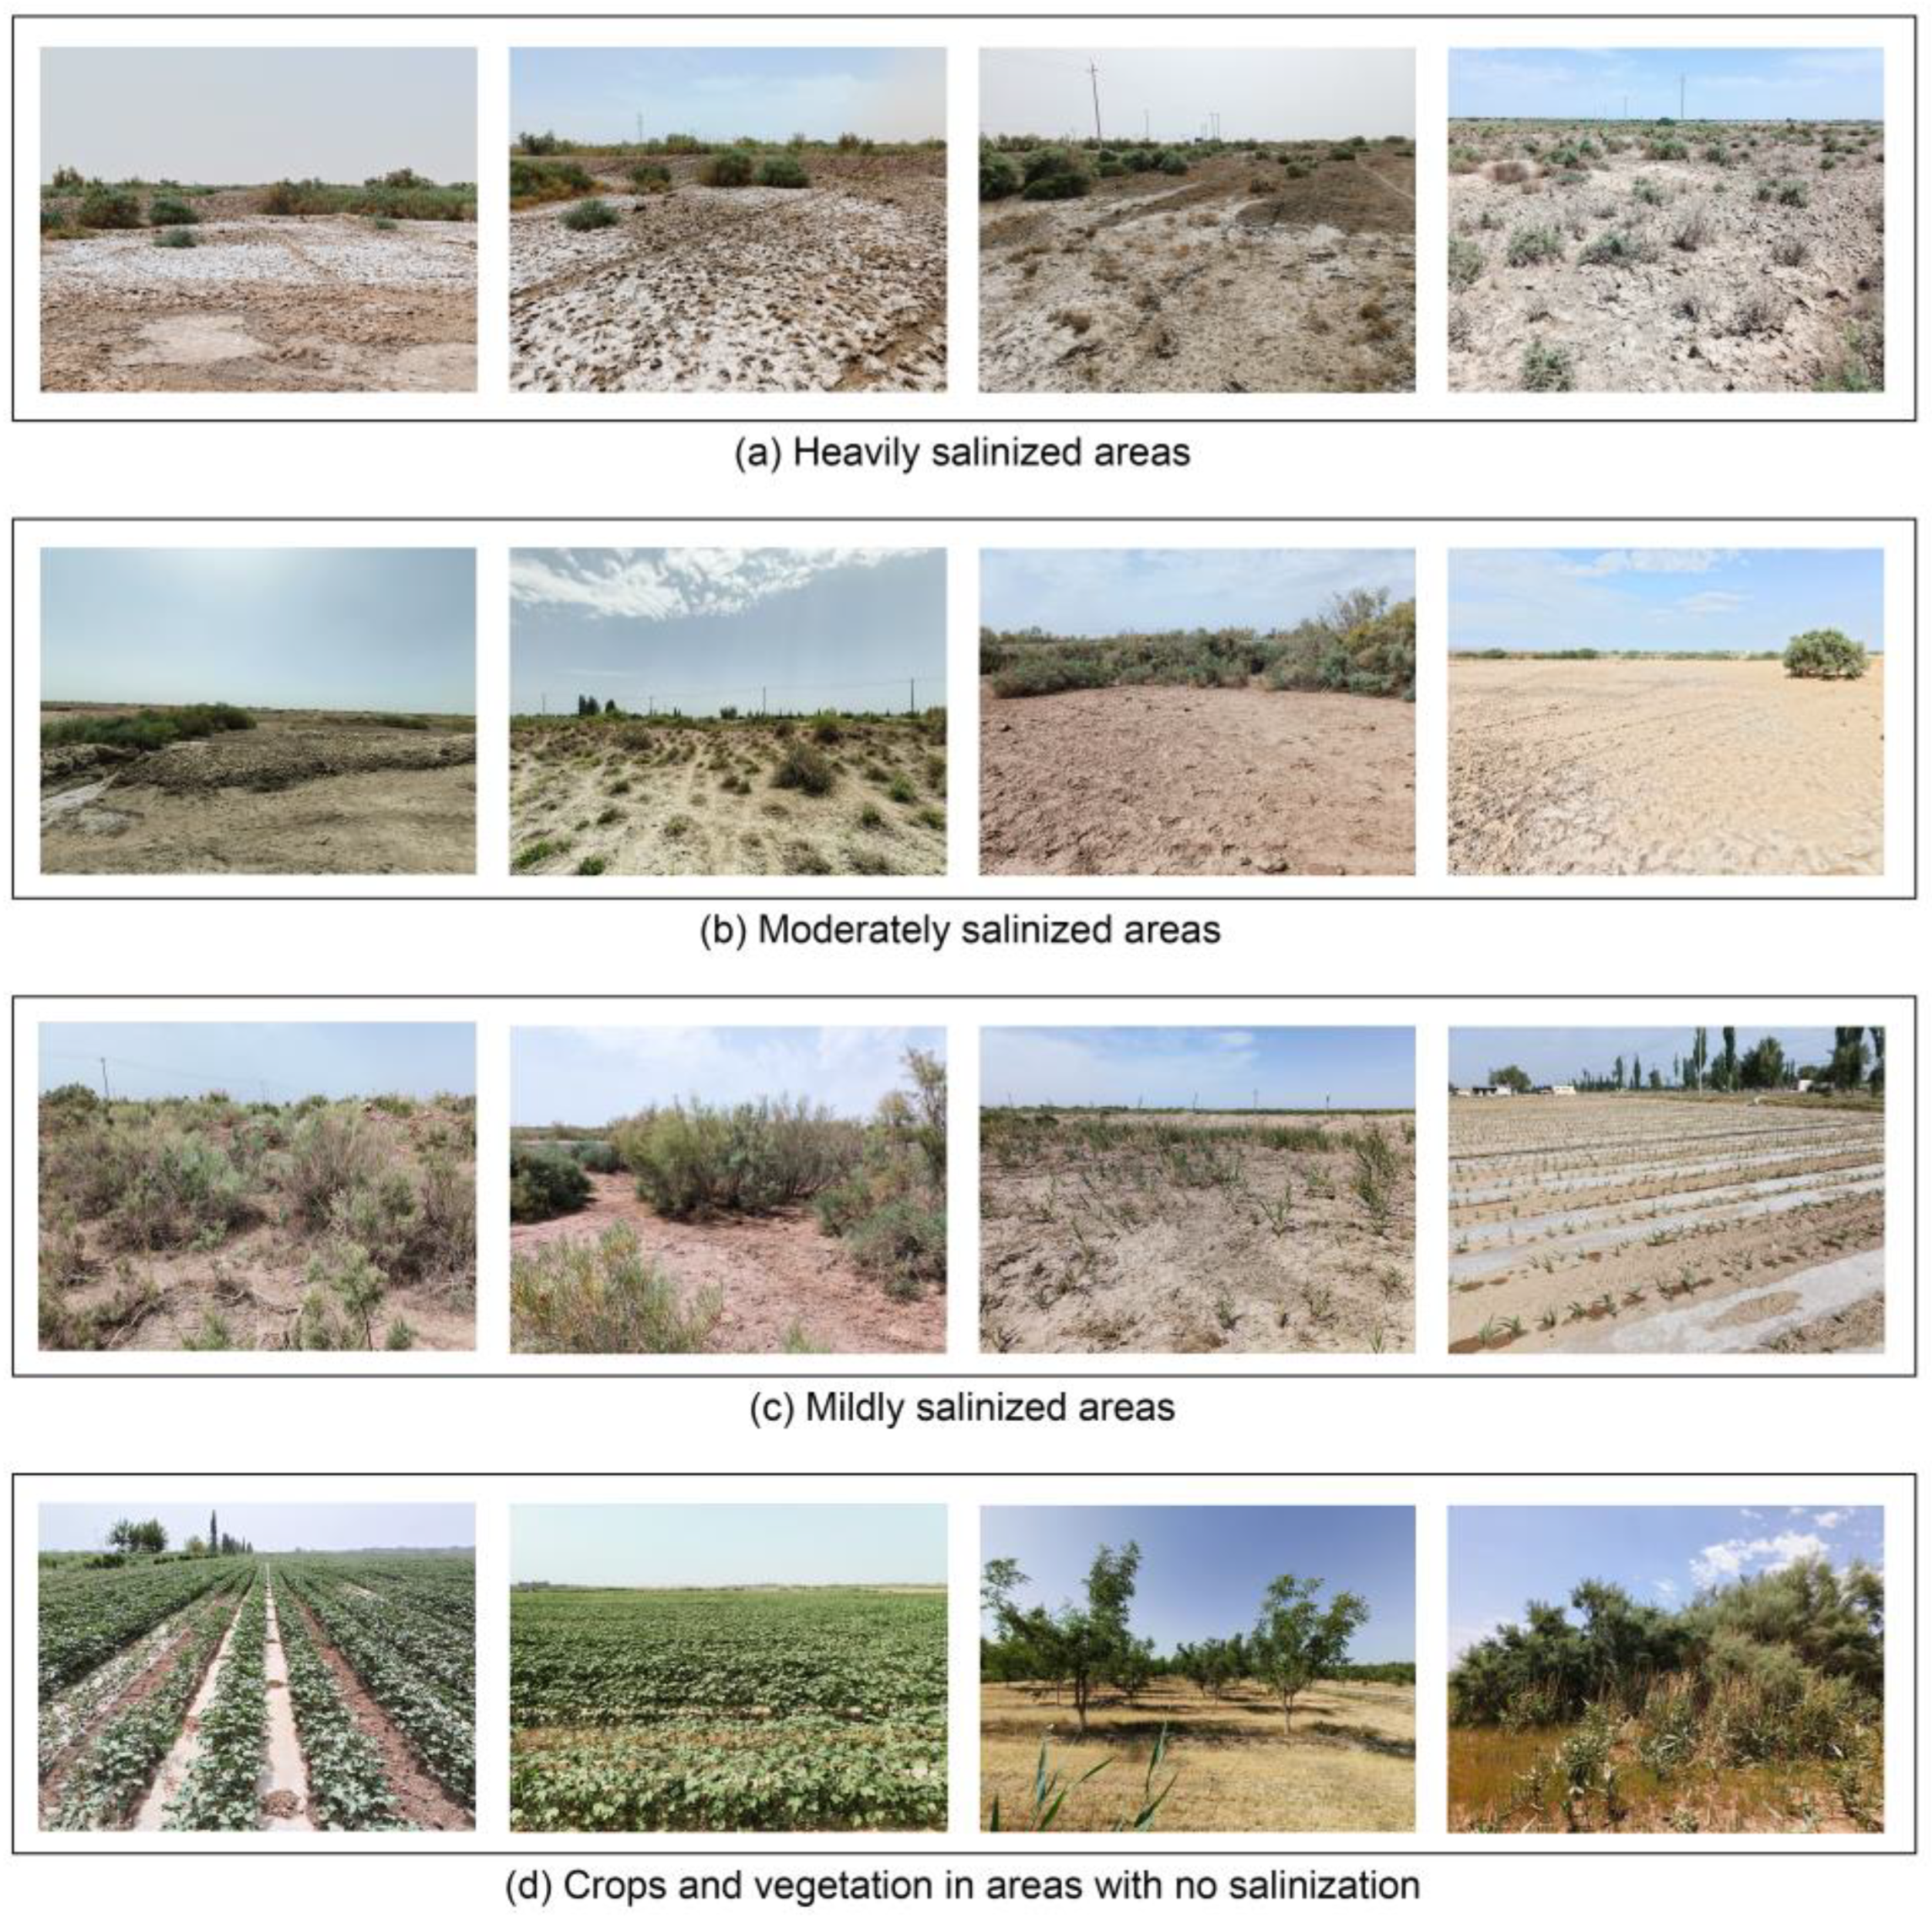
2.2. Soil Data Collection and Processing
In this study, we conducted surface soil sampling and an environmental investigation in the typical saline area in the Weigan River–Kuqa River Delta Oasis in July 2022. During the sampling process, the soil sampling points were evenly distributed throughout the study area and were distributed in the periphery of the oasis, the oasis–desert interlacing zone, and the inner area of the oasis, covering different vegetation cover types, land use types, and soil types, with a total of 78 soil sampling points. During the expedition, based on the team’s previous experience and results on the soil salinity content in the study area, several representative areas were visited. The salinized soils of the study area with different degrees of salinity were photographed and recorded (Figure 2). After the sample collection, the samples were placed in aluminum boxes and sampling bags were marked with corresponding numbers. The specific coordinates of the sampling points, land use patterns, soil salinity, vegetation types, and cover were recorded in detail to facilitate subsequent analysis. Finally, the collected soil samples were transported to the laboratory for air-drying, grinding, removing impurities, and sieving to determine the soil salinity data required for the study.
Figure 2.
Soil types with different degrees of salinization in the study area.
2.3. Remote Sensing Image Acquisition and Pre-Processing
Sentinel-2 optical images with a spatial resolution of 10 m were selected as the remote sensing data source for this study. The Sentinel-2 image data for the Weigan River–Kuqa River Delta Oasis were obtained from the official website. The images were chosen to completely cover all of the sampling points, and 5 July 2022 was chosen as the imaging time for correspondence with the acquisition of the field data. The weather in the study area during this period was clear, with few clouds and rain, dry ground, and sparse vegetation growth, which made the remote sensing images more effective and facilitated the inversion of the ground soil salinity. The acquired images were pre-processed using remote sensing information processing software such as SNAP, ENVI, and ArcGIS to lay the foundation for the subsequent inversion and application.
2.4. Spectral Index Calculation and Normalization
The pre-processed remote sensing image data were rich in spectral information about the various features, which was contained in the reflectance of the different wavelength bands in the remote sensing data [28,29]. Since the spectral information contained in a single band is very limited, after extracting the spectral reflectance data from each band of a remote sensing image, a combination operation can be performed between the different bands to obtain more and richer information [30,31,32,33]. Since salinized soils have stronger spectral reflectance in the near-infrared band and visible band than other types of soils, multiple salinity indices composed of reflectance information in different wavelength bands based on remote sensing data can directly monitor different levels of soil salinity [34]. In addition, some researchers have found that vegetation indices can also be used as indirect parameters to discriminate saline soils by expressing different vegetation species and their coverage [35]. At the same time, soil salinity changes have a great relationship with the water circulation process as salt moves with water, and soil salinity is prone to shift with water changes. Therefore, water indices can also be one of the most indirect parameters to participate in the monitoring of soil salinity [9]. The canopy response salinity index (CRSI), normalized difference water index (NDWI), and soil adjusted vegetation index (SAVI) were selected from the 22 commonly used soil salinity-related spectral indices (Table 1). The reflectance of the different wavelength ranges in the multispectral data from the Sentinel-2 remote sensing images corresponding to each sampling point was extracted using ArcGIS, and the spectral indices in the study area were calculated and analyzed using the formulas in the ENVI software. Finally, a series of spectral indices were calculated and correlated with the measured soil salt content to obtain the optimal spectral indices with a high correlation to the measured soil salt content for use in the subsequent modeling.
Table 1.
Spectral indices and calculation formulas.
In order to eliminate the effect of the differences in the magnitude and units of the data for the different variables, the maximum and minimum values of the spectral indices for the study area were obtained, the data were standardized [51,52], and the original values were mapped to the interval (0, 1) via standardization. The formula is as follows:
where Result is the normalized value; DN is the original image element value; DNmin and DNmax are the minimum and maximum values of the band, respectively.
2.5. Two-Dimensional Feature Space Inversion Models
Based on the results of many researchers in China and abroad in recent years, it was found that a two-dimensional feature space method that uses different soil parameters to form various combinations can be effectively applied to construct a remote sensing soil monitoring model [53,54,55] that provides a good reference for the monitoring of soil salinization. In this study, we analyzed the shape, distribution characteristics, and correlation of the feature space scatter plot based on practical experience to determine the mutual variation trends between the different covariates. The distance from any point in the two-dimensional feature space of the soil salinity covariates to a certain feature reference point was used to reflect the different levels of soil salinity.
The distribution pattern of the soil salinity was obtained through a statistical combination of the faceted information so that the corresponding two-dimensional feature space inversion model could be established using the spatial feature covariates of the scatter plot [56,57]. Based on this, the degree and distribution of the salinization of the soils in the study area were characterized. The above eigenspace inversion model was combined with the measured soil salinity for accuracy verification and comparison, and the determination coefficient R2 was used to reflect the model accuracy. The closer R2 is to 1, the higher and more stable the fitting effect of the model. R2 is mathematically defined as follows [58]:
where is the measured value; is the mean sample value; is the predicted value; i = 1, 2, …, n. Finally, the optimal feature space model was selected according to the accuracy verification results for the inverse analysis of the spatial distribution of the soil salinity in the study area.
3. Results
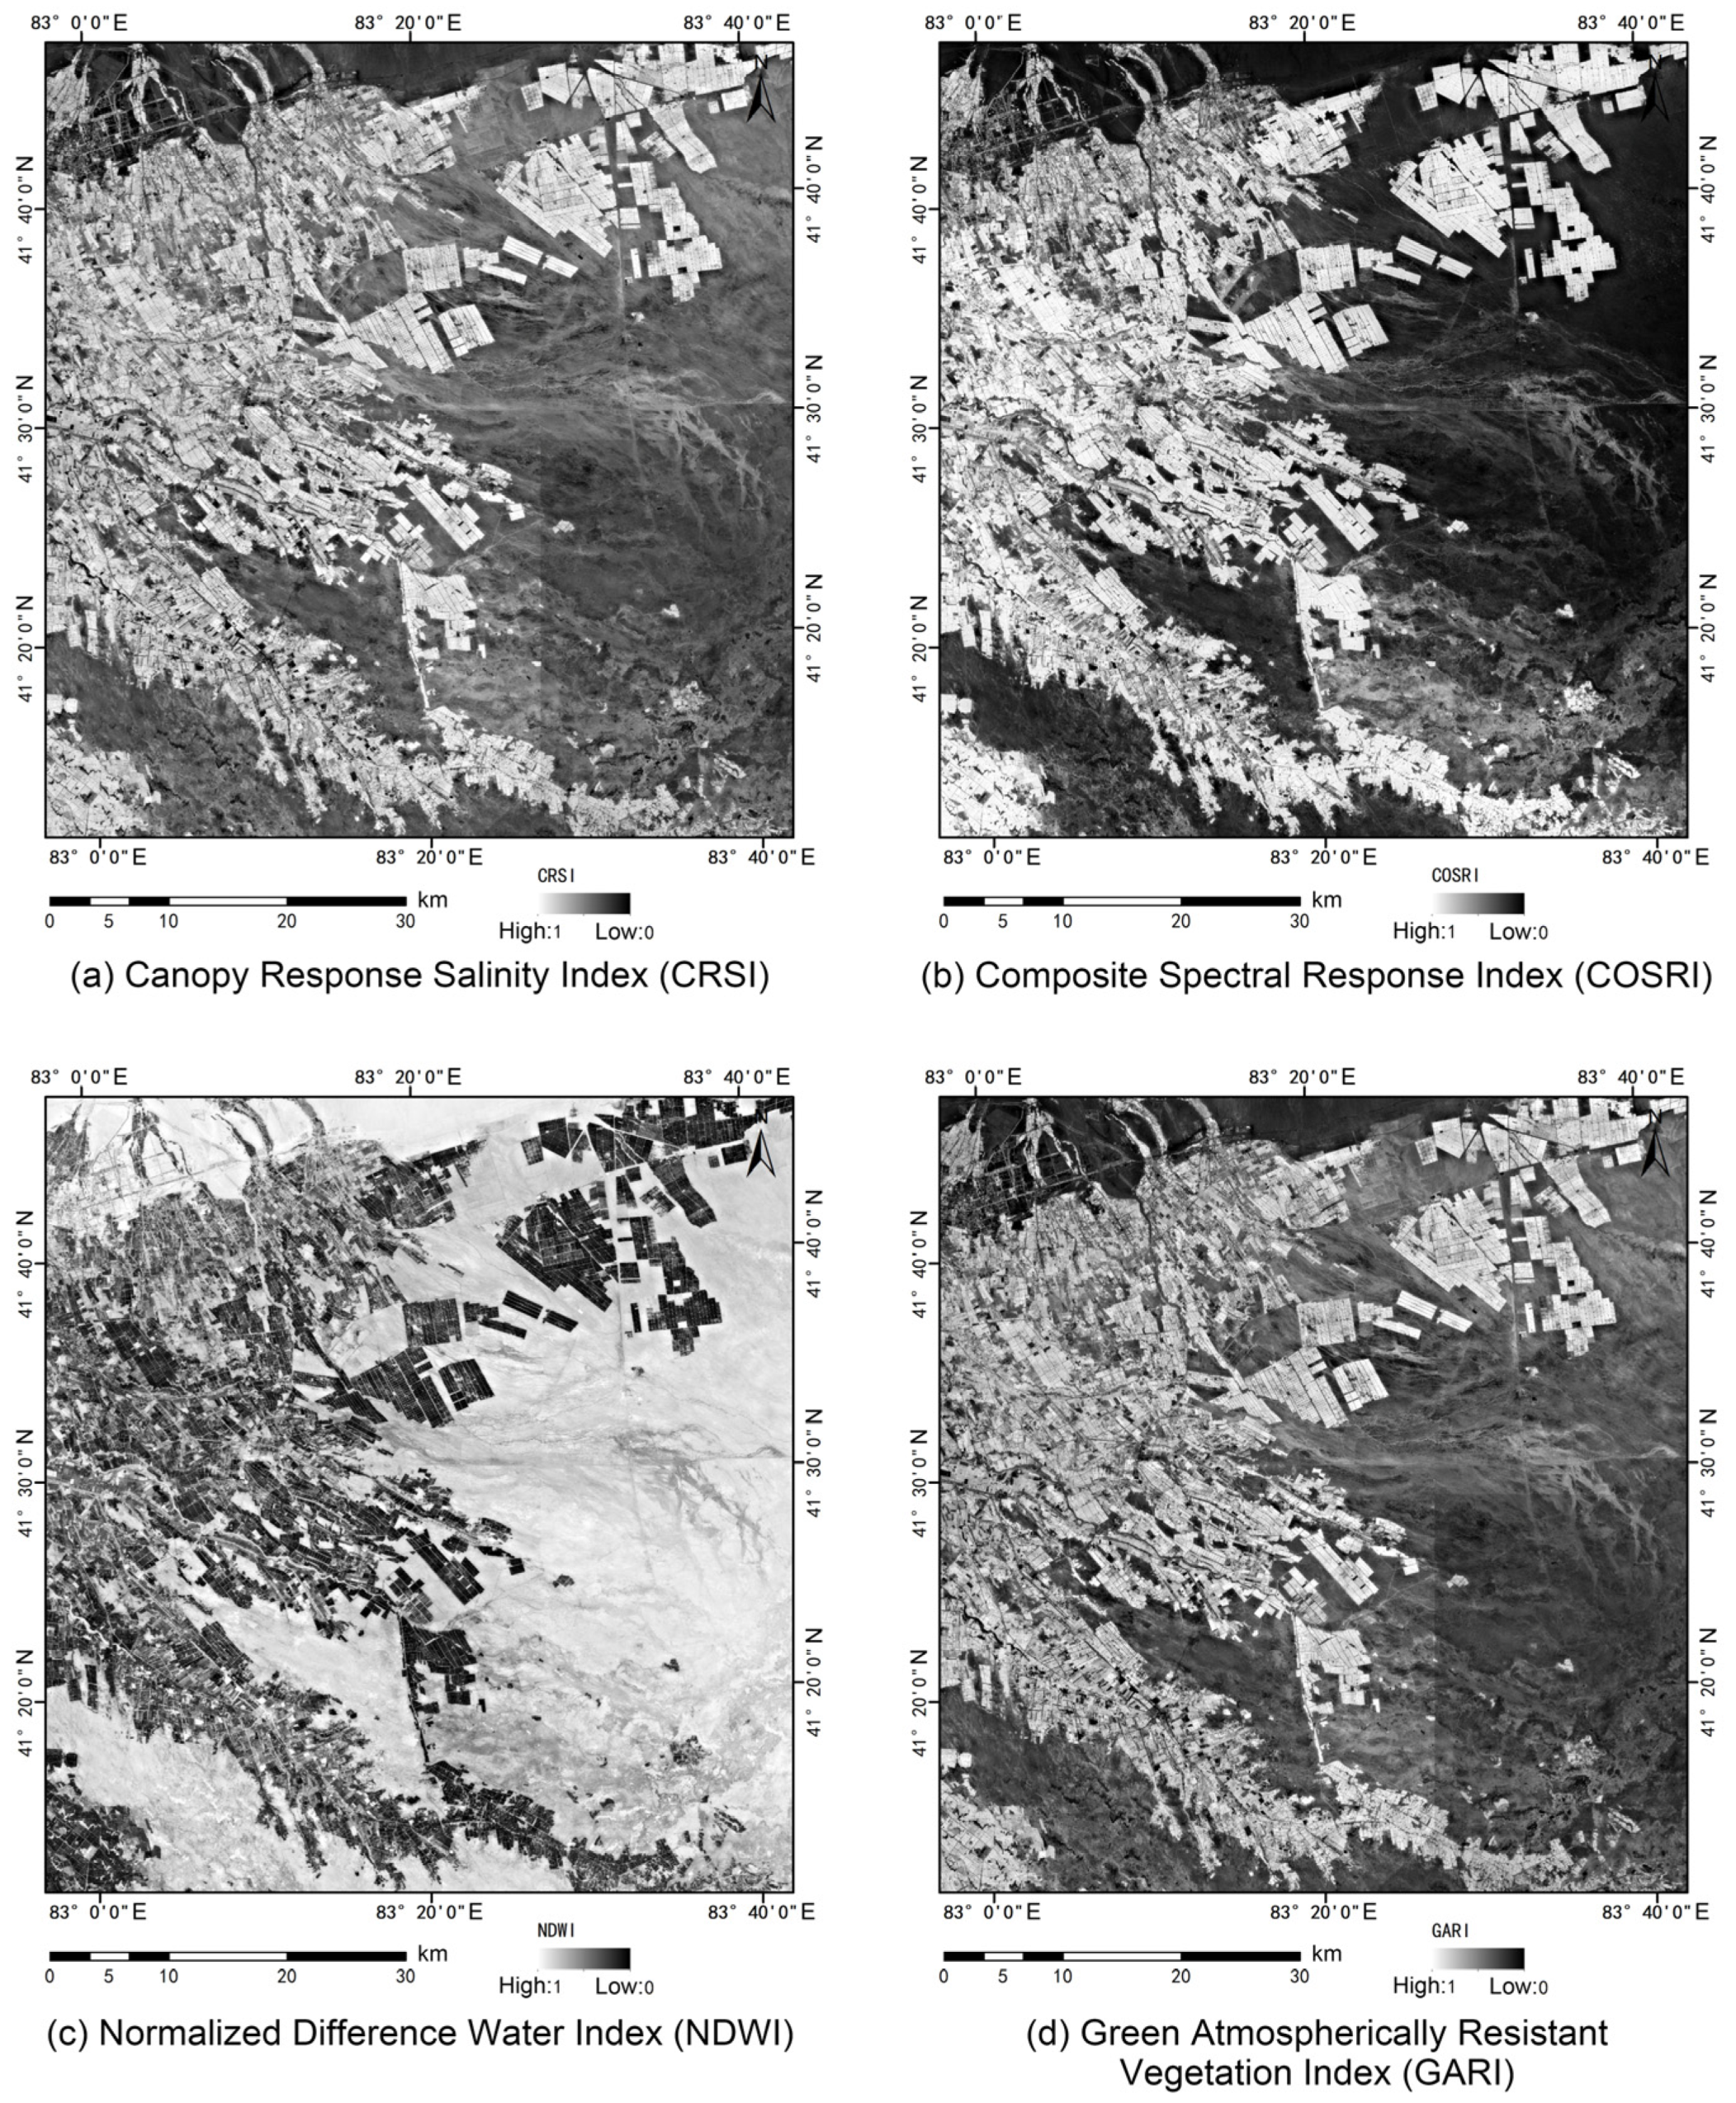
3.1. Spectral Index Analysis and Data Normalization
Correlation analysis between the above 22 spectral indices and the measured soil salinity was performed to obtain a table of the correlation coefficients between the spectral indices and soil salinity (Table 2). The analysis revealed that among the spectral indices, the CRSI, composite spectral response index (COSRI), NDWI, and green atmospherically resistant vegetation index (GARI) had the highest correlations with the soil salinity in the study area, with R2 values of −0.622, −0.612, 0.609, and −0.605, respectively. Among them, the CRSI had the highest correlation and was the salt index directly related to the study target, so it was combined with the other three indices separately as the modeling factors in the construction of the inversion model when constructing the two-dimensional feature space, and the four preferred spectral indices were normalized (Figure 3).
Table 2.
Correlations between the spectral indices and soil salinity.
Figure 3.
Preferred spectral index normalization results.
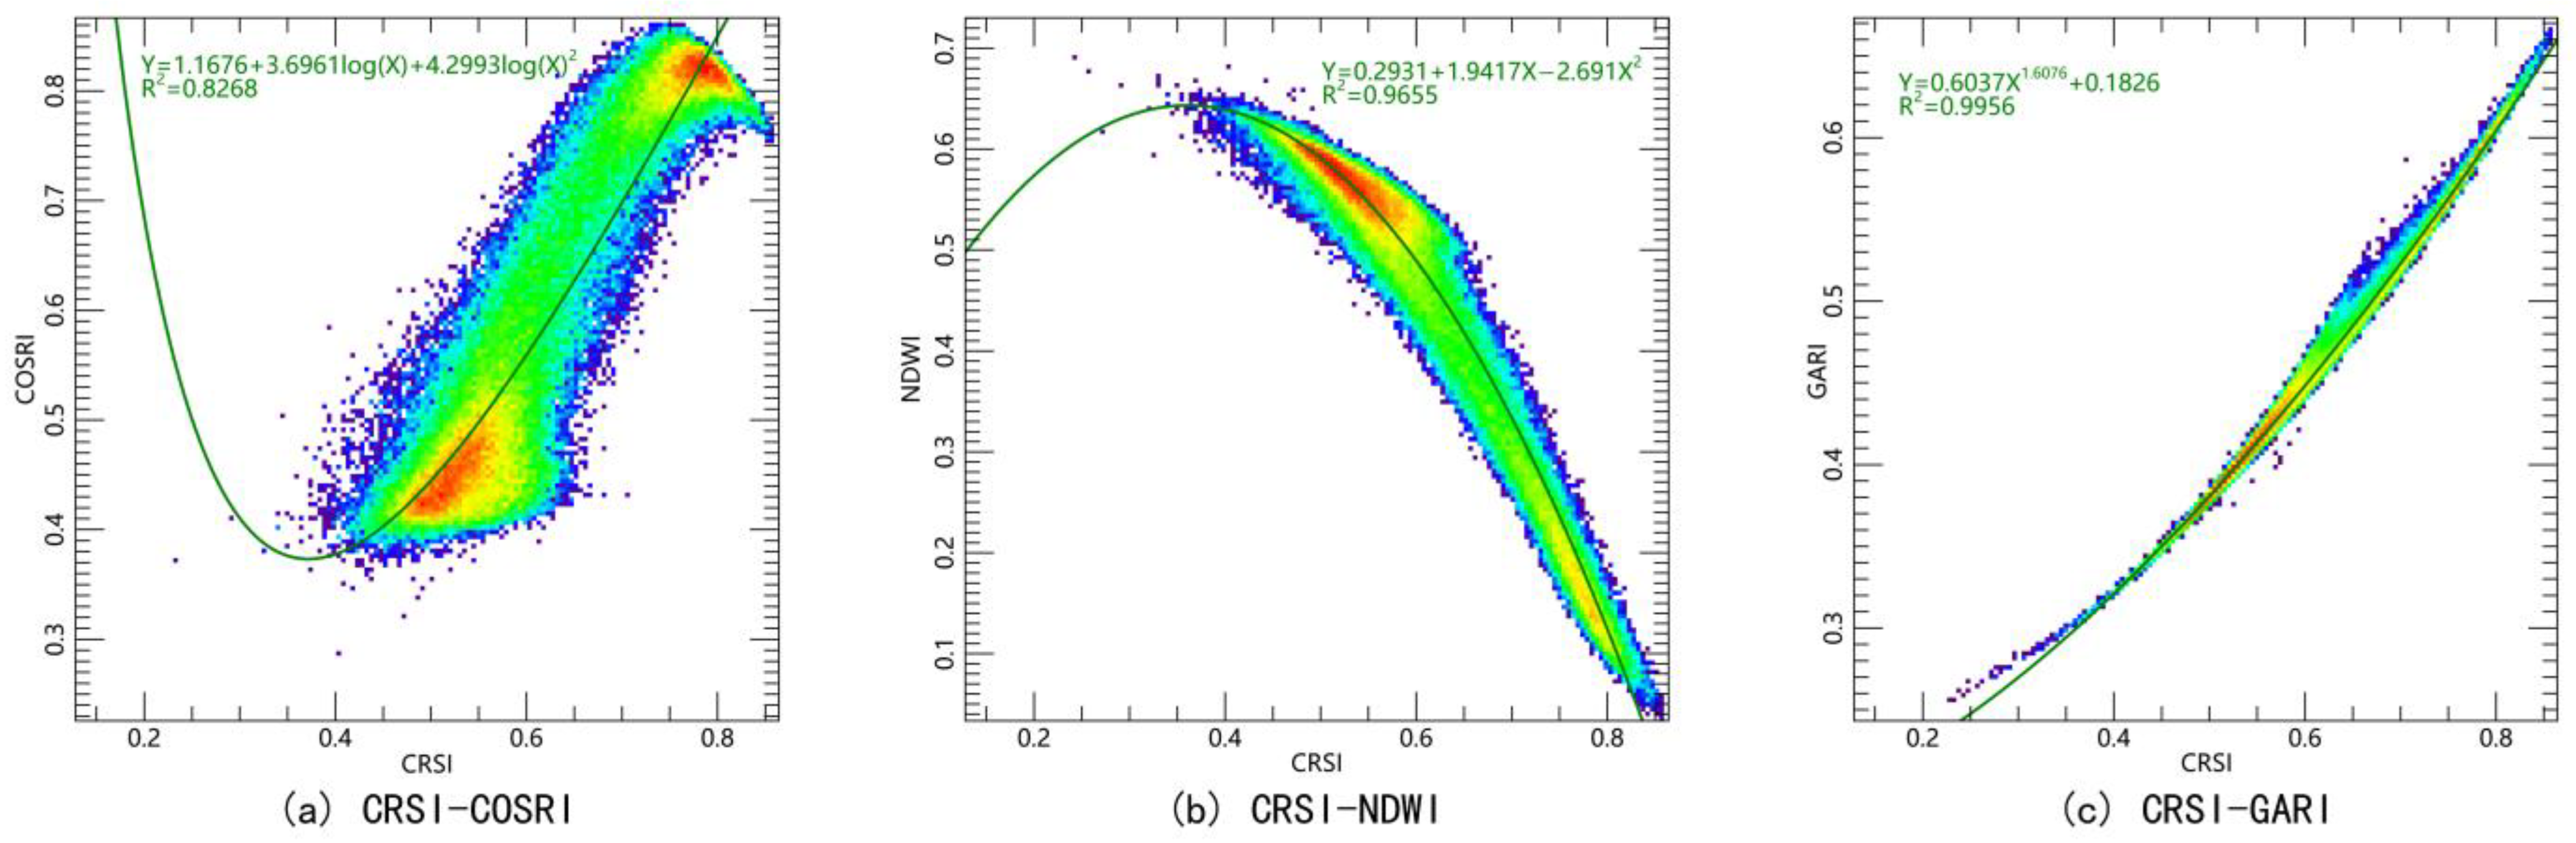
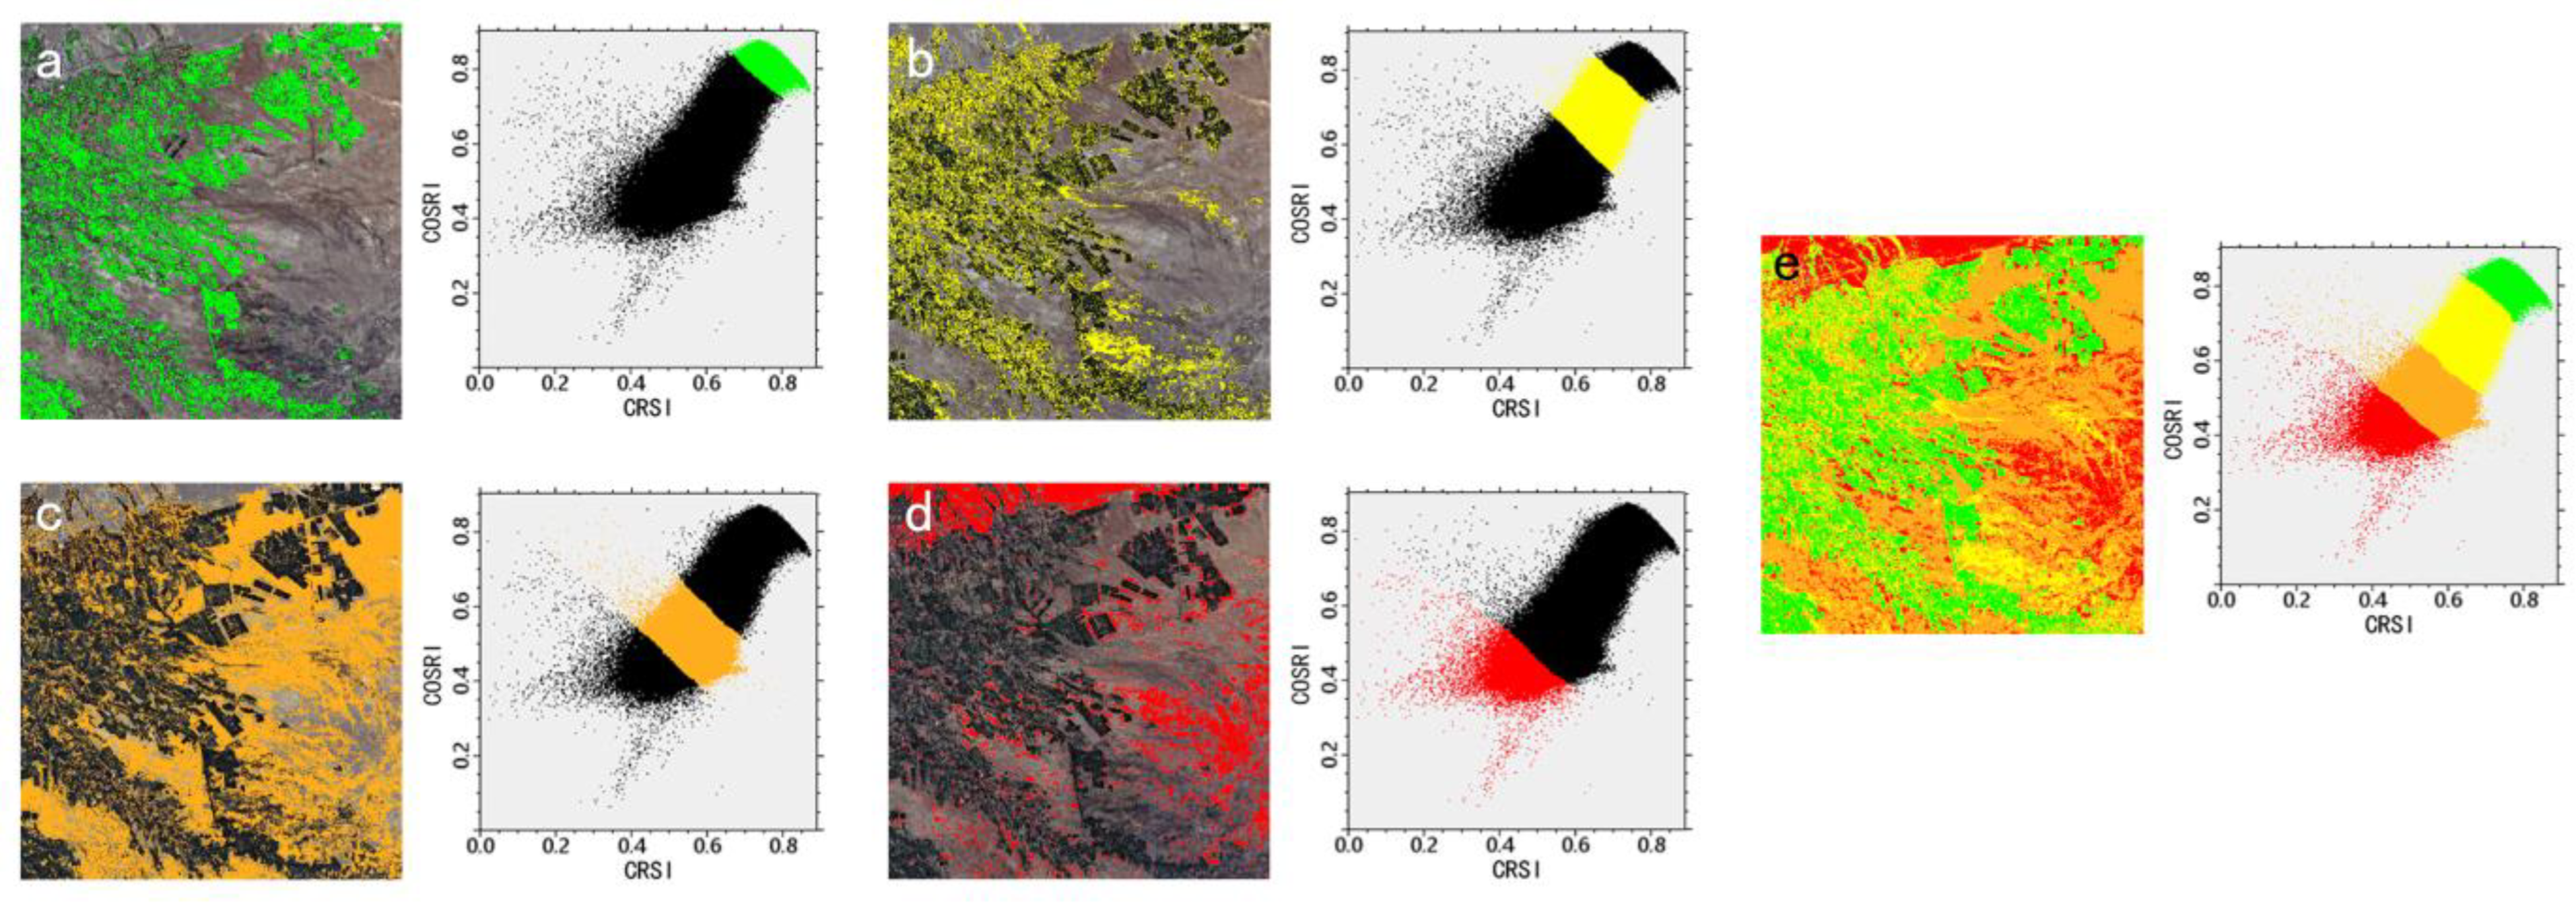
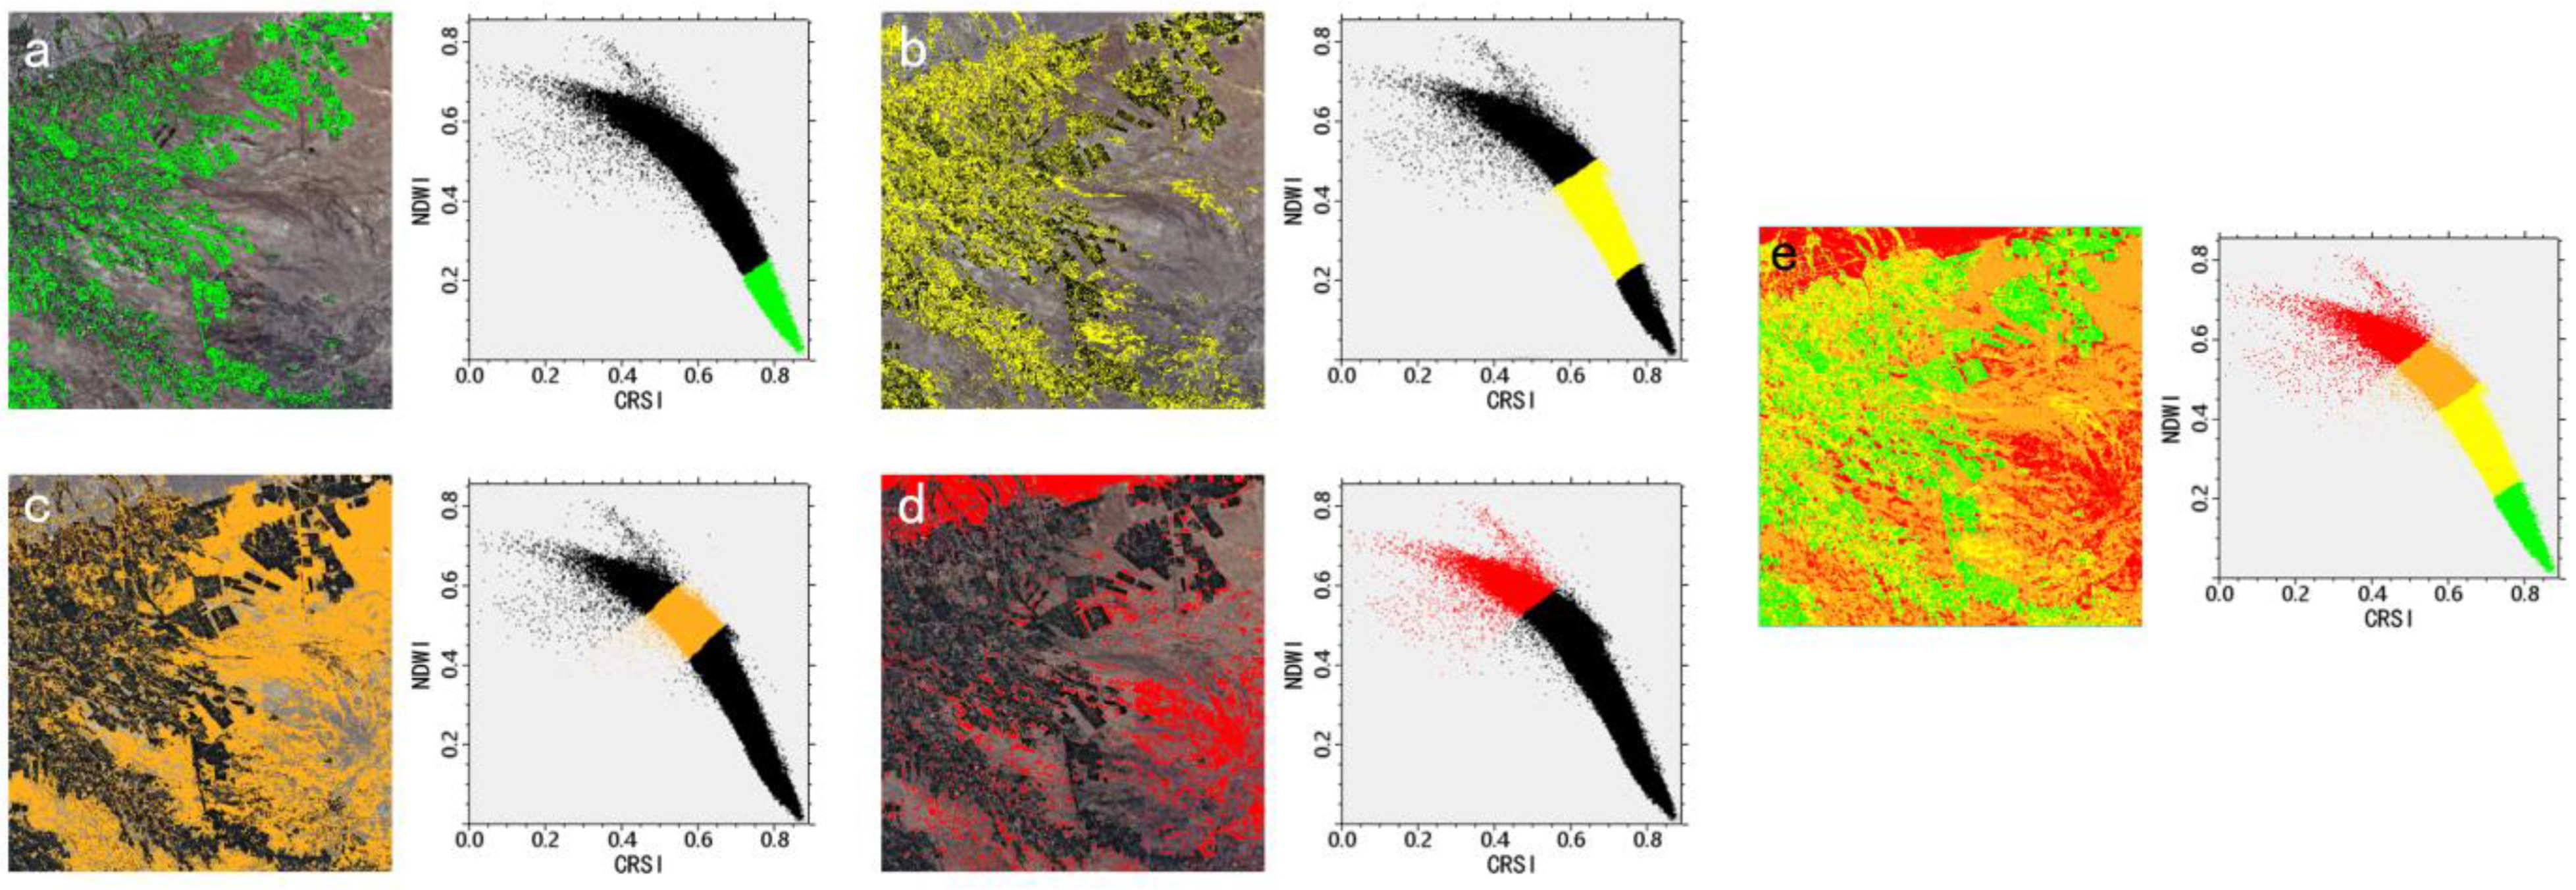
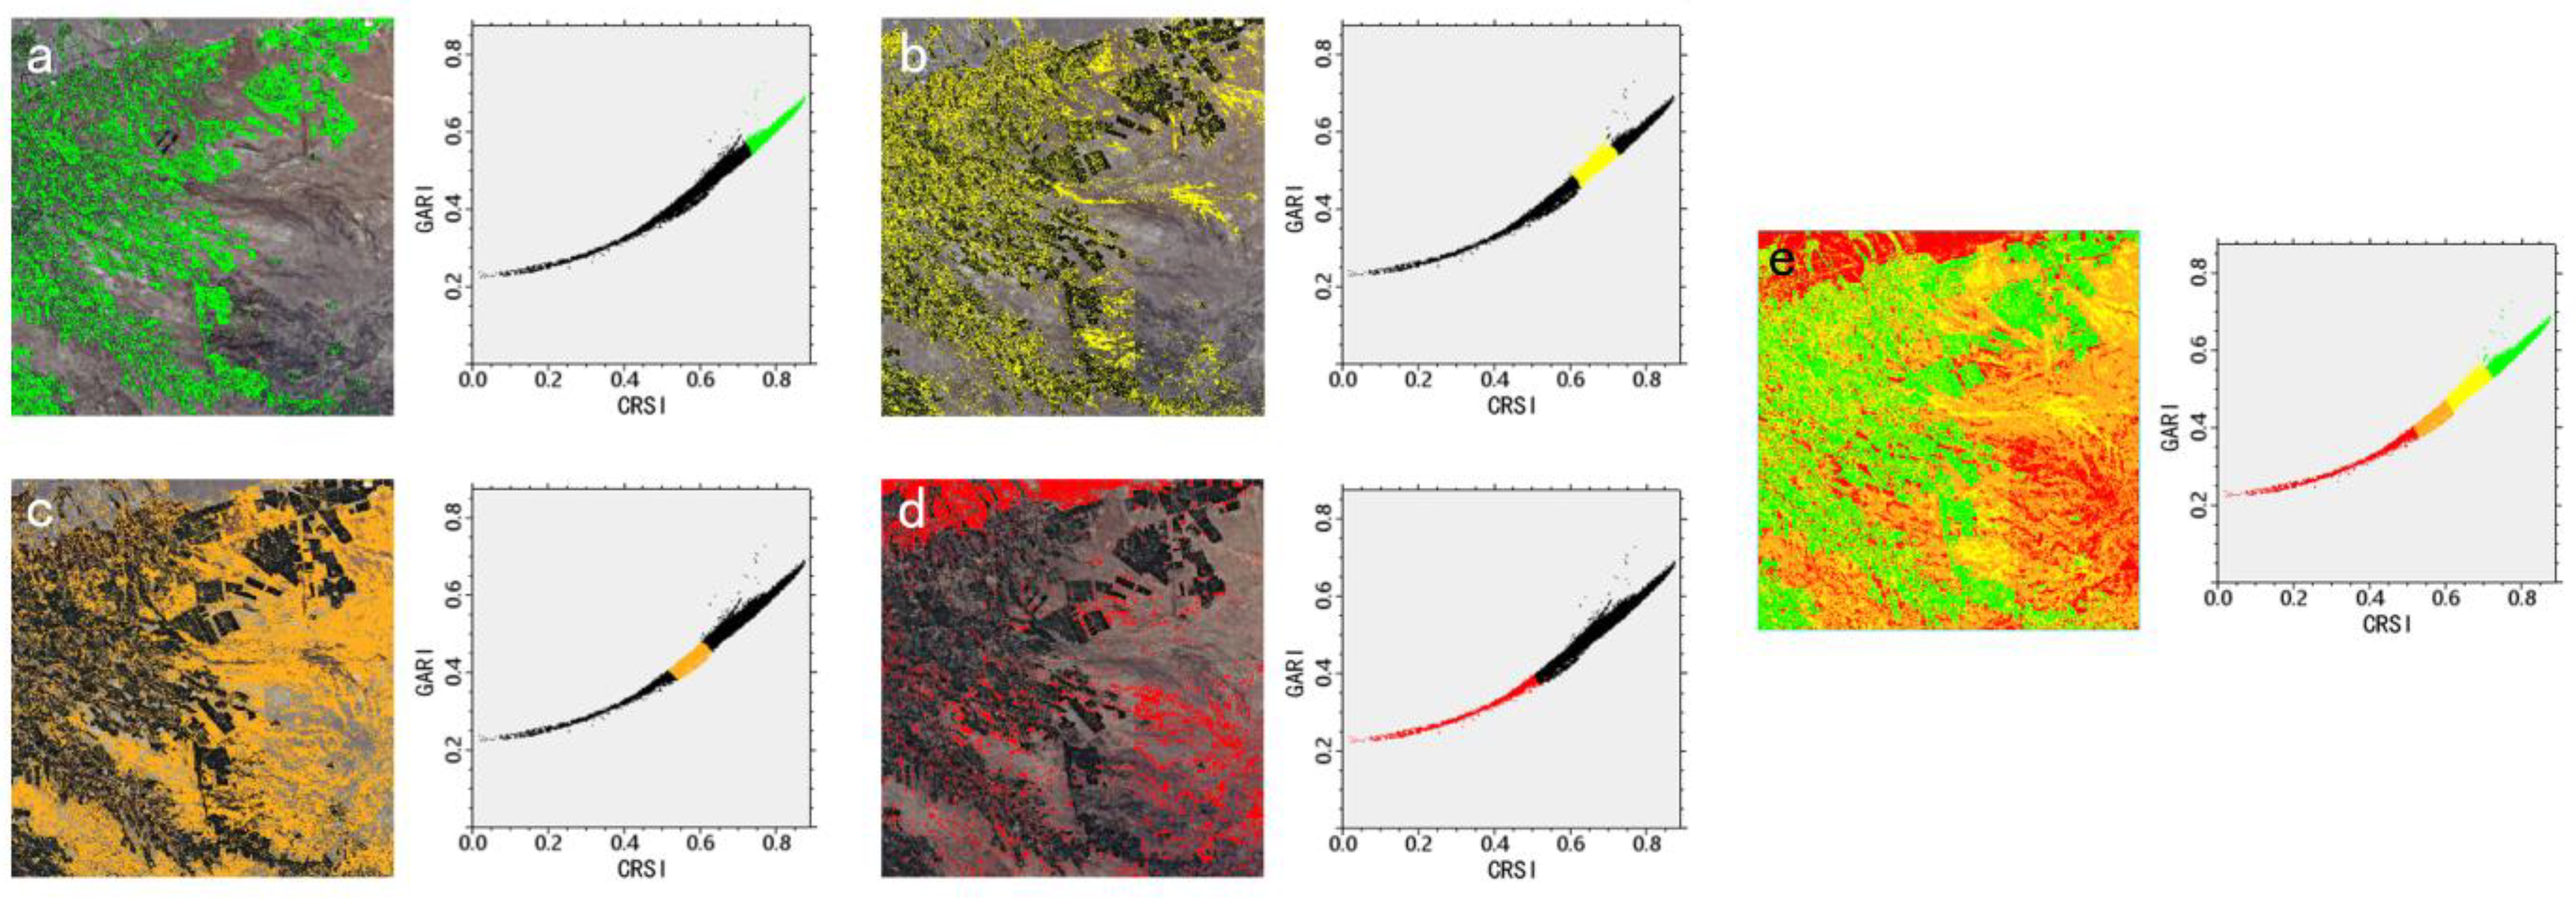
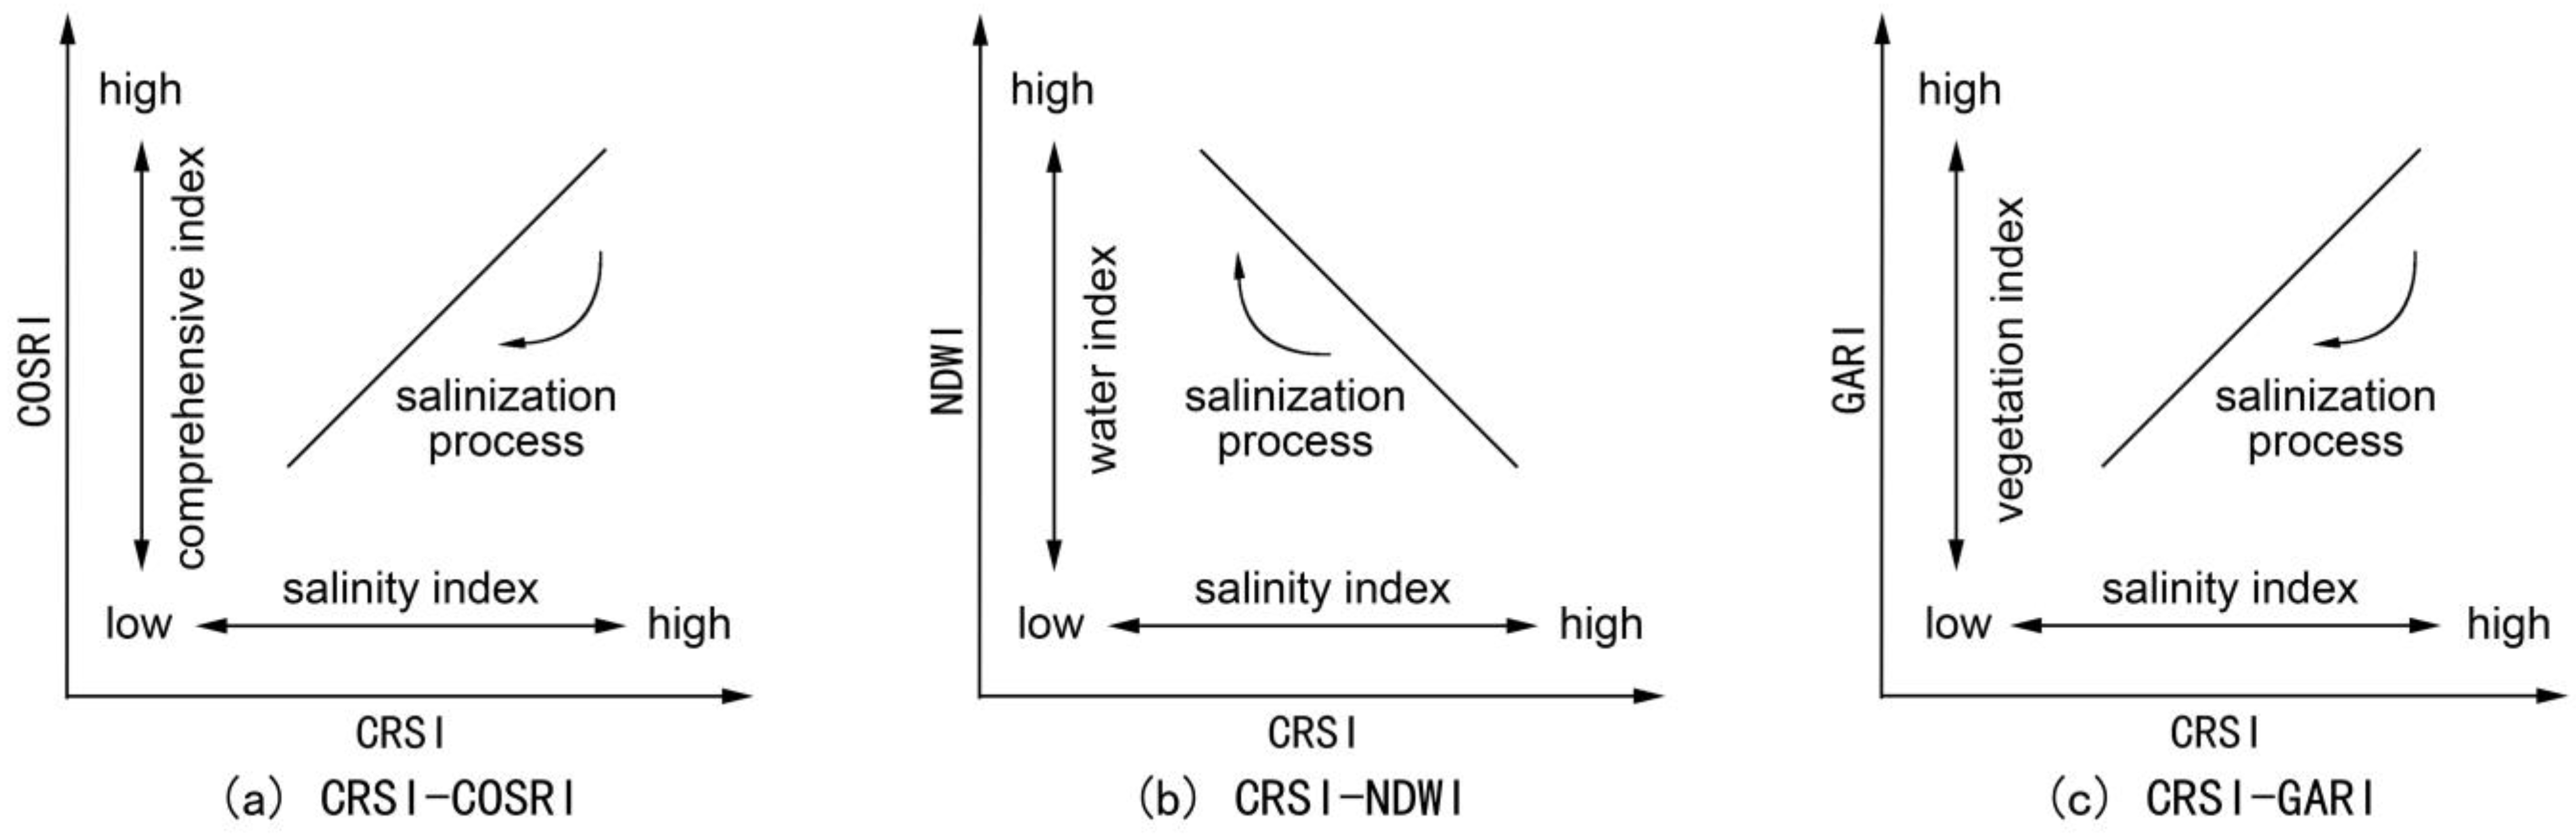
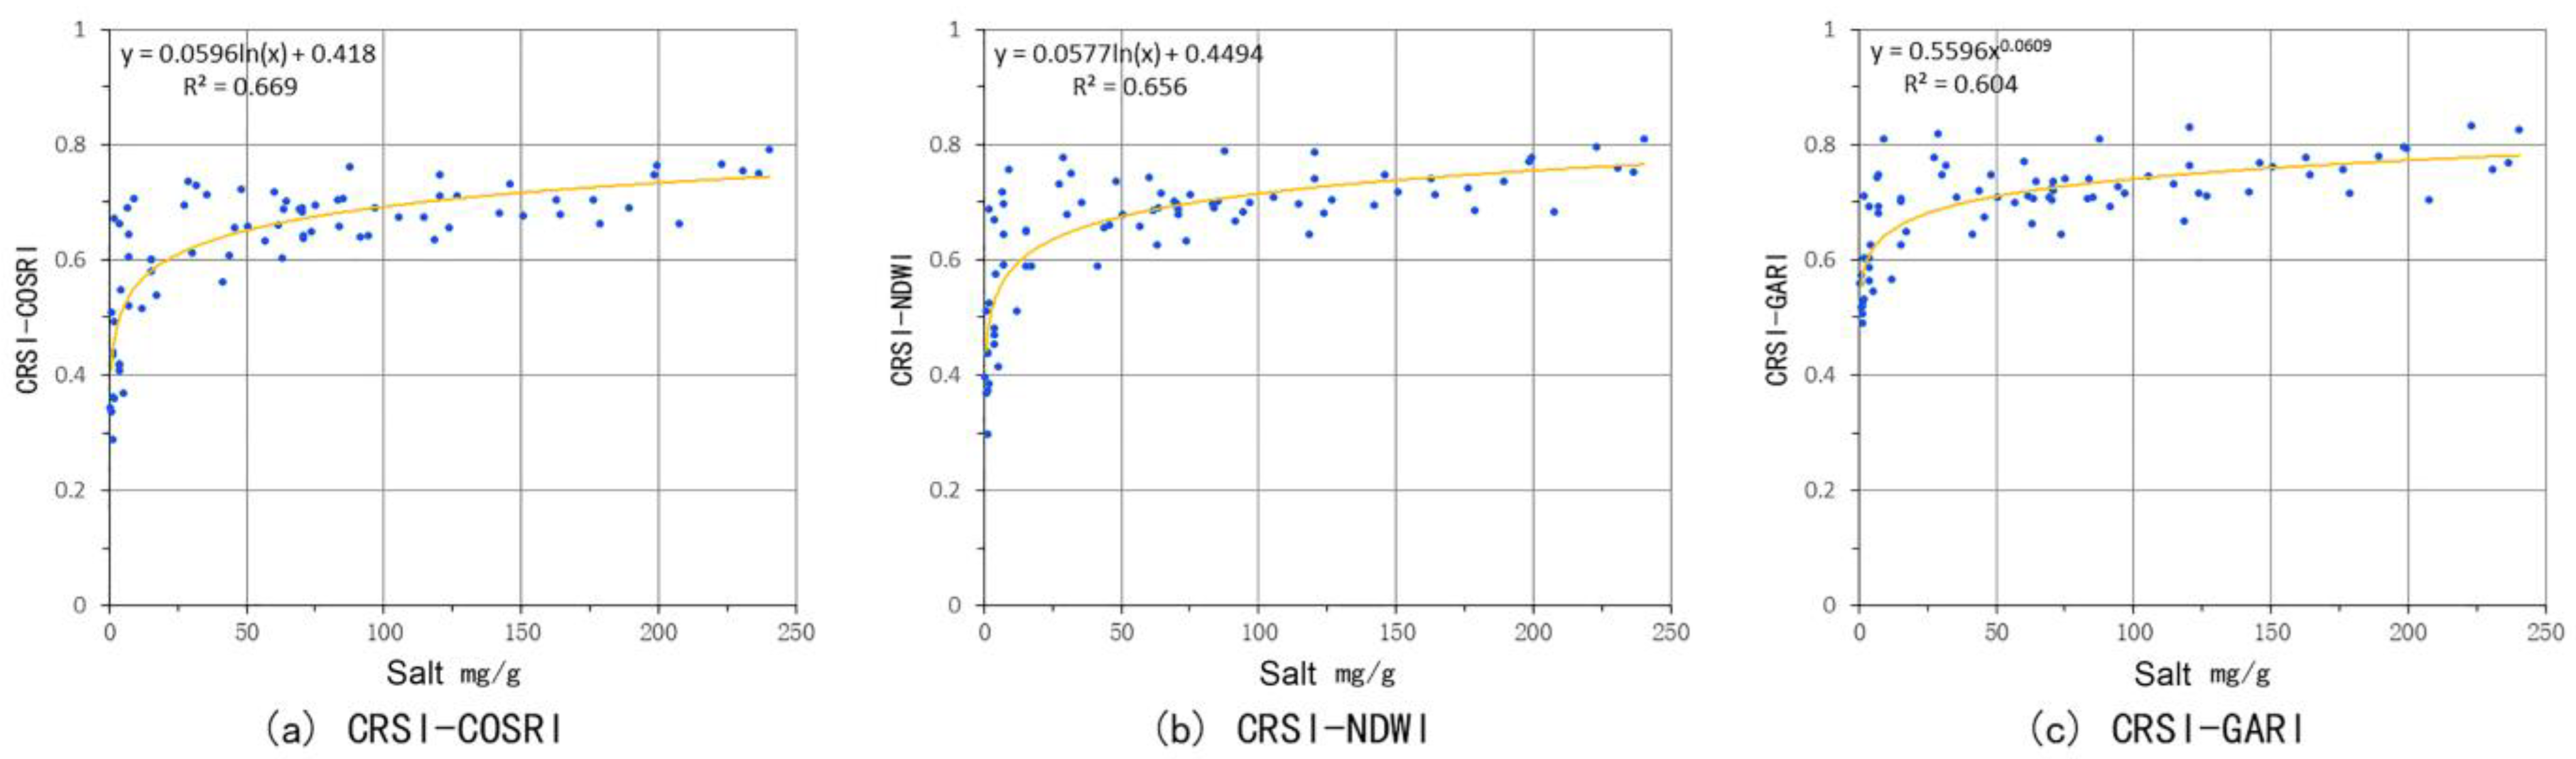
3.2. Two-Dimensional Feature Space Model Construction and Analysis
The normalized CRSI values were used as the horizontal axis, and the normalized COSRI, NDWI, and GARI values were used as the vertical axis to build two-dimensional feature space scatter plots (Figure 4). Based on the distribution characteristics of the soil salinity in the study area shown by the scatter plots, it can be seen that there were significant differences in the spatial distributions of the soils with different degrees of salinization. As shown in Figure 5, Figure 6 and Figure 7, the green area in the feature space scatter plot represents the vegetation, which is mainly located in the upper right in the CRSI-COSRI and CRSI-GARI scatter plots and in the lower left in the CRSI-NDWI scatter plot. The yellow area and the orange area represent slightly saline soils and moderately saline soils, respectively. The red area represents heavily saline soils and is mainly located in the lower left in the CRSI-COSRI and CRSI-GARI scatter plots and in the upper right in the CRSI-NDWI scatter plot.
Figure 4.
Two-dimensional feature space scatter plots.
Figure 5.
Distribution of salinization degree in the CRSI-COSRI two-dimensional feature space: (a) vegetation; (b) slightly saline soils; (c) moderately saline soils; (d) heavily saline soils; (e) spatial distribution of different degrees of soil salinization.
Figure 6.
Distribution of salinization degree in the CRSI-NDWI two-dimensional feature space: (a) vegetation; (b) slightly saline soils; (c) moderately saline soils; (d) heavily saline soils; (e) spatial distribution of different degrees of soil salinization.
Figure 7.
Distribution of salinization degree in the CRSI-GARI two-dimensional feature space: (a) vegetation; (b) slightly saline soils; (c) moderately saline soils; (d) heavily saline soils; (e) spatial distribution of different degrees of soil salinization.
Figure 8 shows the simplified schematic diagrams of the three two-dimensional feature spaces, and it can be seen that there were clear linear relationships between the combinations of spectral indices. In the CRSI-COSRI and CRSI-GARI two-dimensional feature space schematic diagrams, the point at coordinates (1, 1) was used as the feature reference point. This is the point in the study area with the best crop vegetation growth, the highest plant cover, and the lowest surface soil salinity. The distance from any point in the scatter plot to the reference point of the feature reflects the different degrees of soil salinization in the study area. The greater the distance from the reference point, the more severe the soil salinization, and the shorter the distance from the reference point, the less severe the soil salinization. In the CRSI-NDWI two-dimensional feature space schematic diagram, the point with coordinates (1, 0) was used as the feature reference point. The greater the distance from any point in the scatter plot to this feature reference point, the more severe the soil salinization, and the shorter the distance, the less severe the soil salinization.
Figure 8.
Simplified schematic diagrams of the two-dimensional feature spaces.
Based on the point-to-point distance equation in the two-dimensional coordinate system that expresses the above feature space principles, two-dimensional feature space remote sensing monitoring models for soil salinity were constructed as follows:
Using Equations (3)–(5), soil salinization inversions were performed for the entire study area, and the accuracy of the inversion results was verified based on the actual field measurements (Figure 9). Among them, the logarithmic function models of the CRSI-COSRI and CRSI-NDWI two-dimensional feature spaces had the best fits, with R2 values of 0.669 and 0.656, respectively. The power function model of the CRSI-GARI two-dimensional feature space had the best fit, with an R2 value of 0.604. According to the criteria for evaluating the validation capability of the model, which were empirically concluded by the researchers [59], if R2 >0.4, the characteristic covariates in the prediction model can be considered to have some correlation to the soil salinity information in the study area. If R2 >0.5, the model can be considered as more sensitive to the soil salinity content and can predict the soil salinization information to some extent. It can be seen that the R2 of all three models in the feature space model based on Sentinel-2 image spectral index proposed in this study was greater than 0.6. The feature covariates in the models had a high sensitivity to the soil salinity information. The three soil salinity inversion models could predict the degree of surface soil salinity more accurately and had a good soil salinity inversion ability. Among them, the best soil salinity monitoring model for the study area was the CRSI-COSRI two-dimensional feature space model with an R2 of 0.669.
Figure 9.
Accuracy verification of the two-dimensional feature space modeling results.
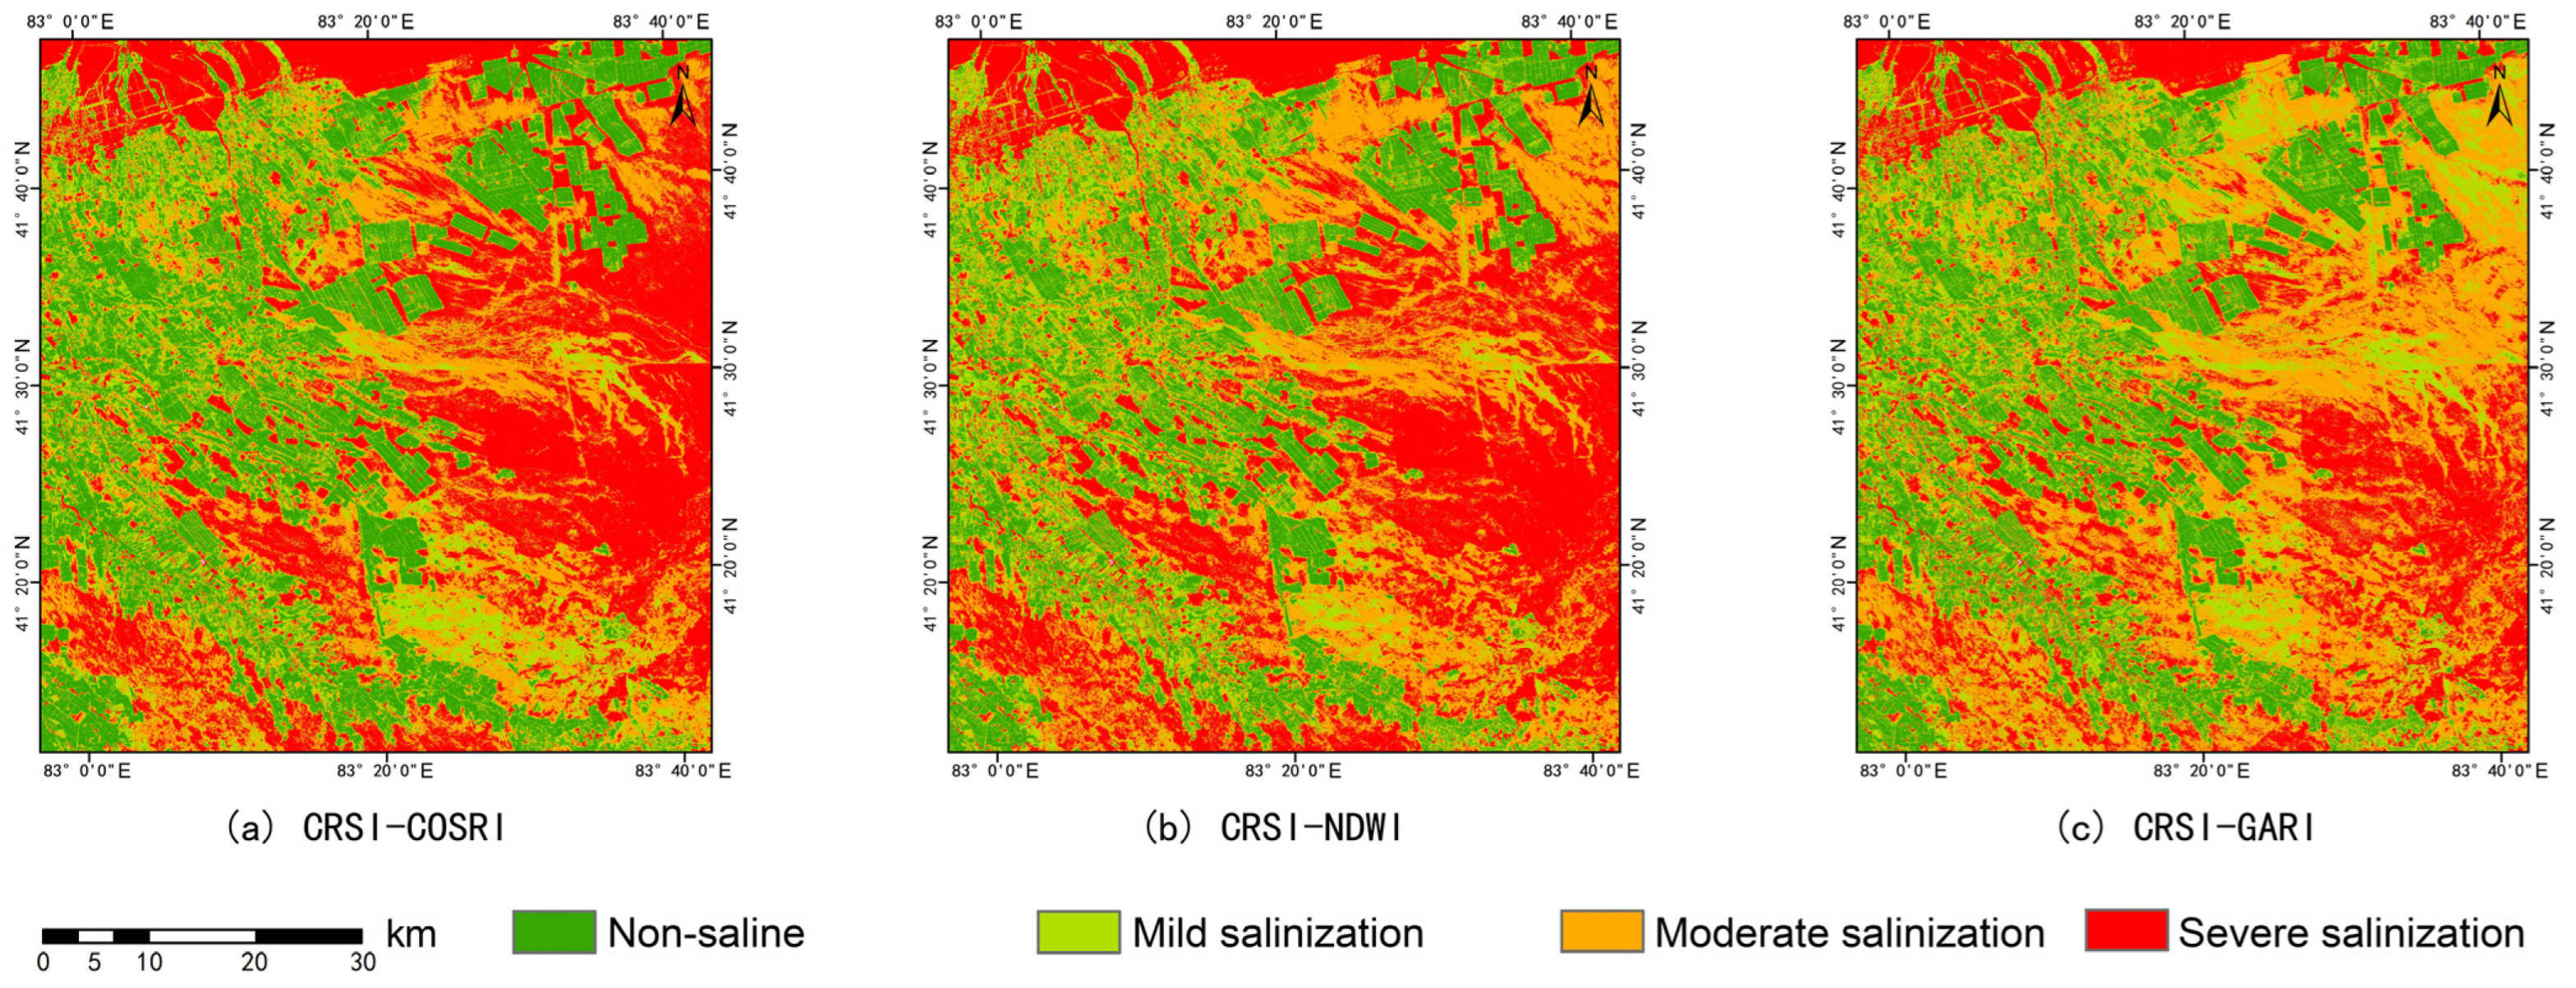
3.3. Spatial Distribution of Soil Salinization
The Jenks natural interruption point grading method is a grading method based on statistical theory and the principle of clustering. The principle of this method is to construct a cluster, which ends when the variance between groups reaches the maximum and the variance within groups reaches the minimum. Thus, the advantage of this grading method is the ability to minimize the sum of the variances within each class [60,61]. In order to more clearly and unambiguously distinguish the different levels of soil salinization, the grading method was used to classify the soil salinity inversion results of the CRSI-COSRI, CRSI-NDWI, and CRSI-GARI two-dimensional feature space inversion models for the study area. Four salinity intervals (i.e., non-saline, mild salinization, moderate salinization, and severe salinization) were established, and the regional salinity level breakpoint monitoring indicators (Table 3) and salinity distribution maps (Figure 10) were obtained for the three two-dimensional feature space soil salinity monitoring models.
Table 3.
Soil salinization level breakpoint monitoring indicators.
Figure 10.
Soil salinity inversion grade distribution.
As shown in Figure 10, the areas of moderate and severe salinization in the study area were large, and the overall soil salinization in the study area was high. The heavily saline areas with the highest salinity were mainly located in the northeastern part of the study area in the oasis-desert staggered zone, in the eastern part of the oasis-peripheral desert area, and in the southern part of the oasis-desert staggered zone. Some of these areas such as the central part of the oasis-desert staggered zone in the study area showed more severe salinization. The interior of the oasis was dominated by mostly non-salinized soils, with lightly salinized areas scattered among them, and the overall soil salt content was low. With the outward extension toward the edge of the oasis, areas of light and moderate salinization began to appear. Overall, the salinization was higher in the eastern region than in the western region, and there was a transition from mild salinization to moderate salinization to heavy salinization from east to west. Taking the edge of the oasis as the starting point, the further away from the oasis, the more salinization of the soil. Up to the desert area in the eastern part of the study area, due to the sparse natural vegetation, low rainfall, and excessive evaporation ratio, the salinity gradually rose to the surface under the effect of strong evaporation, and the water desalinization remaining led to the accumulation of soil salinity day by day, finally forming the current situation of a more serious salinization degree. In summary, the inversion results and spatial distribution prediction of soil salinization in the study area showed a better result. This is consistent with the actual salinization situation in the study area observed during the fieldwork undertaken for this study.
4. Discussion
At present, with the development of remote sensing image modeling and monitoring technology, the construction of feature space models has been increasingly used to monitor soil salinity in salinized areas. The two-dimensional feature space can clearly express the distribution pattern of the factors affecting the soil salinization process. In this study, the typical saline zone in the Weigan River–Kuqa River Delta Oasis in Xinjiang was taken as the study area. Based on Sentinel-2 remote sensing images and the field soil survey data, after selecting the optimal spectral index, remote sensing inversion models were constructed using the CRSI-COSRI, CRSI-NDWI, and CRSI-GARI two-dimensional feature spaces, and the spatial distribution pattern of the soil salinization in the study area was analyzed and studied. The following conclusions were obtained.
- The validation results of the two-dimensional feature space modeling showed that the three soil salinity inversion models could accurately reproduce the degree of the surface soil salinization. Among the models for the inversion of the surface soil salinity in the study area, the CRSI-COSRI two-dimensional feature space monitoring model constructed using the salinity index and composite index was the most accurate, followed by the CRSI-NDWI two-dimensional feature space monitoring model constructed using the salinity index and the water body index, and the CRSI-GARI two-dimensional feature space monitoring model constructed using the salinity index and the vegetation index was the least accurate.
- The common characteristics of the spatial distribution of the salinization in the inversion of the two-dimensional feature space model constructed in this study were that the overall proportion of the soil salinization in the study area was large, and the degree of salinization gradually increased from the inner oasis to the oasis–desert interlacing zone to the outer oasis area. This was generally consistent with the monitoring results of previous researchers and the results of our field sampling campaign.
Analyzing and discussing the above research results, and combining the results of many researchers in recent years, it can be seen that the feature spatial modeling method using various combinations of different feature parameters can be effectively applied to the modeling of the remote sensing monitoring of soil salinity. The spatial inversion model of the soil salinity characteristics can be established by using the principle of the spatial characteristics of a scatter diagram by obtaining the distribution pattern of soil salinity through the statistical combination of the faceted information of the selected parameters. This can effectively distinguish saline soils from non-saline soils, characterize the degree of salinization and the distribution of soils in the study area, and provide a good reference for monitoring the soil salinity information. The CRSI-COSRI two-dimensional feature space constructed in this study was more accurate than the CRSI-NDWI and CRSI-GARI two-dimensional feature spaces. The reason for this is that for the CRSI and COSRI, as a salinity parameter and composite parameter that directly reflect the degree of salinization, respectively, their two-dimensional feature space inversion models can better fit the typical saline area in the Weigan River–Kuqa River Delta Oasis where the salinization is more severe. The two-dimensional feature space model is more suitable for this study area than the other two models composed of indirect features. The CRSI-NDWI two-dimensional feature space can also be monitored with a high accuracy in the study area because of the strong relationship between the soil salinity changes and the water circulation processes, and the ease of soil salinity transfer through water changes.
Analysis of the inversion results of the model constructed in the paper shows that the moderate and heavy salinization areas were mainly located in the desert areas on the periphery of the oasis in the eastern part of the study area and in the oasis–desert interlacing zone in the southwestern part of the study area. This may be due to the fact that the desert areas on the periphery of the oasis are not heavily used for large land development, and that the topography of the oasis in the Weigan River–Kuqa River Delta Oasis is high in the north and low in the south. The spatial distribution of the soil salinity is directly affected by the flow of the surface water and groundwater, and the salts gradually rise to the surface and accumulate under the effect of strong evaporation. In contrast, due to the limited precipitation and high evaporation in the oasis–desert interlaced zone region, which hinders the leaching of salts to greater soil depths, soil salts from higher areas tend to accumulate in lower areas, which also leads to waterlogging in the downstream watershed area in the southern part of the region. In addition, the intense evaporation movement causes the soil salts to accumulate in the surface water. Some of the more saline areas within the oasis are due to a lack of effective engineered drainage facilities, which makes it difficult to circulate the soil salts within the oasis, thus causing increased salinity.
5. Conclusions
The use of remote sensing monitoring technology to extract soil salinity information has become a hot topic in the field of remote sensing research. Many scholars in China and abroad have gradually developed new technical means and research methods to achieve more abundant research results through the high-precision monitoring of regional soil salinity [62,63,64]. In this study, three two-dimensional characteristic spatial monitoring models of soil salinity were constructed based on the soil salinity-related spectral indices. Based on the inversion results, the spatial distribution status of soil salinity and its distribution characteristics in the typical saline zone of the Weigan River–Kuqa River Delta Oasis were analyzed. This provides a favorable basis for the spatial distribution and prediction of regional salinization.
At the same time, the two-dimensional feature space model can clearly express the distribution pattern of factors affecting the soil salinization process in the study area, and the two-dimensional feature space scatter diagram between various soil salinization parameters has been investigated by many scientists. Although the results of the CRSI-COSRI two-dimensional feature space soil salinity inversion model were better for the specific arid semi-arid oasis environment in our study area, the generalizability of the model to other regions requires further study and evaluation. The two-dimensional feature space model can be constructed by selecting suitable spectral feature parameters according to the different surface morphology, climatic conditions, hydrological factors, and human intervention measures, which can extract the soil salinization information more scientifically, accurately and efficiently. In light of the future development path of soil salinity quantification, the two-dimensional feature space model may no longer be able to satisfy the simultaneous participation of multiple factors related to soil salinity in the analysis and display. With the gradual development of remote sensing monitoring methods, the emergence of advanced technologies can help promote the development of soil salinity characteristic space research to the three-dimensional or even multi-dimensional characteristic space. Efficient use and timely innovation of remote sensing monitoring models for soil salinization are of great practical significance to comprehensively grasp the degree of salinization in the region, maintain the soil fertility quality and productivity level, promote sustainable agricultural development, and enhance the comprehensive management and utilization of regional soil salinization.
Author Contributions
Conceptualization, methodology, formal analysis, investigation, data curation and writing—original draft preparation, Y.M.; Writing—review and editing, supervision, project administration and funding acquisition, N.T. All authors have read and agreed to the published version of the manuscript.
Funding
This research was funded by the National Natural Science Foundation of China, grant number 41761077.
Data Availability Statement
The remote sensing image data presented in this study are openly available in the European Space Agency at https://scihub.copernicus.eu/dhus/#/home (accessed on 3 January 2023).
Acknowledgments
The authors would like to thank those who assisted in collecting and processing the field data. Furthermore, our sincere thanks are also extended to the teachers and students of the College of Geography and Remote Sensing Sciences, Xinjiang University for their support and help. Finally, the authors wish to thank the referees for providing helpful suggestions for the improvement of the manuscript.
Conflicts of Interest
The authors declare no conflict of interest.
References
- Zhang, H.; Song, L.; Chen, X.L.; Li, P.C. Study on the causes and remediation of soil degradation. Mar. Sci. 2020, 44, 147–161. [Google Scholar] [CrossRef]
- Guo, C.J.; Wang, M.G.; Geng, R.; Li, X.; Yin, X.H.; Wei, G.N. Salinity characteristics analysis of saline alkali soil in Yinbei Irrigation District of Ningxia. Chin. Agric. Sci. Bull. 2021, 37, 38–42. [Google Scholar] [CrossRef]
- Guo, S.; Ruan, B.; Chen, H.; Guan, X.; Wang, S.; Xu, N.; Li, Y. Characterizing the spatiotemporal evolution of soil salinization in Hetao Irrigation District (China) using a remote sensing approach. Int. J. Remote Sens. 2018, 39, 6805–6825. [Google Scholar] [CrossRef]
- Wu, Y.; Liu, G.; Su, L.; Yang, J. Accurate evaluation of regional soil salinization using multi-source data. Spectrosc. Spectr. Anal. 2018, 38, 3528–3533. [Google Scholar] [CrossRef]
- Yang, J.; Yao, R.; Wang, X.; Xie, W.; Zhang, X.; Zhu, W.; Zhang, L.; Sun, R. Research on salt-affected soils in China: History, status quo and prospect. Acta Pedol. Sin. 2022, 59, 10–27. [Google Scholar] [CrossRef]
- Liu, S.L.; Ding, X.D.; Zheng, D.F.; Shi, N.; Liu, G.L.; Sun, Z.Q. Effect of different plants plantation on amelioration of uncultivated saline wasteland, soils phosphorus fraction and availability in the Yellow River Delta. J. Soil Water Conserv. 2021, 35, 278–284. [Google Scholar] [CrossRef]
- Wang, R.R.; Xu, C.D.; Liu, H.; Zhang, R.; Cheng, H.; Wang, Y. Spatio-temporal succession characteristics of saline-alkali soilprofile salt in Jingdian Irrigation District. Agric. Res. Arid. Areas 2019, 37, 244–249. [Google Scholar] [CrossRef]
- Mao, H.X.; Jia, K.L.; Zhang, X. Inversion of soil salinity in Yinchuan Plain based on measured hyperspectral data and Sentinel-2B images. J. Yunnan Univ. Nat. Sci. Ed. 2021, 43, 278–284. [Google Scholar] [CrossRef]
- Park, S.-H.; Lee, B.-R.; Lee, J.-H.; Kim, T.-H. S nutrition alleviates salt stress by maintaining the assemblage of photosynthetic organelles in Kentucky bluegrass (Poa pratensis L.). Plant Growth Regul. 2016, 79, 367–375. [Google Scholar] [CrossRef]
- Wen, W.; Timmermans, J.; Chen, Q.; van Bodegom, P.M. A review of remote sensing challenges for food security with respect to salinity and drought threats. Remote Sens. 2021, 13, 6. [Google Scholar] [CrossRef]
- Zhou, X.H. Study on Soil Salt Jnversion Based on Multisource Data and Machine Learning Algorithm in the Ebinur Lake Wetland National Nature Reserve. Master’s Thesis, Xingjiang University, Ürümqi, China, 2020. [Google Scholar] [CrossRef]
- Zhuang, Q.; Shao, Z.; Huang, X.; Zhang, Y.; Altan, O. Evolution of soil salinization under the background of landscape patterns in the irrigated northern slopes of Tianshan Mountains, Xinjiang, China. Catena 2021, 206, 105561. [Google Scholar] [CrossRef]
- Zhang, X.; Huang, B.; Liu, F. Information extraction and dynamic evaluation of soil salinization with a remote sensing method in a typical county on the Huang-Huai-Hai Plain of China. Pedosphere 2020, 30, 496–507. [Google Scholar] [CrossRef]
- Qi, G.; Chang, C.; Yang, W.; Gao, P.; Zhao, G. Soil salinity inversion in coastal corn planting areas by the satellite-UAV-ground integration approach. Remote Sens. 2021, 13, 3100. [Google Scholar] [CrossRef]
- Zhou, X.; Zhang, F.; Liu, C.; Kung, H.-t.; Johnson, V.C. Soil salinity inversion based on novel spectral index. Environ. Earth Sci. 2021, 80, 501. [Google Scholar] [CrossRef]
- Meng, L.; Ding, J.; Wang, J.; Ge, X. Spatial distribution of soil salinity in Ugan-Kuqa River delta oasis based on environmental variables. Trans. Chin. Soc. Agric. Eng. 2020, 36, 175–181. [Google Scholar] [CrossRef]
- Alqasemi, A.S.; Ibrahim, M.; Al-Quraishi, A.M.F.; Saibi, H.; Al-Fugara, A.k.; Kaplan, G. Detection and modeling of soil salinity variations in arid lands using remote sensing data. Open Geosci. 2021, 13, 443–453. [Google Scholar] [CrossRef]
- Perri, S.; Suweis, S.; Holmes, A.; Marpu, P.R.; Entekhabi, D.; Molini, A. River basin salinization as a form of aridity. Proc. Natl. Acad. Sci. USA 2020, 117, 17635–17642. [Google Scholar] [CrossRef] [PubMed]
- Liu, Y.; Qian, J.; Yue, H. Comparison and evaluation of different dryness indices based on vegetation indices-land surface temperature/albedo feature space. Adv. Space Res. 2021, 68, 2791–2803. [Google Scholar] [CrossRef]
- Ding, J.; Qu, J.; Sun, Y.; Zhang, Y. The retrieval model of soil salinization information in arid region based on MSAVI-WI feature space: A case study of the delta oasis in Weigan-Kuqa watershed. Geogr. Res. 2013, 32, 223–232. [Google Scholar] [CrossRef]
- Guo, B.; Yang, F.; Fan, Y.; Han, B.; Chen, S.; Yang, W. Dynamic monitoring of soil salinization in Yellow River Delta utilizing MSAVI–SI feature space models with Landsat images. Environ. Earth Sci. 2019, 78, 308. [Google Scholar] [CrossRef]
- Feng, J.; Ding, J.L.; Wei, W.Y. A study of soil salinization in Weigan and Kuqa Rivers Oasis based on Albedo-MSAVI feature space. China Rural Water Hydropower 2018, 2, 147–152. [Google Scholar] [CrossRef]
- Bian, L.; Wang, J.; Guo, B.; Cheng, K.; Wei, H. Remote sensing extraction of soil salinity in Yellow River Delta Kenli County based on Feature Space. Remote Sens. Technol. Appl. 2020, 35, 211–218. [Google Scholar] [CrossRef]
- Li, Y.; Guo, Q.; Wan, B.; Qing, H.; Wang, D.; Xu, K.; Song, S.; Sun, Q.; Zhao, X.; Yang, M.; et al. Current status and prospect of three-dimensional dynamic monitoring of natural resources based on LiDAR. Natl. Remote Sens. Bull. 2021, 25, 381–402. [Google Scholar] [CrossRef]
- Bian, J.; Zhang, Z.; Chen, J.; Chen, H.; Cui, C.; Li, X.; Chen, S.; Fu, Q. Simplified evaluation of cotton water stress using high resolution unmanned aerial vehicle thermal imagery. Remote Sens. 2019, 11, 267. [Google Scholar] [CrossRef]
- Chen, S.; Chen, Y.; Chen, J.; Zhang, Z.; Fu, Q.; Bian, J.; Cui, T.; Ma, Y. Retrieval of cotton plant water content by UAV-based vegetation supply water index (VSWI). Int. J. Remote Sens. 2020, 41, 4389–4407. [Google Scholar] [CrossRef]
- Wang, Z.; Zhang, X.; Zhang, F.; Ngai Weng, C.; Kung, H.-t.; Liu, S.; Deng, L. Estimation of soil salt content using machine learning techniques based on remote-sensing fractional derivatives, a case study in the Ebinur Lake Wetland National Nature Reserve, Northwest China. Ecol. Indic. 2020, 119, 106869. [Google Scholar] [CrossRef]
- Li, X.; Zhang, F.; Wang, Z. Present situation and development trend of remote sensing monitoring model for soil salinization. Remote Sens. Nat. Resour. 2022, 34, 11. [Google Scholar] [CrossRef]
- Abbas, F.; Zhu, Z.; An, S. Evaluating aggregate stability of soils under different plant species in Ziwuling Mountain Area using three renowned methods. Catena 2021, 207, 105616. [Google Scholar] [CrossRef]
- Liu, Y.; Pan, X.; Wang, C.; Li, Y.; Shi, R.; Li, Z. Prediction of saline soil moisture content based on differential spectral index: A case study of coastal saline soil. Soils 2016, 48, 381–388. [Google Scholar] [CrossRef]
- Liu, Y.; Pan, X.; Wang, C.; Li, Y.; Shi, R. Can subsurface soil salinity be predicted from surface spectral information?—From the perspective of structural equation modelling. Biosyst. Eng. 2016, 152, 138–147. [Google Scholar] [CrossRef]
- Mahajan, G.R.; Das, B.; Gaikwad, B.; Murgaonkar, D.; Desai, A.; Morajkar, S.; Patel, K.P.; Kulkarni, R.M. Monitoring properties of the salt-affected soils by multivariate analysis of the visible and near-infrared hyperspectral data. Catena 2021, 198, 105041. [Google Scholar] [CrossRef]
- Wang, X.; Zhang, F.; Ding, J.; Kung, H.T.; Latif, A.; Johnson, V.C. Estimation of soil salt content (SSC) in the Ebinur Lake Wetland National Nature Reserve (ELWNNR), Northwest China, based on a Bootstrap-BP neural network model and optimal spectral indices. Sci. Total Environ. 2018, 615, 918. [Google Scholar] [CrossRef] [PubMed]
- Weng, Y.L.; Gong, P.; Zhu, Z.L. Reflectance spectroscopy for the assessment of soil salt content in soils of the Yellow River Delta of China. Int. J. Remote Sens. 2008, 29, 5511–5531. [Google Scholar] [CrossRef]
- Yang, J.; Yao, R.; Zou, P.; Liu, G. Characteristics of soil salinity profiles and their electromagnetic response under various vegetation types in coastal saline area. Chin. J. Appl. Ecol. 2008, 19, 2117–2124. [Google Scholar]
- Fernández, B.N.; Siebe, C.; Cram, S. Mapping soil salinity using a combined spectral response index for bare soil and vegetation: A case study in the Former Lake Texcoco, Mexico. J. Arid. Environ. 2006, 65, 644–667. [Google Scholar] [CrossRef]
- Scudiero, E.; Skaggs, T.H.; Corwin, D.L. Regional scale soil salinity evaluation using Landsat 7, western San Joaquin Valley, California, USA. Geoderma Reg. 2014, 2–3, 82–90. [Google Scholar] [CrossRef]
- Jordan, C.F. Derivation of leaf area index from light quality of the forest floor. Ecology 1969, 50, 663–666. [Google Scholar] [CrossRef]
- Wu, W.; Ahmad, S.M.; Boubaker, D.; Eddy, D.P. Mapping soil salinity changes using remote sensing in Central Iraq. Geoderma Reg. 2014, 2–3, 21–31. [Google Scholar] [CrossRef]
- Fourati, H.T.; Bouaziz, M.; Benzina, M.; Bouaziz, S.J. Modeling of soil salinity within a semi-arid region using spectral analysis. Arab. J. Geosci. 2015, 8, 11175–11182. [Google Scholar] [CrossRef]
- Khan, N.M.; Rastoskuev, V.V.; Sato, Y.; Shiozawa, S. Assessment of hydrosaline land degradation by using a simple approach of remote sensing indicators. Agric. Water Manag. 2005, 77, 96–109. [Google Scholar] [CrossRef]
- Bunkei, M.; Wei, Y.; Chen, J.; Yuyichi, O.; Qiu, G. Sensitivity of the enhanced vegetation index (evi) and normalized difference vegetation index (ndvi) to topographic effects: A case study in high-density cypress forest. Sensors 2007, 7, 2636. [Google Scholar] [CrossRef]
- Mcfeeters, S.K. The use of the Normalized Difference Water Index (NDWI) in the delineation of open water features. Int. J. Remote Sens. 2007, 17, 1425–1432. [Google Scholar] [CrossRef]
- Fang, X.R.; Gao, J.F.; Xie, C.Q.; Zhu, F.L.; Huang, L.X.; He, Y. Review of crop canopy spectral information detection technology and methods. Spectrosc. Spectr. Anal. 2015, 35, 1949–1955. [Google Scholar] [CrossRef]
- Abbas, A.; Khan, S.; Hussain, N.; Hanjra, M.A.; Akbar, S. Characterizing soil salinity in irrigated agriculture using a remote sensing approach. Phys. Chem. Earth 2013, 55–57, 43–52. [Google Scholar] [CrossRef]
- Huete, A.R. A soil-adjusted vegetation index (SAVI). Remote Sens. Environ. 1988, 25, 295–309. [Google Scholar] [CrossRef]
- Allbed, A.; Kumar, L.; Aldakheel, Y.Y. Assessing soil salinity using soil salinity and vegetation indices derived from IKONOS high-spatial resolution imageries: Applications in a date palm dominated region. Geoderma 2014, 230, 1–8. [Google Scholar] [CrossRef]
- Douaoui, A.E.K.; Nicolas, H.; Walter, C. Detecting salinity hazards within a semiarid context by means of combining soil and remote-sensing data. Geoderma 2006, 134, 217–230. [Google Scholar] [CrossRef]
- Wang, F.; Ding, J.; Wei, Y.; Zhou, Q.; Yang, X.; Wang, Q. Sensitivity analysis of soil salinity and vegetation indices to detect soil salinity variation by using Landsat series images: Applications in different oases in Xinjiang, China. Acta Ecol. Sin. 2017, 37, 5007–5022. [Google Scholar] [CrossRef]
- Birth, G.S.; Mcvey, G.R.J. Measuring the color of growing turf with a reflectance spectrophotometer. Agron. J. 1968, 60, 640–643. [Google Scholar] [CrossRef]
- Muhetaer, N.; Nurmemet, I.; Abulaiti, A. A quantifying approach to soil salinity based on a radar feature space model using ALOS PALSAR-2 data. Remote Sens. 2022, 14, 363. [Google Scholar] [CrossRef]
- Wang, X.; Li, Y.H.; Wang, R.Y.; Shi, R.F.; Xu, S.T. Remote sensing inversion of surface soil organic matter at jointing stage of winter wheat based on unmanned aerial vehicle multispectral. Chin. J. Appl. Ecol. 2020, 31, 2399–2406. [Google Scholar] [CrossRef]
- Qin, Q.; You, L.; Zhao, Y. Soil line automatic identification algorithm based on two-dimensional feature space. Trans. Chin. Soc. Agric. Eng. 2012, 28, 167–171. [Google Scholar] [CrossRef]
- Zhang, D.; Tang, R.; Tang, B.H. A simple method for soil moisture determination from LST–VI feature space using nonlinear interpolation based on thermal infrared remotely sensed data. IEEE J. Sel. Top. Appl. Earth Obs. Remote Sens. 2017, 8, 638–648. [Google Scholar] [CrossRef]
- Guo, B.; Zang, W.; Zhang, R. Soil salizanation information in the Yellow River Delta based on feature surface models using Landsat 8 OLI data. IEEE Access 2020, 8, 94394–94403. [Google Scholar] [CrossRef]
- Guo, B.; Yang, F.; Han, B.; Fan, Y.; Chen, S.; Yang, W.; Jiang, L. A model for the rapid monitoring of soil salinization in the Yellow River Delta using Landsat 8 OLI imagery based on VI-SI feature space. Remote Sens. Lett. 2019, 10, 796–805. [Google Scholar] [CrossRef]
- Li, Y.; Ding, J.; Sun, Y.; Wang, G.; Wang, L. Remote sensing monitoring models of soil salinization based on the three dimensional feature space of MSAVI-WI-SI. Res. Soil Water Conserv. 2015, 22, 113–117. [Google Scholar] [CrossRef]
- Jia, P.; Shang, T.; Zhang, J.; Yuan, S. Inversion of soil pH during the dry and wet seasons in the Yinbei region of Ningxia, China, based on multi-source remote sensing data. Geoderma Reg. 2021, 25, e00399. [Google Scholar] [CrossRef]
- Guo, K.M.; Jia, K.L.; Ji, Y.W. Regional soil salinization modeling based on comprehensive hyperspectral index: Taking Pingluo County as an example. J. Lanzhou Univ. (Nat. Sci.) 2020, 56, 623–628. [Google Scholar] [CrossRef]
- Wu, Z.P.; Wang, M.X.; Zhao, X. A sutdy desertification based on deseitification difference index in Jinghe Watershed. Bull. Soil Water Conserv. 2014, 34, 188–192. [Google Scholar] [CrossRef]
- Hou, J.; Rusuli, Y. Assessment of soil salinization risk by remote sensing-based ecological index (RSEI) in the bosten lake watershed, Xinjiang in northwest China. Sustainability 2022, 14, 7118. [Google Scholar] [CrossRef]
- Li, Z.; Li, Y.; Xing, A.; Zhuo, Z.; Zhang, S.; Zhang, Y.; Huang, Y. Spatial prediction of soil salinity in a semiarid oasis: Environmental sensitive variable selection and model comparison. Chin. Geogr. Sci. 2019, 29, 784–797. [Google Scholar] [CrossRef]
- Yuan, G.; Chen, D.; Yangyang, X.U.; Meng, D.; Zhang, Y.; Wang, X. Summary of methods for extracting soil salinization information. J. North China Univ. Water Resour. Electr. Power (Nat. Sci. Ed.) 2022, 43, 95–101. [Google Scholar] [CrossRef]
- Corbane, C.; Syrris, V.; Sabo, F.; Politis, P.; Melchiorri, M.; Pesaresi, M.; Soille, P.; Kemper, T. Convolutional neural networks for global human settlements mapping from Sentinel-2 satellite imagery. Neural Comput. Appl. 2021, 33, 6697–6720. [Google Scholar] [CrossRef]
Disclaimer/Publisher’s Note: The statements, opinions and data contained in all publications are solely those of the individual author(s) and contributor(s) and not of MDPI and/or the editor(s). MDPI and/or the editor(s) disclaim responsibility for any injury to people or property resulting from any ideas, methods, instructions or products referred to in the content. |
© 2023 by the authors. Licensee MDPI, Basel, Switzerland. This article is an open access article distributed under the terms and conditions of the Creative Commons Attribution (CC BY) license (https://creativecommons.org/licenses/by/4.0/).


