Article

Spatial Inequalities in Access to Safe Drinking Water in an Upper-Middle-Income Country: A Multi-Scale Analysis of Brazil

by
Fernanda Santos Mota de Jesus
1,*,
Antonio Miguel Vieira Monteiro
1,* and
Javier Tomasella
2
1
Laboratory for Investigation of Socioenvironmental Systems (LISS), National Institute for Space Research (INPE), Sao Jose dos Campos 12227-010, Brazil
2
Impacts, Adaptation and Vulnerability Division (DIIAV), National Institute for Space Research (INPE), Sao Jose dos Campos 12227-010, Brazil
*
Authors to whom correspondence should be addressed.
Water 2023, 15(8), 1620; https://doi.org/10.3390/w15081620
Submission received: 9 February 2023 / Revised: 6 April 2023 / Accepted: 12 April 2023 / Published: 21 April 2023
(This article belongs to the Section Water Resources Management, Policy and Governance)

Abstract

:
Access to drinking water is recognized as a human right, meaning that it is necessary to guarantee its universal and equitable access. Since analyzing only the average access rates to drinking water may obscure inequalities, studies have adapted socioeconomic inequalities indices to assess disparities. This research evaluated the Safe Drinking Water Access Index (SDWA) and inequalities access in all Brazilian municipalities using microdata from the 2010 Demographic Census. The inequalities were analyzed adapting indices derived from the Lorenz curve (Gini index, concentration coefficient and dissimilarity index). The results showed that the lowest SDWA rates and the highest inequality index values occurred in the north and northeast regions. The municipalities with significant inequality indexes values were rural with reduced gross domestic product (GDP) per capita. It was possible to punctuate municipalities that do not fit these rules but still need attention to safe water access guarantee. The amplitude of inequality index results reveals significant inequalities in the same regions or SDWA ranges. The inequalities in safe drinking water access were made more evident by the adapted Gini Index. This research contributes to the literature with an unprecedented analysis of Brazil and could be adapted to other countries and replicated to assess inequalities in sanitation access.

1. Introduction

Safe, clean, accessible, and affordable water for personal and domestic use is a universal right [1]. Even though the right to water access has been raised in international debates concerning human rights since 1977 [2], formal recognition of the right to drinking water as essential occurred only upon the Resolution of the United Nations General Assembly in 2010 [1]. Goal 6 of the Sustainable Development Goals (SDGs) is the achievement of universal and equitable access to safe and affordable drinking water for all by 2030 [3]. This represents an advancement on the Millennium Development Goals (MDGs), which did not specify this issue [4]. In terms of the Joint Monitoring Program for Water Supply, Sanitation and Hygiene (JMP), created by the World Health Organization (WHO) and the United Nations International Children’s Emergency Fund (UNICEF), safely managed drinking water services refer to drinking water obtained from a quality source, which is accessible on premises, available when needed, and free from fecal and priority chemical contamination, to enable international comparisons and monitor SDGs 6 [5].
In Brazil, the second article of Law number 11,445/2007, which establishes national guidelines for basic sanitation, presents the universalization of access and effective delivery of the service as fundamental principles of public sanitation service provision (Brazil Federal Law number 11,455, of 5 January 2007). Among the guidelines of the National Plan of Basic Sanitation (PLANSAB) of 2019 lies the quest for the universalization of drinking water supplies in a socially just way [6]. The new Brazilian Legal Sanitation Milestone goals include a guarantee to service 99.0% of the population with drinking water until the end of 2033 in the public service agreements of basic sanitation (Brazil Federal Law number 14,026, of 15 July 2020).
As advocated by international agendas and national laws, the right to access drinking water requires a guarantee of equitable access. Average water access rates, the most common metric, can mask significant inequalities [5,7,8,9]. The quantification of the inequalities regarding drinking water access constitutes an instrument to guide universalization when considering the most marginalized and disadvantaged groups and individuals [10] and to monitor the progressive reach of human rights [11]. By adapting socioeconomic inequalities indexes to safe drinking water access, it is possible to measure progress toward the reduction of inequalities, as recommended by SDG 6 [8].
In Brazil, it is worth highlighting the works of Berthe [12], Cetrulo et al. [8] and Queiroz et al. [9]. Berthe [12] analyzed the inequalities of access to improved drinking water sources and sanitation for the country using the adapted Gini Index and the Concentration Coefficient, discriminating between urban and rural and the states of the north and northeast regions of Brazil. According to these authors, the differences between urban and rural areas were particularly relevant. Cetrulo et al. [8], in turn, performed a Brazilian case study by analyzing the inequalities in the lack of access to safe drinking water at the national level and for metropolitan regions and capitals to assess its evolution between the years 2000 and 2010 by comparing several adapted indexes of socioeconomic inequalities. The results indicated increased inequalities, mainly in the north and northeast regions. Finally, the work of Queiroz et al. [9] analyzed the inequalities in access to piped water and sanitation in Latin American and Caribbean countries through the adjustment of indicators of access to water and sanitation, considering them along with the inequality of the Dissimilarity Index. These authors suggested that further research should be conducted on a subnational scale due to the heterogeneity of the Brazilian situation.
The studies mentioned above presented interesting results, representing an advance in understanding inequalities in drinking water access in Brazil. However, they are conducted at the levels of the country, metropolitan regions, federation units (restricted to the north and northeast regions), or capitals, which are significantly subject to the scale effect, as emphasized by Cole et al. [13] and Cha et al. [14]. The following factors can be pointed out as limitations of previous research: the restricted database [12], an analysis of the lack of access to drinking water without qualification of the drinking water sources [8], and a focus on access to piped drinking water [9].
Researchers have adapted inequality indices from the Lorenz curve, e.g., the Gini index, concentration coefficient, and dissimilarity index, for use in water access studies; some relevant information is presented in Table S1 of the Supplementary Materials [7,8,9,12,13,14,15,16,17,18,19,20,21,22,23,24,25,26,27,28,29,30,31,32,33,34]. The international studies are relatively recent, conducted in the twenty-first century, from the decade of 2010 onwards, in low- and middle-income countries. There are differences between international researches about drinking water access criteria regarding, e.g., domestic water use [22,30,31], improved water sources according to WHO/UNICEF JMP criteria [14,18,20,23,28,29,32,33,34], only piped water supply [7,9,13,16,17,19,25,27], and lack of water access [8]. The works of Yang et al. (2013) [32] and Oskam et al. (2021) [26] obtain Lorenz curves for different forms of water supply separately. In research, the criteria for safe drinking water were based on WHO/UNICEF JMP, with qualification and quantification of the water sources considering accessibility, availability, and quality.
Most international researchers use countries, municipalities, administrative areas, and percentiles as the unit of analysis for Lorenz curve elaboration to evaluations at worldwide, country, region, municipality, and district scales. The studies that present micro units of analysis, such as households or residents, refer to surveys that were carried out with specific interviews by researchers and, consequently, are more limited and have fewer data [16,29]. Cole et al. (2018), despite the use of wards level data, group them into deciles [13]. The only study that uses census sectors is the Brazilian Cetrulo et al. (2020), however for analysis of large regions, states, and capitals; and to assess the lack of water access [8].
The objective of this study is to analyze the inequalities of access to safe drinking water in all municipalities, states, and regions of Brazil for multiple scales of political-administrative levels. The microdata from drinking water sources are from the 2010 Demographic Census, which provides data on access to drinking water in households at the census sector levels.

2. Materials and Methods

Brazil is a federative republic composed of 26 Brazilian states and the federal district, where the seat of government is located (Table 1). It has an area of 8,510,345.54 km2 and an estimated population of 213,317,639 in 2021. A total of 5570 municipalities are distributed among the 5 regions and 27 federal units (UF) in 5 political regions [35].
Brazil’s per capita GDP in 2021 was USD 7518.80, meaning that it is considered by the World Bank to be an upper-middle-income economy [36]. Middle-income countries account for about one-third of the global GDP and are the main drivers of global growth. Although Brazil is in this development tier, it is a very heterogeneous country, marked by territorial socioeconomic inequalities.
The 2019 National Basic Sanitation Plan indicated that 85.7% of households were served with a water supply through either an internal or property-level plumbing network; 9.9% were served by a well or spring with internal plumbing; 2.1% were served with a well or spring without internal plumbing; and 2.3% were served with other forms of supply, based on data from the 2010 Demographic Census and National Household Sampling Survey (PNAD) of 2017 [6]. The National Sanitation Information System (SNIS) reported that the total water supply network attendance was 84.1%, ranging from 58.9% in the northern region to 91.3% in the southeast region [37]. Brazilian data show high levels of access to drinking water with regional disparities.
In the present work, drinking water access inequalities were analyzed by adapted socioeconomic inequality indexes based on data from the 2010 Demographic Census. Although it is not the country’s most thoroughly updated database regarding sanitation information, it is the only source that provides data about household drinking water access at refined spatial levels: i.e., the census sectors. The data are from the 27 States (UF), 5565 municipalities, and 310,120 census sectors, accounting for 189,426,467 residents in permanent private households.
The AHP (Process Analytical Hierarchy) method allowed the qualification and quantification of drinking water sources based on the access, quantity, and quality of water adhering to the definitions of safely managed drinking water services given by the WHO/UNICEF JMP. In addition, taking into account income groups, socioeconomic inequalities indexes were adapted according to suggestions of previous research in Brazil: (i) the Safe Drinking Water Gini Index (Gwater); (ii) the Safe Drinking Water Concentration Coefficient (Cwater); and (iii) the Safe Drinking Water Dissimilarity Index (Dwater).
For analysis at the municipal level, the Brazilian municipalities were categorised according to the classification of rural and urban spaces proposed by the Brazilian Institute of Geography and Statistics (IBGE) [38]. This classification considers the ranges and percentage distribution of the total population in areas of dense occupation and the relative distance to the national average of a metropolis, a regional capital, or a subregional center. The categories were urban, adjacent intermediate, remote intermediate, adjacent rural, and remote rural.
The data manipulation and treatment, database elaboration, and statistical analysis were performed and the results obtained through data mining research handled in R Studio.

2.1. Process Analytical Hierarchy (AHP) Method

The drinking water access data in the 2010 Demographic Census were categorized into permanent private households (i) with a public water distribution network; (ii) with a well or spring located on the property; (iii) with rainwater stored in a cistern, cement box, etc.; (iv) or with a well or spring outside the property, a tank car, other rainwater storage means, a river, dam, lake or stream, or another form of water supply. Considering that these forms of water access differ in terms of accessibility, availability, and water quality, the AHP method was applied to obtain different weights for each form of access based on the model shown in Figure 1. The AHP method is a multi-criteria decision-making method that uses decomposition into a hierarchical structure consisting of objectives, criteria, sub-criteria, and alternatives based on pair-wise comparative judgments [39]. This qualitative–quantitative characterization aims to classify drinking water sources according to the definitions of safely managed drinking water services provided by the WHO/UNICEF JMP.
A matrix to weigh the criteria and five pair-wise comparison matrices between the alternative drinking water sources were developed for each sub-criterion. The importance scale for pair-wise comparisons was based on the work of Saaty [39] and is presented in Table S2 of the Supplementary Materials, along with the criteria weights. The respective weights of each drinking water source were calculated, and the consistency ratio was determined to verify the judgments’ consistency. These steps were performed using the AHP method online software from Business Performance Management Singapore (BPMSG) [40].
The weights obtained using the AHP method were used in Equation (1) to calculate the Safe Drinking Water Access Indicator for each census sector:
t water = w piped × t piped + w well × t well + w cistern × t cistern + w others × t others     t piped + t well + t cistern + t others = 1               
where t is the ratio between residents in permanent private households with water access (piped, well, cistern, and/or other) and the total number of residents in permanent private households, and w represents the weights resulting from the AHP method of each form of supply. The values of twater were linearly normalized based on the minimum and maximum values.

2.2. Safe Drinking Water Access Index (SDWA)

Equation (2) shows the calculation of the SDWA for each municipality by the weighted average of the twater values of the census tracts:
SDWA = i = 1 n t water norm i × p i i = 1 n p i
considering the percentage of residents in permanent private households of each sector (pi) and the number of census tracts (n).
The SDWA indicates the “theoretical” percentage of residents in permanent households with safe access to drinking water. If all residents are supplied with a distribution water network, the SDWA equals 1; otherwise, if all residents are supplied with other water sources (a well or spring outside the property, a tank car, rainwater stored otherwise, a river, dam, lake or stream, or another form of water supply), the SDWA value is 0.

2.3. Inequalities Index for Safe Drinking Water Access

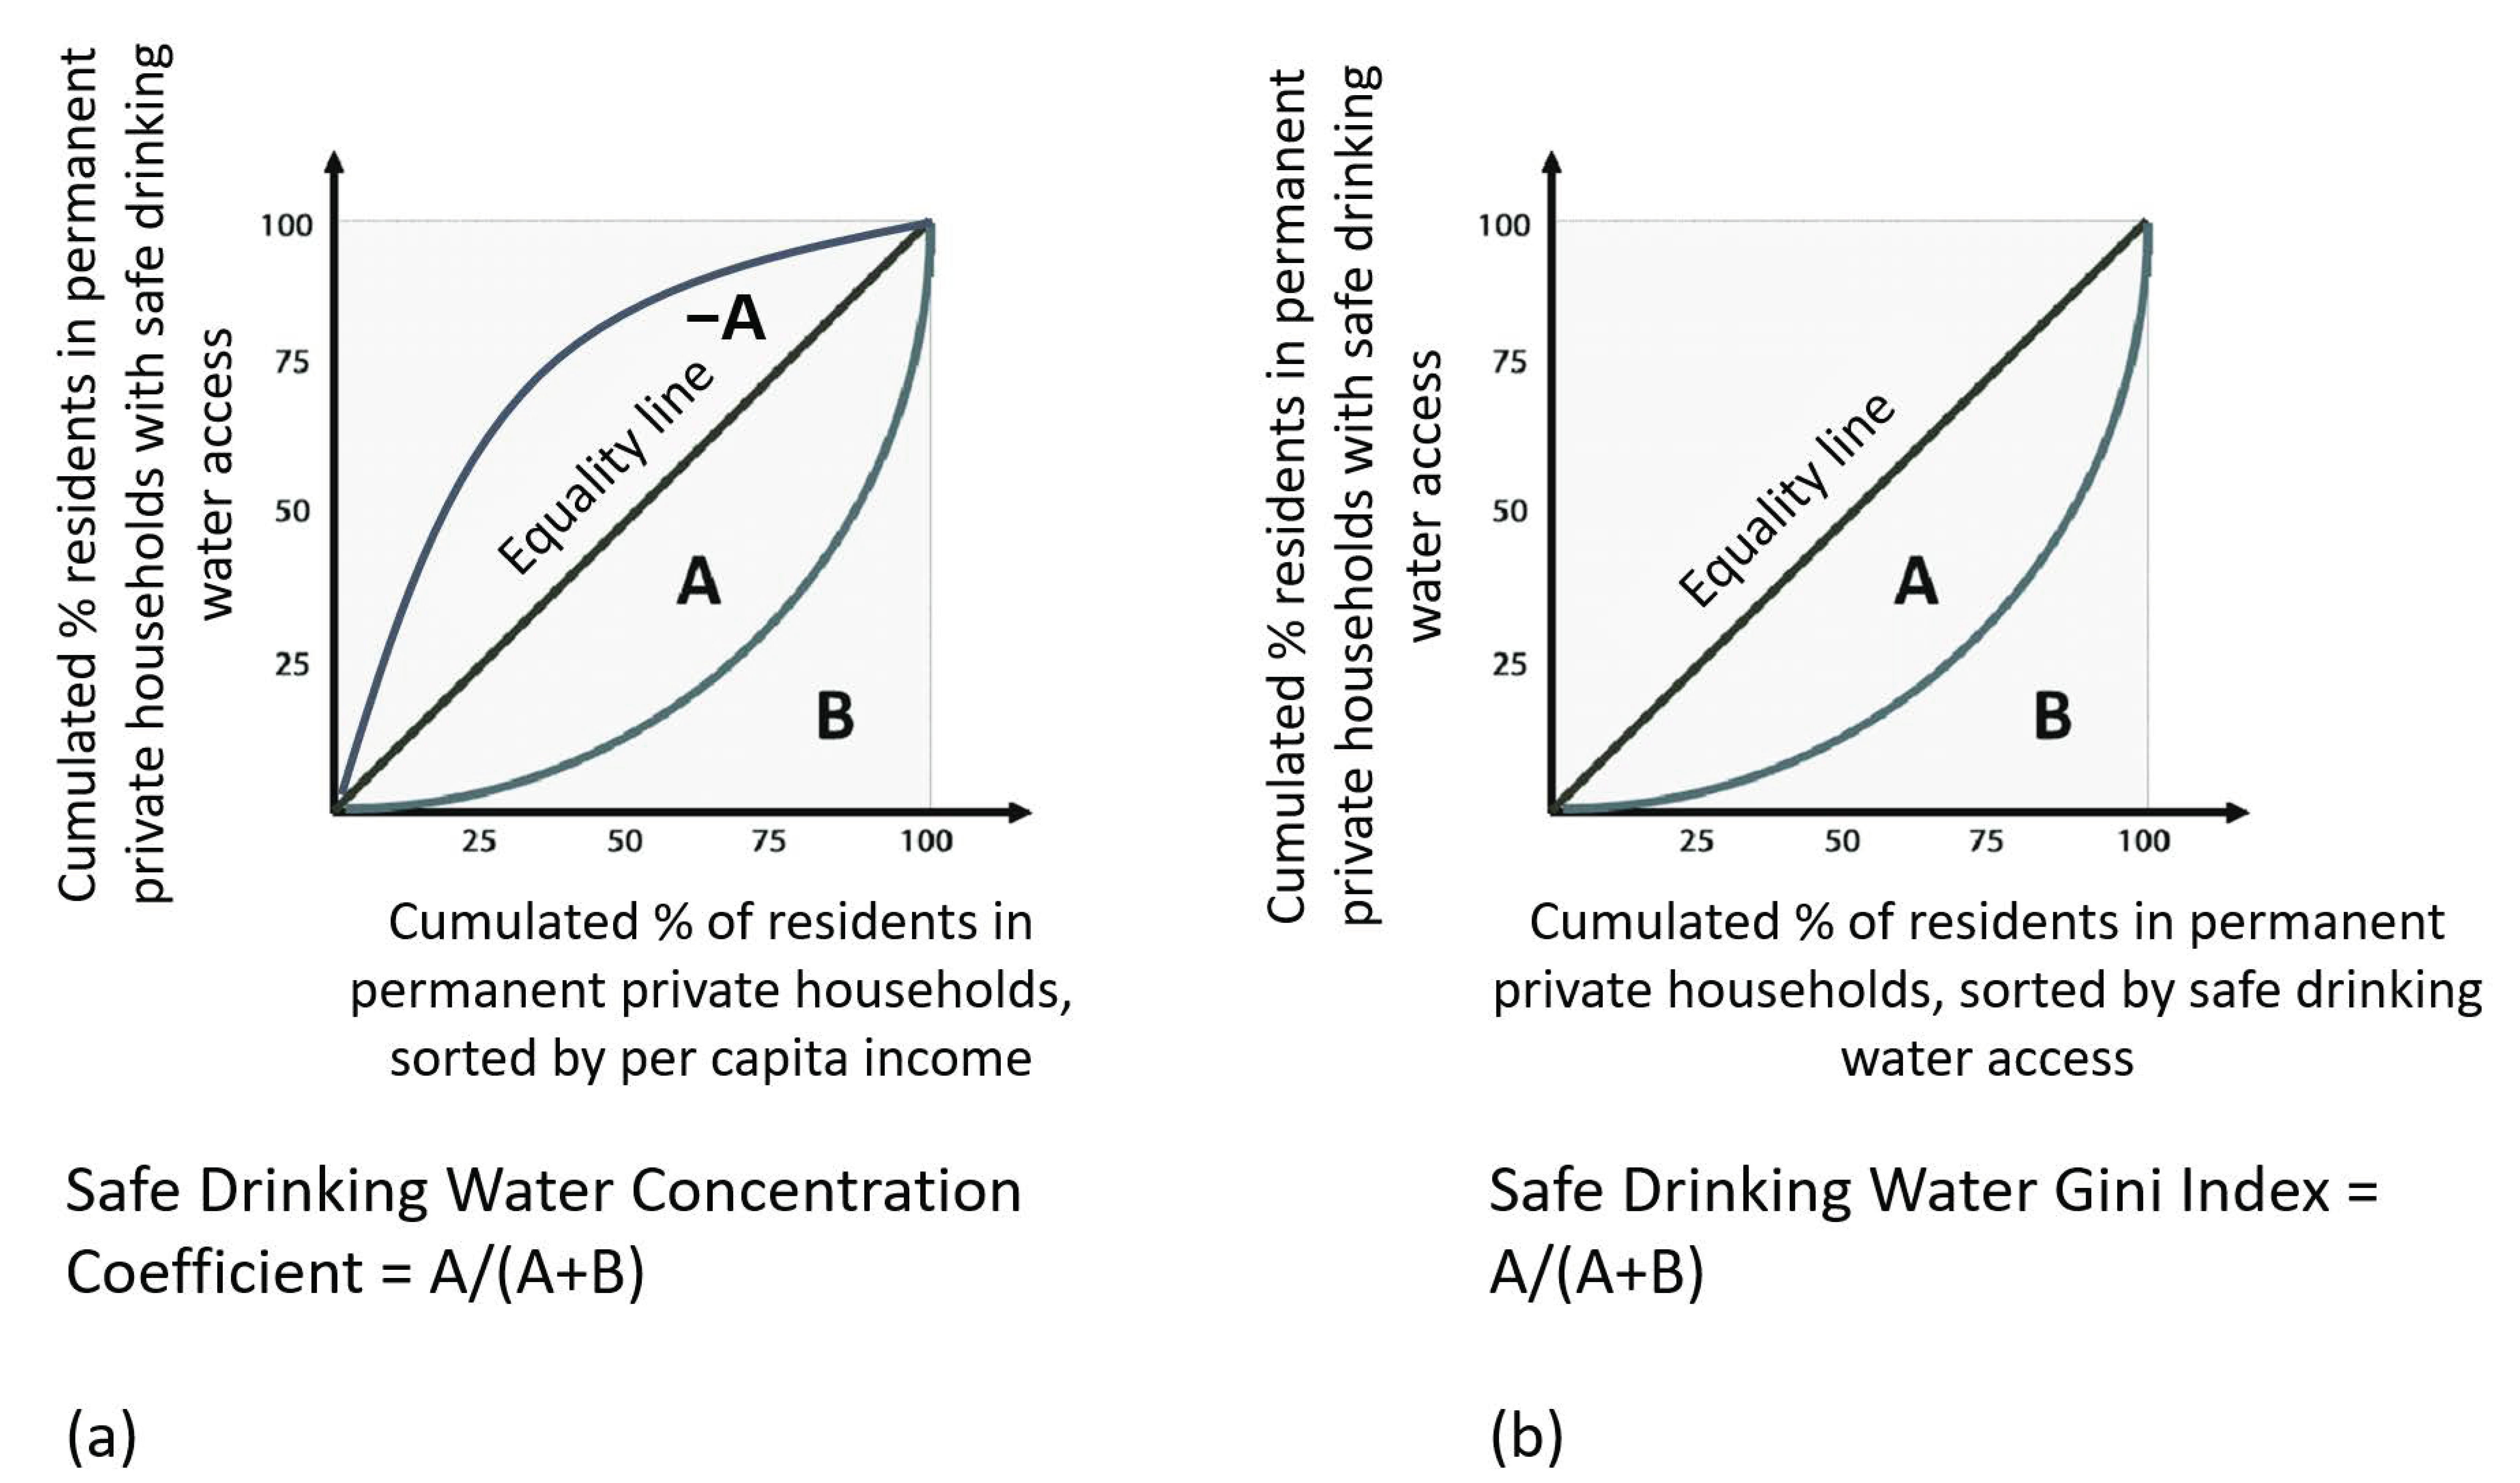
The Lorenz curve, a cumulative frequency curve, compares the distribution of a specific variable with a uniform distribution that represents equality. The Gini index is twice the area between the Lorenz curve and a hypothetical straight line of equality. A Gini index equal to 0 represents perfect equality, while 1 implies total inequality. This study compares the cumulative total number of residents in permanent households and the cumulative “theoretical” residents in permanent households with safe access to drinking water. The Lorenz curves adapted in both cases were developed for all municipalities, plotting data from the respective census tracts.
The difference between the Gini index and the concentration coefficient adapted for safe drinking water access lies in the population ranking: the first index is organized according to the rate of drinking water access, and the second, the average per capita income to assess the inequality in access to drinking water by wealth groups (Figure 2). The average per capita income was obtained from the ratio between the total nominal monthly income and the number of residents of the permanent households of each census tracts. It is noteworthy that, unlike the Safe Drinking Water Gini Index (Gwater), the Safe Drinking Water Concentration Coefficient (Cwater) can be located above the equality line, with a favorable distribution to the poorest and a negative value.
The dissimilarity index is the summation of vertical deviations between the Lorenz curve and the line of perfect equality. As such, all the inequality indices adapted for safe drinking water access are instruments to assess how far the population distribution is from the line of equality, which ensures that the entire population would have access to safe drinking water; that is, higher or lower inequality in access to safe drinking water.
The Safe Drinking Water Concentration Index (Cwater) for each municipality was calculated using Equation (3), adapted from the work of Cetrulo et al. (2020) [8]:
C water = 1 i = 1 n p r i + 1 p r i t water norm i + 1 + t water norm i
where p r i stands for the percentage of residents in permanent private households ordered by the average per capita income, with Cwater ranging from −1 to 1.
In addition, Equation (4), adapted from World Bank (2005) [41], shows the calculation of the Gwater for each municipality:
G water = 1 i = 1 n p w i p w i 1 t water norm i + t water norm i 1
where p w i is the percentage of residents in permanent private households ordered by the weighted water access rate ( t water norm ) and Gwater ranging from 0 to 1.
The Gini index is known to be less sensitive to inequality in the tails of the distribution [42]. Another way to analyze inequalities is to calculate the ratio of the access rate between the most favored and most disadvantaged groups [5]. Sitthiyot and Holasut [42] recommend using indicators that relate the values between the richest and poorest in a complementary way to the Gini index. In this research, the ratios between the upper and lower quintiles (R80/20) were obtained for each municipality; that is, the relationship between the rates of safe drinking water access for permanent private households that represent 20% of the residents with the highest average per capita income (4th quintile, represented by Q4) and the most economically unfavorable 20% (1st quintile, represented by Q1) according to Equation (5), adapted from UN (2015) [43]:
R 80 / 20 = t water norm Q 4 t water norm Q 1
with R80/20 ranging from 0 to ∞. Obtaining the Safe Drinking Water Access Rate for each quintile was made possible by calculating the SWDA using Equation (3), but weighting the number of residents in permanent private households in each range of nominal monthly income available in the 2010 Demographic Census: no nominal monthly income, up to one eighth minimum wage, more than one eighth to one quarter minimum wage, more than one quarter to one half minimum wage, more than half to 1 minimum wage, more than 1 to 2 minimum wages, more than 2 to 3 minimum wages, more than 3 to 5 minimum wages, more than 5 to 10 minimum wages and more than 10 minimum wages (“minimum wage, fixed by law, nationally unified, capable of meeting your basic vital needs and those of your family with housing, food, education, health, leisure, clothing, hygiene, transportation and social security, with periodic readjustments that preserve your purchasing power, being prohibited its binding for any purpose” under the terms of the Federal Constitution (Section IV, Art. 7°)). The t water norm Q 1 and t water norm Q 4 values were obtained through the safe drinking water access of each group, the number of residents, and the percentage they represent.
Finally, the Safe Drinking Water Dissimilarity Index (Dwater) was obtained, as recommended by Queiroz et al. [9]. In their research, the explanatory variables considered to obtain the value of D were urban or rural status, indigenous grouping, literacy, and the educational level of the head of the household. The present study evaluated the disparity in access among residents in permanent private households from different quintiles of per capita income. The Dwater was calculated using the weighted average of the absolute difference in the Safe Drinking Water Access Rate for each quintile of the average per capita income and the average rate, according to Equation (6) [44]:
D water = 1 2 t water norm × i = 1 n β i t water norm i t water norm β i = 1
with βi standing for the proportion of group i in the sample, t water norm being the normalised mean safe drinking water access rate of the municipality, t water norm i being the normalized safe drinking water access rate of group i, with a value between 0 and 1; and n being the number of groups (n = 5), with Dwater values between 0 and 1. To calculate t water norm i , it was necessary to obtain the weighted average of safe drinking water access and the percentage of residents in permanent private households for each minimum wage range.
The Gini index, concentration coefficient, and dissimilarity index adapted for safe drinking water were calculated for Brazil’s municipalities, states, and regions. The results of these indexes were normalized according to the maximum and minimum values in order to ensure comparability. In the case of Cwater, normalization was based on its absolute value; there are access inequalities regardless of whether the outcome is favorable to the richest or the poorest (positive or negative). The inequality class categories of Chaudhuri and Roy [15], He et al. [20], Babuna et al. [22], Cha et al. [14], and Babuna et al. [30] were adapted to interpret the Gwater and Cwater results, as shown in Table 2. There is no specific reference in the literature that relates the range of Dwater values and inequality levels. For the comparative analysis between municipalities, the ranges of safe drinking water access, the typologies of the municipality (rural or urban), and the respective GDP per capita were considered.
QGIS geoprocessing software was used to present the results on maps as an aid to better understanding the spatial distribution of access to safe drinking water and access inequalities.

3. Results

This section shows the results of the qualitative–quantitative analysis of drinking water sources, the SDWA indexes, and the analysis of safe drinking water access inequalities: Gwater, Cwater, Dwater, and R80/20. A multi-level comparative analysis (municipalities–states–regions) was performed based on the municipalities’ typologies (urban or rural) and GDP per capita.

3.1. Process Analytical Hierarchy (AHP) Method

The application of the AHP method generated different weights for each drinking water source to complete Equation (1), obtaining Equation (7). The pair-wise comparison matrices are shown in Tables S3–S8 of the Supplementary Materials. The consistency ratio was 4.2%, indicating the logical consistency of the judgments.
t water = 0.376 × t piped + 0.309 × t well + 0.274 × t cistern + 0.041 × t others 0.041 t water 0.376 t piped + t well + t cistern + t others = 1                    

3.2. Safe Drinking Water Access Index (SDWA)

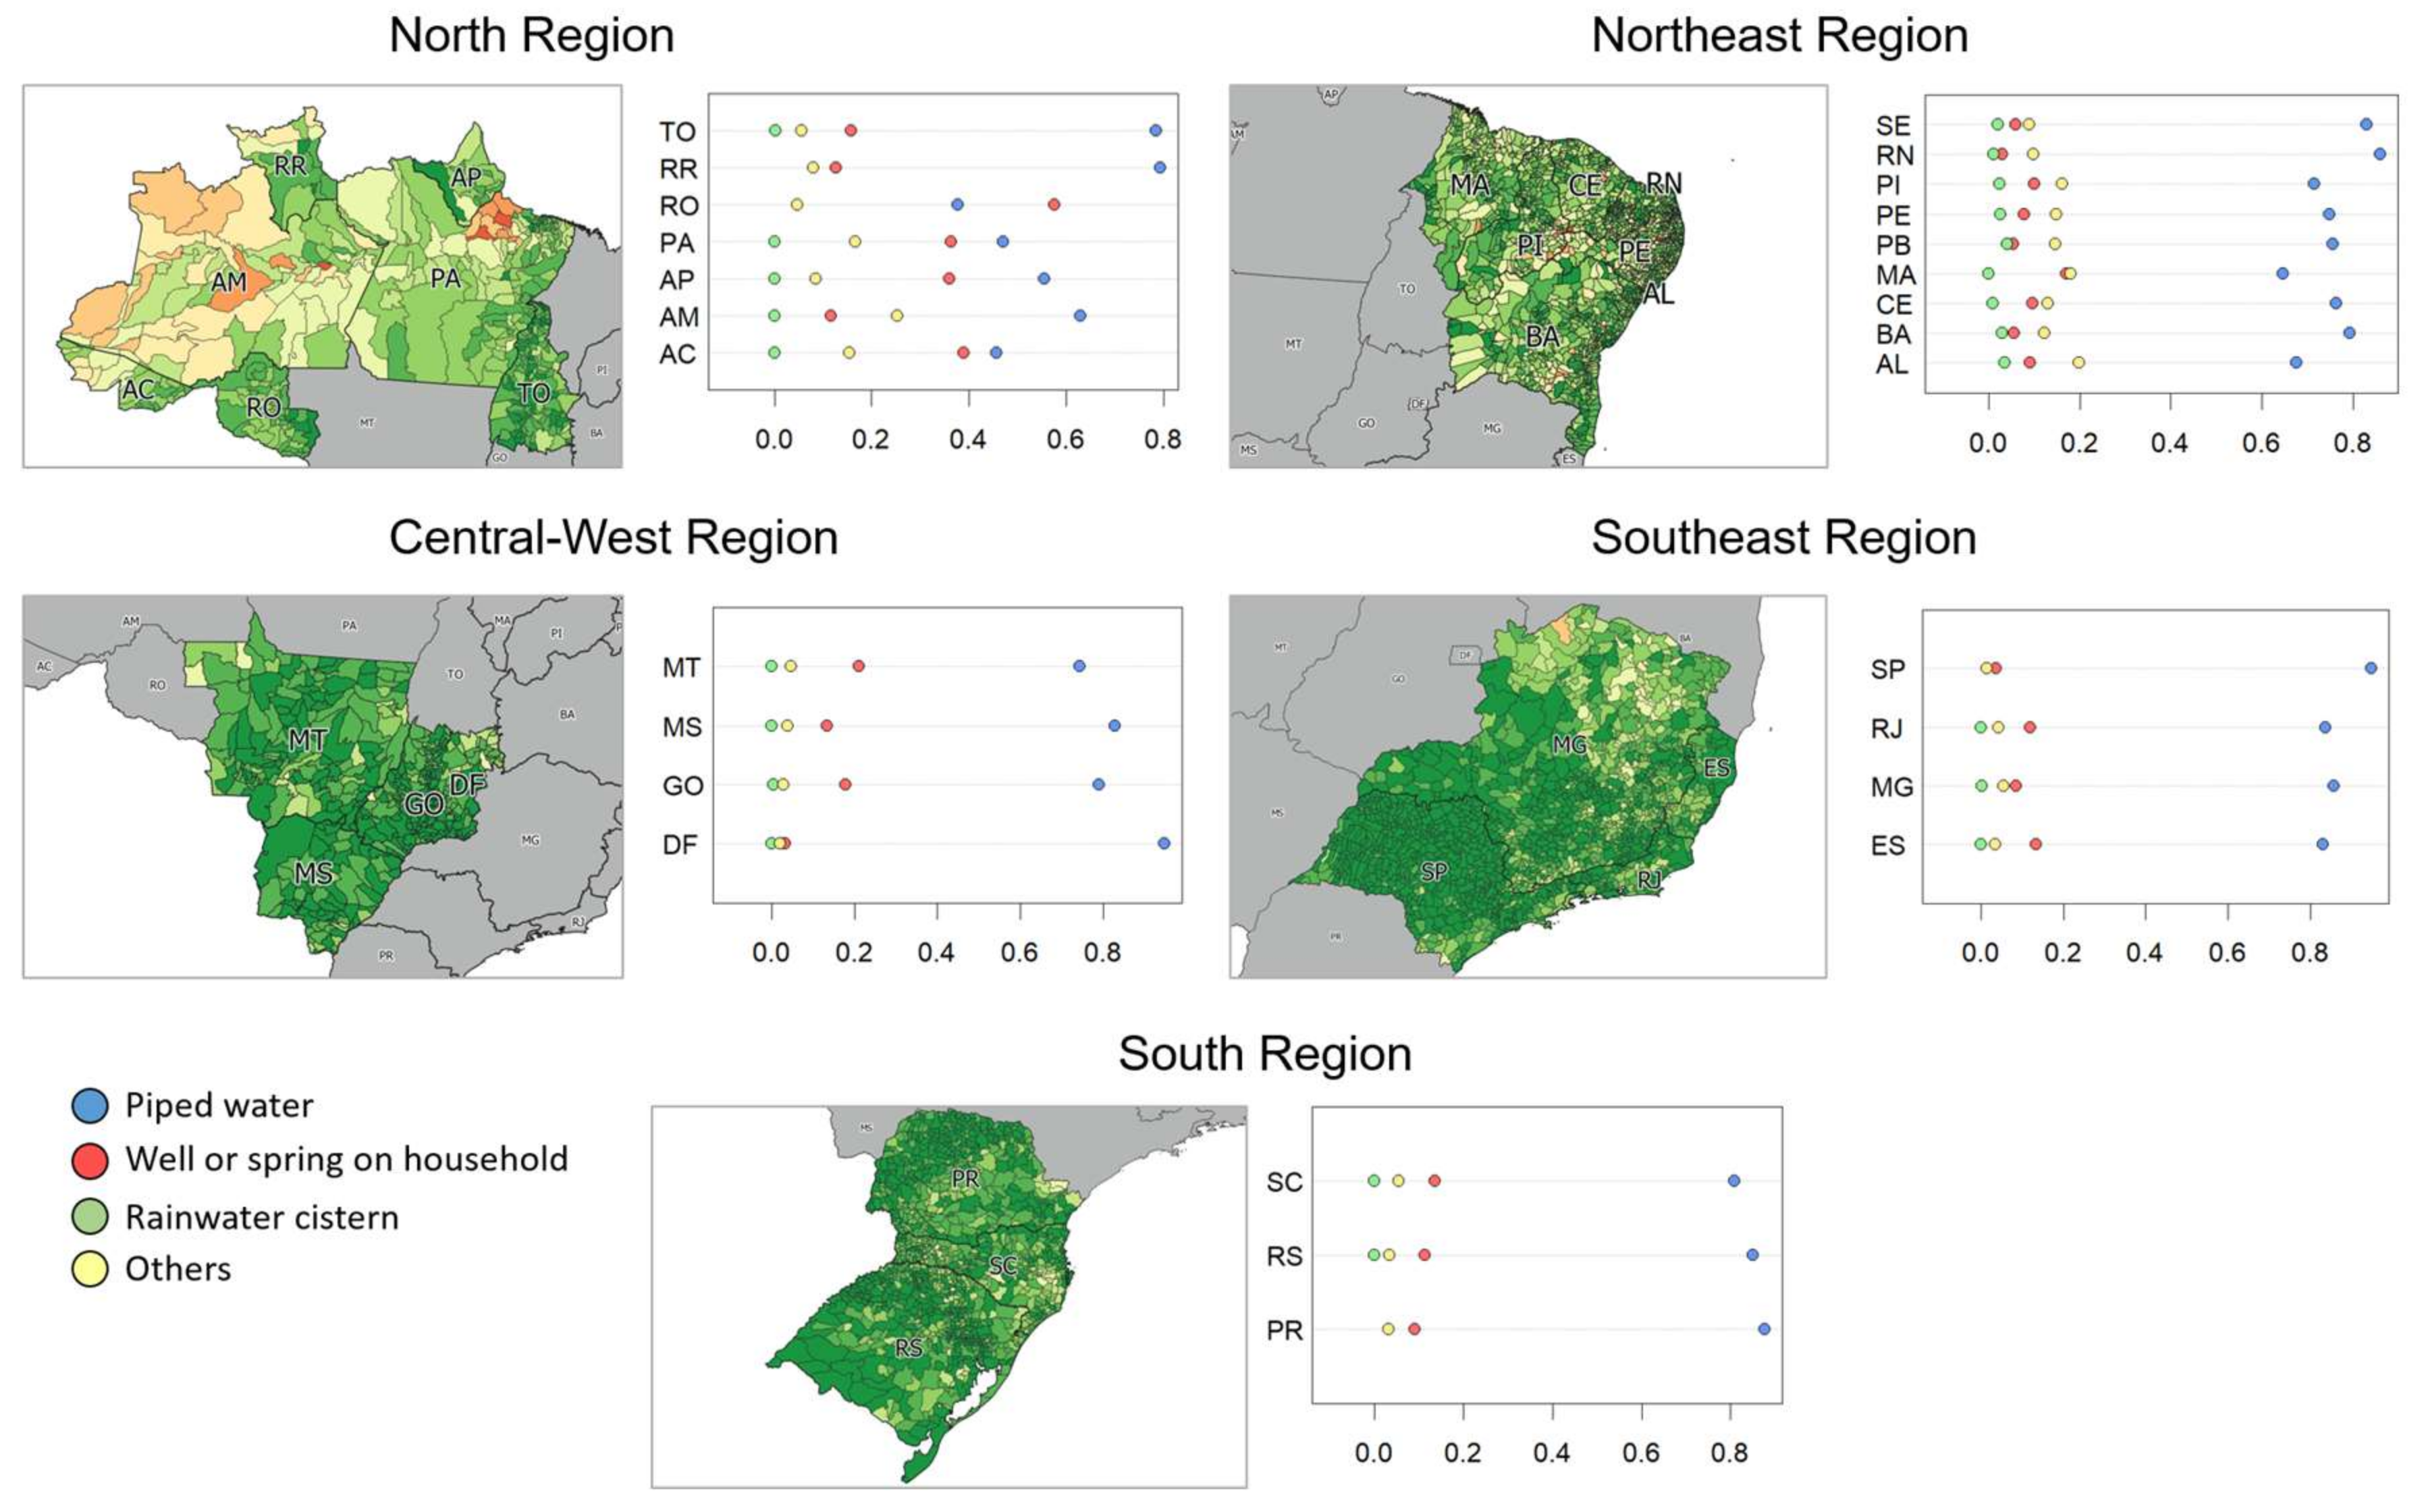
In Brazil, 38.1% of municipalities have SDWA values greater than 0.9, and 84.8% have values greater than 0.7. These same municipalities have low inequality in terms of safe water access. This value is 93.4% in the southeast region, 94.6% in the southern region, 96.3% in the midwest region, 69.7% in the northeast region, and 72.8% in the northern region. Figure 3 shows the results of the SDWA index for each municipality, as well as graphs of the weighted average access to drinking water in the form of piped water, a well or spring on the property, a rainwater cistern, or other means, for each state. The north and northeast regions showed the lowest values due to significant contributions from wells or other forms, i.e., a well or source outside the property, a tank car, a river, dam, lake, or stream, or another form of water supply. It is worth mentioning that the northeast region has the highest contribution of cisterns, even if in a small proportion, considering that periodic drought and water scarcity characterize the Brazilian semi-arid region. In the northern region, with the population sparsely distributed across large areas along the riverside and indigenous areas, rivers and streams represent a significant portion of the drinking water sources in some municipalities. The southeast region and the federal district, the seat of the federal government, had the highest rates of safe drinking water access.

3.3. Inequalities Index

Figure 4 shows the boxplot graphs of the inequality indices of safe drinking water access by state and region. Generally, one can observe that the highest levels of inequality are found in the north and northeast regions, and the lowest are in the central west, southeast, and southern regions. Cwater and R80/20 showed more significant variations between the maximum and minimum values. Some negative results may explain the range of Cwater results. In other words, safe access to drinking water is more favorable for the lower-income population. The magnitude of R80/20 is because its value limits, within [0, ∞], reached a maximum value of 11.4 in a northern municipality; that is, the wealthiest 20% of residents in permanent private households have safe drinking water access 11.4 times greater than the poorest 20%. Although regions with the highest SDWA values are expected to have the lowest inequality indices, significant disparities between municipalities in the same state and regions were found, as shown in Figure 4.
The data showed Gwater greater than 0.4 in 2.4% of Brazilian municipalities. In the northern region, 12% of the municipalities presented significant inequalities in terms of safe water access; meanwhile, in the northeast region, the value was 3.7%. In the other regions, the share of municipalities with high Gwater values represented less than 1% of municipalities. The results from the AM state deserve to be highlighted: 53.2% of the municipalities presented a value between 0.4 and 0.5 or greater than 0.5; that is, there was a considerable disparity in safe drinking water access among residents. Approximately 91.0% of the municipalities with values greater than 0.4 were concentrated in the northeast and northern regions. Among municipalities with a Gwater value between 0.4 and 0.5 or greater than 0.5, 87.2% are rural, and 94.0% have per capita GDP lower than the state average. As for the Cwater data, 1.1% of Brazilian municipalities had Cwater higher than 0.4 and 92.0% were in the north and northeast regions. Only two municipalities with values greater than 0.4 were urban, and almost 92.0% had a per capita GDP lower than the state average. In this research, 75% of Brazilian municipalities presented Gwater values higher than Cwater, i.e., the inequality of safe water access related to income is lower than the inequality in safe water access.
In all regions and states, municipalities with a high access disparity between the richest and poorest quintiles were observed by analyzing the R80/20 results. In the north and northeast regions, in 17.8% and 6.8% of the municipalities, respectively, residents of the quintile with the highest per capita income have safe water access at least two times higher than that of residents of the quintile with the lowest per capita income. In the central-west, southeast, and southern regions, these municipalities represent 1.7%, 1.2%, and 0.7%, respectively. Over 1.0% of Brazilian municipalities had values greater than 2.0, i.e., the safe access to drinking water for 20% of residents with the highest per capita incomes was at least twice as high as that of the 20% most economically disadvantaged. Moreover, 80% of the municipalities with values greater than 2.0 were in states of the northern region (AC, AM, and RR). Most municipalities with values greater than 2.0 had a per capita GDP lower than the state average (93.3%) and were rural (83.3%).
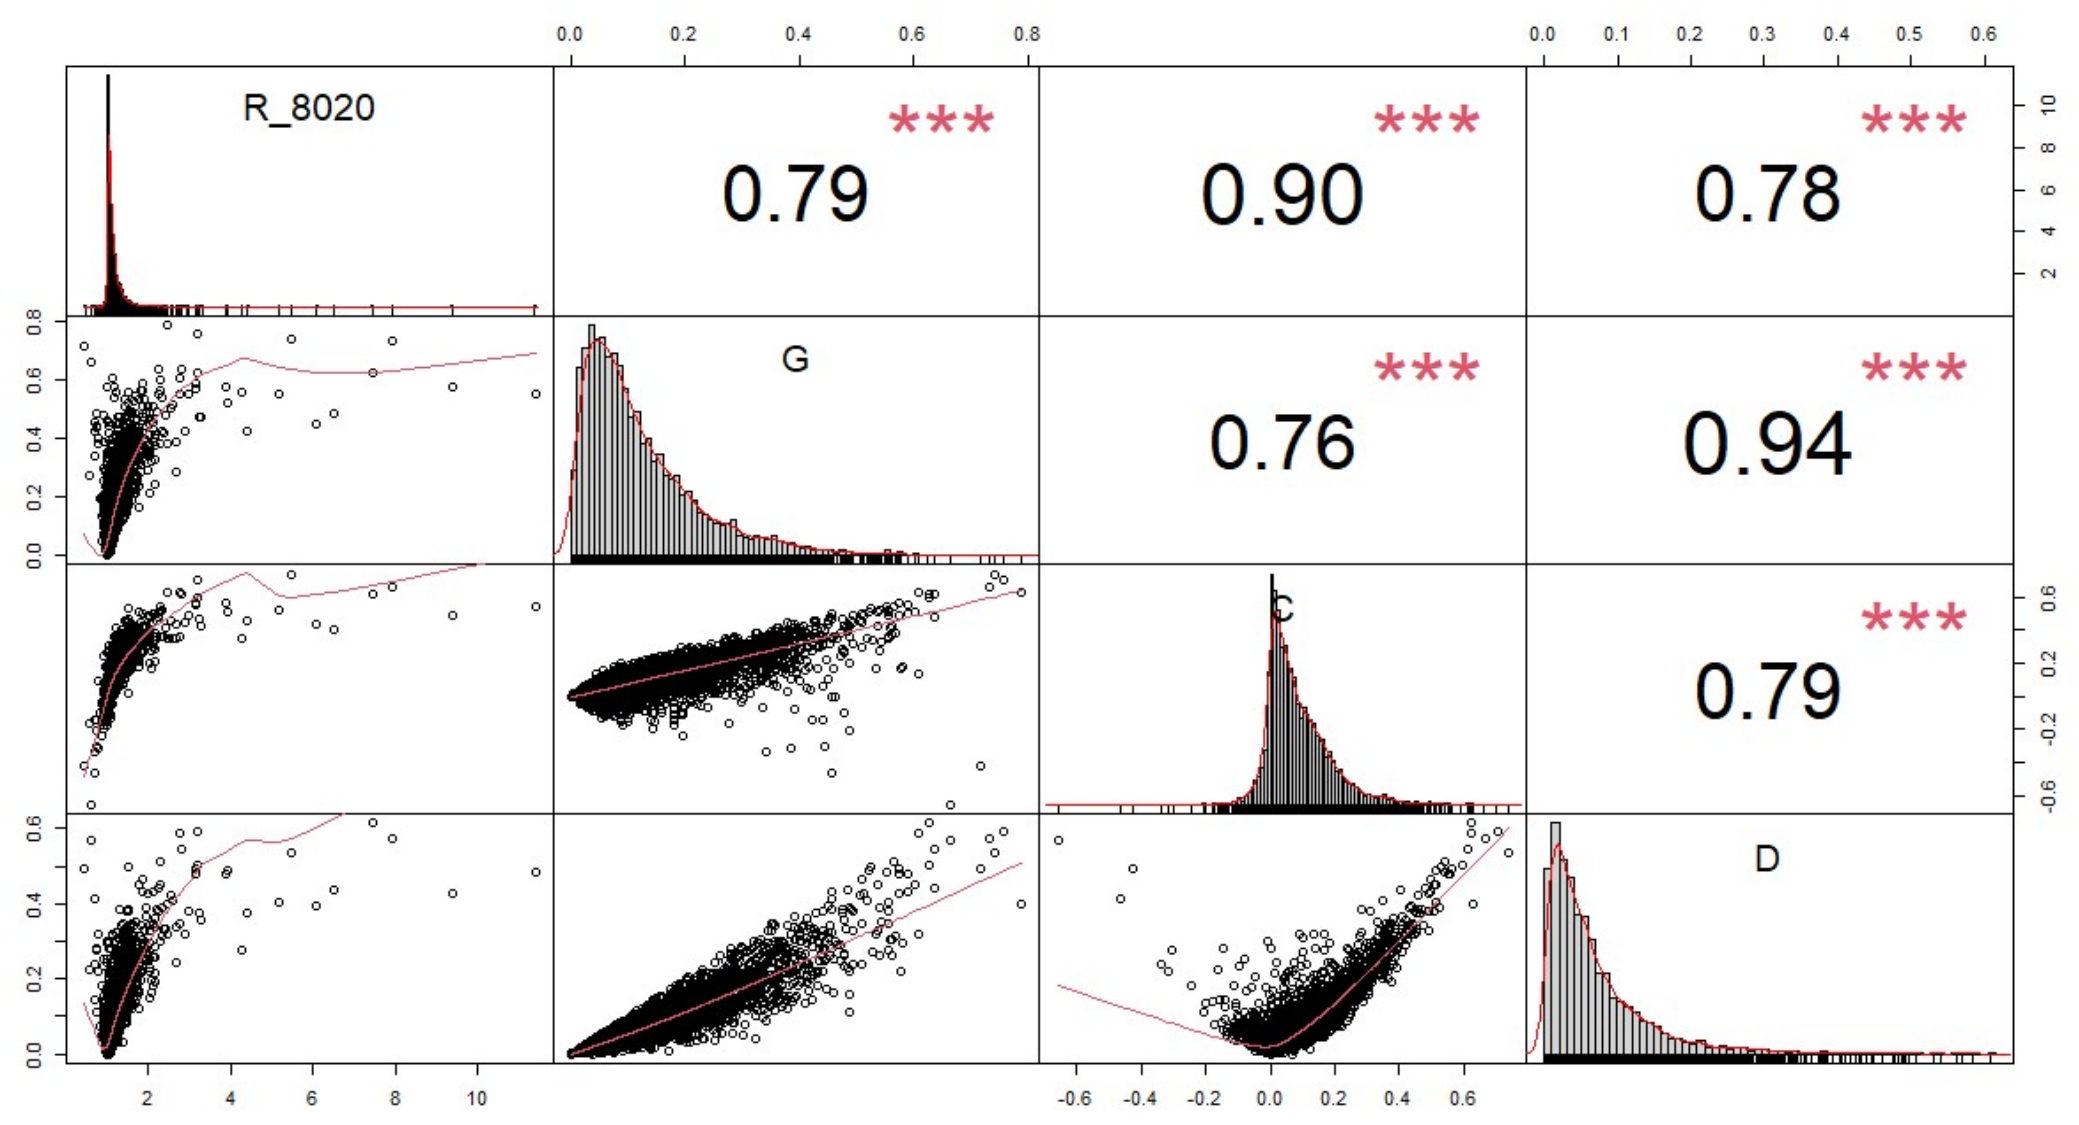
The municipalities with high values for Dwater also presented high values for Gwater and Cwater. Dwater values above 0.5 are also related to Gwater and Cwater above 0.5; that is, it would be necessary to redistribute safe water access for 50% of the population to guarantee equity. Dwater values above 0.4 also have Gwater and Cwater above 0.4. Dwater values above 0.3 also have Gwater values above 0.3. A similarity between the inequality categorizations of Gwater and Cwater is noticeable. The opposite does not occur. Several municipalities with high values of Gwater and Cwater presented reduced Dwater values. This suggests that Gwater and Cwater revealed more safe water access inequalities than Dwater values.
Figure 5 depicts the SDWA values as a function of the quintile of per capita income for the regions of Brazil, with each colored line representing a state of the region. There was a significant discrepancy between the quintiles of per capita income, primarily in the north and northeast regions.
Figure 6 shows the radar charts of normalized SDWA, Gwater, Cwater, R80/20, and Dwater as a function of the SDWA indicator values’ range. All municipalities with over 80% safe drinking water access had low rates of inequality of access, as expected. Table 3 shows decreasing inequality indices for municipalities in each SDWA range: up to 40%, between 40% and 60%, and between 60% and 80% safe drinking water access. The amplitude of these index values is considerable. This fact reinforces the importance of considering inequalities in access and safe drinking water access to discriminate between municipalities with similar access values that differ in their distribution among income population groups and throughout the territory.
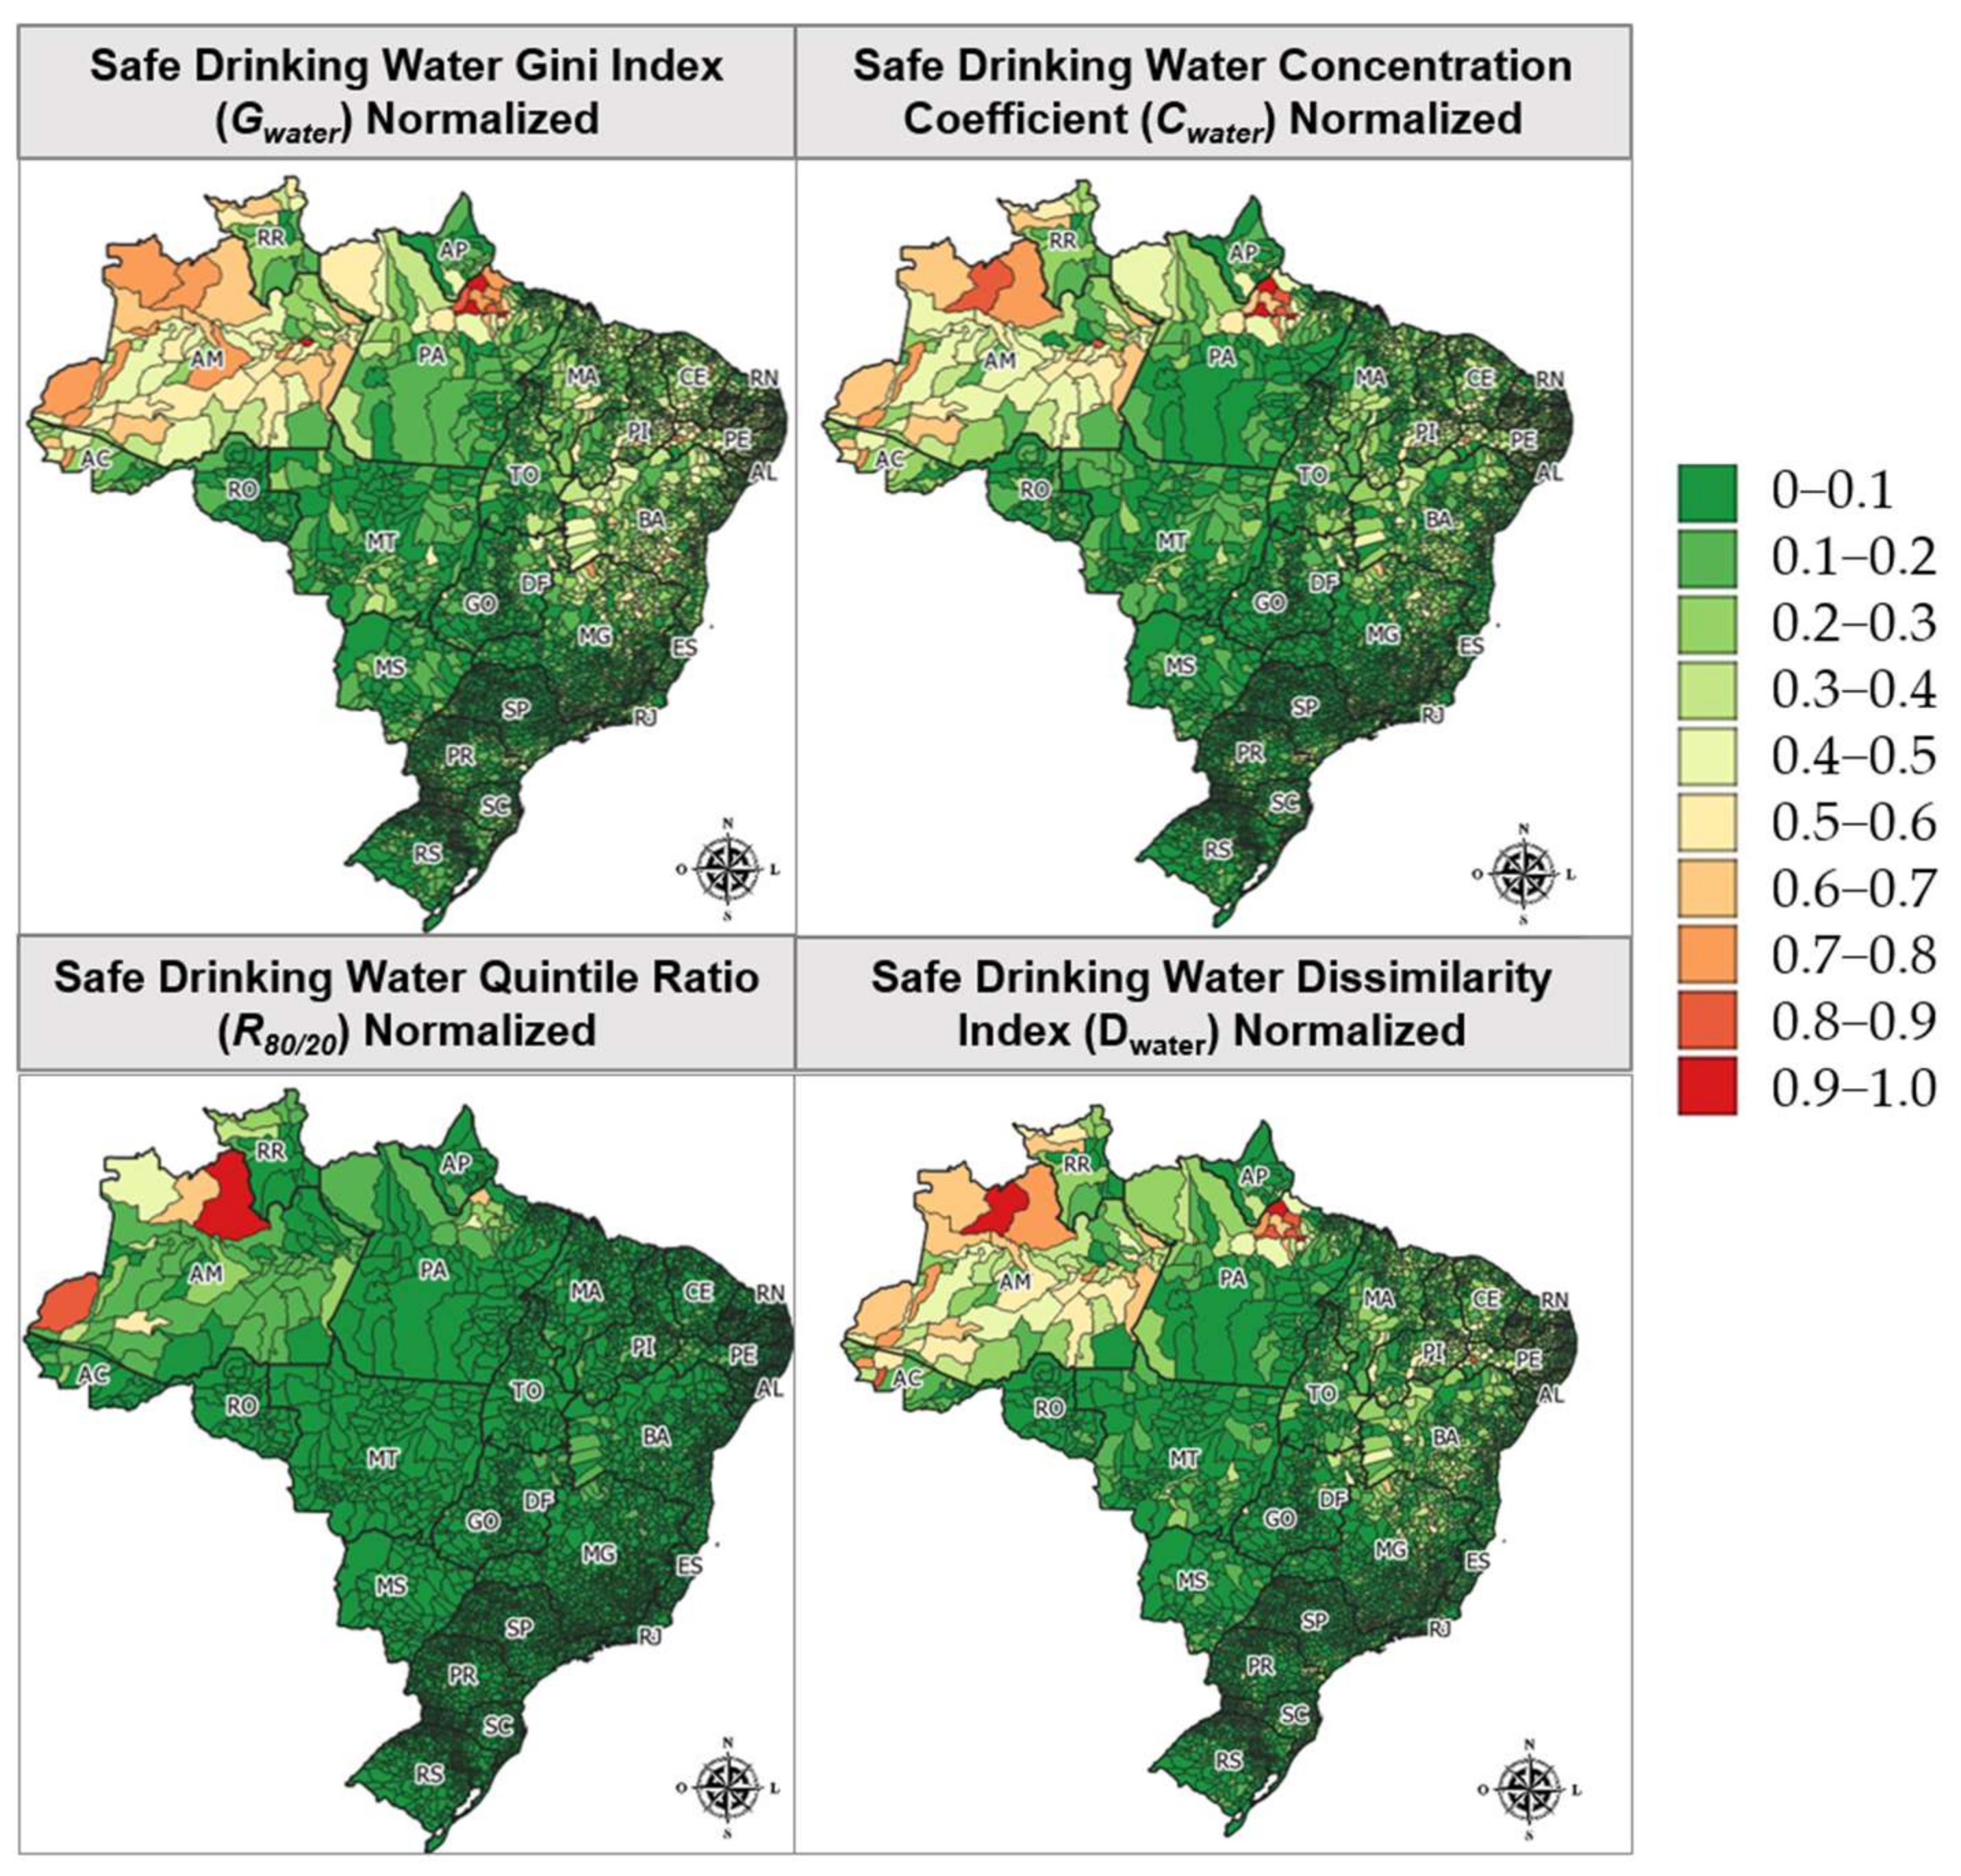
Figure 7 shows the maps with the results of the normalized inequality indexes. With the normalization of the results of the inequality indices and subsequent comparative analysis, it can be concluded that they behave similarly and are correlated. This is evidenced by the high correlation between variables, according to the Spearman method, as shown in the correlogram in Figure 8. In the case of R80/20, normalization softens the disparities in access between the richest and poorest of most municipalities, since it ranges from 0 to ∞ and high values were recorded. It is possible to visualize in the histograms that the Gwater results are less concentrated. This was confirmed by the kurtosis calculations: 3.76 (Gwater), 4.38 (Cwater), 8.27 (Dwater), and 347.22 (R80/20). Although all present leptokurtic distribution, i.e., the curve is more tapered than the normal distribution; the Gwater results are more distributed, making access disparities more evident.

4. Discussion

The authors recommend using the Gwater inequality index with the SDWA in drinking water access studies due to there being (i) more evident inequalities through these results and (ii) more accessible data obtained and easier calculation methods than for Cwater and Dwater. The independence of income data facilitates international comparisons considering different socioeconomic realities and the stratification of countries’ wealth groups. Cetrulo et al. [8] have already observed that quantile disaggregation can hide inequalities and that the comparison between countries can be complicated. The Cwater metric may present negative results, or the respective concentration curve may cross the line of equality, making it difficult to interpret and manipulate results, a limitation also noted by Cetrulo et al. [8].
The results indicate that 75% of the municipalities presented an inequality of safe water access related to an income lower than the inequality in safe water access (Gwater higher than Cwater). In a similar way, Malakar and Mishra (2017) observed that income-related water inequality is lower than total inequality in water use, obtaining an adapted concentration coefficient (0.35) lower than the adapted Gini Index (0.41) in a comparison of 30 countries [17].
The lowest values of the SDWA indexes and the highest values of the Gwater index were obtained in the northeast and northern regions due to the socioeconomic disparity between the regions of Brazil, as is consistent with research results from Berthe [12] and Cetrulo et al. [8]. These two regions also represent the regions with the highest and lowest water availability: the north and northeast regions, respectively. This fact shows that the lack of water access is related to issues beyond the availability of water, encompassing management and politics.
In addition to reflecting the country’s regional inequalities due to historical and socioeconomic issues, over 65% of the municipalities in these regions were characterized as rural. The configuration of the spatial distribution of rural households, the lower demographic densities, and the users’ lower payment capabilities are challenges for basic sanitation solutions. The highest results of the inequality indexes occurred in rural municipalities, with per capita GDP lower than the corresponding state average. The differences between urban and rural areas have already been pointed out by Berthe [12], Chaudhuri and Roy [15], Roche et al. [18], Cole et al. [13], and Malakar et al. [19]. The Brazilian experience has shown that, as well as top-down actions through policies and programs, bottom-up initiatives are important for improvements in safe drinking water access for rural population, with local solutions and community engagement [45]. The use of microdata and data mining was essential to developing a more detailed picture of safe drinking water access disparities in Brazilian municipalities, reducing the scale effect. Supplementary Figures S1 and S2 show the Lorenz curves of Gwater and Cwater for each region and the states and municipalities with the lowest and highest values for each region. It is possible to verify in the literature how inequality indexes are markedly influenced by the scale effect, with access disparities minimised at the state and regional levels [13,14]. In Brazil, all previous studies were conducted at the scale of the country, region, state, and/or capital [8,9,12].
The limitations of this research relate to the fact that the information might not represent the most up-to-date situation, as the last Brazilian census occurred in 2010. Moreover, the census data on drinking water sources focuses on physical access, considering neither the water quality itself, nor the quality of supply services [9]. The estimate of safe drinking water access rates was based on differentiated weights for each drinking water source, considering access, quantity, and quality obtained by the AHP method. The authors defined the judgments of pair-wise comparisons and suggested that this could be improved, for example, by consulting experts. Data mining allowed the analysis of large datasets efficiently, considering information at a more detailed and refined scale, and pattern identification of safe water access in Brazilian municipalities. The main limitation of this research method is the possibility of erroneous conclusions and trends due to coincidence occurrence, which reinforces the importance of the theoretical background and knowledge of the data.
Figure 9 shows the relation between SDWA and the Gwater index for the regions of Brazil, depending on the typology (urban or rural), the population, and the per capita GDP of the municipality. Addressing inequalities together with drinking water access discriminates between municipalities with similar rates of safe drinking water access but with differences in access inequalities, distinguishing those: (i) with high inequalities and low safe drinking water access, in red; (ii) with moderate inequalities and reduced access to safe drinking water, in orange; (iii) with low inequalities and low access to safe drinking water, in yellow; and (iv) equality of access and high access to safe water, in green.
To illustrate an application of this concept, Figure 10 shows the Lorenz curves of two municipalities with, respectively, 102,033 and 99,075 inhabitants with SDWA values of 72.8%. The distribution of safe water access is more equitable in municipality (b) since a considerable portion of sectors have majority access to a well or spring on the property. Meanwhile, in municipality (a), a significant number of census tracts identify other forms of water supply. Considering 40% of the total accumulated population (x-axis), there is a representative percentage of the population with safe drinking water access of approximately 15% in municipality (a) and 30% in municipality (b).
The comparison of international studies that applied inequality indices derived from the Lorenz curve (Table S1) revealed that they are similar and different in some respects due to research objectives and index adaptations. An official recommendation by an international institution for the standardization of these instruments and the delimitation of inequality class breaks would facilitate its application and comparison between studies, similar to that seen in the field of health [46,47,48].
Future studies could update the present findings because data from the next census are being collected between 2022 and 2023. It is suggested to obtain the inequality indices in drinking water access for administrative regions of metropolises and capitals, since adapted socioeconomic indices were found to be sensitive to population size [34]. Nevertheless, future studies could differentiate the results between urban and rural areas based on the classification of each census tract according to 2010 Demographic Census instead of using the classification of rural and urban municipalities proposed by the IBGE for a more refined perspective on this issue. There is a need to analyze inequalities in access to sanitation, which is likely to result in greater inequalities. In Brazil, 43% of the population has sewage collection and treatment and 12% use a septic tank, i.e., only 55% have adequate sanitation access according to estimates by the National Water Agency in 2017 [49].

5. Conclusions

The research accomplished its objective and contributed to the literature by undertaking an unprecedented analysis of the spatial inequalities in access to safe drinking water for all Brazilian municipalities to develop a more detailed picture and minimize the scale effect due to the country heterogeneity. Safe drinking water access and its inequalities end up reflecting socioeconomic disparities between the different regions of the country, so the highest values of inequality indexes were concentrated in the north and northeast regions. Rural areas represent bottlenecks in the universal provision of safe drinking water in Brazil. The most significant disparities in safe drinking water access occurred in rural municipalities with a per capita GDP lower than the state average. Addressing inequalities together with drinking water access discriminates between municipalities with similar rates of safe drinking water access but with differences in access inequalities. The amplitude of inequality index results was pronounced when considering the same regions or SDWA range, revealing inequalities that were not visible with average statistics.
The proposed method of analysis could also be adapted for replication in other countries. In terms of practical implications, it may be that these inequality indexes represent a potential tool to priorities actions that expand the full right to drinking water to all citizens and may subsidize the monitoring of the SDG 6 goals. The lack of safe water access and poverty are mutually reinforcing. Access to safe water is crucial to reducing poverty, but poverty makes access to safe water more difficult. The issues of sanitation, poverty, environmental degradation, and public health are interrelated. Understanding inequalities in water access will help identify the areas most vulnerable to the transmission of disease, which can proliferate with weaknesses in basic sanitation, as in the ongoing COVID-19 pandemic. Recent events in the Amazon involving illegal mercury mining, which have created a sanitary emergency in the Yanomamis indigenous area, revealed the importance of improving access to safe drinking water, even in remote areas.

Supplementary Materials

The following supporting information can be downloaded at: https://www.mdpi.com/article/10.3390/w15081620/s1, Figure S1. Lorenz Curves adapted to safe drinking water access of Brazil’s Regions, UFs and municipalities with the lowest and highest values of Gwater. Figure S2. Concentration Curves adapted to safe drinking water access of Brazil’s Regions, UFs and municipalities with the lowest and highest values of Cwater.; Table S1. Comparison between studies that use inequality indices based on Lorenz Curve and Dissimilarity Index to analyze drinking water access inequalities. Table S2. Adapted Saaty scale. Table S3. Pairwise comparisons between sub-criterions and weights of the AHP Method. Table S4. Pairwise comparisons between water sources for each sub-criterion of the AHP Method.

Author Contributions

Investigation, F.S.M.d.J.; Writing—original draft, F.S.M.d.J.; Writing—review & editing, A.M.V.M. and J.T.; Supervision, A.M.V.M. and J.T. All authors have read and agreed to the published version of the manuscript.

Funding

This study was financed in part by the Coordenação de Aperfeiçoamento de Pessoal de Nível Superior—Brasil (CAPES)—Finance Code 001.

Data Availability Statement

The data presented in this study are openly available in Zenodo at DOI 10.5281/zenodo.7603917.

Conflicts of Interest

The authors declare no conflict of interest. The funders had no role in the design of the study; in the collection, analyses, or interpretation of data; in the writing of the manuscript; or in the decision to publish the results.

Abbreviations

AHPProcess Analytical Hierarchy
CwaterSafe Drinking Water Concentration Coefficient
DwaterSafe Drinking Water Dissimilarity Index
GDPGross Domestic Product
GwaterSafe Drinking Water Gini Index
IBGEBrazilian Institute of Geography and Statistics
JMPJoint Monitoring Program for Water Supply, Sanitation and Hygiene
MDGsMillennium Development Goals
PLANSABNational Plan of Basic Sanitation
PNADNational Household Sampling Survey
R80/20Ratios between Upper and Lower Quintiles
SDGsSustainable Development Goals
SDWASafe Drinking Water Access Index
SNISNational Sanitation Information
UFFederal Units
UNICEFUnited Nations International Children’s Emergency Fund
WHOWorld Health Organization

References

  1. United Nations General Assembly. Resolution A/RES/64/292. The Human Right to Water and Sanitation. 2010. Available online: https://documents-dds-ny.un.org/doc/UNDOC/GEN/N09/479/35/PDF/N0947935.pdf?OpenElement (accessed on 30 January 2023).
  2. United Nations. The Human Right to Water and Sanitation Milestones. Available online: https://www.un.org/waterforlifedecade/pdf/human_right_to_water_and_sanitation_milestones.pdf (accessed on 30 January 2023).
  3. United Nations General Assembly. Resolution A/RES/70/1. Transforming Our World: The 2030 Agenda for Sustainable Development. 2015. Available online: https://documents-dds-ny.un.org/doc/UNDOC/GEN/N15/291/89/PDF/N1529189.pdf?OpenElement (accessed on 30 January 2023).
  4. United Nations (UN). The Millennium Development Goals Report 2015; United Nations: New York, NY, USA, 2015. [Google Scholar]
  5. World Health Organization (WHO). United Nations Children’s Fund (UNICEF) Progress on Household Drinking Water, Sanitation and Hygiene 2000–2020: Five Years into the SDGs 2021; WHO: Geneva, Switzerland, 2021. [Google Scholar]
  6. Ministério do Desenvolvimento Regional. Secretaria Nacional de Saneamento (SNS) Plano Nacional de Saneamento Básico 2019; MDR/SNS: Brasilia, Brazil, 2019; p. 239.
  7. Morales-Novelo, J.A.; Rodríguez-Tapia, L.; Revollo-Fernández, D.A. Inequality in Access to Drinkingwater and Subsidies between Low and High Income Households in Mexico City. Water 2018, 10, 1023. [Google Scholar] [CrossRef]
  8. Cetrulo, T.B.; Marques, R.C.; Malheiros, T.F.; Cetrulo, N.M. Monitoring Inequality in Water Access: Challenges for the 2030 Agenda for Sustainable Development. Sci. Total Environ. 2020, 727, 138746. [Google Scholar] [CrossRef]
  9. Queiroz, V.C.; de Carvalho, R.C.; Heller, L. New Approaches to Monitor Inequalities in Access to Water and Sanitation: The SDGs in Latin America and the Caribbean. Water 2020, 12, 931. [Google Scholar] [CrossRef]
  10. Cowell, F. Measuring Inequality, 3rd ed.; Oxford University Press: Oxford, UK, 2011; ISBN 9780199594030. [Google Scholar]
  11. World Health Organization (WHO); United Nations Children’s Fund (UNICEF). Inequalities in Sanitation and Drinking Water in Latin America and the Caribbean; WHO: Geneva, Switzerland, 2016. [Google Scholar]
  12. Berthe, A. Mesurer Les Inégalités d’accès à l’eau et à l’assainissement Dans Le Nord et Le Nordeste Du Brésil: Quels Enseignements En Matière de Justice Sociale? Cah. du GREThA 2016, 7, 22. [Google Scholar]
  13. Cole, M.J.; Bailey, R.M.; Cullis, J.D.S.; New, M.G. Spatial Inequality in Water Access and Water Use in South Africa. Water Policy 2018, 20, 37–52. [Google Scholar] [CrossRef]
  14. Cha, S.; Jin, Y.; Elhag, M.S.; Kim, Y.; Ahmed Ismail, H.A.H. Unequal Geographic Distribution of Water and Sanitation at the Household and School Level in Sudan. PLoS ONE 2021, 16, e0258418. [Google Scholar] [CrossRef]
  15. Chaudhuri, S.; Roy, M. Rural-Urban Spatial Inequality in Water and Sanitation Facilities in India: A Cross-Sectional Study from Household to National Level. Appl. Geogr. 2017, 85, 27–38. [Google Scholar] [CrossRef]
  16. Guragai, B.; Takizawa, S.; Hashimoto, T.; Oguma, K. Effects of Inequality of Supply Hours on Consumers’ Coping Strategies and Perceptions of Intermittent Water Supply in Kathmandu Valley, Nepal. Sci. Total Environ. 2017, 599, 431–441. [Google Scholar] [CrossRef]
  17. Malakar, K.; Mishra, T. Application of Gini, Theil and Concentration Indices for Assessing Water Use Inequality. Int. J. Soc. Econ. 2017, 44, 1335–1347. [Google Scholar] [CrossRef]
  18. Roche, R.; Bain, R.; Cumming, O. A Long Way to Go—Estimates of Combined Water, Sanitation and Hygiene Coverage for 25 Sub-Saharan African Countries. PLoS ONE 2017, 12, e0171783. [Google Scholar] [CrossRef]
  19. Malakar, K.; Mishra, T.; Patwardhan, A. Inequality in Water Supply in India: An Assessment Using the Gini and Theil Indices. Environ. Dev. Sustain. 2018, 20, 841–864. [Google Scholar] [CrossRef]
  20. He, W.J.; Lai, Y.S.; Karmacharya, B.M.; Dai, B.F.; Hao, Y.T.; Xu, D.R. Geographical Heterogeneity and Inequality of Access to Improved Drinking Water Supply and Sanitation in Nepal. Int. J. Equity Health 2018, 17, 1–14. [Google Scholar] [CrossRef] [PubMed]
  21. Fuller, M.; Dwivedi, P. Assessing Changes in Inequality for Millennium Development Goals among Countries: Lessons for the Sustainable Development Goals. Soc. Sci. 2019, 8, 207. [Google Scholar] [CrossRef]
  22. Babuna, P.; Yang, X.; Bian, D. Water Use Inequality and Efficiency Assessments in the Yangtze River Economic Delta of China. Water 2020, 12, 1709. [Google Scholar] [CrossRef]
  23. Bayu, T.; Kim, H.; Oki, T. Water Governance Contribution to Water and Sanitation Access Equality in Developing Countries. Water Resour. Res. 2020, 56, 1–13. [Google Scholar] [CrossRef]
  24. Indra, I.; Nazara, S.; Hartono, D.; Sumarto, S. Inequality of Opportunity among Indonesian School Children: Education, Electricity and Clean Water. Int. J. Dev. Issues 2020, 19, 119–144. [Google Scholar] [CrossRef]
  25. Hernández-Vasquéz, A.; Rojas-Roque, C.; Marques Sales, D.; Santero, M.; Bendezu-Quispe, G.; Barrientos-Gutiérrez, T.; Miranda, J.J. Inequalities in Access to Safe Drinking Water in Peruvian Households According to City Size: An Analysis from 2008 to 2018. Int. J. Equity Health 2021, 20, 1–11. [Google Scholar] [CrossRef]
  26. Oskam, M.J.; Pavlova, M.; Hongoro, C.; Groot, W. Socio-Economic Inequalities in Access to Drinking Water among Inhabitants of Informal Settlements in South Africa. Int. J. Environ. Res. Public Health 2021, 18, 10528. [Google Scholar] [CrossRef]
  27. Tasbasi, A. A Threefold Empirical Analysis of the Relationship between Regional Income Inequality and Water Equity Using Tapio Decoupling Model, WPAT Equation, and the Local Dissimilarity Index: Evidence from Bulgaria. Environ. Sci. Pollut. Res. 2021, 28, 4352–4365. [Google Scholar] [CrossRef]
  28. Yu, W.; Bain, R.E.S.; Yu, J.; Alegana, V.; Dotse-Gborgbortsi, W.; Lin, Y.; Wright, J.A. Mapping Access to Basic Hygiene Services in Low- and Middle-Income Countries: A Cross-Sectional Case Study of Geospatial Disparities. Appl. Geogr. 2021, 135, 102549. [Google Scholar] [CrossRef]
  29. Alfonso, S.M.; Kazama, S.; Takizawa, S. Inequalities in Access to and Consumption of Safely Managed Water Due to Socio-Economic Factors: Evidence from Quezon City, Philippines. Curr. Res. Environ. Sustain. 2022, 4, 100117. [Google Scholar] [CrossRef]
  30. Babuna, P.; Yang, X.; Tulcan, R.X.S.; Dehui, B.; Takase, M.; Guba, B.Y.; Han, C.; Awudi, D.A.; Li, M. Modeling Water Inequality and Water Security: The Role of Water Governance. J. Environ. Manag. 2023, 326, 116815. [Google Scholar] [CrossRef]
  31. Wang, X.J.; Zhang, J.Y.; Shahid, S.; El Mahdi, A.; He, R.M.; Wang, X.G.; Ali, M. Gini Coefficient to Assess Equity in Domestic Water Supply in the Yellow River. Mitig. Adapt. Strateg. Glob. Chang. 2012, 17, 65–75. [Google Scholar] [CrossRef]
  32. Yang, H.; Bain, R.; Bartram, J.; Gundry, S.; Pedley, S.; Wright, J. Water Safety and Inequality in Access to Drinking-Water between Rich and Poor Households. Environ. Sci. Technol. 2013, 47, 1222–1230. [Google Scholar] [CrossRef]
  33. Pullan, R.L.; Freeman, M.C.; Gething, P.W.; Brooker, S.J. Geographical Inequalities in Use of Improved Drinking Water Supply and Sanitation across Sub-Saharan Africa: Mapping and Spatial Analysis of Cross-Sectional Survey Data. PLoS Med. 2014, 11, e1001626. [Google Scholar] [CrossRef]
  34. Yu, W.; Bain, R.E.S.; Mansour, S.; Wright, J.A. A Cross-Sectional Ecological Study of Spatial Scale and Geographic Inequality in Access to Drinking-Water and Sanitation. Int. J. Equity Health 2014, 13, 113. [Google Scholar] [CrossRef]
  35. Instituto Brasileiro de Geografia e Estatística (IBGE). Cidades e Estados. Available online: https://www.ibge.gov.br/cidades-e-estados (accessed on 24 January 2023).
  36. World Bank. World Bank Open Data. Available online: https://data.worldbank.org/ (accessed on 24 January 2023).
  37. Sistema Nacional de Informações sobre Saneamento (SNIS). Diagnóstico Temático Serviços de Água e Esgoto: Gestão Técnica de Água—Ano de Referência 2020. 2022. Available online: https://arquivos-snis.mdr.gov.br/DIAGNOSTICO_TEMATICO_GESTAO_TECNICA_DE_AGUA_AE_SNIS_2022.pdf (accessed on 30 January 2023).
  38. Instituto Brasileiro de Geografia e Estatística (IBGE). Classificação e Caracterização Dos Espaços Rurais e Urbanos Do Brasil: Uma Primeira a Proximação; IBGE: Rio de Janeiro, Brazil, 2017; ISBN 978-85-240-4421-2.
  39. Saaty, R.W. The Analytic Hierarchy Process-What It Is and How It Is Used. Math. Model. 1987, 9, 161–176. [Google Scholar] [CrossRef]
  40. Goepel, K. Implementation of an Online Software Tool for the Analytic Hierarchy Process (AHP-OS). Int. J. Anal. Hierarchy Process 2018, 10, 469–487. [Google Scholar] [CrossRef]
  41. Haughton, J.; Khandker, S.R. Chapter 6: Inequality Measures. In Handbook on Poverty and Inequality; World Bank: Washington, DC, USA, 2009; Volume 3, pp. 101–120. [Google Scholar]
  42. Sitthiyot, T.; Holasut, K. A Simple Method for Measuring Inequality. Palgrave Commun. 2020, 6, 1–9. [Google Scholar] [CrossRef]
  43. United Nations (UN). Development Issues No. 2: Inequality Measurement. Available online: https://www.un.org/development/desa/dpad/wp-content/uploads/sites/45/publication/dsp_policy_02.pdf (accessed on 30 January 2023).
  44. Comissão Econômica e Social para a Ásia e o Pacífico (ESCAP). Measuring Inequality of Access: What Is the D-Index? ESCAP: Bangkok, Thailand, 2019. [Google Scholar]
  45. Instituto Trata Brasil. Acesso à Água Nas Regiões Norte e Nordeste Do Brasil: Desafios e Perspectivas; Instituto Trata Brasil: Sao Paulo, Brazil, 2018. [Google Scholar]
  46. World Health Organization (WHO). Handbook on Health Inequality Monitoring: With a Special Focus on Low- and Middle-Income Countries; WHO: Geneva, Switzerland, 2013; p. 105. [Google Scholar]
  47. World Health Organization (WHO); United Nations Children’s Fund (UNICEF). Safely Managed Drinking Water; WHO: Geneva, Switzerland, 2017. [Google Scholar]
  48. Every Woman Every Child Latin America and Caribbean (EWEC-LAC). Step-by-Step Guide for Measuring Social Inequalities in Health; EWEC-LAC: Ciudad del Saber, Panamá, 2020. [Google Scholar]
  49. Agência Nacional de Águas (ANA). Atlas Esgotos—Despoluição de Bacias Hidrográficas; ANA: Brasília, Brazil, 2017.
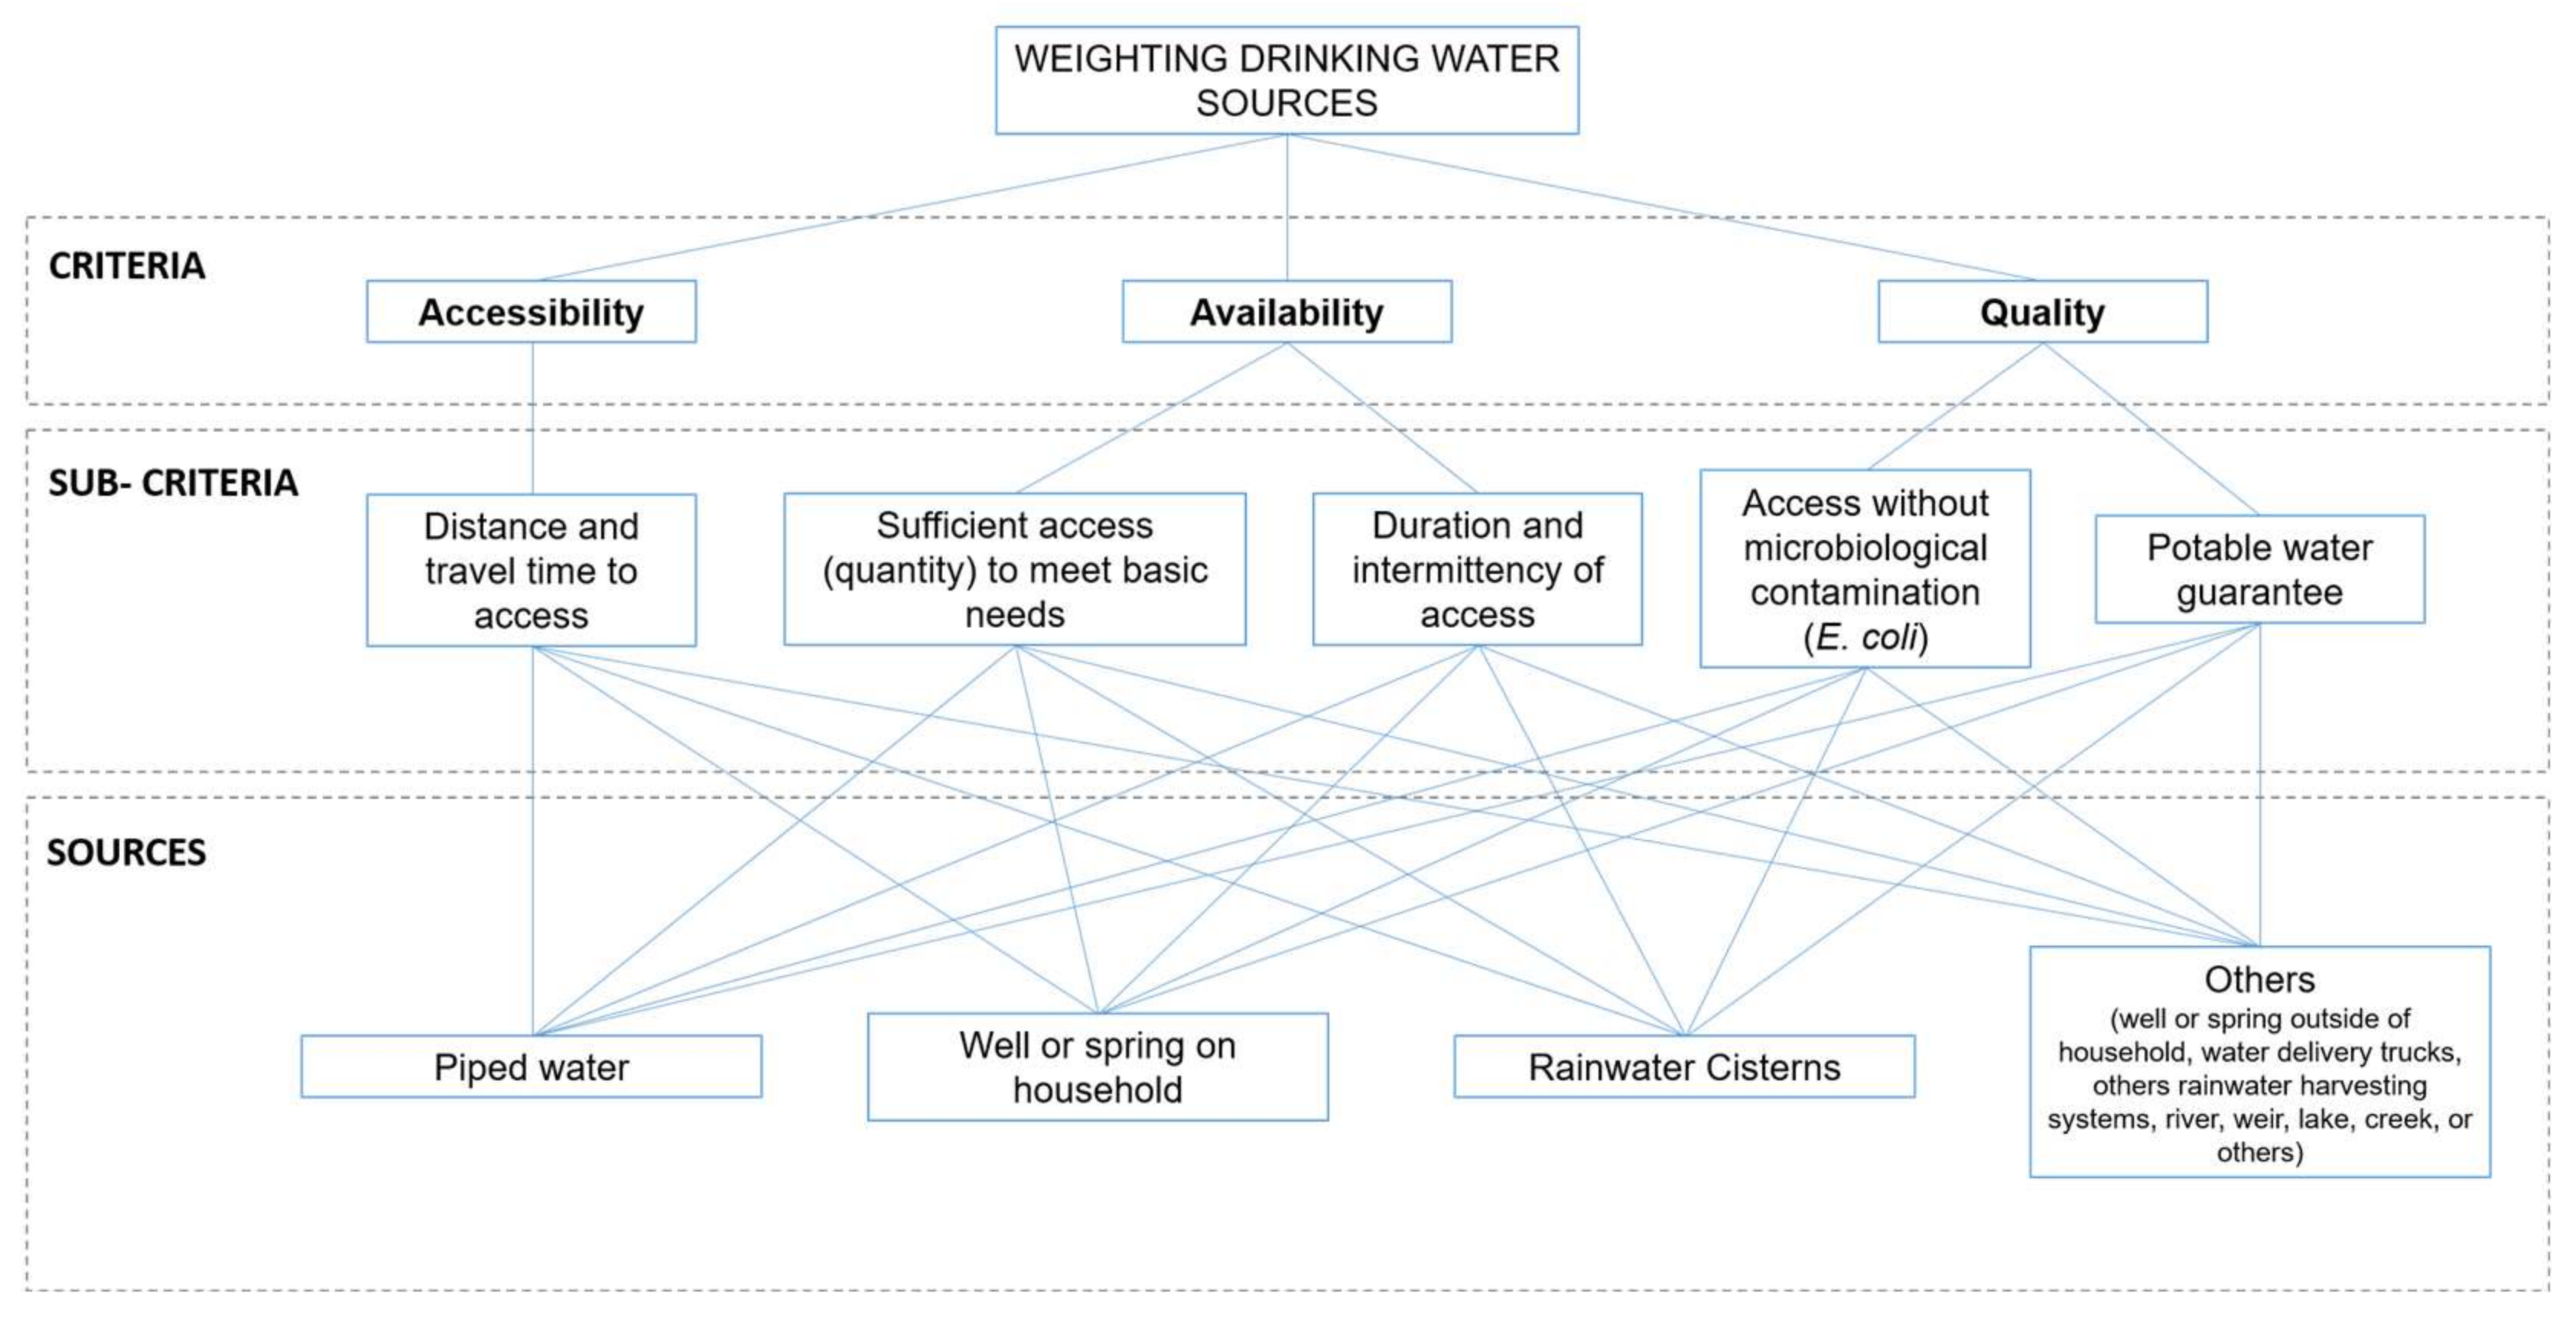
Figure 1. Criteria, sub-criteria, and alternatives used in the AHP method.
Water 15 01620 g001
Figure 2. Lorenz Curves were adapted to obtain the Safe Drinking Water Concentration Index (a) and the Safe Drinking Water Gini Index (b).
Water 15 01620 g002
Figure 3. Map of Safe Drinking Water Access Index (SDWA) results for each municipality. In the graphs, the coloured points represent the weighted averages of the safe drinking water access via piped water, a well or spring on the property, a cistern, or another source for each state, grouped by region.
Water 15 01620 g003
Figure 4. Boxplot graphs of the values of the inequality indices of safe access to water by state and region. R_8020: Safe Drinking Water Ratio between Upper and Lower Quintiles/G: Safe Drinking Water Gini Index/C: Safe Drinking Water Concentration Coefficient/D: Safe Drinking Water Dissimi-larity Index.
Water 15 01620 g004
Figure 5. Relation between Safe Drinking Water Access Index (SDWA) values as a function of per capita income quintile for the Brazilian regions.
Water 15 01620 g005
Figure 6. Radar graphs of the normalised values of the Safe Drinking Water Access Index (SDWA), Safe Drinking Water Gini Index (Gwater), Safe Drinking Water Concentration Coefficient (Cwater), Safe Drinking Water Ratios between the Upper and Lower Quintiles (R80/20), and Safe Drinking Water Dissimilarity Index (Dwater), as a function of the range of SDWA values. Each colored line represents a Brazilian municipality.
Water 15 01620 g006
Figure 7. Normalized results of the Safe Drinking Water Gini Index (Gwater), Safe Drinking Water Concentration Coefficient (Cwater), Safe Drinking Water Ratio between upper and lower quintiles (R80/20), and Safe Drinking Water Dissimilarity Index (Dwater).
Water 15 01620 g007
Figure 8. Spearman correlation of the inequality index results of safe drinking water access. R_8020: Safe Drinking Water Ratio between Upper and Lower Quintiles/G: Safe Drinking Water Gini Index/C: Safe Drinking Water Concentration Coefficient/D: Safe Drinking Water Dissimilarity Index. The three stars indicate statistically highly significant as p-value < 0.001.
Water 15 01620 g008
Figure 9. Graphs indicating the relationships between the Safe Drinking Water Access Index (SDWA) values (y-axis) and the Safe Drinking Water Gini Index (Gwater) values (x-axis), grouped by Brazilian regions and broken down according to the typology, population, and per capita GDP of the municipality.
Water 15 01620 g009
Figure 10. Lorenz Curves of two municipalities (blue lines) with populations of 102,033 (a) and 99,075 inhabitants (b) with Safe Drinking Water Access Index (SDWA) values of 72.8%. The red ones are the theoretical lines of perfect equality.
Water 15 01620 g010
Table 1. Regions of Brazil and their UFs.
RegionUF
NorthAcre (AC)/Amapá (AP)/Amazonas (AM)/Pará (PA)/Rondônia (RO)/Roraima (RR)/Tocantins (TO)
NortheastAlagoas (AL)/Bahia (BA)/Ceará (CE)/Maranhão (MA)/Paraíba (PB)/Pernambuco (PE)/Piauí (PI)/Rio Grande do Norte (RN)/Sergipe (SE)
SoutheastEspírito Santo (ES)/Minas Gerais (MG)/Rio de Janeiro (RJ)/São Paulo (SP)
SouthParaná (PR)/Rio Grande do Sul (RS)/Santa Catarina (SC)
Central-WestDistrito Federal (DF)/Goiás (GO)/Mato Grosso (MT)/Mato Grosso do Sul (MS)
Table 2. Inequality class categories for the Safe Drinking Water Gini Index and Concentration Coefficient (Gwater and Cwater).
Value RangeInequality Class
<0.3Equality
≥0.3 and <0.4Warning limit
≥0.4 and <0.5Inequality
≥0.5High inequality
Table 3. Average, maximum, and minimum values of inequality indices for each Safe Drinking Water Access Index (SDWA) range.
SDWA < 40%40% ≤ SDWA < 60%60% ≤ SDWA < 80%SDWA ≥ 80%
GwaterAverage0.510.350.200.07
Max0.790.570.380.19
Min0.230.080.020.00
CwaterAverage0.350.270.150.05
Max0.740.560.380.21
Min0.000.020.000.00
R80/20Average2.121.571.221.06
Max9.3711.392.661.50
Min0.460.710.590.87
DwaterAverage0.320.220.110.04
Max0.610.490.350.49
Min0.080.000.000.00
Disclaimer/Publisher’s Note: The statements, opinions and data contained in all publications are solely those of the individual author(s) and contributor(s) and not of MDPI and/or the editor(s). MDPI and/or the editor(s) disclaim responsibility for any injury to people or property resulting from any ideas, methods, instructions or products referred to in the content.