Evaluation and Prediction of Water Quality of Typical Wetlands in the Source Region of the Yangtze River
Abstract
:1. Introduction
2. Materials and Methods
2.1. Overview of the Study Region
2.2. Data Sources
Determination of Water Quality Data of Typical Wetlands from 2016 to 2021
2.3. Water Quality Evaluation Method
2.3.1. Environmental Quality Standard of Typical Wetland
2.3.2. Bayesian Water Quality Evaluation Method
2.3.3. Yao Zhiqi Evaluation Method
2.4. Water Quality Prediction Method
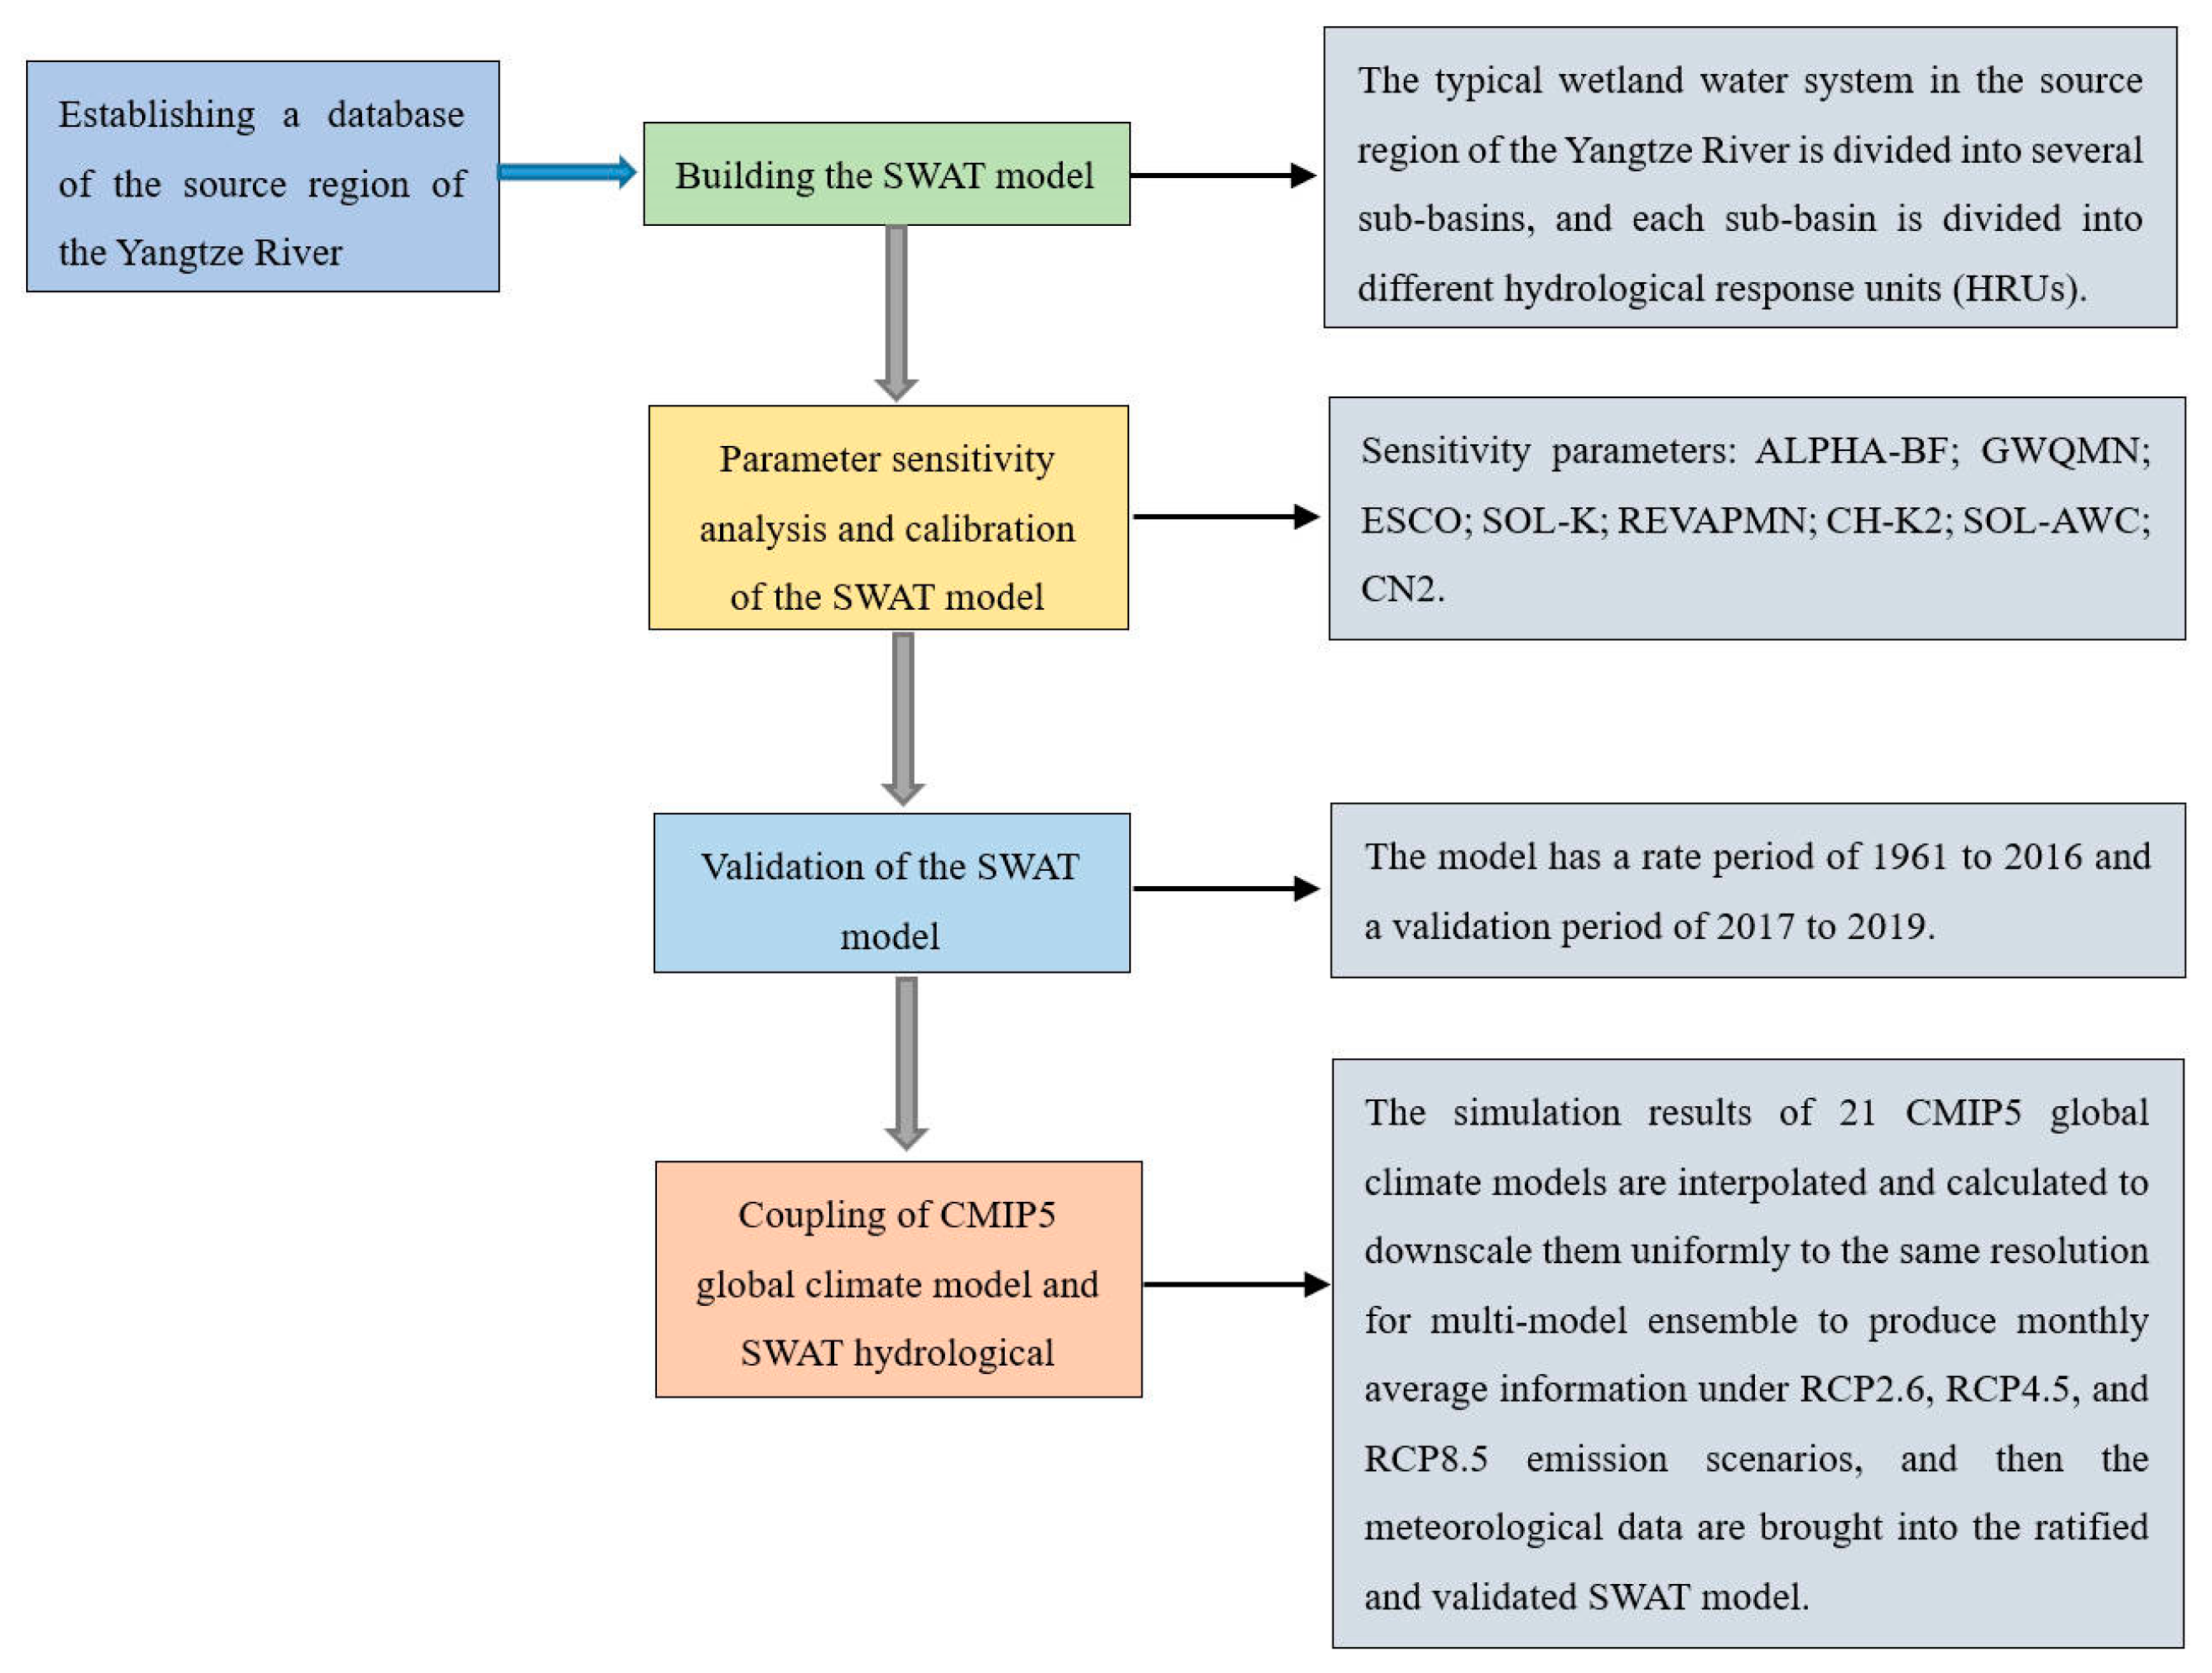
2.4.1. Establishment of SWAT Model Database of Typical Wetlands in the Source Region of the Yangtze River
2.4.2. Parameter Sensitivity Analysis and Calibration of the SWAT Model
2.4.3. Validation of the SWAT Model
2.4.4. Coupling of CMIP5 Global Climate Model and SWAT Hydrological Model
2.5. Data Processing
3. Results and Analysis
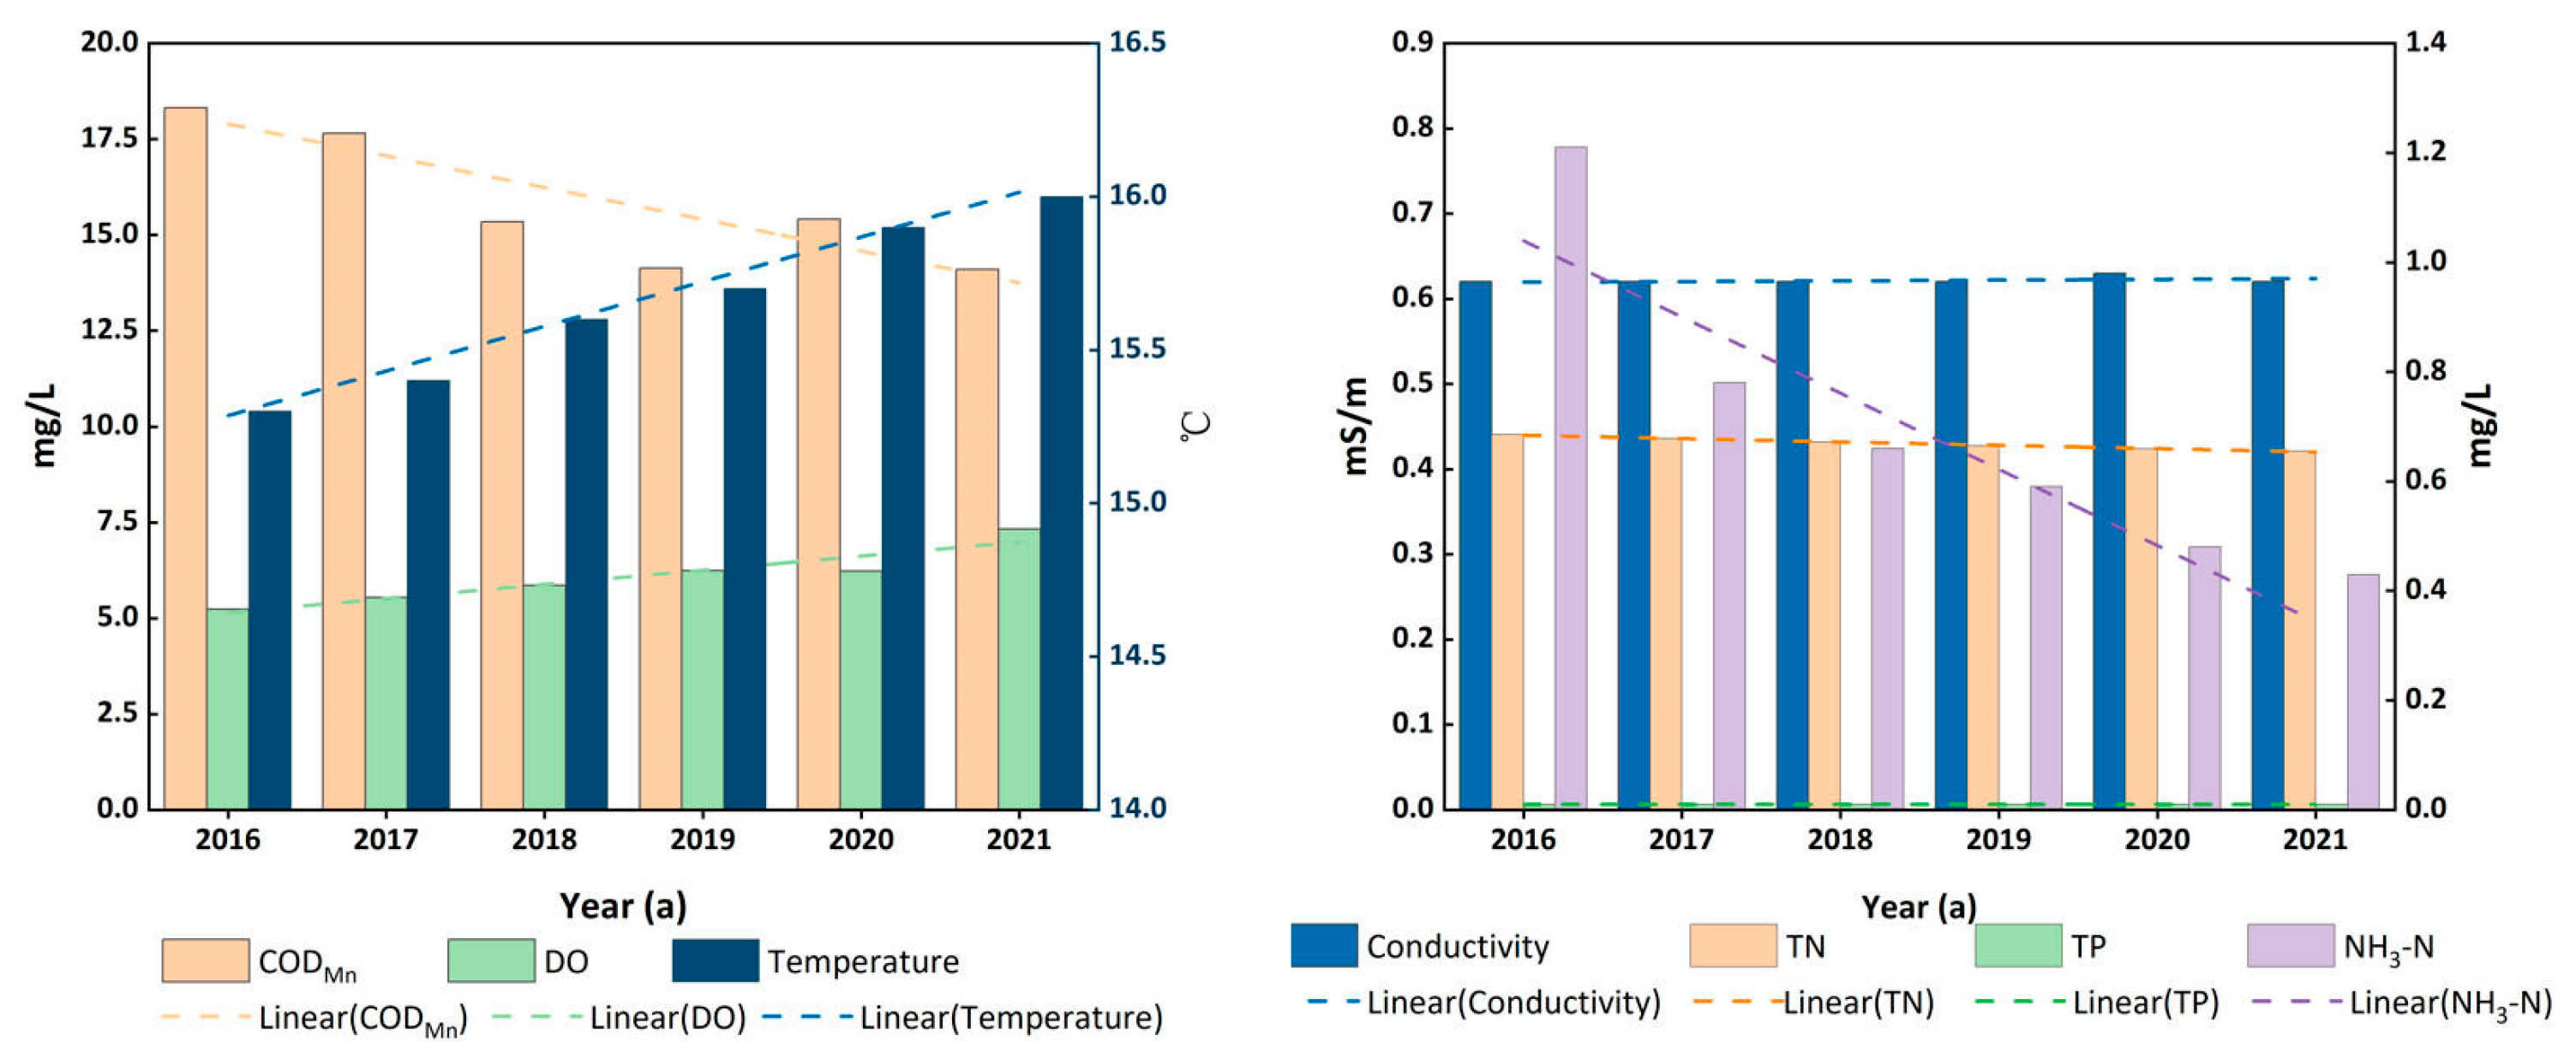
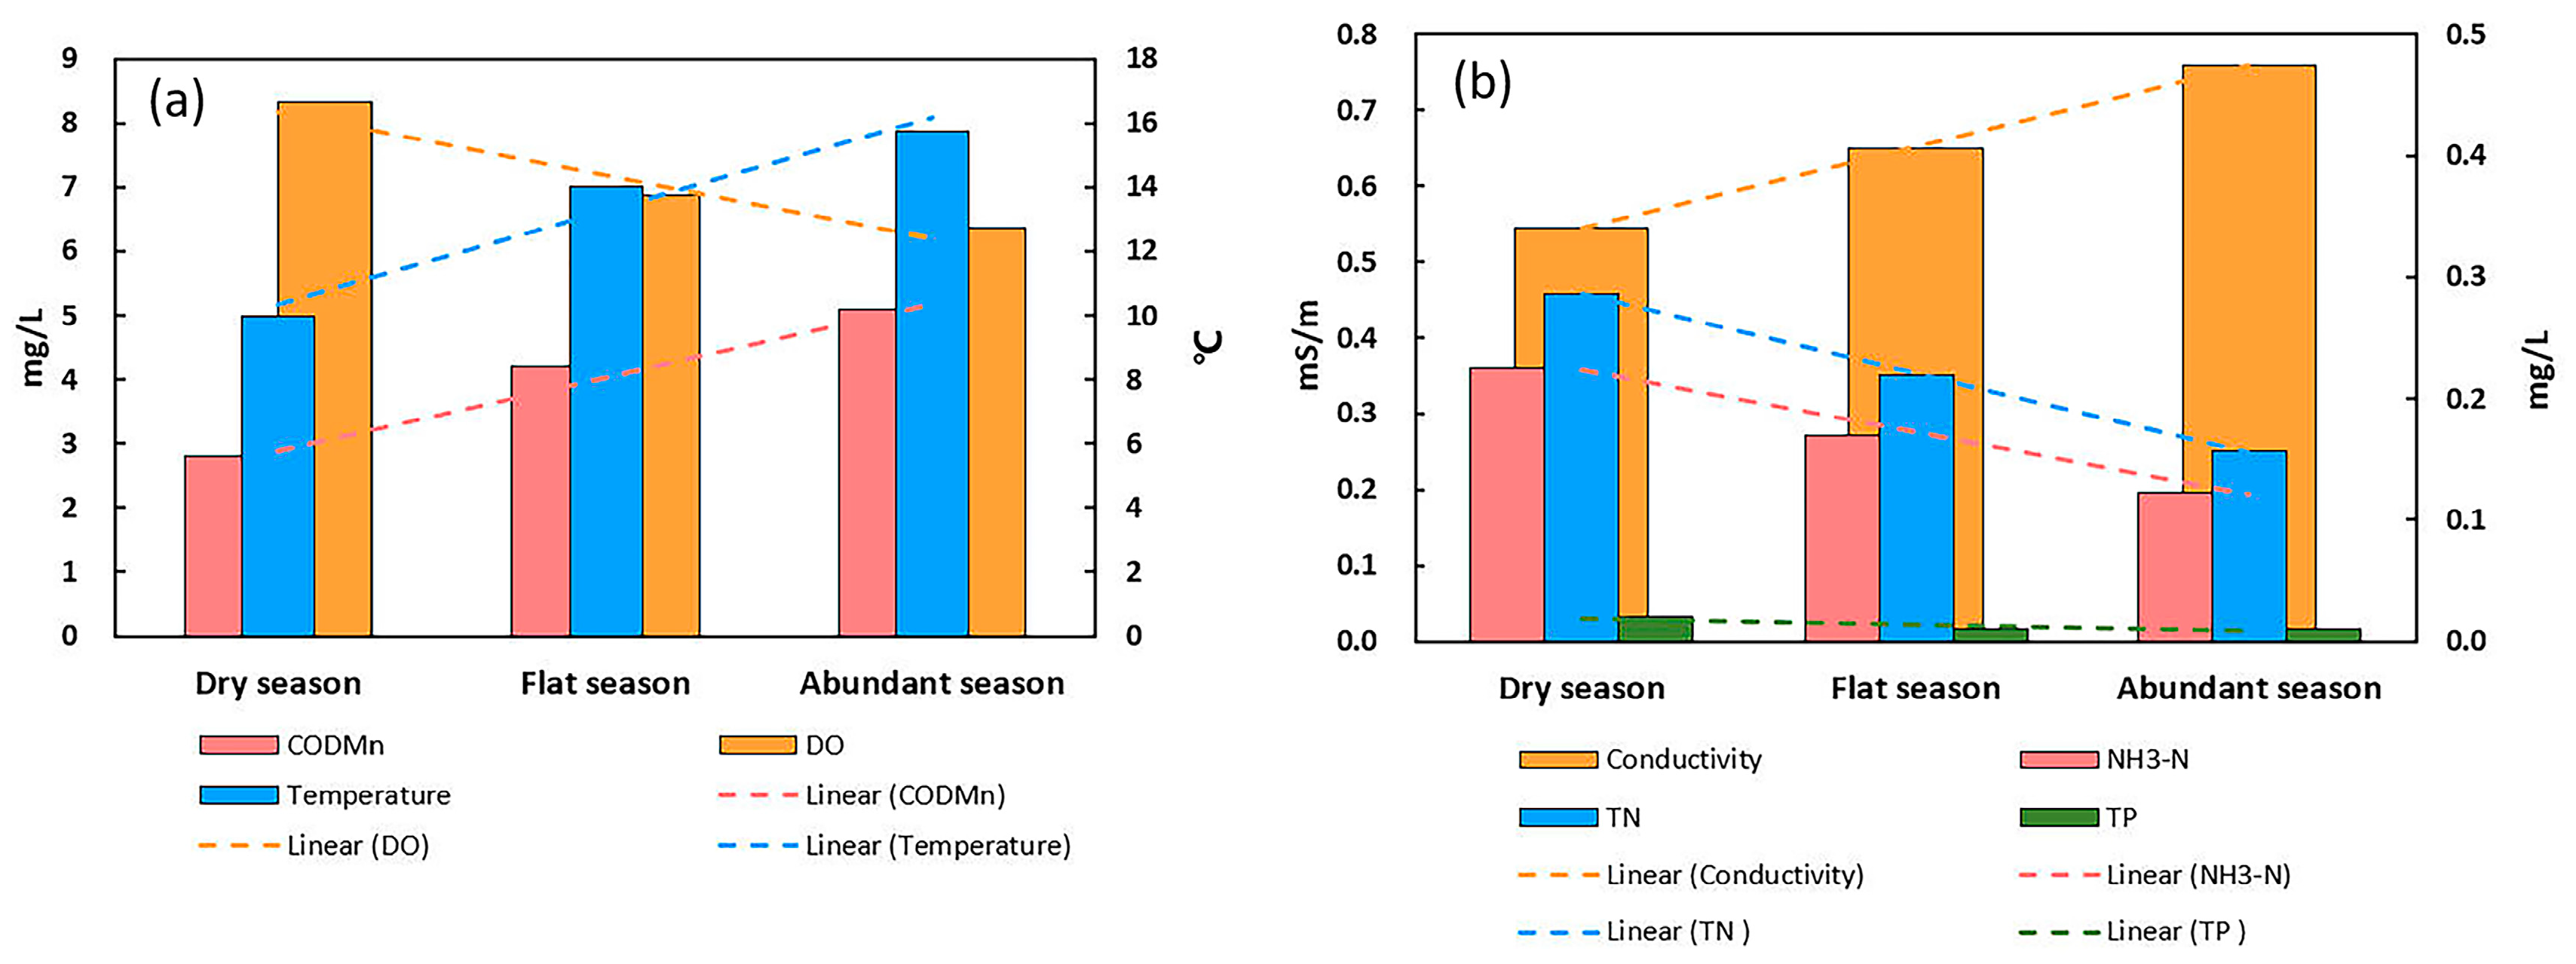
3.1. Analysis of Water Quality of Typical Wetlands in the Source Region of the Yangtze River from 2016 to 2021
3.2. Water Quality Evaluation of Typical Wetlands in the Source Region of the Yangtze River
3.2.1. Bayesian Water Quality Evaluation Results
3.2.2. Yao Zhiqi Method Water Quality Evaluation Results
3.3. Analysis of Water Quality Change Trend of Typical Wetlands in the Source Region of the Yangtze River under Future Climate Scenarios
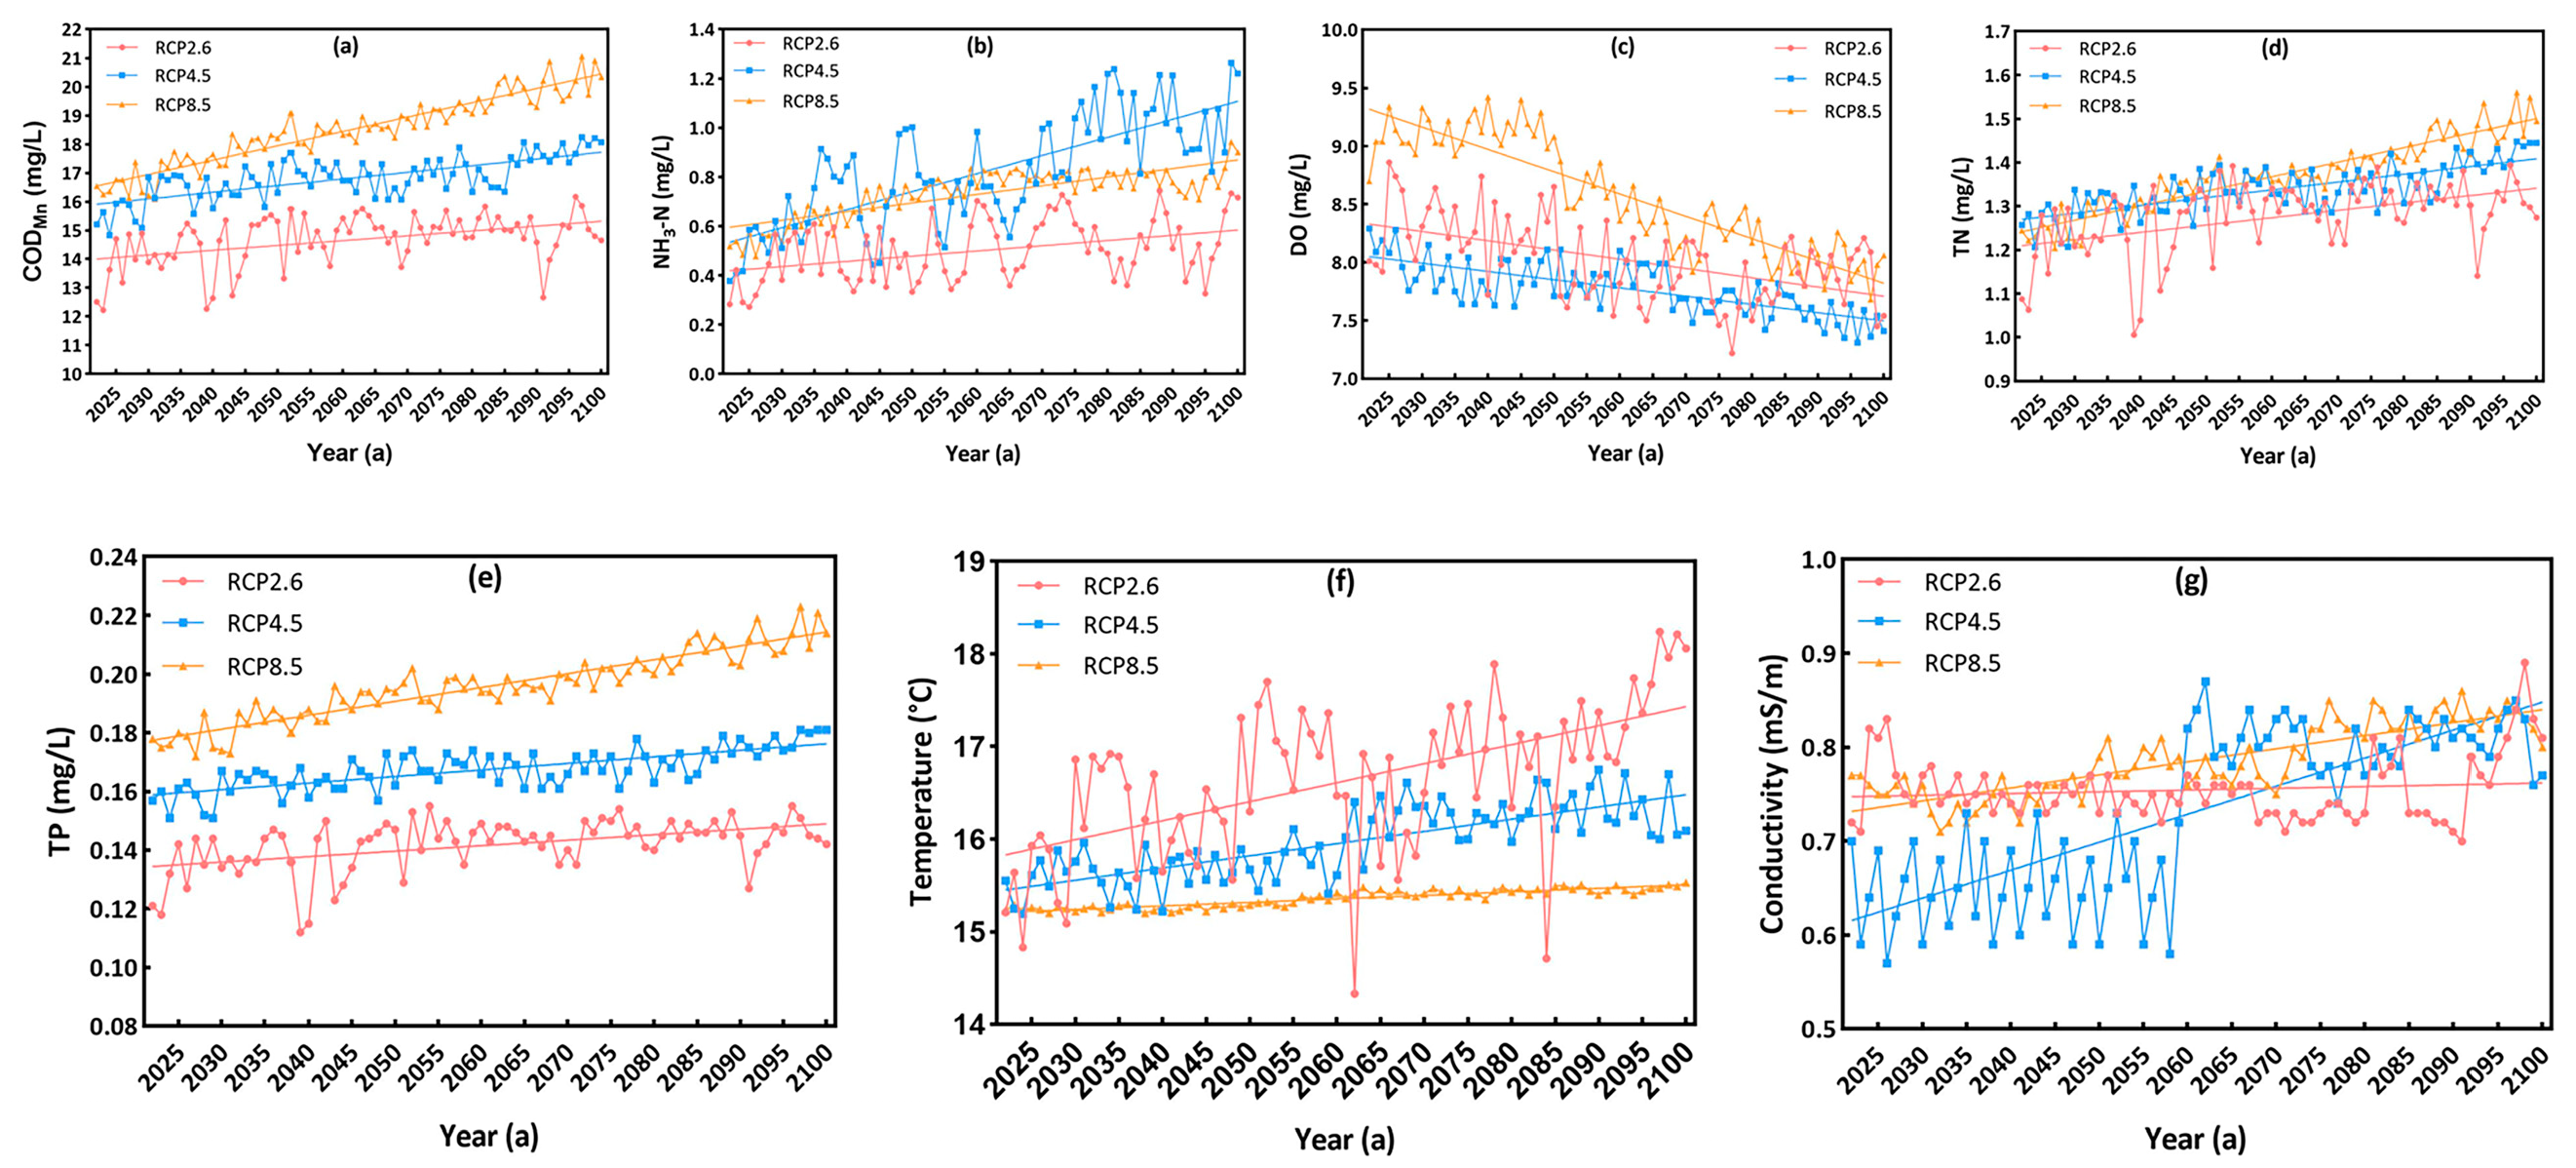
3.3.1. Change Trend Analysis of CODMn under Future Climate Scenarios
3.3.2. Change Trend Analysis of NH3-N under Future Climate Scenarios
3.3.3. Analysis of DO Change Trend under Future Climate Scenario
3.3.4. Analysis of the Change Trend of TN under Future Climate Scenarios
3.3.5. Analysis of TP Change Trend under Future Climate Scenarios
3.3.6. Analysis of Temperature Trends in Future Climate Scenarios
3.3.7. Change Trend Analysis of Water Conductivity under Future Climate Scenarios
4. Discussion
5. Conclusions
Author Contributions
Funding
Institutional Review Board Statement
Informed Consent Statement
Data Availability Statement
Conflicts of Interest
References
- Sun, J.; Liu, G.; Yuan, X. Alternative stable state and its evaluation in wetland reconstruction based on landscape design. Sci. Total Environ. 2023, 857, 159642. [Google Scholar] [CrossRef] [PubMed]
- Mogomotsi, P.K.; Mogomotsi, G.E.; Dipogiso, K.; Phonchi-Tshekiso, N.D.; Stone, L.S.; Badimo, D. An Analysis of Communities’ Attitudes Toward Wildlife and Implications for Wildlife Sustainability. Trop. Conserv. Sci. 2020, 13, 194008292091560. [Google Scholar] [CrossRef]
- Mao, Q.; Xu, L.; Wu, R. Evolutionary game of stakeholders’ behavioral strategies in wetland ecosystems from the vulnerability perspective. Environ. Sci. Pollut. Res. 2023, 30, 43419–43439. [Google Scholar] [CrossRef] [PubMed]
- Rahimi, M.; Zarei, M.; Keshavarzi, B.; Golshani, R.; Zafarani, S.G.G. Water quality stress to Amirkalayeh Wetland, Northern Iran. Environ. Monit. Assess. 2023, 195, 49. [Google Scholar] [CrossRef] [PubMed]
- Let, M.; Pal, S. Socio-ecological well-being perspectives of wetland loss scenario: A review. J. Environ. Manag. 2023, 326, 116692. [Google Scholar] [CrossRef]
- Watzinger, A.; Hager, M.; Reichenauer, T.; Soja, G.; Kinner, P. Unravelling the process of petroleum hydrocarbon biodegradation in different filter materials of constructed wetlands by stable isotope fractionation and labelling studies. Biodegradation 2021, 32, 343–359. [Google Scholar] [CrossRef]
- Li, G.; Xiao, K.; Wang, Q.; Zhang, Y.; Li, H. The Regulating Role of Meteorology in the Wetland-Air CO2 Fluxes at the Largest Shallow Grass-Type Lake on the North China Plain. Water 2023, 15, 139. [Google Scholar] [CrossRef]
- Tang, Y.; Li, Q.; Zuo, W.; Wang, J. Applicability analysis of Nemeiro index method in water quality assessment of Beidaihe National Wetland Park. Environ. Eng. 2019, 37, 195–199+189. [Google Scholar]
- Trevathan-Tackett, S.M.; Kepfer-Rojas, S.; Engelen, A.H.; York, P.H.; Ola, A.; Li, J.; Kelleway, J.J.; Jinks, K.I.; Jackson, E.L.; Adame, M.F.; et al. Ecosystem type drives tea litter decomposition and associated prokaryotic microbiome communities in freshwater and coastal wetlands at a continental scale. Sci. Total Environ. 2021, 782, 146819. [Google Scholar] [CrossRef]
- Chasmer, L.; Lima, E.M.; Mahoney, C.; Hopkinson, C.; Montgomery, J.; Cobbaert, D. Shrub changes with proximity to anthropogenic disturbance in boreal wetlands determined using bi-temporal airborne lidar in the Oil Sands Region, Alberta Canada. Sci. Total. Environ. 2021, 780, 146638. [Google Scholar] [CrossRef]
- Unigwe, C.O.; Egbueri, J.C. Drinking water quality assessment based on statistical analysis and three water quality indices (MWQI, IWQI and EWQI): A case study. Environ. Dev. Sustain. 2023, 25, 686–707. [Google Scholar] [CrossRef]
- Mu, X.; Zhang, S.; Lv, X.; Ma, Y.; Zhang, Z.; Han, B. Water flow and temperature drove epiphytic microbial community shift: Insight into nutrient removal in constructed wetlands from microbial assemblage and co-occurrence patterns. Bioresour. Technol. 2021, 332, 125134. [Google Scholar] [CrossRef] [PubMed]
- Qiu, J.; Shen, Z.; Xie, H. Drought impacts on hydrology and water quality under climate change. Sci. Total Environ. 2023, 858, 159854. [Google Scholar] [CrossRef]
- Daba, M.H.; You, S. Assessment of climate change impacts on river flow regimes in the upstream of A wash Basin, Ethiopia: Based on IPCC fifth assessment report (AR5) climate change scenarios. Hydrology 2020, 7, 98. [Google Scholar] [CrossRef]
- Satriagasa, M.C.; Tongdeenok, P.; Kaewjampa, N. Assessing the Implication of Climate Change to Forecast Future Flood Using SWAT and HEC-RAS Model under CMIP5 Climate Projection in Upper Nan Watershed, Thailand. Sustainability 2023, 15, 5276. [Google Scholar] [CrossRef]
- Malede, D.A.; Alamirew, T.; Andualem, T.G. Integrated and Individual Impacts of Land Use Land Cover and Climate Changes on Hydrological Flows over Birr River Watershed, Abbay Basin, Ethiopia. Water 2022, 15, 166. [Google Scholar] [CrossRef]
- Singh, V.; Karan, S.K.; Singh, C.; Samadder, S.R. Assessment of the capability of SWAT model to predict surface runoff in open cast coal mining areas. Environ. Sci. Pollut. Res. 2023, 30, 40073–40083. [Google Scholar] [CrossRef] [PubMed]
- Zeng, F.; Ma, M.G.; Di, D.R.; Shi, W.Y. Separating the impacts of climate change and human activities on runoff: A review of method and application. Water 2020, 12, 2201. [Google Scholar] [CrossRef]
- Kibii, J.K.; Kipkorir, E.C.; Kosgei, J.R. Application of Soil and Water Assessment Tool (SWAT) to Evaluate the Impact of Land Use and Climate Variability on the Kaptagat Catchment River Discharge. Sustainability 2021, 13, 1802. [Google Scholar] [CrossRef]
- Pandey, V.P.; Dhaubanjar, S.; Bharati, L.; Thapa, B.R. Hydrological response of Chamelia watershed in Mahakali Basin to climate change. Sci. Total Environ. 2018, 650, 365–383. [Google Scholar] [CrossRef]
- Li, C.; Fang, H. Assessment of climate change impacts on the streamflow for the Mun River in the Mekong Basin, Southeast Asia: Using SWAT model. Catena 2021, 201, 105199. [Google Scholar] [CrossRef]
- Camera, C.; Bruggeman, A.; Zittis, G.; Sofokleous, I.; Arnault, J. Simulation of extreme rainfall and streamflow events in small Mediterranean watersheds with a one-way-coupled atmospheric–hydrologic modelling system. Nat. Hazards Earth Syst. Sci. 2020, 20, 2791–2810. [Google Scholar] [CrossRef]
- Zhang, X.; Dong, Q.; Costa, V.; Wang, X. A hierarchical Bayesian model for decomposing the impacts of human activities and climate change on water resources in China. Sci. Total Environ. 2019, 665, 836–847. [Google Scholar] [CrossRef] [PubMed]
- Dubois, E.; Larocque, M.; Brunner, P. Impact of land cover changes on Long-Term Regional-Scale groundwater recharge simulation in cold and humid climates. Hydrol. Process. 2023, 37, e14810. [Google Scholar] [CrossRef]
- Song, X.; Zhu, Z.; Xi, X.; Zhang, G.; Wang, H. The Characteristics of Runoff Process Structure Changes under the Influence of Climate Change and Human Activities and the Decomposition of Contribution Rate of Impact Factors. Geofluids 2021, 2021, 6673217. [Google Scholar] [CrossRef]
- Zheng, W.; Yang, X.; Cheng, X.; Wang, Y.; Zhang, M. Prediction of main hydrological processes in the upper reaches of the Yangtze River based on CMIP5 and VIC models. Hydrology 2018, 38, 48–53. [Google Scholar]
- Su, Z.; Lin, L.; Chen, Y.; Hu, H. Understanding the distribution and drivers of PM2.5concentrations in the Yangtze River Delta from 2015 to 2020 using Random Forest Regression. Environ. Monit. Assess. 2022, 194, 284. [Google Scholar] [CrossRef]
- Gao, Y.; Chen, J.; Luo, H.; Wang, H. Prediction of hydrological responses to land use change. Sci. Total Environ. 2020, 708, 134998. [Google Scholar] [CrossRef]
- Sun, L.; Wang, Y.Y.; Zhang, J.Y.; Yang, Q.L.; Bao, Z.X.; Guan, X.X.; Guan, T.S.; Chen, X.; Wang, G.Q. Impact of environmental change on runoff in a transitional basin: Tao River Basin from the Tibetan Plateau to the Loess Plateau, China. Adv. Clim. Chang. Res. 2020, 10, 214–224. [Google Scholar] [CrossRef]
- Qiao, F.; Fu, G.; Xu, X.Q.; An, L.; Lei, K.; Zhao, J.; Hao, C. Assessment of Water Conservation Function in the Three-River Headwaters Region. Environ. Sci. Res. 2018, 31, 1010–1018. [Google Scholar]
- Li, J.M.; Shanrenqianjie; Yang, Y.; Qi, X.; Ha, Y.; Wang, Y.; He, Y.; Li, Y.; Lu, S. Effects of climate change on soil moisture in the source region of the Yangtze River. J. Yunnan Univ. 2022, 44, 775–784. [Google Scholar]
- Yan, X.; Zhou, Y.J.; Yao, S.M. River geomorphology and water-sediment characteristics in the source region of the Yangtze River. J. Yangtze River Sci. Res. Inst. 2019, 36, 10–15. [Google Scholar]
- Han, D.; Pan, B.; Zhao, G.; Zhu, P.; Wang, H.; Li, R. Phytoplankton community structure and distribution characteristics in the source region of the Yangtze River. Resour. Environ. Yangtze Basin 2019, 28, 2621–2631. [Google Scholar]
- Si, J.; Li, J.; Yang, Y.; Qi, X.; Li, J.; Liu, Z.; Li, M.; Lu, S.; Qi, Y.; Jin, C.; et al. Evaluation and Prediction of Groundwater Quality in the Source Region of the Yellow River. Water 2022, 14, 3946. [Google Scholar] [CrossRef]
- Maity, B.; Mallick, S.K.; Das, P.; Rudra, S. Comparative analysis of groundwater potentiality zone using fuzzy AHP, frequency ratio and Bayesian weights of evidence methods. Appl. Water Sci. 2022, 12, 63. [Google Scholar] [CrossRef]
- Yao, Z. Environmental Health, 3rd ed.; People’s Health Publishing: Beijing, China, 1994. [Google Scholar]
- Zadeh, F.K.; Nossent, J.; Woldegiorgis, B.T.; Bauwens, W.; van Griensven, A. A fast and effective parameterization of water quality models. Environ. Model. Softw. 2022, 149, 105331. [Google Scholar] [CrossRef]
- Liu, M.; Zhao, L.; Li, Q.; Zou, J.; Hu, Y.; Zhang, Y.; Xu, P.; Wu, Z.; Deng, W.; Tao, J. Chemical characteristics and main ion sources of main rivers in the source area of the yangtze river. China Environ. Sci. 2021, 41, 1243–1254. [Google Scholar]
- Zhao, Z.; Liu, L.; Wang, Z.; Zhang, Y.; Li, L.; Liu, F. Dynamic Changes of Plateau Wetlands in the Damqu River Basin, Yangtze River Source Region, China, 1988–2015. Wetlands 2020, 40, 1409–1424. [Google Scholar] [CrossRef]
- Su, Z.; Chen, W. Analysis of runoff variation characteristics and trend in the source region of the Yangtze River in recent 60 years. China Agron. Bull. 2016, 32, 166–171. [Google Scholar]
- Yan, Y.; Xu, H.; Xin, Y.; Liu, G.; Liu, J.; Wang, Y. Response Regularity of Wetland Area Changing According to Climate Changes in the 3-river Source Area from 1975 to 2007. Bull. Surv. Mapp. 2015, S2, 5–10. [Google Scholar]
- Zhao, H.; Cao, G.; Jiang, G. Study on water quality change of typical wetlands in Sanjiangyuan area of Qinghai Province. J. Panzhihua Univ. 2015, 32, 18–21. [Google Scholar]
- Meng, X.; Chen, H.; Li, Z.; Zhao, L.; Zhou, B.; Lv, S.; Deng, M.; Liu, Y.; Li, G. A review of studies on climate change and its environmental impacts in the source region of the Three Rivers. Plateau Meteorol. 2020, 39, 1133–1143. [Google Scholar]
- Hassanjabbar, A.; Nezaratian, H.; Wu, P. Climate change impacts on the flow regime and water quality indicators using an artificial neural network (ANN): A case study in Saskatchewan, Canada. J. Water Clim. Chang. 2022, 13, 3046–3060. [Google Scholar] [CrossRef]
- Liu, M.; Jun, L. Response of river hydrology and water quality to climate change in Changle River Watershed, Eastern China. Acta Sci. Circumstantiae 2015, 35, 108–117. [Google Scholar]
- Fang, S. Research on Water Quality Response of Dawafang Reservoir under Climate Change. Rural. Econ. Sci. Technol. 2018, 29, 43–44. [Google Scholar]
- Eyring, V.; Bock, L.; Lauer, A.; Righi, M.; Schlund, M.; Andela, B.; Arnone, E.; Bellprat, O.; Brötz, B.; Caron, L.P.; et al. Earth System Model Evaluation Tool (ESMValTool) v2. 0–an extended set of large-scale diagnostics for quasi-operational and comprehensive evaluation of Earth system models in CMIP. Geosci. Model Dev. 2020, 13, 3383–3438. [Google Scholar] [CrossRef]
- Kong, H.; Li, G.; Sun, L. Uncertainty in the prediction of precipitation changes in the middle and lower reaches of the Yangtze River under the RCP8.5 scenario. J. Univ. Sci. Technol. China 2020, 50, 1003–1012. [Google Scholar]
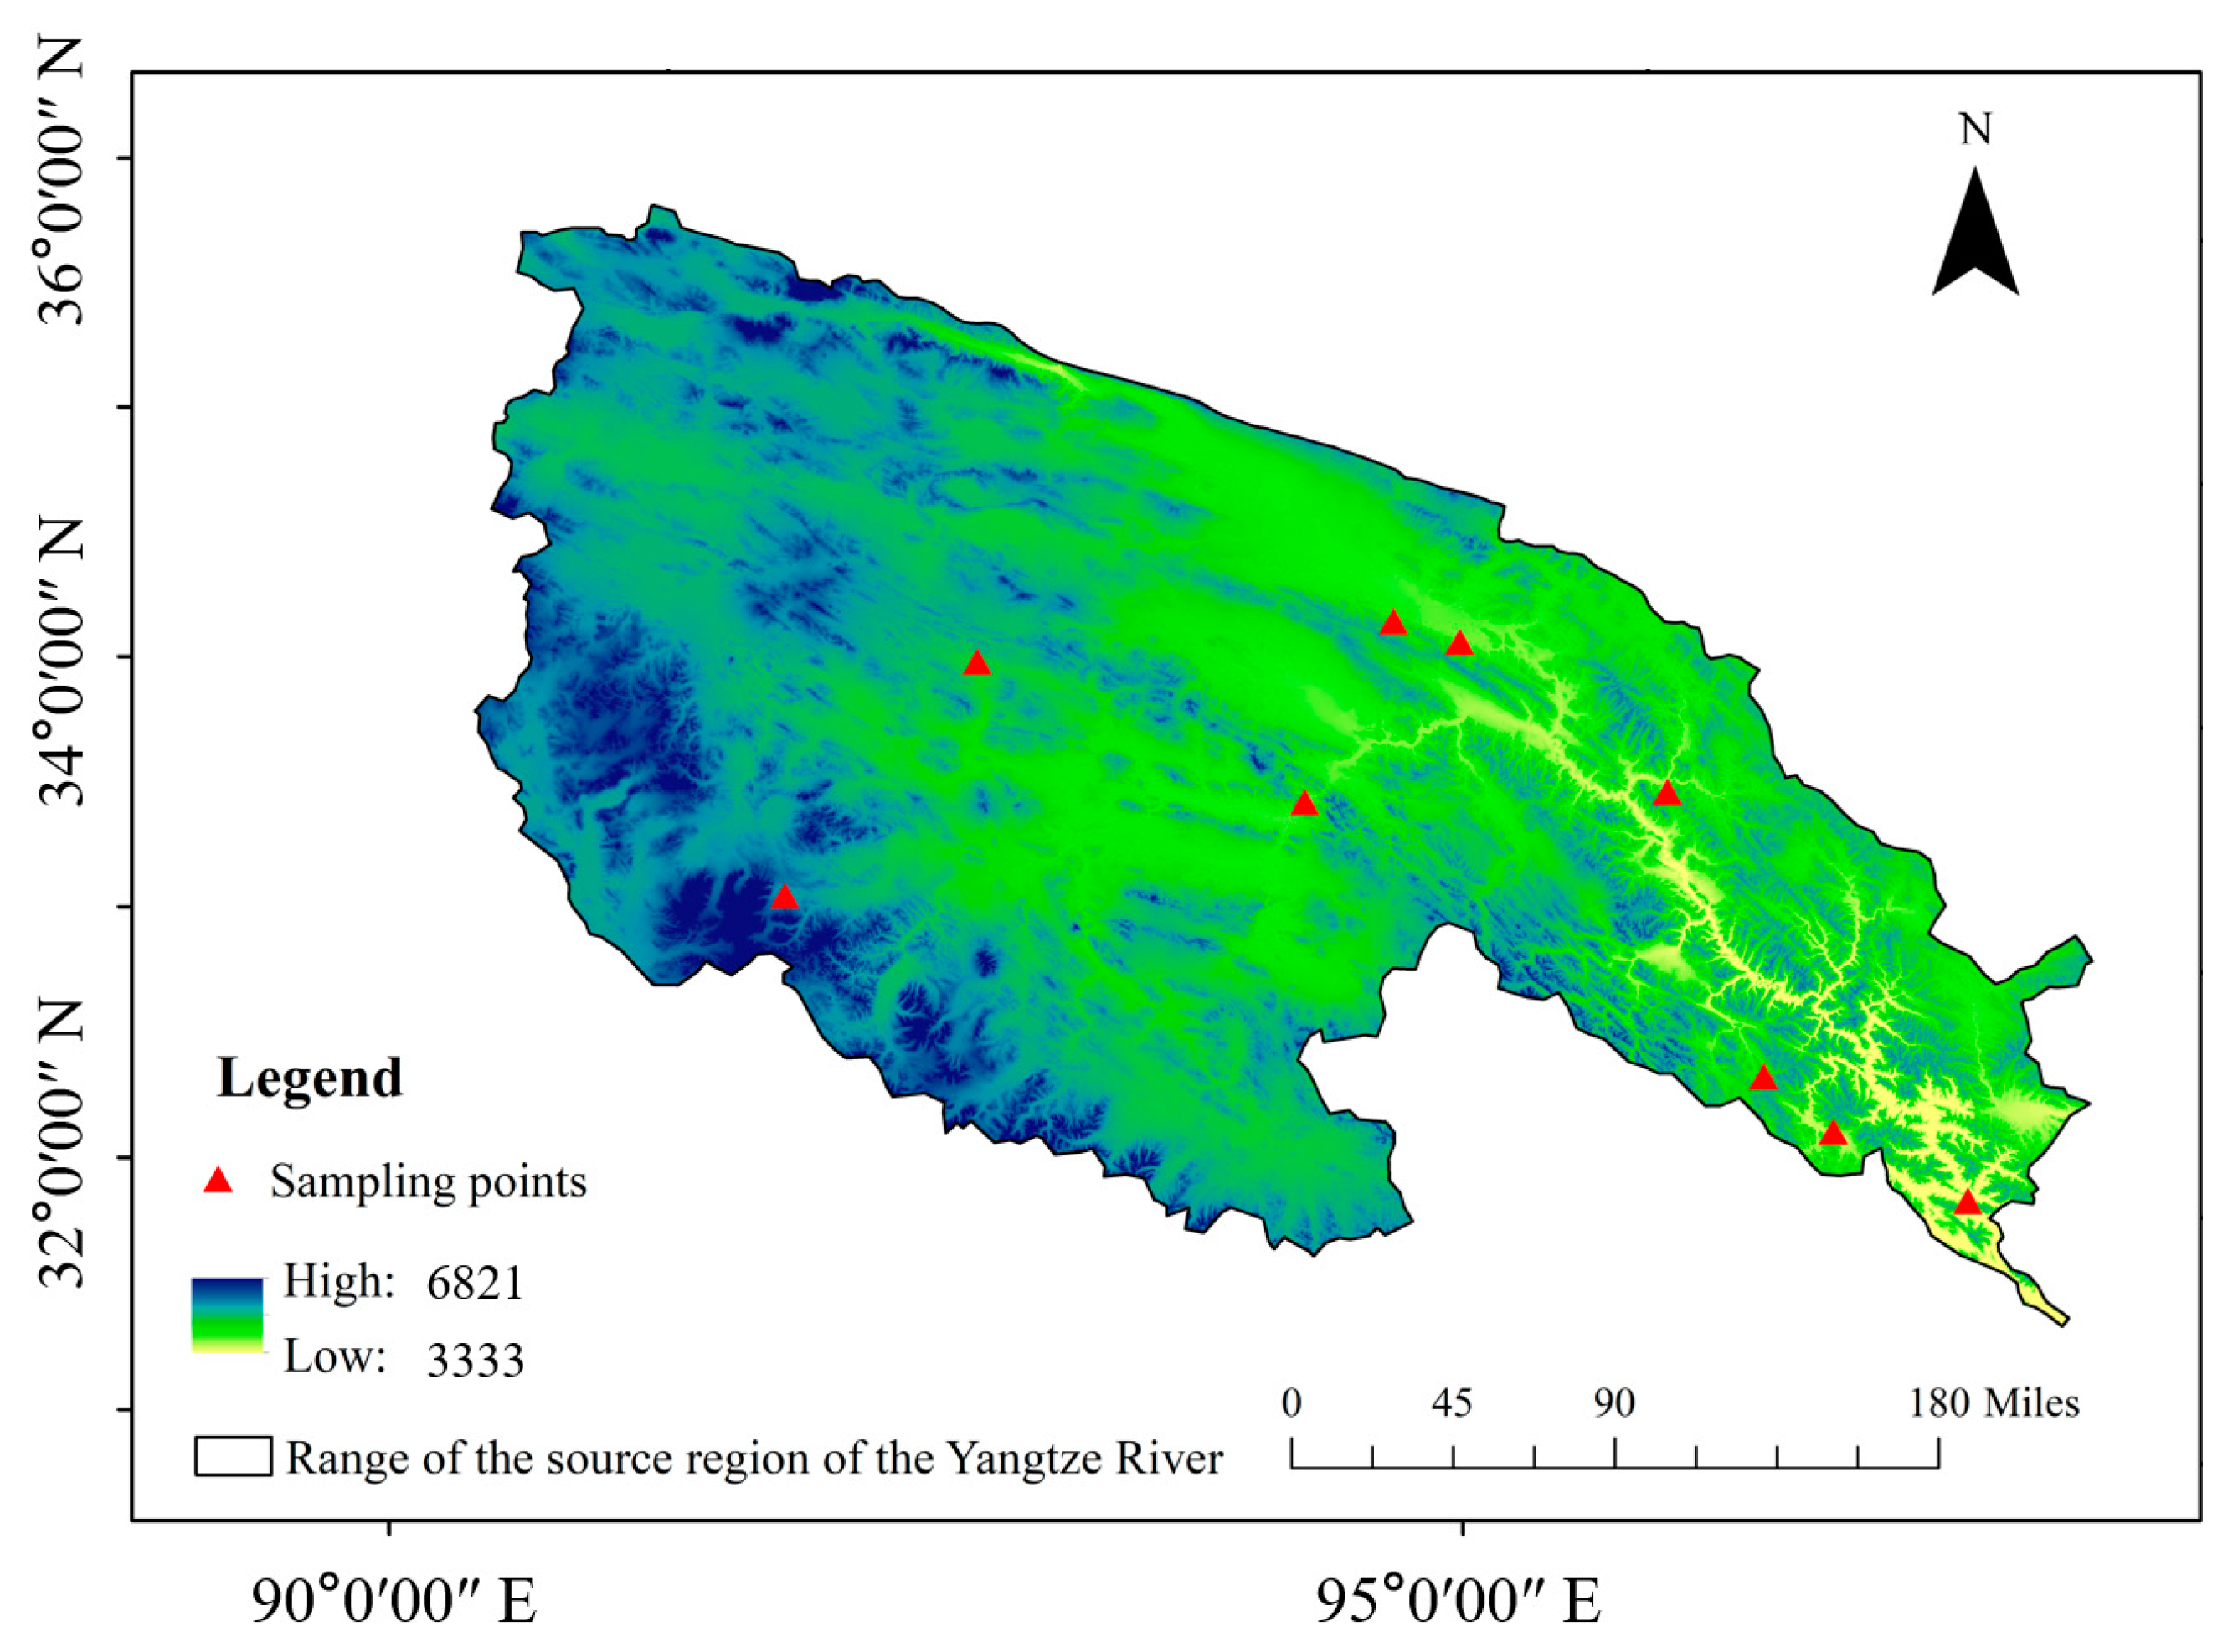

| Serial Number | Monitoring Points | Longitude | Latitude | Elevation |
|---|---|---|---|---|
| Point 1 | Wetland at 30,846 km of provincial highway | 96°32.962′ | 33°12.426′ | 4235 m |
| Point 2 | Longbao Lake Wetland | 91°19.378′ | 33°33.672′ | 4216 m |
| Point 3 | Batang River Wetland Park | 97°14.004′ | 32°58.9462032 | 3500 m |
| Point 4 | Wetland 1 on the way from Longbao town to Zhiduo | 96°10.876′ | 33°24.006′ | 4489 m |
| Point 5 | Longbao Lake Zhiduo wetland 2 | 93°46.475′ | 33°76.500′ | 4325 m |
| Point 6 | Wetland 1 on the way from qumalai to unfrozen spring | 95°32.950′ | 34°30.709′ | 4342 m |
| Point 7 | Wetland 2 on the way from qumalai to unfrozen spring | 94°25.610′ | 35°00.963′ | 4363 m |
| Point 8 | Wetland 3 on the way from qumalai to unfrozen spring | 94°05.155′ | 35°03.776′ | 4515 m |
| Point 9 | Wetland on the way from Yanshiping to Tuotuo River | 92°03.782′ | 34°38.346′ | 4692 m |
| Classify | Class I | Class II | Class III | Class IV | Class V |
|---|---|---|---|---|---|
| Dissolved oxygen | ≤7.5 | ≤6 | ≤5 | ≤3 | ≤2 |
| Ammonia nitrogen | ≤0.15 | ≤0.5 | ≤1.0 | ≤1.5 | ≤2.0 |
| Total nitrogen | ≤0.2 | ≤0.5 | ≤1.0 | ≤1.5 | ≤2.0 |
| Total phosphorus | ≤0.02 | ≤0.1 | ≤0.2 | ≤0.3 | ≤0.4 |
| Potassium permanganate index | ≤2 | ≤4 | ≤6 | ≤10 | ≤15 |
| Parameter Name | Sensitive Value |
|---|---|
| ALPHA-BF (Baseflow attenuation coefficient) | 0.369 |
| GWQMN (Shallow aquifer water storage threshold) | 0.272 |
| ESCO (Soil evaporation compensation factor) | 0.101 |
| SOL-K (Saturated water conductivity of soil layer) | 0.064 |
| REVAPMN (Shallow groundwater re-evaporation coefficient) | 0.059 |
| CH-K2 (Effective hydraulic conductivity of the main riverbed) | 0.032 |
| SOL-AWC (Effective water capacity of soil layer) | 0.030 |
| CN2 (SCS runoff curve number) | 0.022 |
| Parameter Name | Rate Range | Rate Constant Value |
|---|---|---|
| ALPHA-BF | 0.2–1 | 0.79 |
| GWQMN | 0–5000 | 1564.7 |
| ESCO | 0.76–0.78 | 0.76 |
| SOL-K | 10–80 | 41 |
| REVAPMN | 0–500 | 430 |
| CH-K2 | 110–125 | 115 |
| SOL-AWC | 0–0.25 | 0.21 |
| CN2 | 35–90 | 62 |
| Model | Research Institution | Resolution |
|---|---|---|
| Beijng Climate Center Climate System Model version 1 (BCC-CSM1-1) | BBC, China Meteorological Administration, China | 128 × 64 |
| Bejing Normal University Earth System Model (BNU-ESM) | The College of Global Change and Earth System Science (GCESS), BNU, China | 128 × 64 |
| Canadian Earth System Model version 2 (CanESM2) | Canadian Centre for Climate Modelling and Analysis, Canada | 128 × 64 |
| The Community Climate System Model version 4 (CCSM4) | National Center for Atmospheric Research, USA | 288 × 192 |
| Centre National de Recherches Meteorologiques Climate Model version 5 (CNRM-CM5) | CNRM/Centre Europeen de Recherche et Formation Avancees en Calcul Scientifque, France | 256 × 128 |
| Commonwealth Scientific and Industrial Research Organization Mark Climate Model version 3.6 (CSIRO-MK3-6-0) | CSIRO in collaboration with Queensland Climate Change Centre of Excellence, Australia | 192 × 96 |
| Flexible Global Ocean - Atmosphere-Land System Model-grid version 2 (FGOALS-g2) | State Key Laboratory of Numerical Modeling for Atmospheric Sciences and Geophysical Fluid Dynamics, Institute of Atmospheric Physics, Chinese Academy of Sciences, and Tsinghua University, China | 128 × 60 |
| The First Institution of Oceanography Earth System Model (FIO-ESM) | FIO, State Oceanic Administration (SOA), Qingdao, China | 128 × 64 |
| Geophysical Fluid Dynamics Laboratory Climate Model version 3 (GFDL-CM3) | GFDL, National Oceanic and Atmospheric Administration. USA | 144 × 90 |
| Geophysical Fluid Dynamics Laboratory Earth System Model version 2 with Generalized Ocean Layer Dynamics (GOLD) code base (GFDL-ESM2G) | GFDL, National Oceanic and Atmospheric Administration, USA | 144 × 90 |
| Geophysical Fluid Dynamics Laboratory Earth System Model version 2 with Modular Ocean Model version 4.1 (GFDL-ESM2M) | GFDL, National Oceanic and Atmospheric Administration, USA | 144 × 90 |
| Goddard Institute for Space Studies Model E version 2 with Hycoml ocean model (GISS-E2-H) | GISS, National Aeronautics and Space Administration, USA | 144 × 90 |
| Goddard Institute for Space Studies Model E version 2 with Russell ocean model (GISS-E2-R) | GISS, National Aeronautics and Space Administration, USA | 144 × 90 |
| Met Office Hadley Centre Global Environment Models version 2 with the new atmosphere-ocean component model (HadGEM2-AO) | Jointly with Met Office Hadley Centre and National Institute of Meteorological Research (NIMR). Korea Meteorological Administration (KMA), Seoul, South Korea | 192 × 145 |
| Institut Pierre Simon Laplace Climate Model 5A-Low Resolution (IPSL-CM5A-LR) | IPSL, France | 96 × 96 |
| Model for Interdisciplinary Research on -Climate- Earth System, version 5 (MIROC5) | Atmosphere and Ocean Research Institute (AORI), National Institute for Environmental Studies (NIES) Japan Agency for Marine-Earth Science and Technology, Kanagawa (JAMSTEC), Japan | 256 × 128 |
| Model for Interdisciplinary Research on Climate- Earth System (MIROC-ESM) | JAMSTEC, AORI, and NIES, Japan | 128 × 64 |
| Atmospheric Chemistry Coupled Version of Model for Interdisciplinary Research on Climate- Earth System (MIROC-ESM-CHEM) | JAMSTEC, AORI, and NIES, Japan | 128 × 64 |
| Max-Planck Institute Earth System Model-Low Resolution (MPI-ESM-LR) | MPI for Meteorology, Germany | 192 × 96 |
| Meteorological Research Institute Coupled General Circulation Model version 3 (MRI-CGCM3) | MRI, Japan | 320 × 160 |
| The Norwegian Earth System Model version I with Intermediate Resolution (NorESM1-M) | Norwegian Climate Centre, Norway | 144 × 96 |
| Years | Evaluation Grade & p Value | ||||||||
|---|---|---|---|---|---|---|---|---|---|
| Point 1 | Point 2 | Point 3 | Point 4 | Point 5 | Point 6 | Point 7 | Point 8 | Point 9 | |
| 2016 | II | I | I | II | II | II | II | II | II |
| 0.10 | 0.14 | 0.15 | 0.12 | 0.10 | 0.13 | 0.13 | 0.15 | 0.12 | |
| 2017 | I | II | II | I | I | I | I | I | I |
| 0.13 | 0.14 | 0.14 | 0.16 | 0.16 | 0.14 | 0.15 | 0.13 | 0.14 | |
| 2018 | I | II | II | I | I | I | I | I | I |
| 0.12 | 0.14 | 0.15 | 0.16 | 0.14 | 0.16 | 0.16 | 0.14 | 0.15 | |
| 2019 | II | II | II | II | II | II | II | II | I |
| 0.15 | 0.14 | 0.13 | 0.12 | 0.12 | 0.13 | 0.13 | 0.13 | 0.06 | |
| 2020 | I | I | I | II | I | II | II | I | I |
| 0.16 | 0.14 | 0.15 | 0.13 | 0.16 | 0.13 | 0.14 | 0.15 | 0.16 | |
| 2021 | I | I | I | I | I | I | I | I | I |
| 0.14 | 0.12 | 0.13 | 0.16 | 0.14 | 0.13 | 0.13 | 0.13 | 0.15 | |
| Index | 2016 | 2017 | 2018 | 2019 | 2020 | 2021 |
|---|---|---|---|---|---|---|
| X | 1.21 | 1.13 | 0.96 | 1.56 | 1.11 | 0.92 |
| Y | 0.96 | 0.86 | 0.92 | 0.94 | 0.42 | 0.43 |
| P | 1.08 | 0.98 | 0.93 | 1.21 | 0.68 | 0.62 |
| Parameters | RCP2.6 | RCP4.5 | RCP8.5 | ||
|---|---|---|---|---|---|
| (a) | CODMn | Linear relationship | y = 0.0177x − 21.918 | y = 0.0247x − 34.111 | y = 0.0515x − 87.604 |
| R2 | 0.2092 | 0.5101 | 0.8784 | ||
| (b) | NH3-N | Linear relationship | y = 0.0022x − 4.125 | y = 0.0074x − 14.532 | y = 0.0036x − 6.7464 |
| R2 | 0.1737 | 0.5676 | 0.6613 | ||
| (c) | DO | Linear relationship | y = − 0.0079x + 24.358 | y = −0.0071x + 22.331 | y = −0.0187x + 47.108 |
| R2 | 0.2786 | 0.5143 | 0.7868 | ||
| (d) | TN | Linear relationship | y = 0.0018x − 2.3438 | y = 0.0019x − 2.485 | y = 0.0034x − 5.702 |
| R2 | 0.2471 | 0.5512 | 0.849 | ||
| (e) | TP | Linear relationship | y = 0.0002x − 0.26 | y = 0.0002x − 0.3107 | y = 0.0005x − 0.8137 |
| R2 | 0.2465 | 0.5484 | 0.8469 | ||
| (f) | Temperature | Linear relationship | y = 0.022x − 28.728 | y = 0.0133x − 11.45 | y = 0.0038x + 7.4801 |
| R2 | 0.3526 | 0.5982 | 0.8182 | ||
| (g) | Conductivity | Linear relationship | y = 0.0002x + 0.2857 | y = 0.0029x − 5.3411 | y = 0.0014x − 2.052 |
| R2 | 0.0234 | 0.6082 | 0.713 |
Disclaimer/Publisher’s Note: The statements, opinions and data contained in all publications are solely those of the individual author(s) and contributor(s) and not of MDPI and/or the editor(s). MDPI and/or the editor(s) disclaim responsibility for any injury to people or property resulting from any ideas, methods, instructions or products referred to in the content. |
© 2023 by the authors. Licensee MDPI, Basel, Switzerland. This article is an open access article distributed under the terms and conditions of the Creative Commons Attribution (CC BY) license (https://creativecommons.org/licenses/by/4.0/).
Share and Cite
Lu, S.; Li, J.; Si, J.; Miao, Y.; Qi, X.; Zhang, X.; Bao, W.; Zhang, X.; Zhou, S.; Jin, C.; et al. Evaluation and Prediction of Water Quality of Typical Wetlands in the Source Region of the Yangtze River. Water 2023, 15, 1612. https://doi.org/10.3390/w15081612
Lu S, Li J, Si J, Miao Y, Qi X, Zhang X, Bao W, Zhang X, Zhou S, Jin C, et al. Evaluation and Prediction of Water Quality of Typical Wetlands in the Source Region of the Yangtze River. Water. 2023; 15(8):1612. https://doi.org/10.3390/w15081612
Chicago/Turabian StyleLu, Sujin, Jianming Li, Jianhua Si, Yan Miao, Xuejiao Qi, Xiuzhi Zhang, Wenjin Bao, Xiaoyan Zhang, Shipeng Zhou, Cheng Jin, and et al. 2023. "Evaluation and Prediction of Water Quality of Typical Wetlands in the Source Region of the Yangtze River" Water 15, no. 8: 1612. https://doi.org/10.3390/w15081612
APA StyleLu, S., Li, J., Si, J., Miao, Y., Qi, X., Zhang, X., Bao, W., Zhang, X., Zhou, S., Jin, C., Qi, L., Qi, Y., Zheng, X., Gong, Y., Wang, Z., Wang, Y., Yi, B., & Qi, H. (2023). Evaluation and Prediction of Water Quality of Typical Wetlands in the Source Region of the Yangtze River. Water, 15(8), 1612. https://doi.org/10.3390/w15081612


