Figure 1.
The Weather Research and Forecasting (WRF) simulated domain (whole figure) and the Simulating WAves Nearshore (SWAN) simulated region (orange square). The tracks of typhoon Goni (purple line), Dujuan (red line), and Meranti (blue line). Red triangles are the locations of buoys in the Taiwan Strait.
Figure 2.
Taylor diagrams of the wind speed for three typhoon events and 27 experiments. Red dots stand for experiments, and blue dots stand for ensemble prediction.
Figure 2.
Taylor diagrams of the wind speed for three typhoon events and 27 experiments. Red dots stand for experiments, and blue dots stand for ensemble prediction.
Figure 3.
The temporal distributions of the wind speeds (m/s) obtained from experiment 19 (blue line) and the buoy observations (red dot) during typhoon Goni at the locations of four buoys.
Figure 3.
The temporal distributions of the wind speeds (m/s) obtained from experiment 19 (blue line) and the buoy observations (red dot) during typhoon Goni at the locations of four buoys.
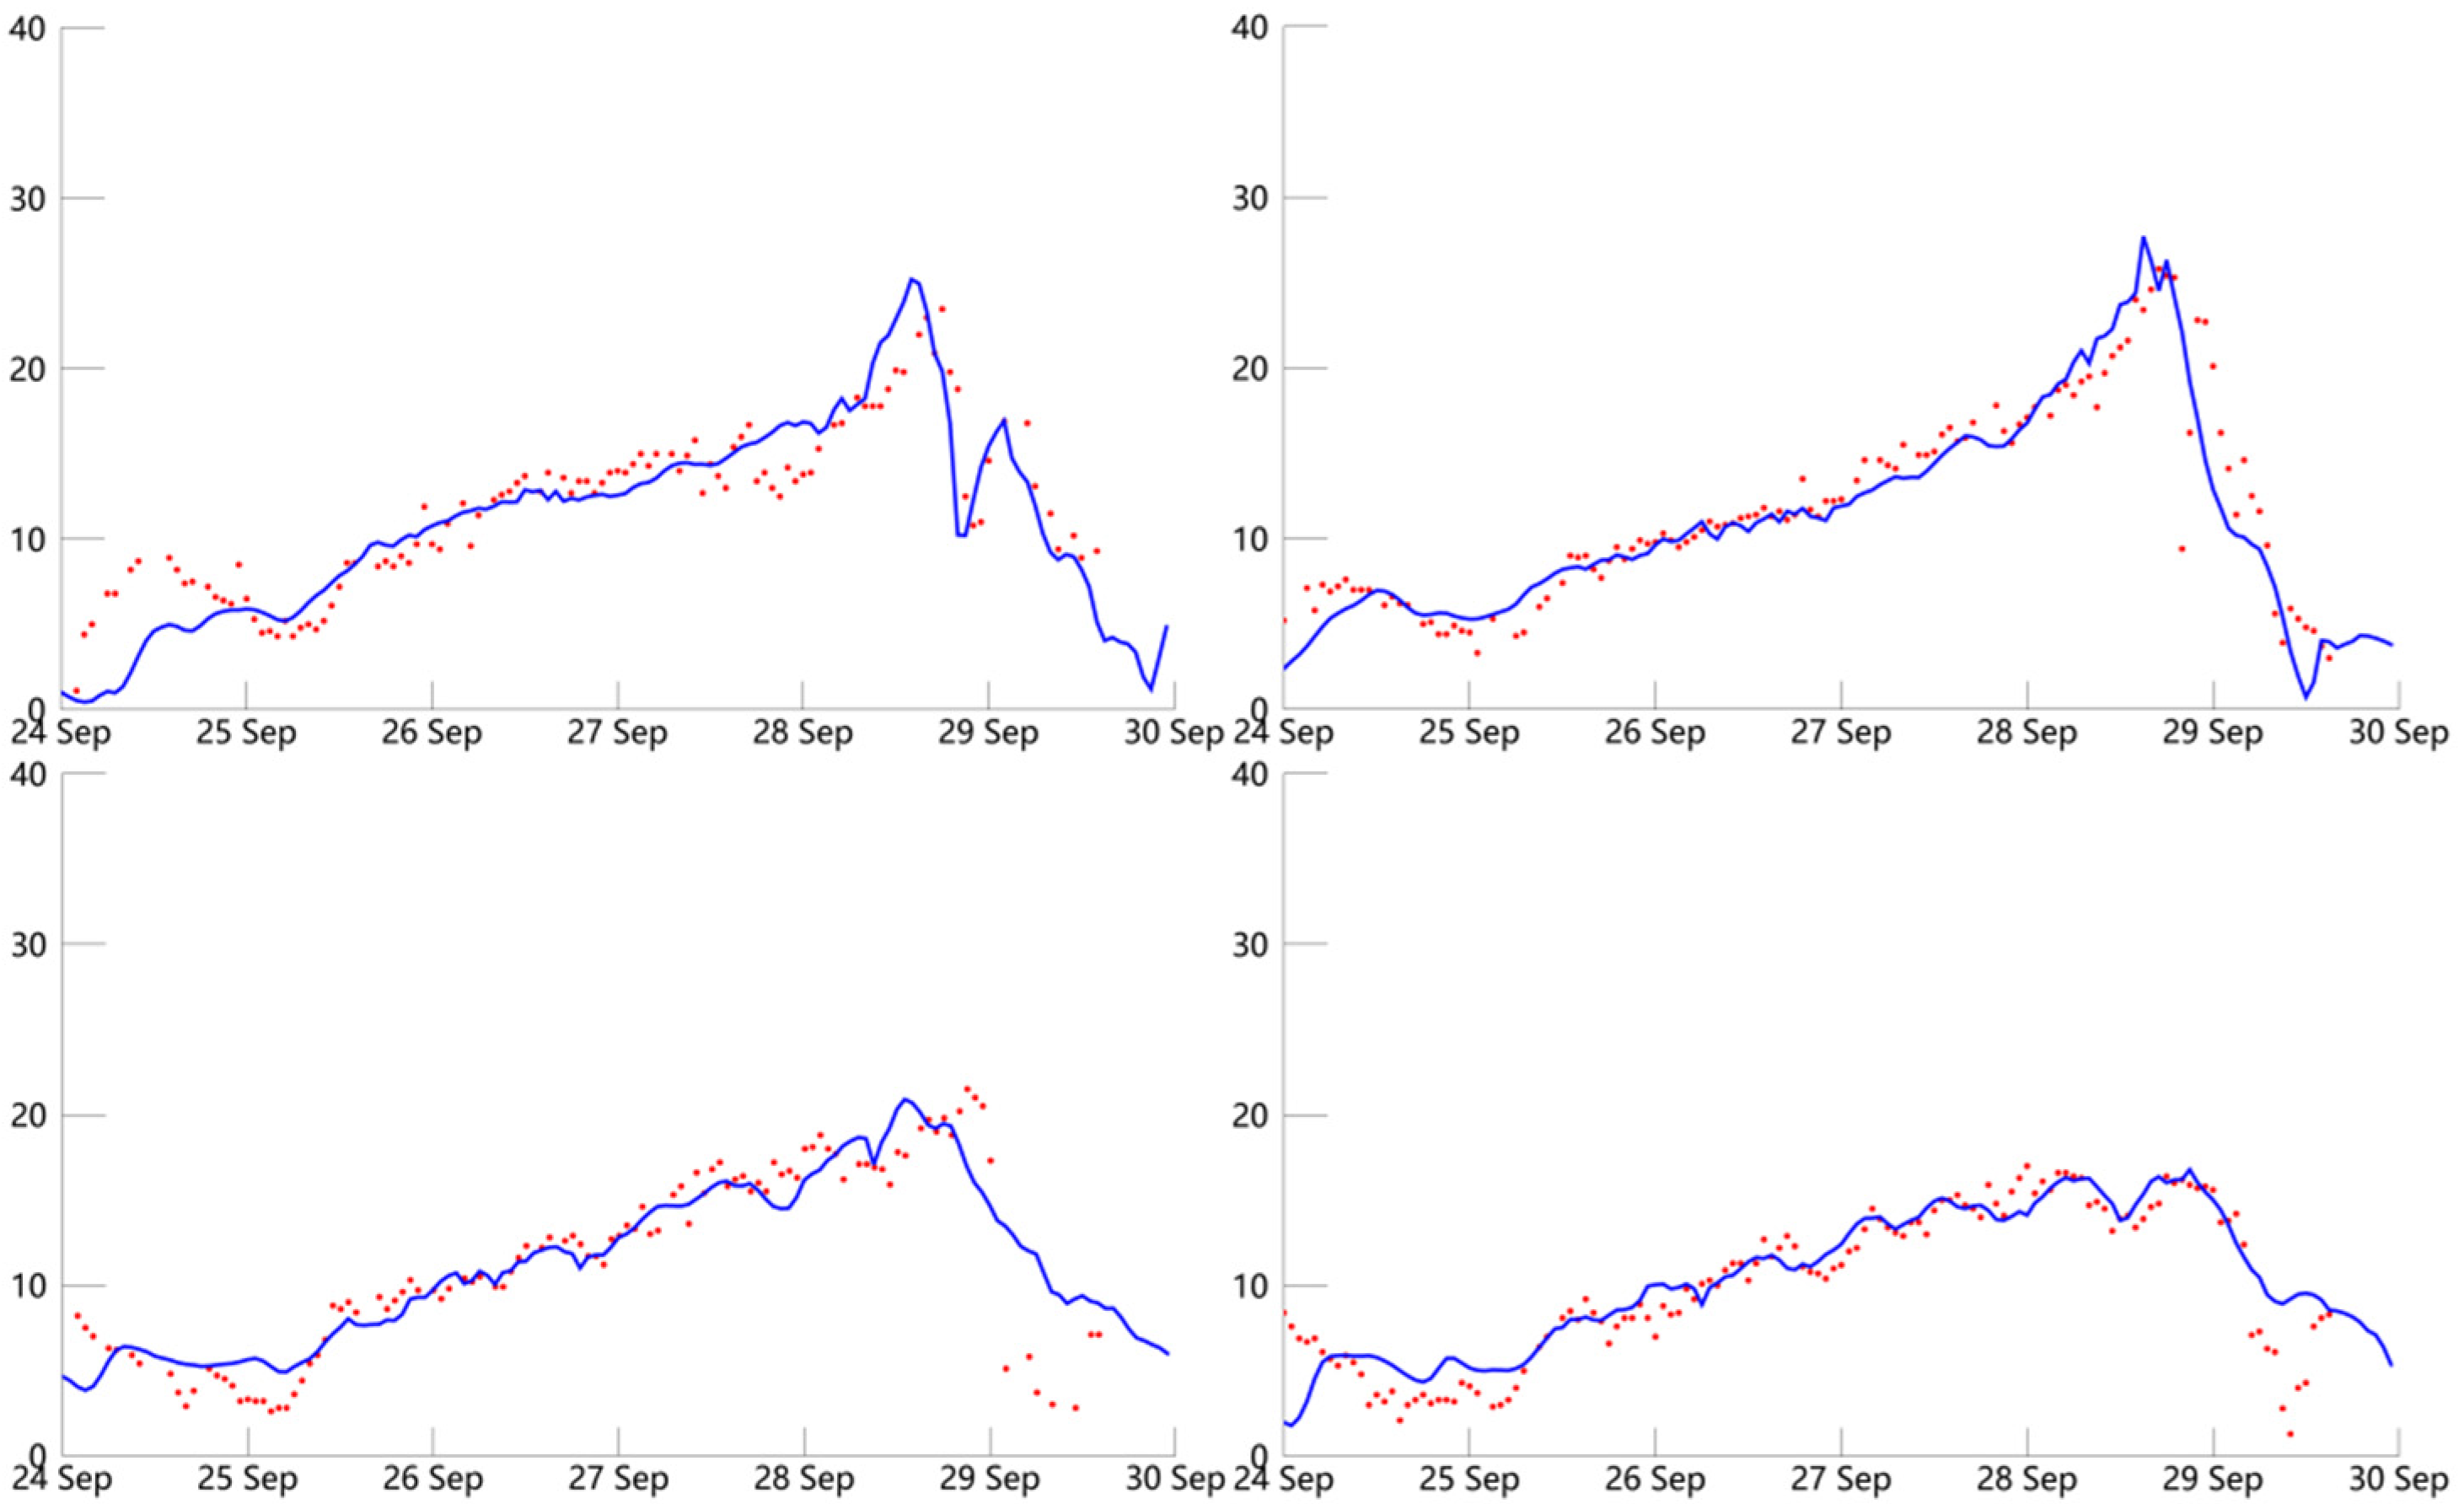
Figure 4.
The temporal distributions of wind speeds (m/s) obtained from experiment 12 (blue line) and the buoy observations (red dot) during typhoon Dujuan at the locations of four buoys.
Figure 4.
The temporal distributions of wind speeds (m/s) obtained from experiment 12 (blue line) and the buoy observations (red dot) during typhoon Dujuan at the locations of four buoys.
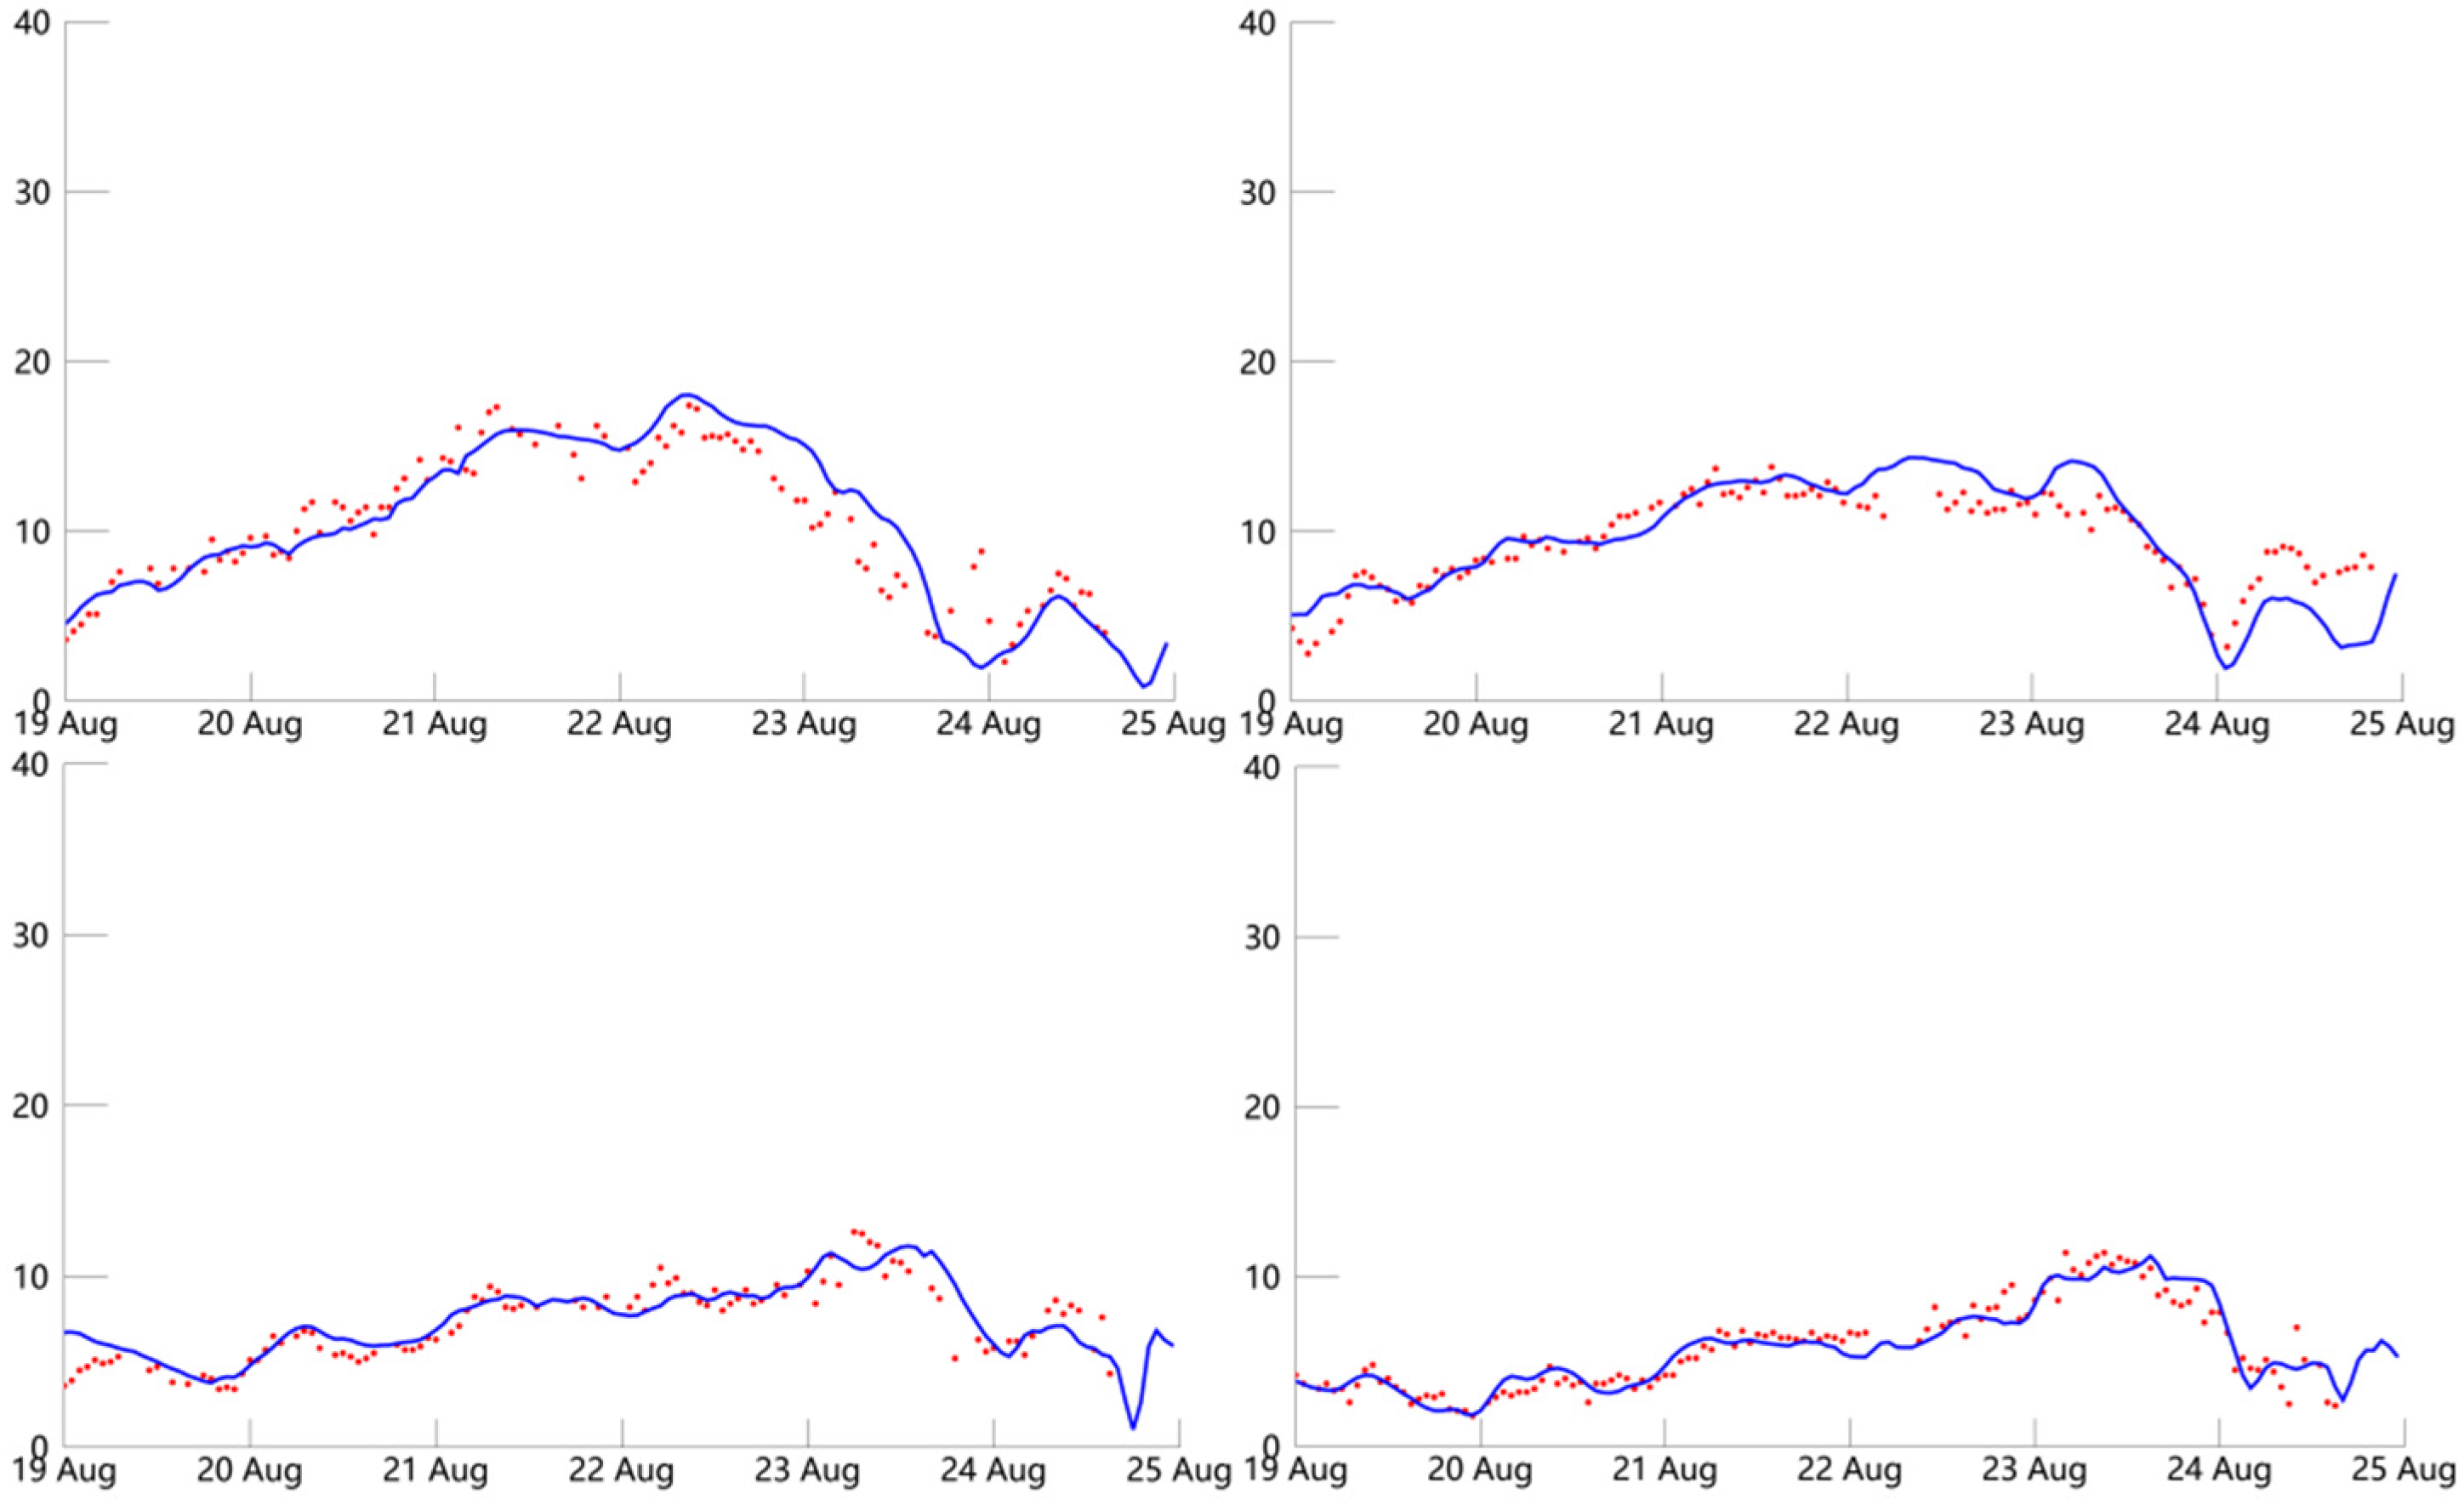
Figure 5.
The temporal distributions of wind speeds (m/s) obtained from experiment 19 (blue line) and the buoy observations (red dot) during typhoon Meranti at the locations of four buoys.
Figure 5.
The temporal distributions of wind speeds (m/s) obtained from experiment 19 (blue line) and the buoy observations (red dot) during typhoon Meranti at the locations of four buoys.
Figure 6.
Taylor diagrams of the wind direction for the three typhoon events and 27 experiments. Red dots stand for experiments, and blue dots stand for ensemble prediction.
Figure 6.
Taylor diagrams of the wind direction for the three typhoon events and 27 experiments. Red dots stand for experiments, and blue dots stand for ensemble prediction.
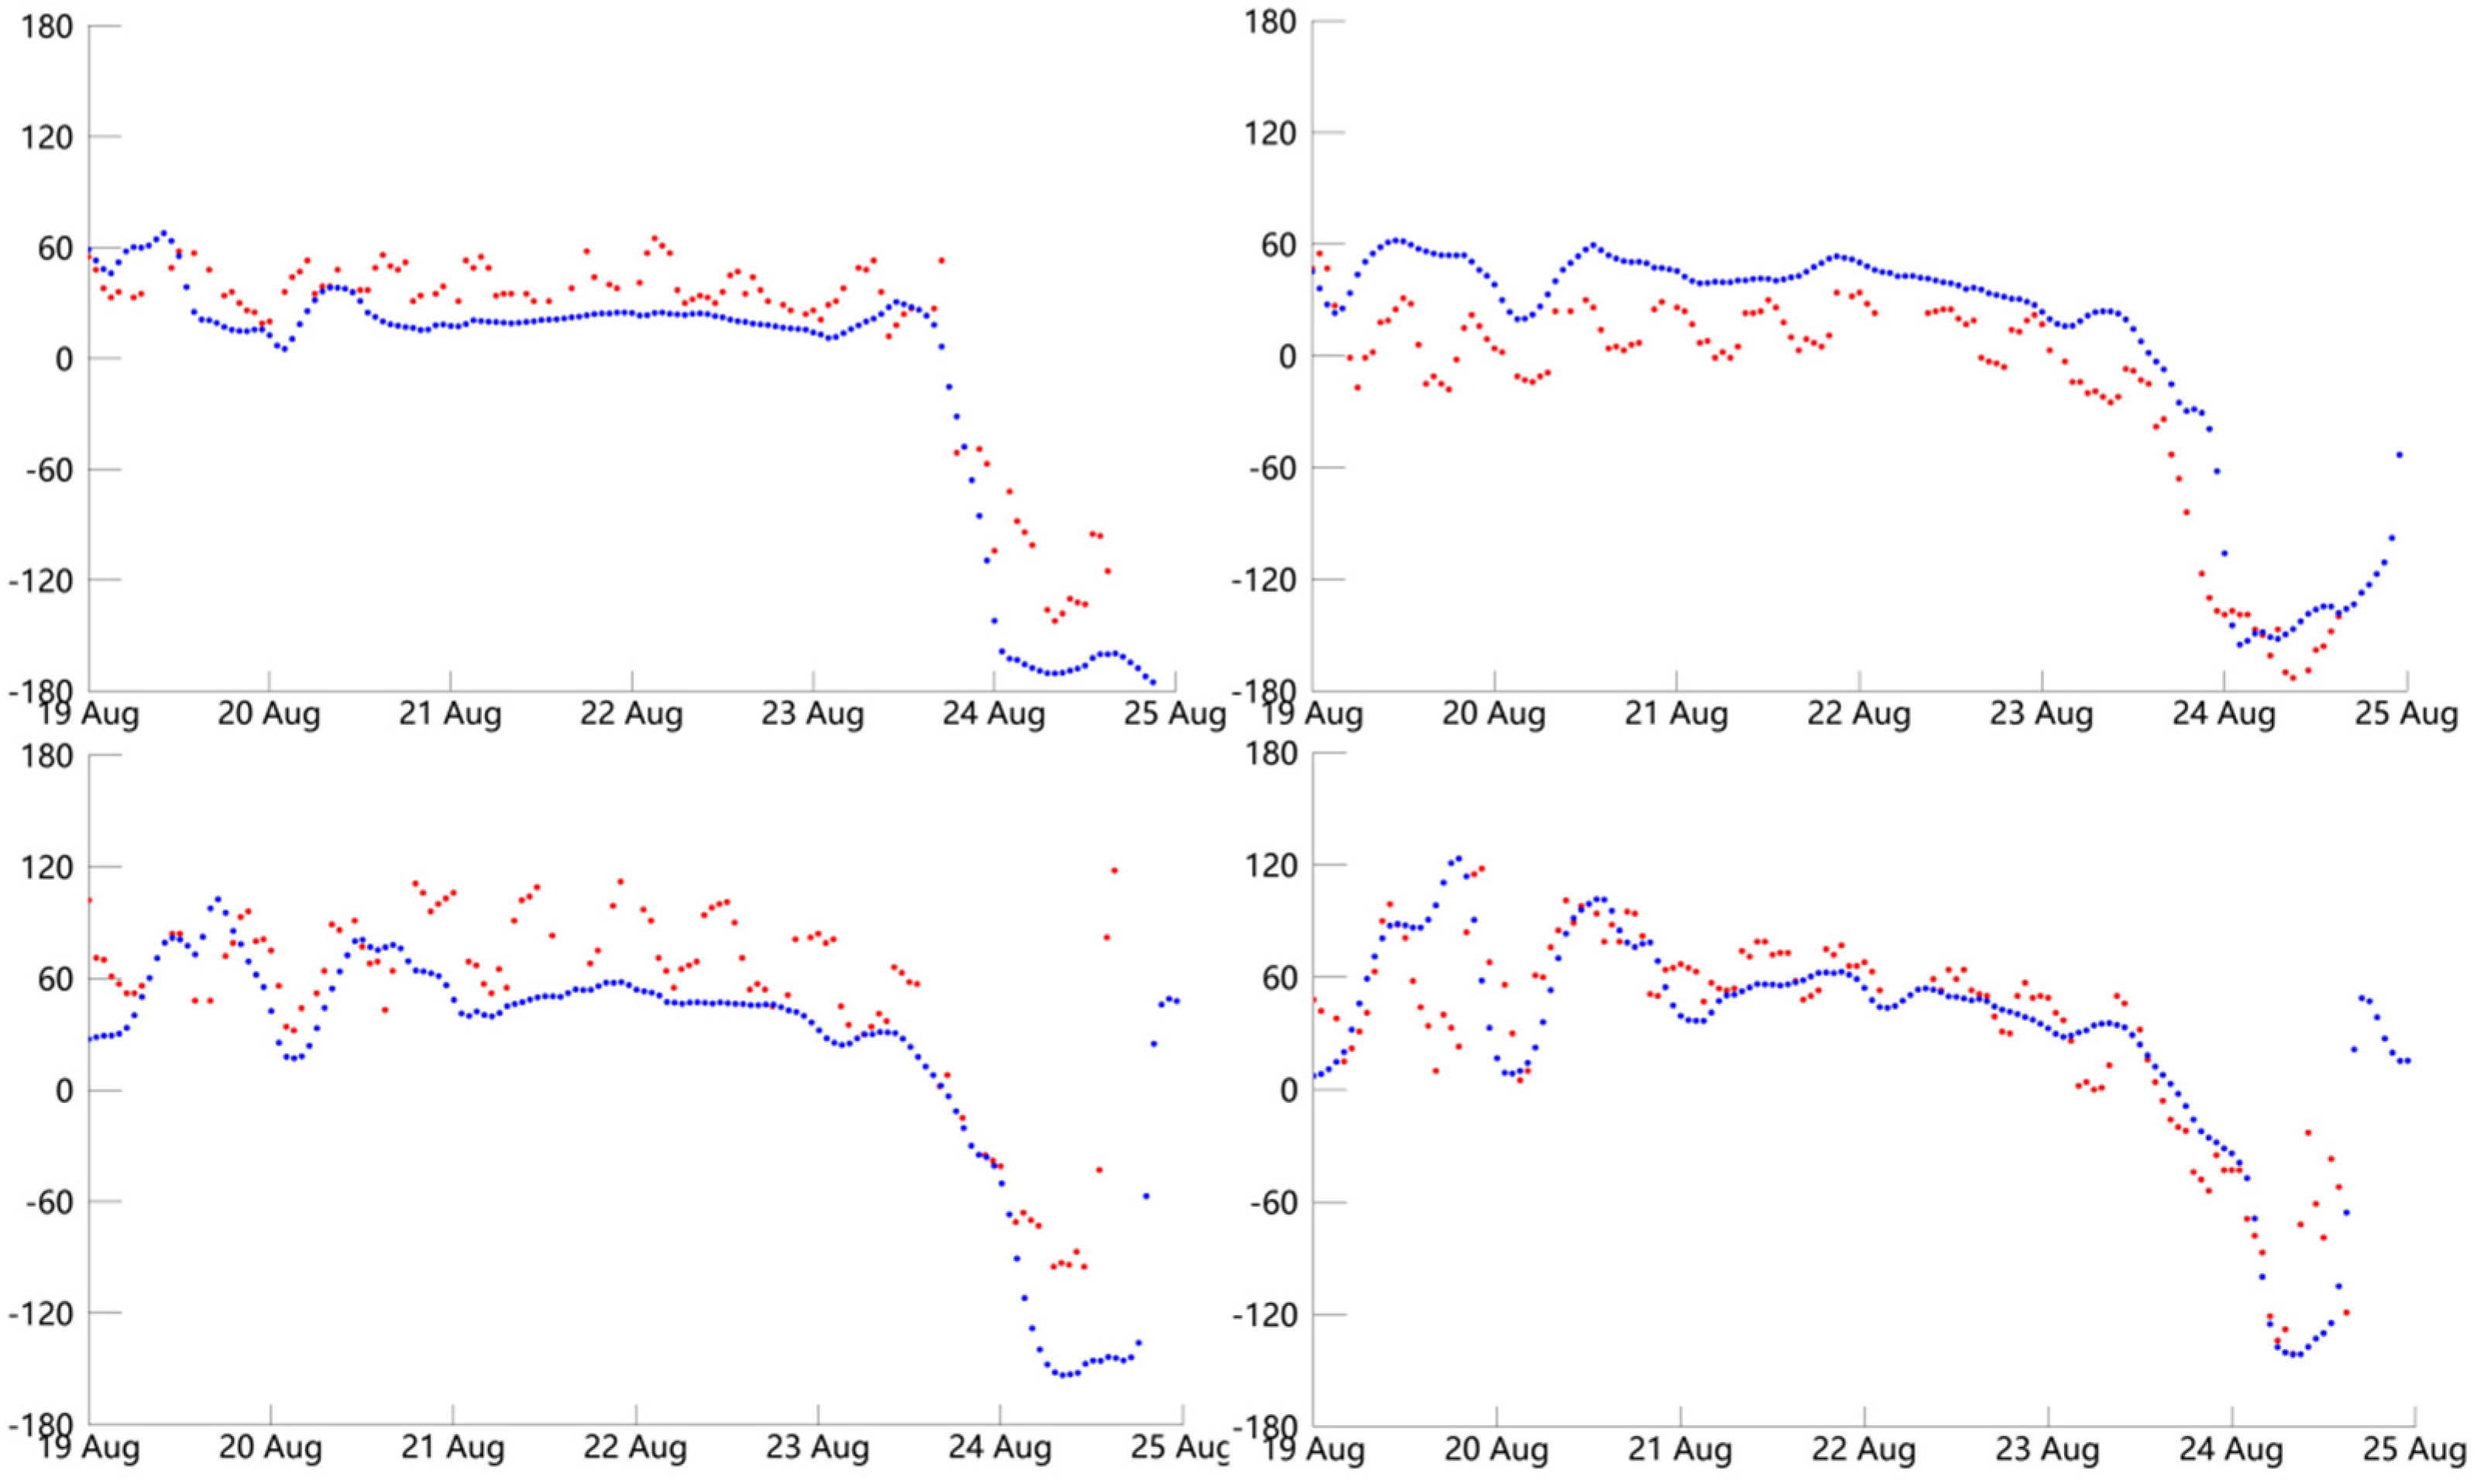
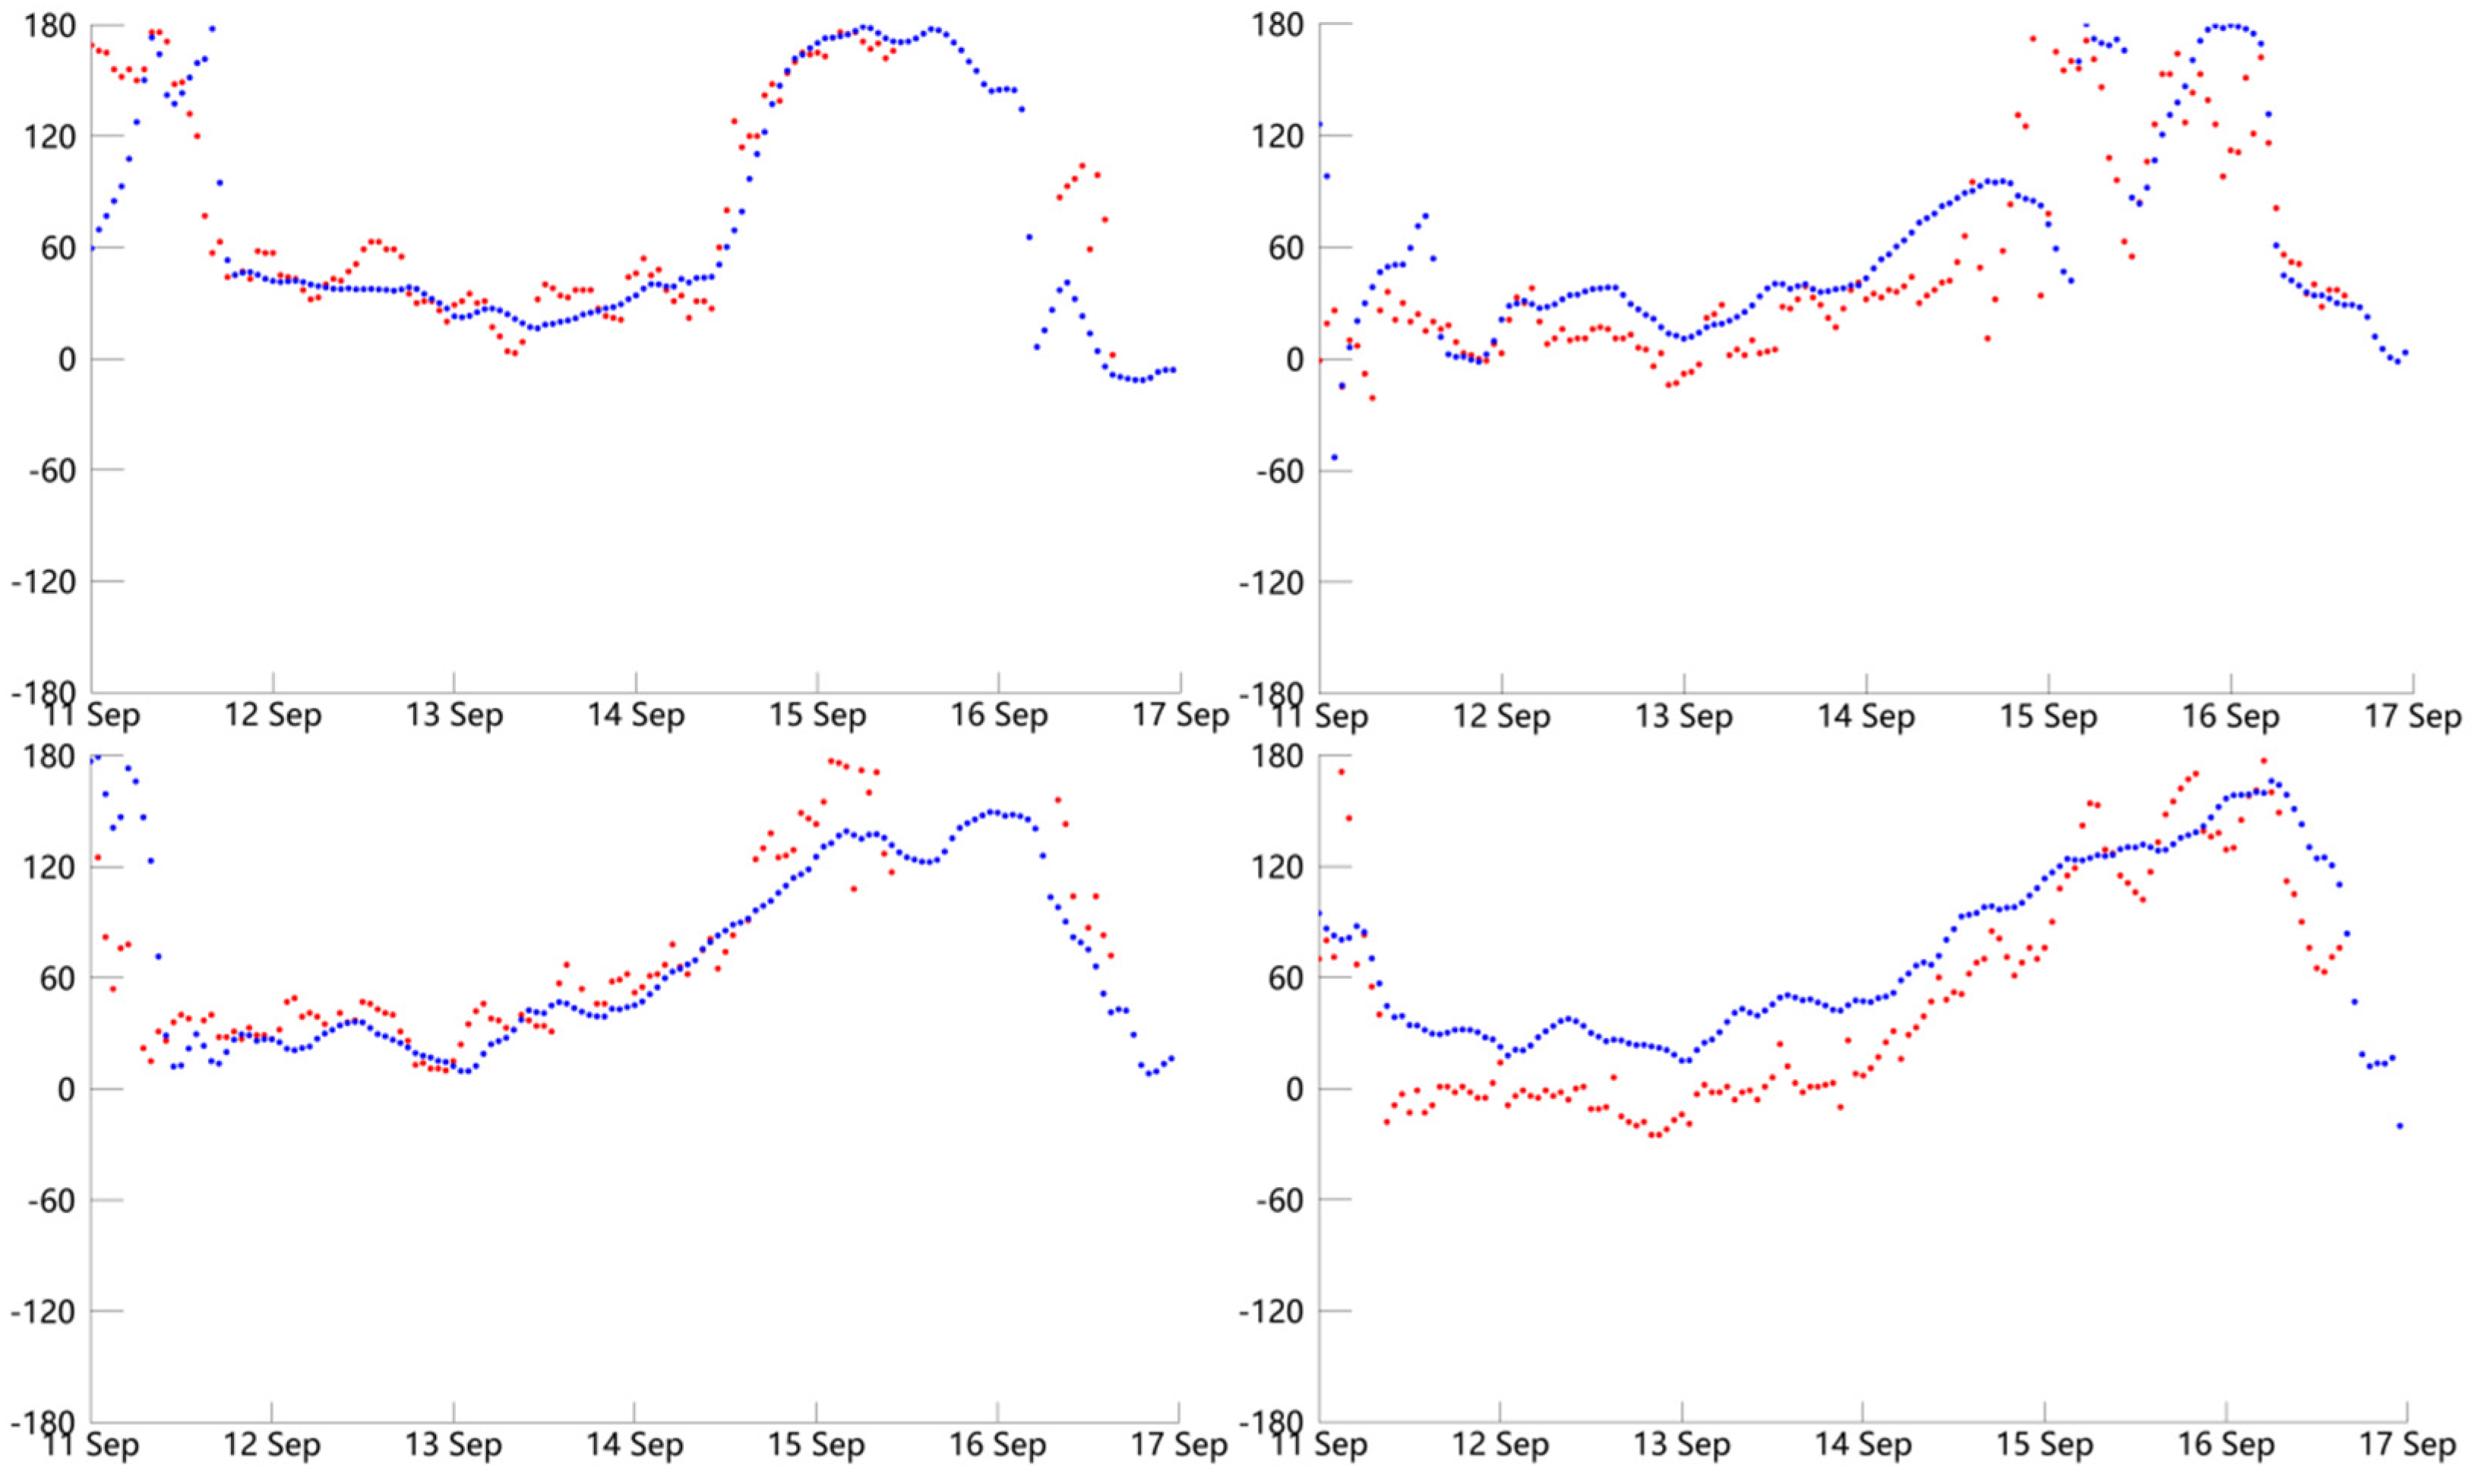
Figure 7.
The temporal distributions of wind directions (degree) obtained from experiment 26 (blue dot) and buoy observations (red dot) during typhoon Goni at the locations of four buoys.
Figure 7.
The temporal distributions of wind directions (degree) obtained from experiment 26 (blue dot) and buoy observations (red dot) during typhoon Goni at the locations of four buoys.
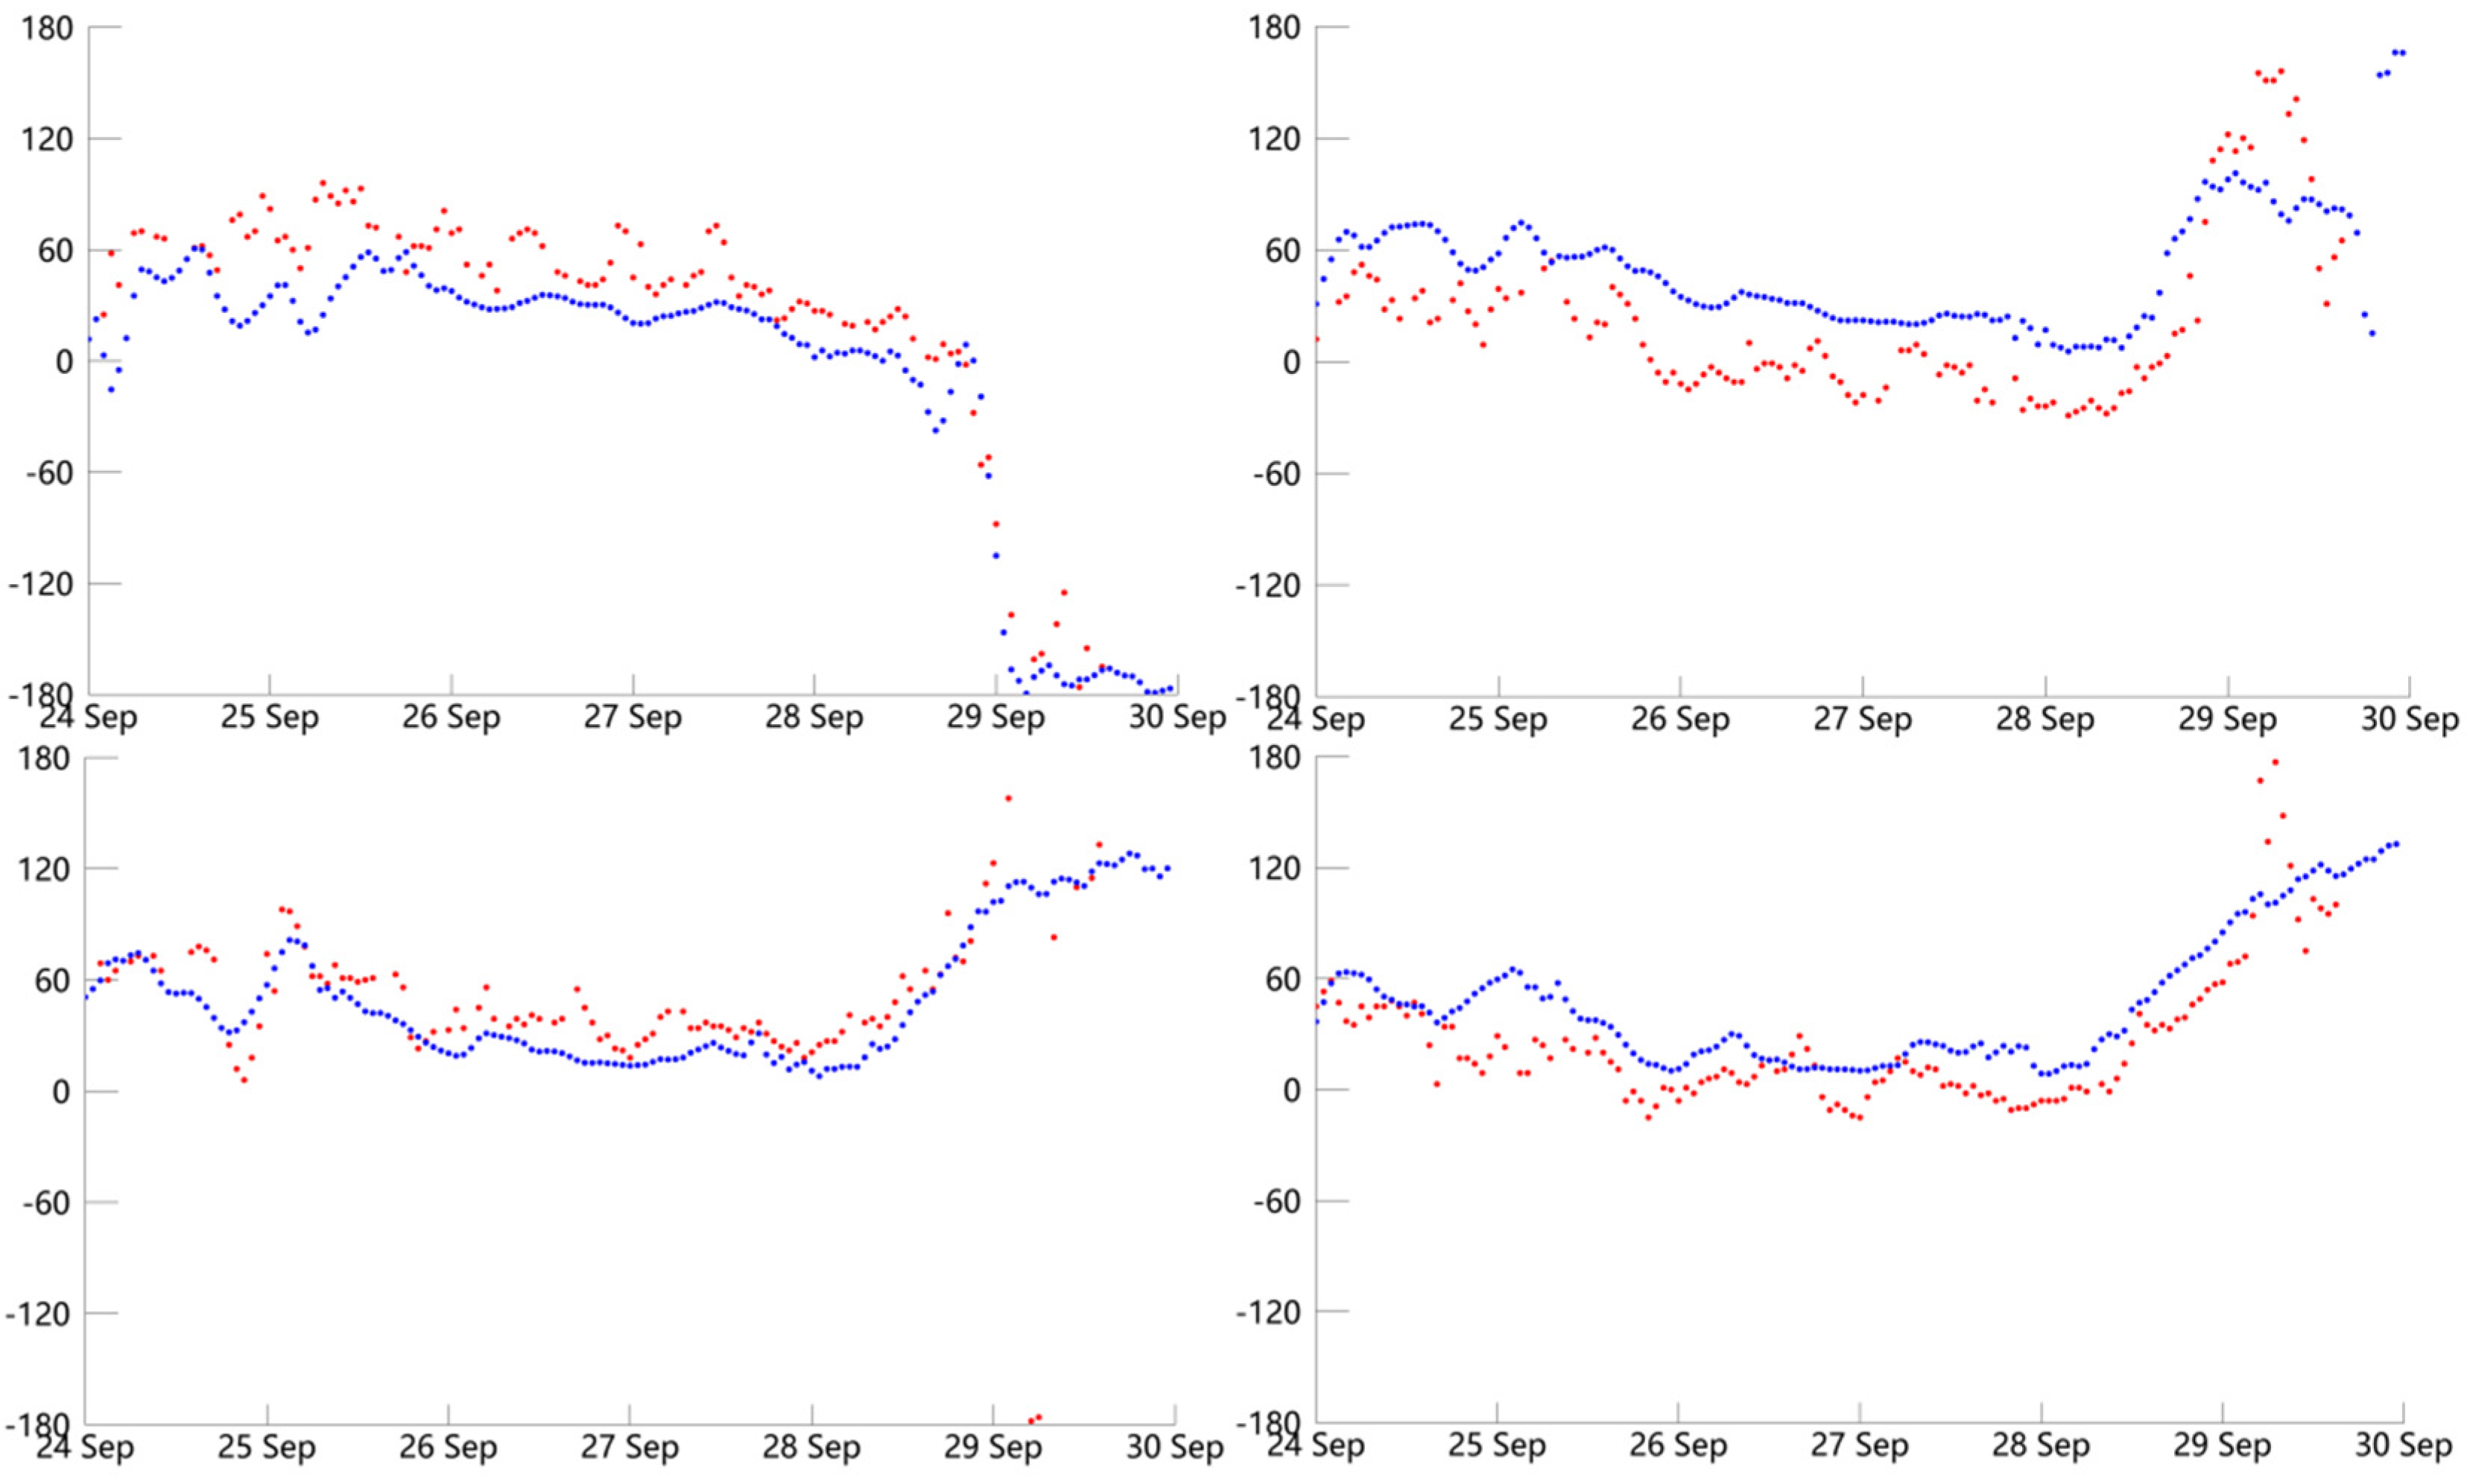
Figure 8.
The temporal distributions of wind directions (degree) obtained from experiment 23 (blue dot) and buoy observations (red dot) during typhoon Dujuan at the locations of four buoys.
Figure 8.
The temporal distributions of wind directions (degree) obtained from experiment 23 (blue dot) and buoy observations (red dot) during typhoon Dujuan at the locations of four buoys.
Figure 9.
The temporal distributions of wind directions (degree) obtained from experiment 2 (blue dot) and buoy observations (red dot) during typhoon Meranti at the locations of four buoys.
Figure 9.
The temporal distributions of wind directions (degree) obtained from experiment 2 (blue dot) and buoy observations (red dot) during typhoon Meranti at the locations of four buoys.
Figure 10.
Taylor diagrams of the significant wave height for the three typhoon events and 27 experiments. Red dots stand for experiments, and blue dots stand for ensemble prediction.
Figure 10.
Taylor diagrams of the significant wave height for the three typhoon events and 27 experiments. Red dots stand for experiments, and blue dots stand for ensemble prediction.
Figure 11.
The temporal distributions of significant wave heights (m) obtained from experiment 19 (red line) and buoy observations (blue dot) during typhoon Goni at the locations of four buoys.
Figure 11.
The temporal distributions of significant wave heights (m) obtained from experiment 19 (red line) and buoy observations (blue dot) during typhoon Goni at the locations of four buoys.
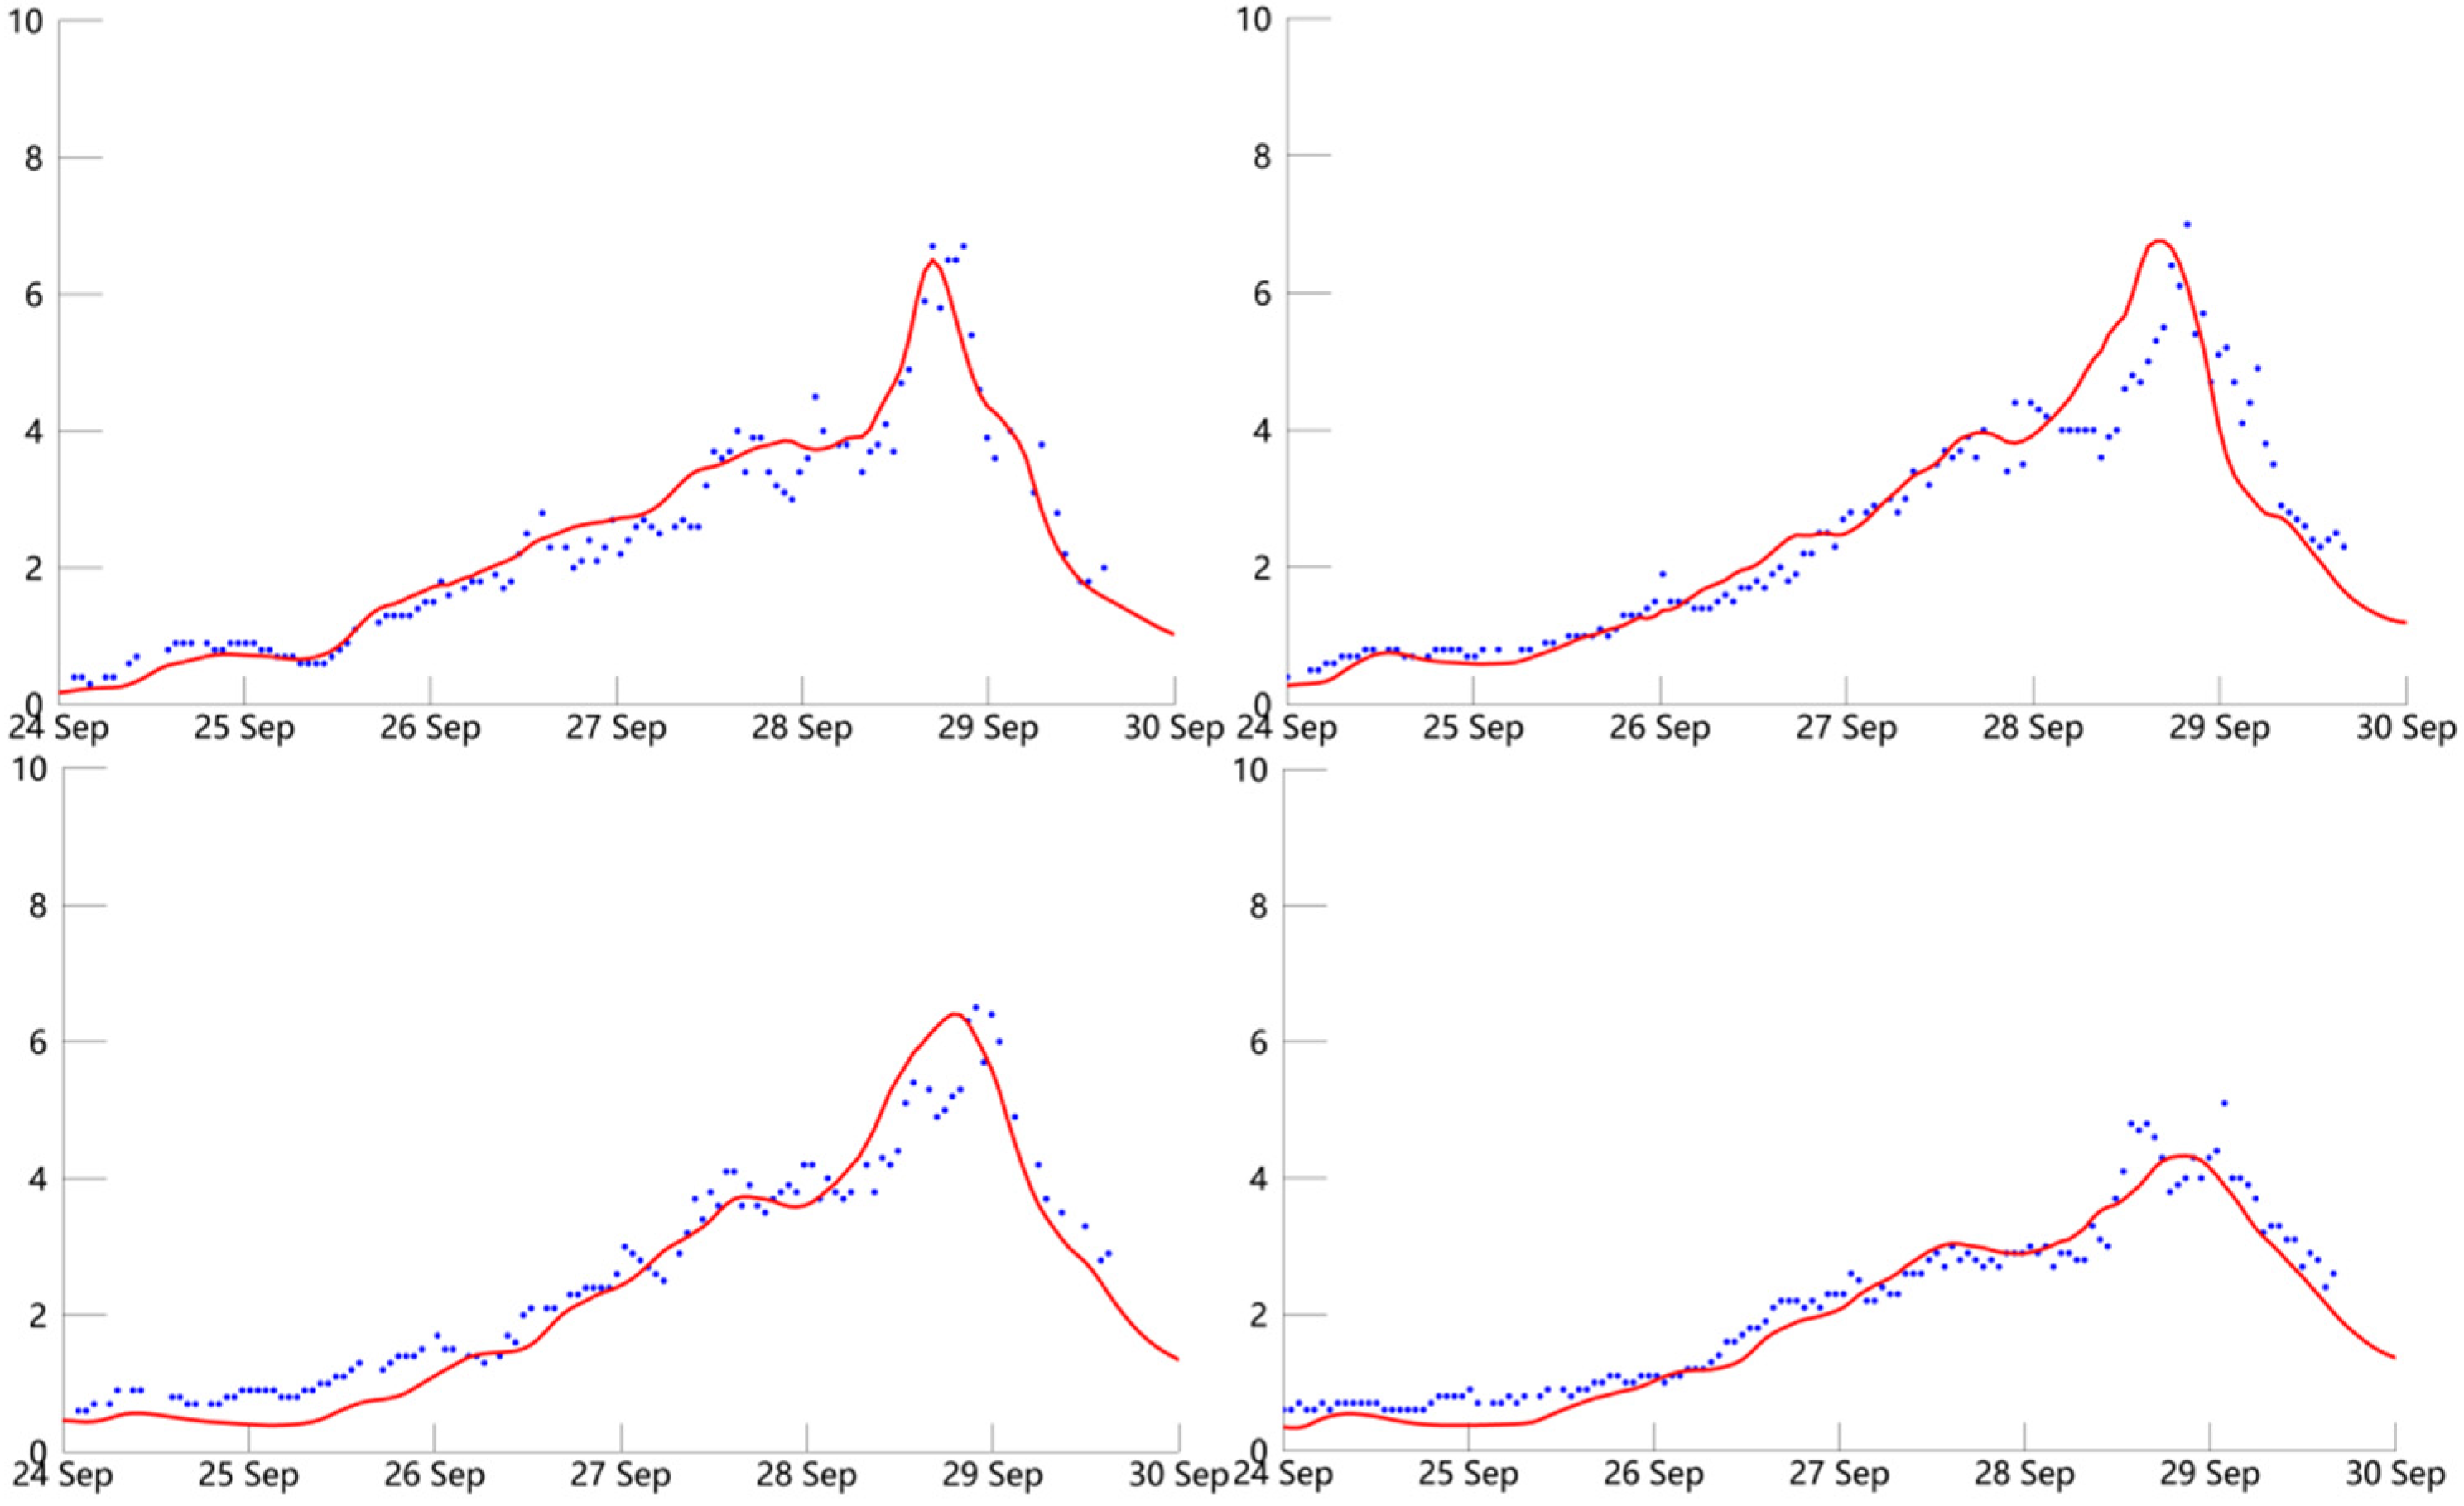
Figure 12.
The temporal distributions of significant wave heights (m) obtained from experiment 1 (red line) and buoy observations (blue dot) during typhoon Dujuan at the locations of four buoys.
Figure 12.
The temporal distributions of significant wave heights (m) obtained from experiment 1 (red line) and buoy observations (blue dot) during typhoon Dujuan at the locations of four buoys.
Figure 13.
The temporal distributions of significant wave heights (m) obtained from experiment 20 (red line) and buoy observations (blue dot) during typhoon Meranti at the locations of four buoys.
Figure 13.
The temporal distributions of significant wave heights (m) obtained from experiment 20 (red line) and buoy observations (blue dot) during typhoon Meranti at the locations of four buoys.
Figure 14.
The tracks of typhoon Noul (red line), Soudelor (blue line), and Nepartak (purple line).
Figure 14.
The tracks of typhoon Noul (red line), Soudelor (blue line), and Nepartak (purple line).
Table 1.
The characteristics of WRF grids.
Table 1.
The characteristics of WRF grids.
| Grid Type | Arakawa C |
|---|
| Map projection | Mercator |
| Time step | 120 s |
| Vertical level | 30 |
| Top pressure | 5000 Pa |
Table 2.
The simulation start and end times of three typhoons.
Table 2.
The simulation start and end times of three typhoons.
| | Simulation Start Time (UTC) | Simulation End Time (UTC) |
|---|
| Goni | 8 September 2015, 00:00 | 27 August 2015, 00:00 |
| Dujuan | 17 September 2015, 00:00 | 30 September 2015, 00:00 |
| Meranti | 9 July 2016, 00:00 | 17 September 2016, 00:00 |
Table 3.
Basic set of the SWAN model.
Table 3.
Basic set of the SWAN model.
| Mode | Two Dimensions |
|---|
| Coordinate system | Spherical |
| Grid type | Regular |
| Minimum depth | 0.05 m |
| Model physics | Gen3 |
Table 4.
Twenty-seven physical parameterization combinations for typhoon simulation experiments.
Table 4.
Twenty-seven physical parameterization combinations for typhoon simulation experiments.
| Experiment ID | Microphysics | Long/Short Wave Radiation | Cumulus |
|---|
| 1 | Lin | RRTM/Dudhia | KF |
| 2 | Lin | RRTM/Dudhia | G3D |
| 3 | Lin | RRTM/Dudhia | TDK |
| 4 | Lin | CAM/CAM | KF |
| 5 | Lin | CAM/CAM | G3D |
| 6 | Lin | CAM/CAM | TDK |
| 7 | Lin | RRTMG/RRTMG | KF |
| 8 | Lin | RRTMG/RRTMG | G3D |
| 9 | Lin | RRTMG/RRTMG | TDK |
| 10 | WSM6 | RRTM/Dudhia | KF |
| 11 | WSM6 | RRTM/Dudhia | G3D |
| 12 | WSM6 | RRTM/Dudhia | TDK |
| 13 | WSM6 | CAM/CAM | KF |
| 14 | WSM6 | CAM/CAM | G3D |
| 15 | WSM6 | CAM/CAM | TDK |
| 16 | WSM6 | RRTMG/RRTMG | KF |
| 17 | WSM6 | RRTMG/RRTMG | G3D |
| 18 | WSM6 | RRTMG/RRTMG | TDK |
| 19 | Morrison | RRTM/Dudhia | KF |
| 20 | Morrison | RRTM/Dudhia | G3D |
| 21 | Morrison | RRTM/Dudhia | TDK |
| 22 | Morrison | CAM/CAM | KF |
| 23 | Morrison | CAM/CAM | G3D |
| 24 | Morrison | CAM/CAM | TDK |
| 25 | Morrison | RRTMG/RRTMG | KF |
| 26 | Morrison | RRTMG/RRTMG | G3D |
| 27 | Morrison | RRTMG/RRTMG | TDK |
Table 5.
R statistics of the wind speed simulation in the three typhoon events.
Table 5.
R statistics of the wind speed simulation in the three typhoon events.
| Correlation | Range | Best Value | Best Experiment |
|---|
| Goni | 0.55–0.65 | 0.636 | 5 |
| Dujuan | 0.7–0.8 | 0.769 | 11 |
| Meranti | 0.65–0.8 | 0.762 | 6 |
Table 6.
σn statistics of the wind speed simulation in the three typhoon events.
Table 6.
σn statistics of the wind speed simulation in the three typhoon events.
| σn | Range | Best Value | Best Experiment |
|---|
| Goni | 0.6–0.8 | 0.817 | 19 |
| Dujuan | 0.75–0.9 | 0.897 | 3 |
| Meranti | 0.7–0.85 | 0.824 | 23 |
Table 7.
En statistics of the wind speed simulation in the three typhoon events.
Table 7.
En statistics of the wind speed simulation in the three typhoon events.
| En | Range | Best Value | Best Experiment |
|---|
| Goni | 0.75–0.85 | 0.766 | 5 |
| Dujuan | 0.65–0.75 | 0.639 | 11 |
| Meranti | 0.65–0.75 | 0.641 | 21 |
Table 8.
Mean skill score of the single physical parameterization in the wind speed simulation.
Table 8.
Mean skill score of the single physical parameterization in the wind speed simulation.
| Physical Parameterization | | Goni | Dujuan | Meranti |
|---|
| Microphysics | Lin | 73.00 | 83.87 | 78.70 |
| | WSM6 | 73.86 | 83.99 | 78.86 |
| | Morrison | 75.48 | 84.37 | 81.23 |
| Longwave/shortwave radiation | RRTM/Dudhia | 75.26 | 84.66 | 80.01 |
| | CAM/CAM | 75.59 | 83.86 | 80.35 |
| | RRTMG/RRTMG | 71.48 | 83.72 | 78.44 |
| Cumulus | KF | 75.93 | 84.23 | 79.70 |
| | G3D | 74.62 | 83.04 | 78.37 |
| | TDK | 71.79 | 84.97 | 80.74 |
Table 9.
R statistics of the wind direction simulation in the three typhoon events.
Table 9.
R statistics of the wind direction simulation in the three typhoon events.
| Correlation | Range | Best Value | Best Experiment |
|---|
| Goni | 0.5–0.9 | 0.914 | 26 |
| Dujuan | 0.15–0.95 | 0.948 | 23 |
| Meranti | 0.3–0.8 | 0.791 | 2 |
Table 10.
σn statistics of the wind direction simulation in the three typhoon events.
Table 10.
σn statistics of the wind direction simulation in the three typhoon events.
| σn | Range | Best Value | Best Experiment |
|---|
| Goni | 0.6–1.1 | 0.993 | 6 |
| Dujuan | 0.6–1.5 | 0.998 | 24 |
| Meranti | 0.75–1.1 | 1.01 | 24 |
Table 11.
En statistics of the wind direction simulation in the three typhoon events.
Table 11.
En statistics of the wind direction simulation in the three typhoon events.
| En | Range | Best Value | Best Experiment |
|---|
| Goni | 0.4–0.9 | 0.409 | 14 |
| Dujuan | 0.3–1.5 | 0.322 | 23 |
| Meranti | 0.6–1.2 | 0.614 | 2 |
Table 12.
Mean skill score of the single physical parameterization in the wind direction simulation.
Table 12.
Mean skill score of the single physical parameterization in the wind direction simulation.
| Physical Parameterization | | Goni | Dujuan | Meranti |
|---|
| Microphysics | Lin | 88.31 | 70.97 | 76.06 |
| | WSM6 | 91.40 | 74.16 | 76.45 |
| | Morrison | 93.73 | 82.44 | 73.62 |
| Longwave/shortwave radiation | RRTM/Dudhia | 93.82 | 74.88 | 72.79 |
| | CAM/CAM | 85.02 | 84.07 | 78.52 |
| | RRTMG/RRTMG | 94.59 | 68.62 | 74.81 |
| Cumulus | KF | 86.39 | 73.99 | 77.51 |
| | G3D | 93.41 | 83.05 | 75.88 |
| | TDK | 93.62 | 70.52 | 72.74 |
Table 13.
R statistics of the significant wave height simulation in the three typhoon events.
Table 13.
R statistics of the significant wave height simulation in the three typhoon events.
| Correlation | Range | Best Value | Best Experiment |
|---|
| Goni | 0.45–0.55 | 0.519 | 5 |
| Dujuan | 0.7–0.8 | 0.789 | 11 |
| Meranti | 0.7–0.8 | 0.776 | 10 |
Table 14.
σn statistics of the significant wave height simulation in the three typhoon events.
Table 14.
σn statistics of the significant wave height simulation in the three typhoon events.
| Σn | Range | Best Value | Best Experiment |
|---|
| Goni | 0.6–0.7 | 0.712 | 19 |
| Dujuan | 0.75–0.85 | 0.822 | 1 |
| Meranti | 0.65–0.75 | 0.766 | 5 |
Table 15.
En statistics of the significant wave height simulation in the three typhoon events.
Table 15.
En statistics of the significant wave height simulation in the three typhoon events.
| En | Range | Best Value | Best Experiment |
|---|
| Goni | 0.8–0.9 | 0.839 | 6 |
| Dujuan | 0.6–0.7 | 0.629 | 11 |
| Meranti | 0.6–0.7 | 0.639 | 10 |
Table 16.
Mean skill score for the single physical parameterization in the significant wave height simulation.
Table 16.
Mean skill score for the single physical parameterization in the significant wave height simulation.
| Physical Parameterization | | Goni | Dujuan | Meranti |
|---|
| Microphysics | Lin | 64.15 | 82.53 | 77.24 |
| | WSM6 | 64.51 | 82.39 | 76.28 |
| | Morrison | 66.62 | 83.15 | 76.17 |
| Longwave/shortwave radiation | RRTM/Dudhia | 67.01 | 83.21 | 78.08 |
| | CAM/CAM | 65.78 | 82.49 | 76.35 |
| | RRTMG/RRTMG | 62.49 | 82.37 | 75.27 |
| Cumulus | KF | 66.98 | 83.05 | 76.33 |
| | G3D | 64.83 | 82.25 | 77.66 |
| | TDK | 63.47 | 82.76 | 75.70 |
Table 17.
Skill scores of the wind speed, wind direction, and significant wave height obtained from the best simulation experiments for typhoons Noul, Soudelor, and Nepartak.
Table 17.
Skill scores of the wind speed, wind direction, and significant wave height obtained from the best simulation experiments for typhoons Noul, Soudelor, and Nepartak.
| Skill Score | Noul | Soudelor | Nepartak |
|---|
| Wind speed | 79.51 | 87.6 | 82.31 |
| Wind direction | 89.82 | 92.66 | 86.42 |
| Significant wave height | 70.12 | 85.71 | 70.88 |


