Article

Separation Zone Required to Buffer Hazardous Waste Landfills Impact on Scattered Water Supply Sources: From a Whole Lifespan Perspective

1
School of Information and Communication Engineering, Beijing University of Technology, Beijing 100124, China
2
State Key Laboratory of Environmental Criteria and Risk Assessment, Chinese Research Academy of Environmental Sciences, Beijing 100012, China
3
CCCC-FHDI Engineering Co., Guangzhou 510289, China
*
Author to whom correspondence should be addressed.
Water 2023, 15(8), 1489; https://doi.org/10.3390/w15081489
Submission received: 3 February 2023 / Revised: 8 March 2023 / Accepted: 16 March 2023 / Published: 11 April 2023
(This article belongs to the Section Water Quality and Contamination)

Abstract

:
Threats from landfill leachate leakage to groundwater quality in remote areas is a major concern globally. Buffering distance (BFD) maintained between landfill site and groundwater supply wells is important to prevent drinking water from contamination of hazardous pollutant. Ignoring the leakage increase in the end of landfill life leads to an underestimate of BFD demand, posing potential threat to drinking safety. This paper constructs a framework for BFD prediction with the consideration of landfill performance degradation by coupling landfill performance evaluation model with the aging and defect evolution model of landfill engineering materials, and carries out model application and verification in a coastal hazardous waste landfill. The results show that during the life cycle of a landfill, its BFD experienced a 1.5-time increase from the start of its operation to its life end and reached 3000 m. Under the condition of landfill performance degradation, the BFDs required to attenuate heavy metals experience more increase than those of organic pollutants; BFD required for zinc (Zn), for example, increases 720 m over the no-degradation condition, while 2,4-dichlorophenol(2,4-D) increases by only 288 m. Considering the uncertainty sourced from model parameter and structure, the BFD should be more than 4050 m to ensure long-term safe drinking under unfavorable conditions such as large amount of leachate, weak degradation and fast diffusion of pollutant in vadose and aquifer. If the BFD cannot meet the demand at the end of the landfill life, the leaching behavior of solid waste can be controlled to reduce it depending on BFD. For example, when the leaching concentration of Cd in the waste is reduced from 0.6 mg/L to 0.17 mg/L, the buffering distance is be reduced from 3000 m to 500 m.

1. Introduction

Landfill is the main destination of solid waste management meanwhile the secondary pollution such as groundwater contamination caused by it has attracted global attention in recent years [1,2]. Leachate produced in landfill contains a variety of constituents with high toxicity, e.g., persistent organic pollutants (POPs), heavy metals and ammonia [3,4]. Groundwater once contaminated by leachate will not only cause a series of ecological and environmental problems such as water eutrophication and soil salinization, but also may produce a variety of adverse effects on body health. For example, heavy metals in the leachate increase the risk of cancer and infant death, and induce children’s motor and cognitive dysfunction [5,6]. Nitrates commonly detected in landfills may increase the risk of “blue babies” [7,8], spontaneous abortion in pregnant women, and other diseases. Indeed, modern engineering landfills are designed and constructed to minimize leachate emission. However, leachate leakage accidents always occur due to the primary or secondary damage of engineering barrier during landfill construction and operation. It is estimated that the defect of HDPE geomembrane in China’s landfills is approximately 17 per hectare [9], and that of the United States and Italy has reached 34 and 15, respectively [10,11].
Leachate’s high toxicity and its possible emission highlight the significance of BFD. BFD refers to a zone with a certain width reserved between the landfill site and the water supplying source [12]. Porous mediums in vadose zone and aquifer are natural filter and adsorbent materials [13]. Therefore, with BFD, if reasonably determined and maintained, the toxic substances entering groundwater will be effectively removed in the case of leachate leakage, through the filtering, adsorption, and dilution of the vadose zone and aquifer media [14,15]. As a result, the adverse impacts of unpredicted leachate leakage on sensitive water sources around the landfill will be effectively reduced.
The BFD required between the landfill and the surrounding water supply source has been extensively studied. In some countries and regions, BFD requirements are set out in the form of laws and regulations. For example, China’s mandatory standard states that the BFD should be reasonably determined based on the actual environmental impact (GB18598-2019). Standards and regulations in British Columbia, Canada are more explicit, requiring that landfills should be located at least 300 m from the nearest residential areas and other public facilities [16].
To support the scientific setting of BFD, Xu et al. [17] analysed the scientific context of BFD setting between hazardous waste landfills (HWL) and downstream sensitive water sources, presenting for the first time a framework for BFD calculations and accompanying models for contextual analysis, and demonstrating and validating them. On this basis, the BFD of landfills has been widely and thoroughly discussed. For example, Xiang et al. [18] predicted BFD for the purpose of protection against microorganisms and harmful bacteria by considering the differences between municipal solid waste landfill (MSWL) landfills and HWL characteristic pollutants; JI and Zhang Luyu et al. [19] studied the BFD requirements for waterfront and arid zone landfills, respectively, by considering the differences in climatic and hydrological address conditions in different regions. In addition to considering the effects of different factors on BFD, some scholars have combined optimization algorithms such as multi-objective genetic algorithms or GIS techniques to design landfill buffers [20,21,22]. In addition, the above methods have been used for BFDs in waste treatment facilities similar to landfills (small wastewater treatment plants) [23].
Previous studies on BFD calculation always assume that leachate leakage is stable during the whole life cycle of landfill. However, recent studies revealed that under the complex stress and strain environment, landfill engineering materials gradually age, leading to the significant increase in leachate leakage and its impact on groundwater in the end of landfill life. For example, ultraviolet radiation, abnormally high or low temperatures, chemical corrosion and creep, and antioxidant depletion cause the decline in the mechanical and hydraulic properties of HDPE GM [24]. Pipe failure or drainage medium clogging cause the decline in the landfill drainage performance, leading to the accumulation of leachate and induce a high leachate saturated level [25]. Therefore, with the long-term aging of engineering materials, a greater BFD may be required to ensure the safety of surrounding water sources. Obviously, the BFD calculated without considering the change in leachate release is optimistic and may not implement effective buffer in the whole life cycle of the landfill. Considering the large number and worldwide distribution of landfills, this misestimation will lead to groundwater pollution by a large range of landfills, especially for some scattered groundwater sources in underdeveloped areas and remote villages in developing countries [26].
In order to make up for the above deficiencies, this study plans to construct an improved BFD calculation framework, which is coupled with the prediction model of the performance degradation of the main functional units of the landfill, the water balance model of the landfill and the migration and transformation model after leachate leakage, in order to effectively predict the BFD demand under the conditions of the aging of the landfill engineering materials and the increase of long-term leakage. In addition, considering that the hydraulic gradient of the aquifer in the coastal area is relatively large, and the adsorption capacity of the vadose zone is relatively weak, which may be a site type with higher BFD requirements, a coastal hazardous waste landfill site is selected to carry out model application and validation research, with the purpose of revealing the differences in the BFD demand at different stages of the landfill under representative conditions and analyzing the uncertainty of the BFD demand under long-term aging conditions. In addition, this study also attempts to propose response strategies to deal with the unrealistic situation that the BFD demand of some end-of-life landfills is too large.

2. Models and Methods

As mentioned above, BFD refers to the distance that the landfill site needs to maintain to the nearest sensitive water source in the direction of the regional water flow gradient to guarantee the safety of the water source under the conditions of leachate leakage [27]. Therefore, the key to the prediction of BFD is to determine the safe water use limit for different pollutants and to measure the attenuation of pollutant concentrations along the gradient direction of groundwater with distance [28]. In view of the latter, Xu et al. [17] developed a prediction method for groundwater pollution and distribution under the condition of steady seepage of leachates, without considering the aging and defect evolution of engineering materials. The key questions to be solved in this study include the following: How to predict the aging and defect evolution of engineering materials under the use environment of landfills, and then what dynamic changes will occur in the leachate? How to couple the dynamic change source term with the groundwater migration and diffusion differential equation to obtain the attenuation and dilution process of pollutants?

2.1. Water Quality Criteria for Safe Drinking

A number of countries have formulated drinking water quality standards and have proposed different control requirements for the concentrations of various pollutants that may exist in water, primarily for organic and inorganic substances and heavy metals [29]. However, with the development of urbanization, landfill leachates contain diverse types of pollutants, and the existing standards may not cover all pollutants [30]. Therefore, the method of determining the limit value of pollutants in safe water based on risks recommended by the World Health Organization has been promoted (WHO, 2011). This method combines the habits, physical characteristics of the exposed population and the toxicity of the target pollutants [31], and it can be used to determine the limits of safe water use indicators for new pollutants or other water quality standards that do not cover toxic and harmful pollutants.
To summarize, the limit concentration of safe water quality in this study was based on the following two points: for toxic and harmful pollutants in leachates, if they belonged to the control index specified in the Groundwater Quality Standard (GB/T 14848-2017) [32], the limit value specified in the standard was used; if the pollutant did not belong to the control indicators specified in this standard, the risk assessment method recommended by World Health Organization (WHO, 2011) was used to determine the safe water limit. The risk assessment considers the carcinogenic and noncarcinogenic risk of drinking groundwater polluted by leachates. Some pollutants pose only one of the risks, and some pose both risks. For specific pollutants, the noncarcinogenic risk (HQcgw) of drinking groundwater containing noncarcinogenic hazardous pollutants can be calculated as follows [17]:
H Q c g w = C G W E R n c × C g w R f D 0 × W A F .
The definitions of the parameters in Formula (1) are presented in Table 1. CGWERnc can be calculated as follows:
C G W E R n c = G W C R a × E F a × E D a B W a × A T n c .
The definitions of the parameters in Formula (2) are presented in Table 1.
The carcinogenic risk of pollutants can be calculated as follows [17]:
CR = C G W E R c a × C g w × SF , CR 0.01 CR = 1 exp C G W E R c a × C g w × S F , CR > 0.01 .
The definitions of the parameters in Formula (3) are presented in Table 1.
In general, when HQcgw < 1 or CR < 10−6, the health risk is acceptable. Therefore, let HQcgw = 1 (or CR = 10−6) and apply this to Formulas (1) and (2) or Formulas (1) and (3) to obtain the limit concentration (CL) of specific pollutants in the water body.

2.2. Leachate Emission and Mitigation in Subsurface Media under Landfill Performance Degradation

To explain the long-term characteristics of leachate generation and leakage and their effects on groundwater and human health, three models were employed [33]: (i) the HELP model for portraying the amount of leachate generation and leakage from landfills, (ii) the EPACMTP model for simulating the migration and diffusion of contaminants in unsaturated zones and saturated groundwater, and (iii) an aging and defect evolution model for describing the aging process of HWLs, including the leachate collection and drainage system (LCDS), the capping system (CS), and the liner system (LS) [12].

2.2.1. HELP Model

The landfill leachate generation and leakage processes were simulated using the HELP model, a landfill hydrologic characterization model developed by the USGS for the US Environmental Protection Agency. The model integrates several sub-models to characterize the surface and subsurface hydrologic processes at the landfill, including the conversion of rainfall from the surface to runoff, the subsurface lateral drainage, and leakage through clay, geomembranes, and composite liners [34]. These submodule calculations fully consider the landfill structure, climatic and meteorological conditions, and material characteristics of the landfill cover soil, waste units, the lateral drainage layer, clay barrier layers, and artificial geomembrane liners [35]. In addition, the model integrates a meteorological data generator that automatically predicts landfill infiltration based on temperature, solar radiation, and rainfall data from more than 3000 sites worldwide [34].
The main input parameters of the HELP model include geographic coordinates of the study area (representative meteorological stations are selected according to the coordinates), surface parameters (e.g., slope, slope length, and vegetation type), and structural and material parameters of the capping and liner system (drainage blanket conductivity and drainage volume, the HDPE membrane infiltration coefficient, and the number of defects) [34]. The model outputs include time series values of precipitation, evapotranspiration, cap infiltration, drainage, and leakage. In this study, the HELP model was used to calculate and obtain the amount of leachate generation and leakage as the input data of the EPACMTP model.

2.2.2. Aging and Defect Evolution Model for HWL Engineering Materials

The HELP model for landfill hydrological characterization fails to consider the effect of aging of the main functional units on leachate generation and leakage. Therefore, this study introduced a series of models to describe the aging processes of the landfill liner, capping, and leachate collection and diversion system units. Then, the values of the HDPE geomembrane permeability coefficient, the number of defects, and permeability coefficient due to drainage layer blockage calculated by the aging model were taken as the input parameters of the HELP model to predict the long-term source intensity changes of leachate generation and seepage affected by aging of engineering materials [36]. Geomembrane materials used in landfill leachate generation and leakage control are subject to chemical oxidation via the leachate, solar radiation, and stress, and the physicochemical properties may degrade, resulting in increased permeability coefficients or mechanical property degradation and breakage. In addition, the drainage media in leachate drainage systems are susceptible to various biological, physical, and chemical effects that can easily produce various substances that block the pores in the drainage media, thereby degrading the drainage performance. For HDPE membranes and drainage media with potential performance degradation, the following models were used to express the changes in performance parameters due to their degradation [37].
The change in permeability coefficient due to aging of HDPE geomembranes in sealed field cover and leachate conductive drainage system can be expressed as follows:
K g m t = 1.33 × 10 10 × t 250 .
The definitions of the parameters in Formula (4) are presented in Table 1.
The number of defects caused by aging of HDPE with time is provided by
N t = N 0 ( log N 0 2 + 1 ) 0.004 t 100 .
The definitions of the parameters in Formula (5) are presented in Table 1.
The variation of the permeability coefficient with time due to the blockage of the drainage medium in the leachate drainage system can be expressed as follows:
K d t = e 0.0375 t × K d 0 ( K d K w a s t e ) K w a s t e   ( K d = K w a s t e ) .
The definitions of the parameters in Formula (6) are presented in Table 1.

2.2.3. Simulation of the Leachate Migration Transformation Process

The migration dispersion of leachate and its contaminant components in the vadose and groundwater after seepage was simulated using the EPACMTP model. EPACMTP is a contamination transport model developed and recommended by the US EPA for the release of waste components in landfills and the ongoing effects of these components on the subsurface environment [33].
EPACMTP consists of a source strength model, a vadose zone, and a saturated zone submodel to simulate the release and concentration dispersion processes of contaminant components of leachates in the vadose zone and aquifer. The source intensity model is used to predict the changes in pollutant concentrations in leachates under the effect of rainfall [38]. The seepage zone and groundwater model are used to calculate the migration and dispersion of leachates and contaminants in the seepage zone and groundwater for a given level of leakage (calculated by the HELP model) and contaminant concentration in the leachate (calculated by the source intensity module of EPACMTP based on the leachate generation intensity calculated by the HELP model).
The input parameters of EPACMTP include source strength parameters (initial leachate concentration, pile infiltration intensity, waste solid–liquid ratio, and leaching time), seepage zone parameters (seepage zone thickness and permeability coefficient, seepage duration, vertical dynamic dispersion coefficient, pore water flow rate), and aquifer parameters (aquifer thickness and permeability coefficient, lateral distance, monitoring time, dispersion coefficient, groundwater flow rate, and contamination (initial concentration of contaminant components)). Based on the above parameters, the EPACMTP can calculate the groundwater contamination concentration at any location and time of interest by analytical solution or via finite difference numerical solution [39]. Moreover, by integrating a Monte Carlo uncertainty analysis module, the effect of uncertainty in the model input parameters on the simulation results can be investigated.

2.2.4. Articulation and Parameter Transfer of the Aging-HELP-EPACMTP Model

The interface and parameter transfer between HELP, the material aging model, and the EPACMTP model are shown in Figure 1, Part A. First, the time series values of the number of defects and the permeability coefficient of conductive drainage media used for the HDPE geomembrane were predicted by the material aging model [40]. Then, these parameter values were input to the HELP model, and the amount of leachate generation and leakage was calculated by combining the meteorological data, surface parameters, and parameters of cover and liner materials in the study area. Then, the leachate concentration was calculated: the solid-to-liquid ratio of the waste, the initial concentration of leachate, and the leaching time were input to the attenuation source model of EPACMTP, which was used to calculate the variation of pollutant concentrations in the source intensity over time. Finally, the pollutant concentration and leachate leakage in the source intensity were input to the subsurface media model of EPACMTP that was then used to simulate the migration transformation of pollutants in the vadose and groundwater and to obtain the pollutant concentration in groundwater at any location and time of interest [12].

2.3. Calculation of BFD under Long-Term Aging Conditions

The complete framework and detailed process of BFD calculation are shown in Figure 1, Parts A and B: ① Part B: Calculation of the limit concentrations of contaminant components for safe water use; this combines the dose effect equation (Equations (1) and (2), or Equations (1) and (3)) and acceptable groundwater risk values for human health to derive the limiting concentrations of specific contaminants in the aquifer. ② Part A: Model coupling: The aging module calculation results are input to the HELP model, and follow the procedure described in Section 2.2.4. The aging-HELP-EPACMTP model coupling is performed to calculate the concentrations of contaminants in groundwater at any location and time of concern. ③ Ratio calculation: the concentrations of contaminants in groundwater at the location and time of concern are compared with the water quality index limits of contaminants in groundwater obtained in Step ① to determine the BFD under the influence of the aging of engineering materials.
In addition, a Monte Carlo framework was used to quantify the uncertainties of the model parameters and their effects on the BFD simulation results. The main uncertain parameters are the thickness and permeability coefficient of the seepage zone, the thickness and permeability coefficient of the aquifer, and the infiltration volume during the operation period. The EPACMTP model was solved by extracting random input variables from the distribution function. Each simulation was iterated 2200 times according to the Monte Carlo framework.

3. Case Studies

3.1. Site Description

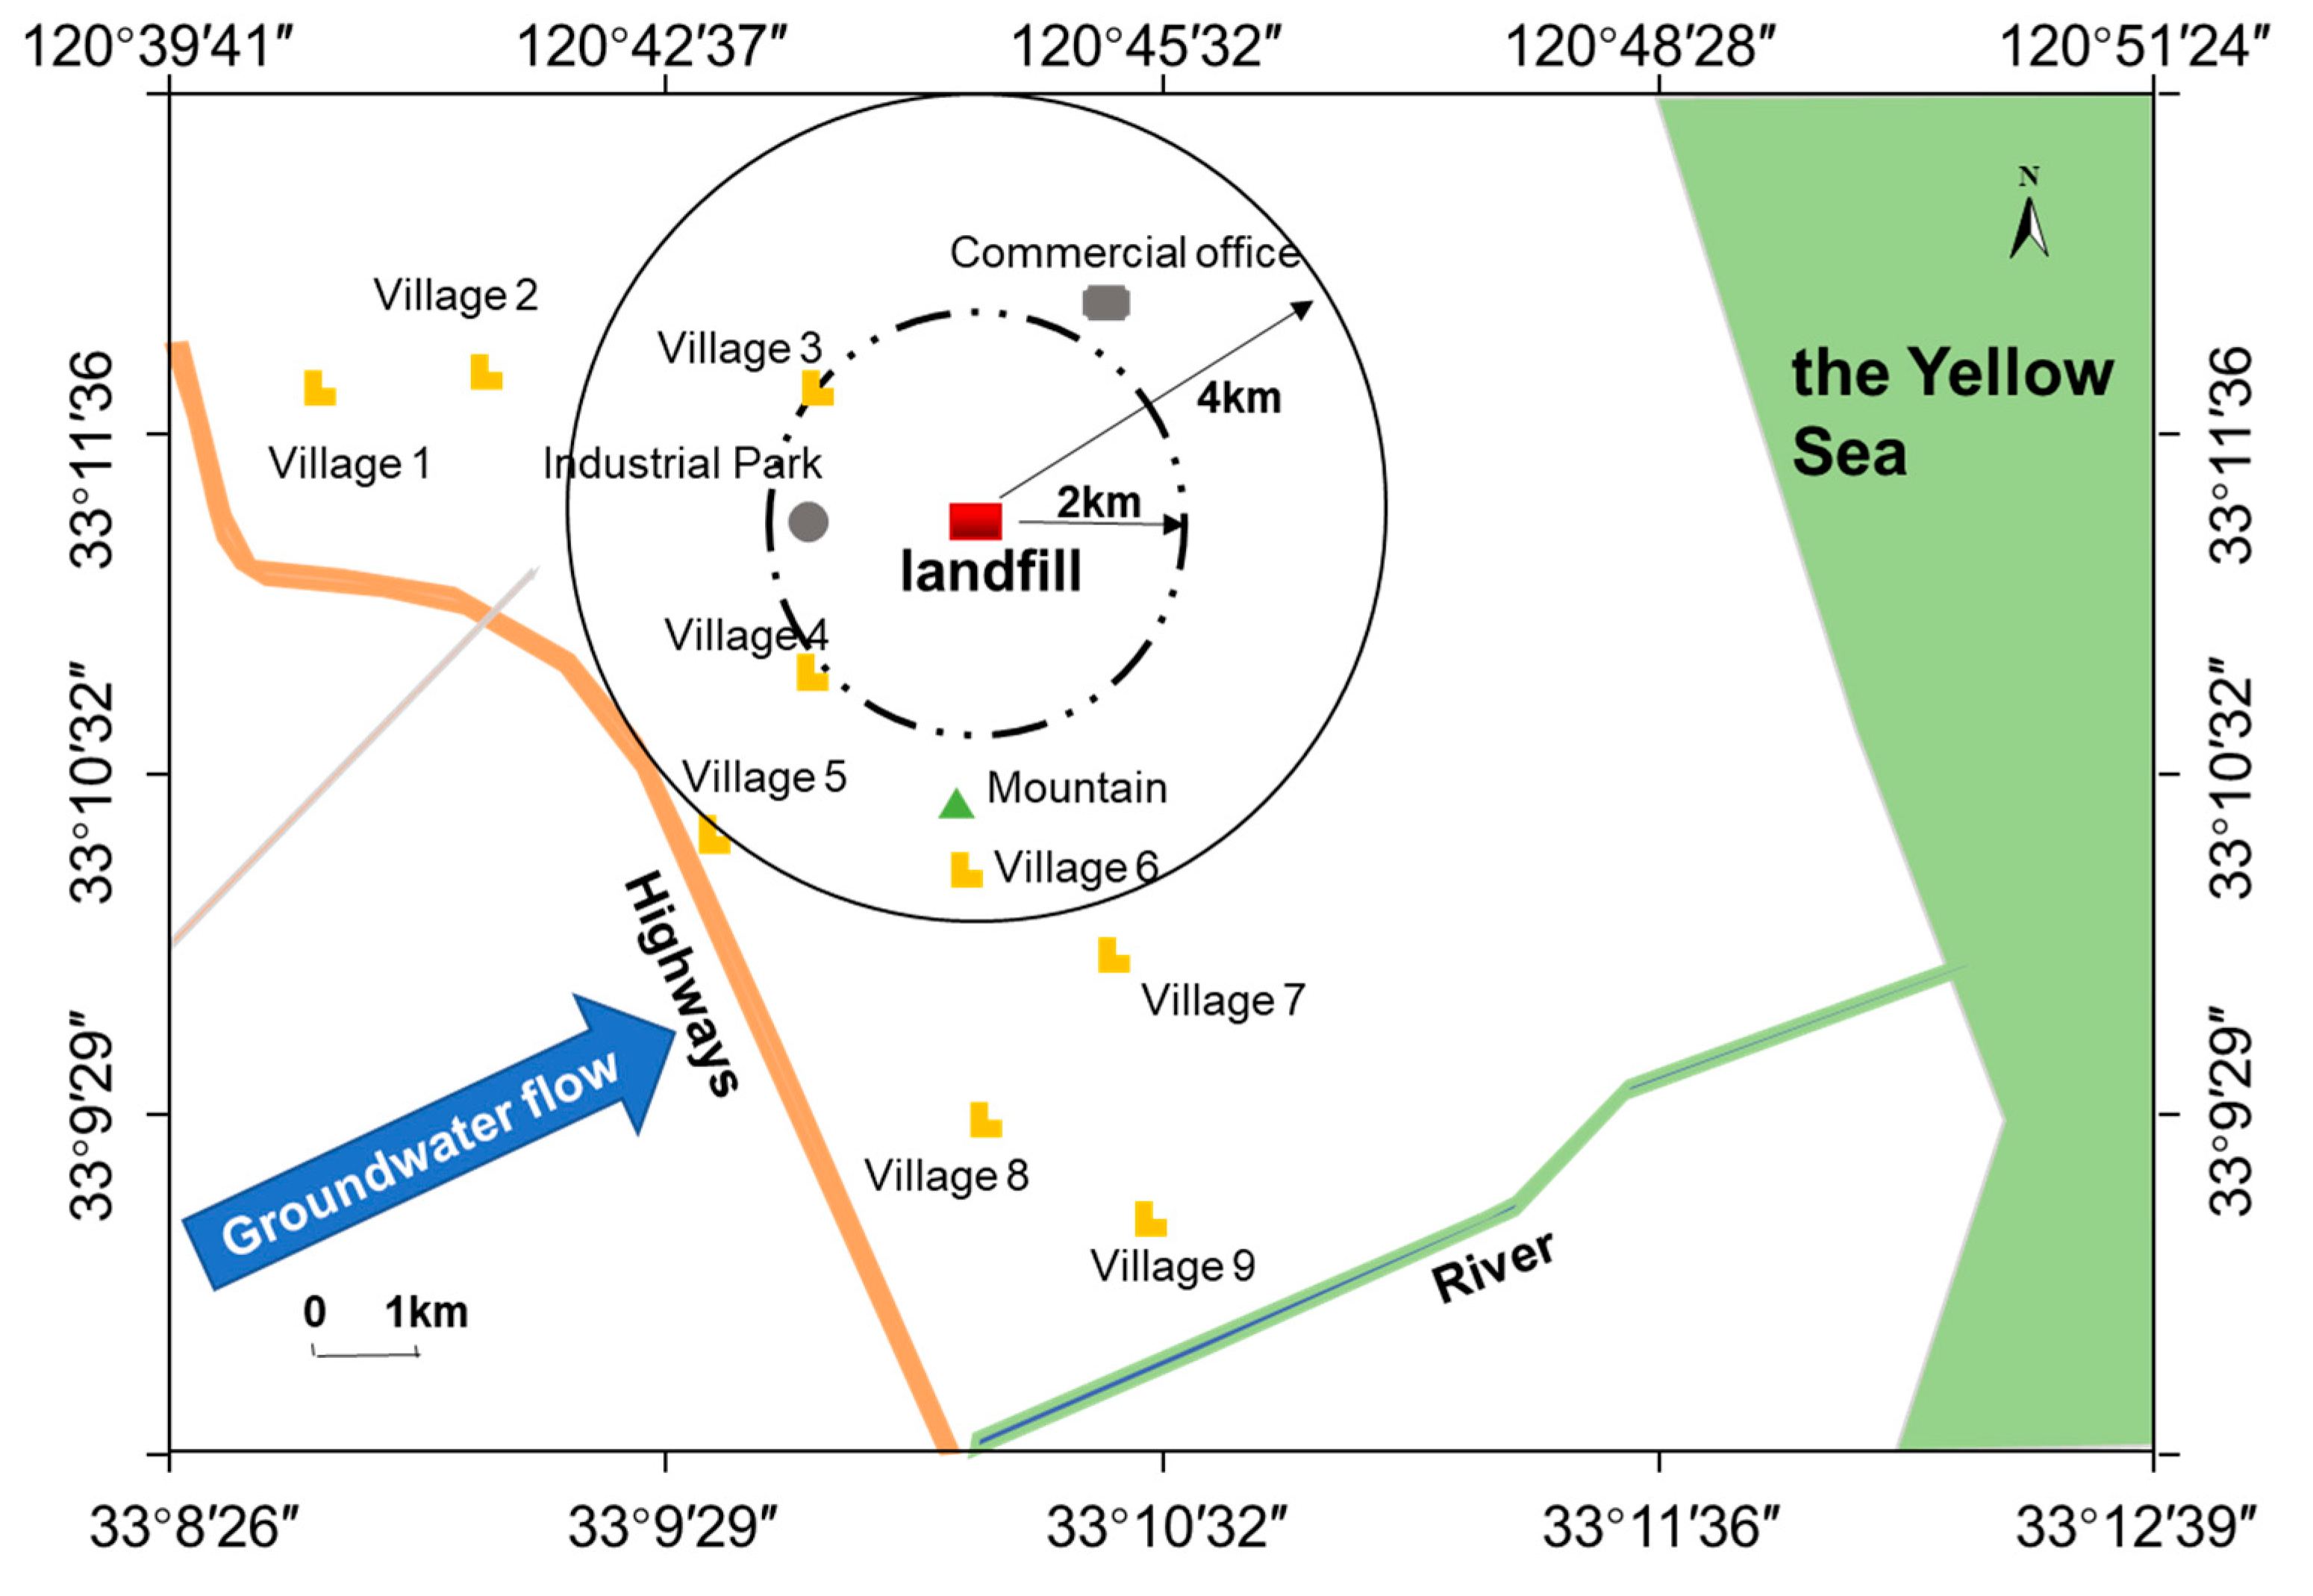
A hazardous waste landfill site was selected in one of the eastern coastal provinces of China (see Figure 2). The landfill site is adjacent to the Yellow Sea, the largest marginal sea in the western Pacific Ocean, which has a close hydraulic connection with groundwater and whose recharge–runoff relationship varies according to tidal conditions. The landfill site covers an area of 3.0 × 10⁴ m2 and consists of two 150 m × 100 m areas. Due to the close hydraulic connection between groundwater and seawater, and the fact that some local villagers use groundwater for irrigation purposes, the landfill site has a high water quality. The groundwater is used by some villagers as a source of water for irrigation and animal husbandry. Marine ecological risks and human health risks if groundwater is contaminated by leachate. Therefore, it is necessary to calculate the BFD and determine whether the actual distance between the water source and the landfill meets the requirements.

3.2. Model Application and Parameter Setting

A total of 13 toxic pollutants were identified in the leachate sampling from the landfill. Contaminants with concentrations exceeding the Class III standard of the Groundwater Quality Standard (General Administration of Quality Supervision, 2017) by 0.1 times were considered as target contaminants. The focus was placed on pollutants with carcinogenic and non-carcinogenic effects. The carcinogenic and non-carcinogenic effects of ammonia, phenols, COD and nitrates are not known and are not included in the US EPA IRIS Toxics Inventory, and therefore were not considered. The study finally identified the heavy metals Ni, Zn and Cd and the semi-volatile organic compounds 2,4-D as the pollutants of concern for the buffer distance determination.
Substituting the toxicity parameters and population exposure parameters (see Table 2) of the above pollutants into Formulas (1)–(3) leads to obtaining the concentration limits of Ni, 2,4-D, Zn and Cd are 5.92 × 10⁻², 8.89 × 10⁻³, 8.89 × 10⁻¹ and 2.96 × 10⁻³ mg/L.

4. Results and Discussion

4.1. Different BFD of Dilution and Attenuation of Pollutants

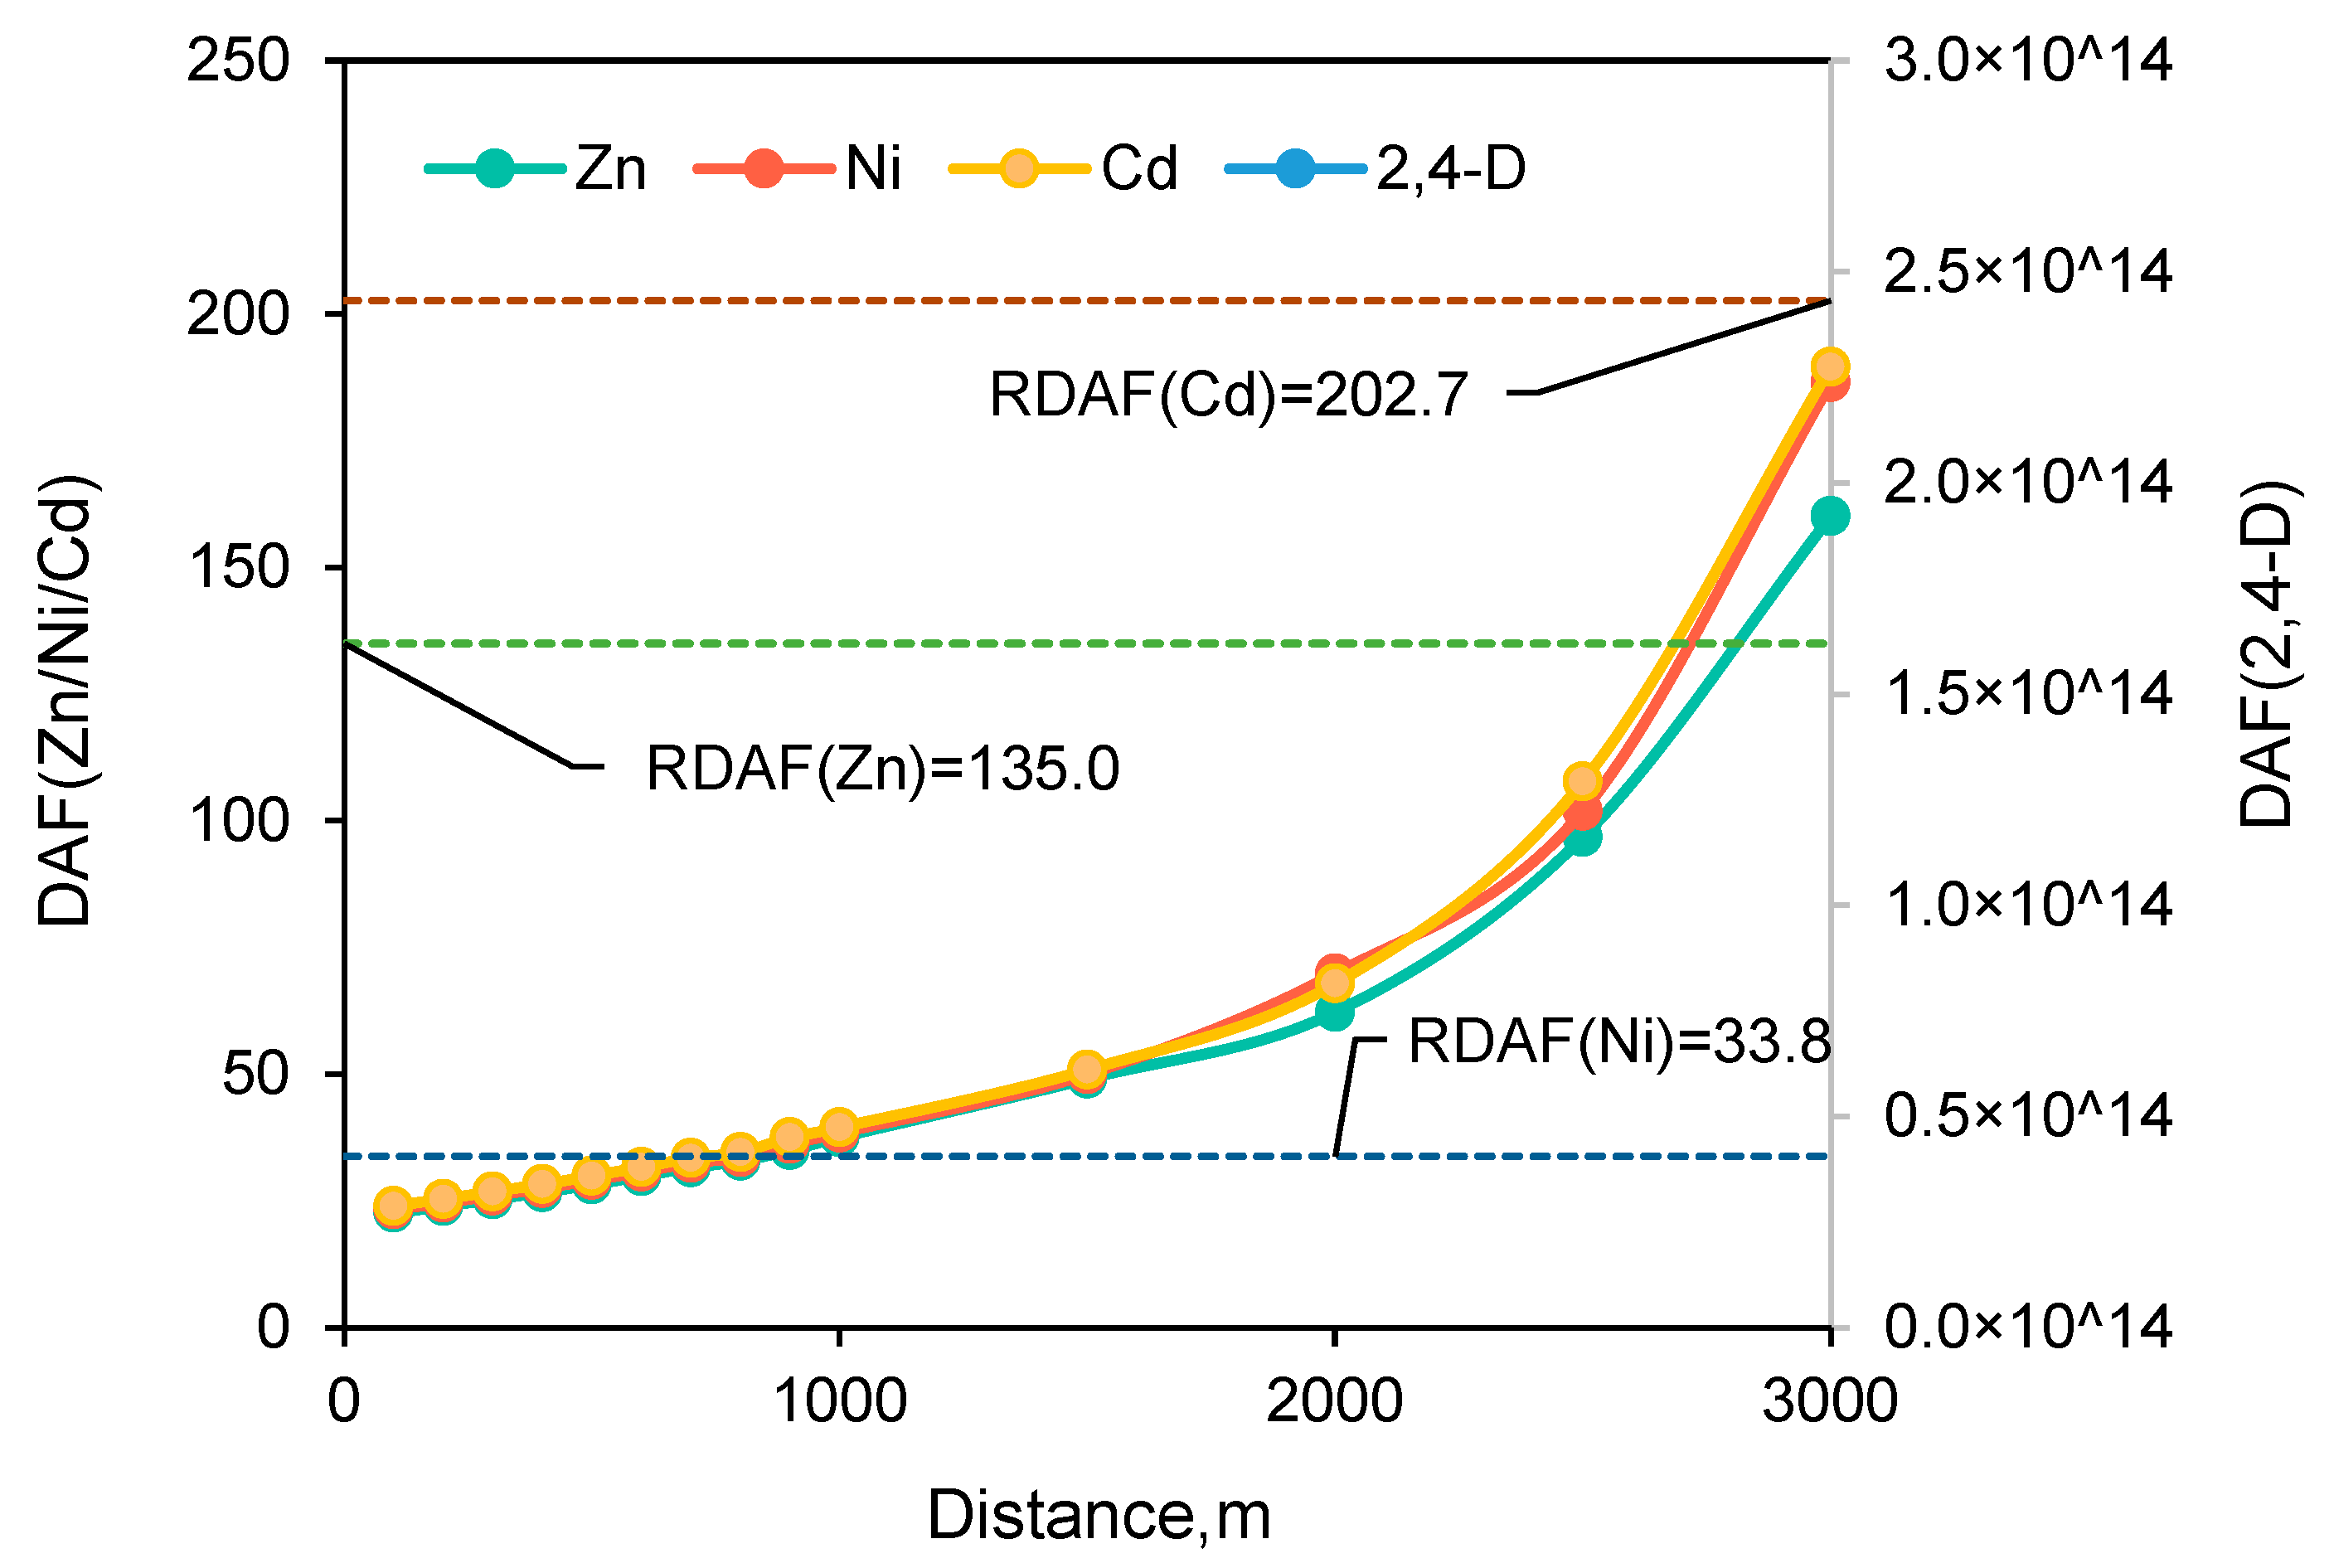
The dilution and attenuation multiples of different contaminants in groundwater at different buffer distances under leachate seepage conditions are shown in Figure 3. As can be seen in Figure 3, the concentrations of heavy metal contaminants (e.g., Zn, Ni and Cd) undergo essentially the same or similar attenuation process. For example, at buffer distances of 1000, 1500, 2000 and 2500 m, the DAF were 37.6, 49.1, 62.3 and 96.8 for Zn, 38.4, 50.0, 69.8 and 102.0 for Ni, and 39.5, 50.9, 67.9 and 108.0 for Cd. The maximum difference in DAF between these three pollutants was 11.2. In contrast, the degradation characteristics of heavy metals and organic pollutants were significantly different. For Zn and 2,4-D, for example, the DAF of Zn was 26.7, 29.9, 32.9 and 37.6 at buffer distances of 400, 600, 800 and 1000 m, respectively, while the DAF of 2,4-D was 2.86 × 10³, 2.26 × 10⁴, 1.74 × 10⁵ and 1.74 × 10⁵, respectively. Their DAF values were significantly different, and this difference became more and more significant as the buffer distance increased.
Overall, the dilution and attenuation effects of subsurface media on contaminants in leachate increased with increasing buffer distance, However, the dilution and attenuation processes of different pollutants are sensitive to buffer distances to varying degrees. The dilution and degradation of heavy metal contaminants are relatively insensitive to buffer distance, while organic contaminants are more sensitive on buffer distance, and their dilution capacity increases with increasing buffer distance.

4.2. BFD Required under Long-Term Aging Conditions

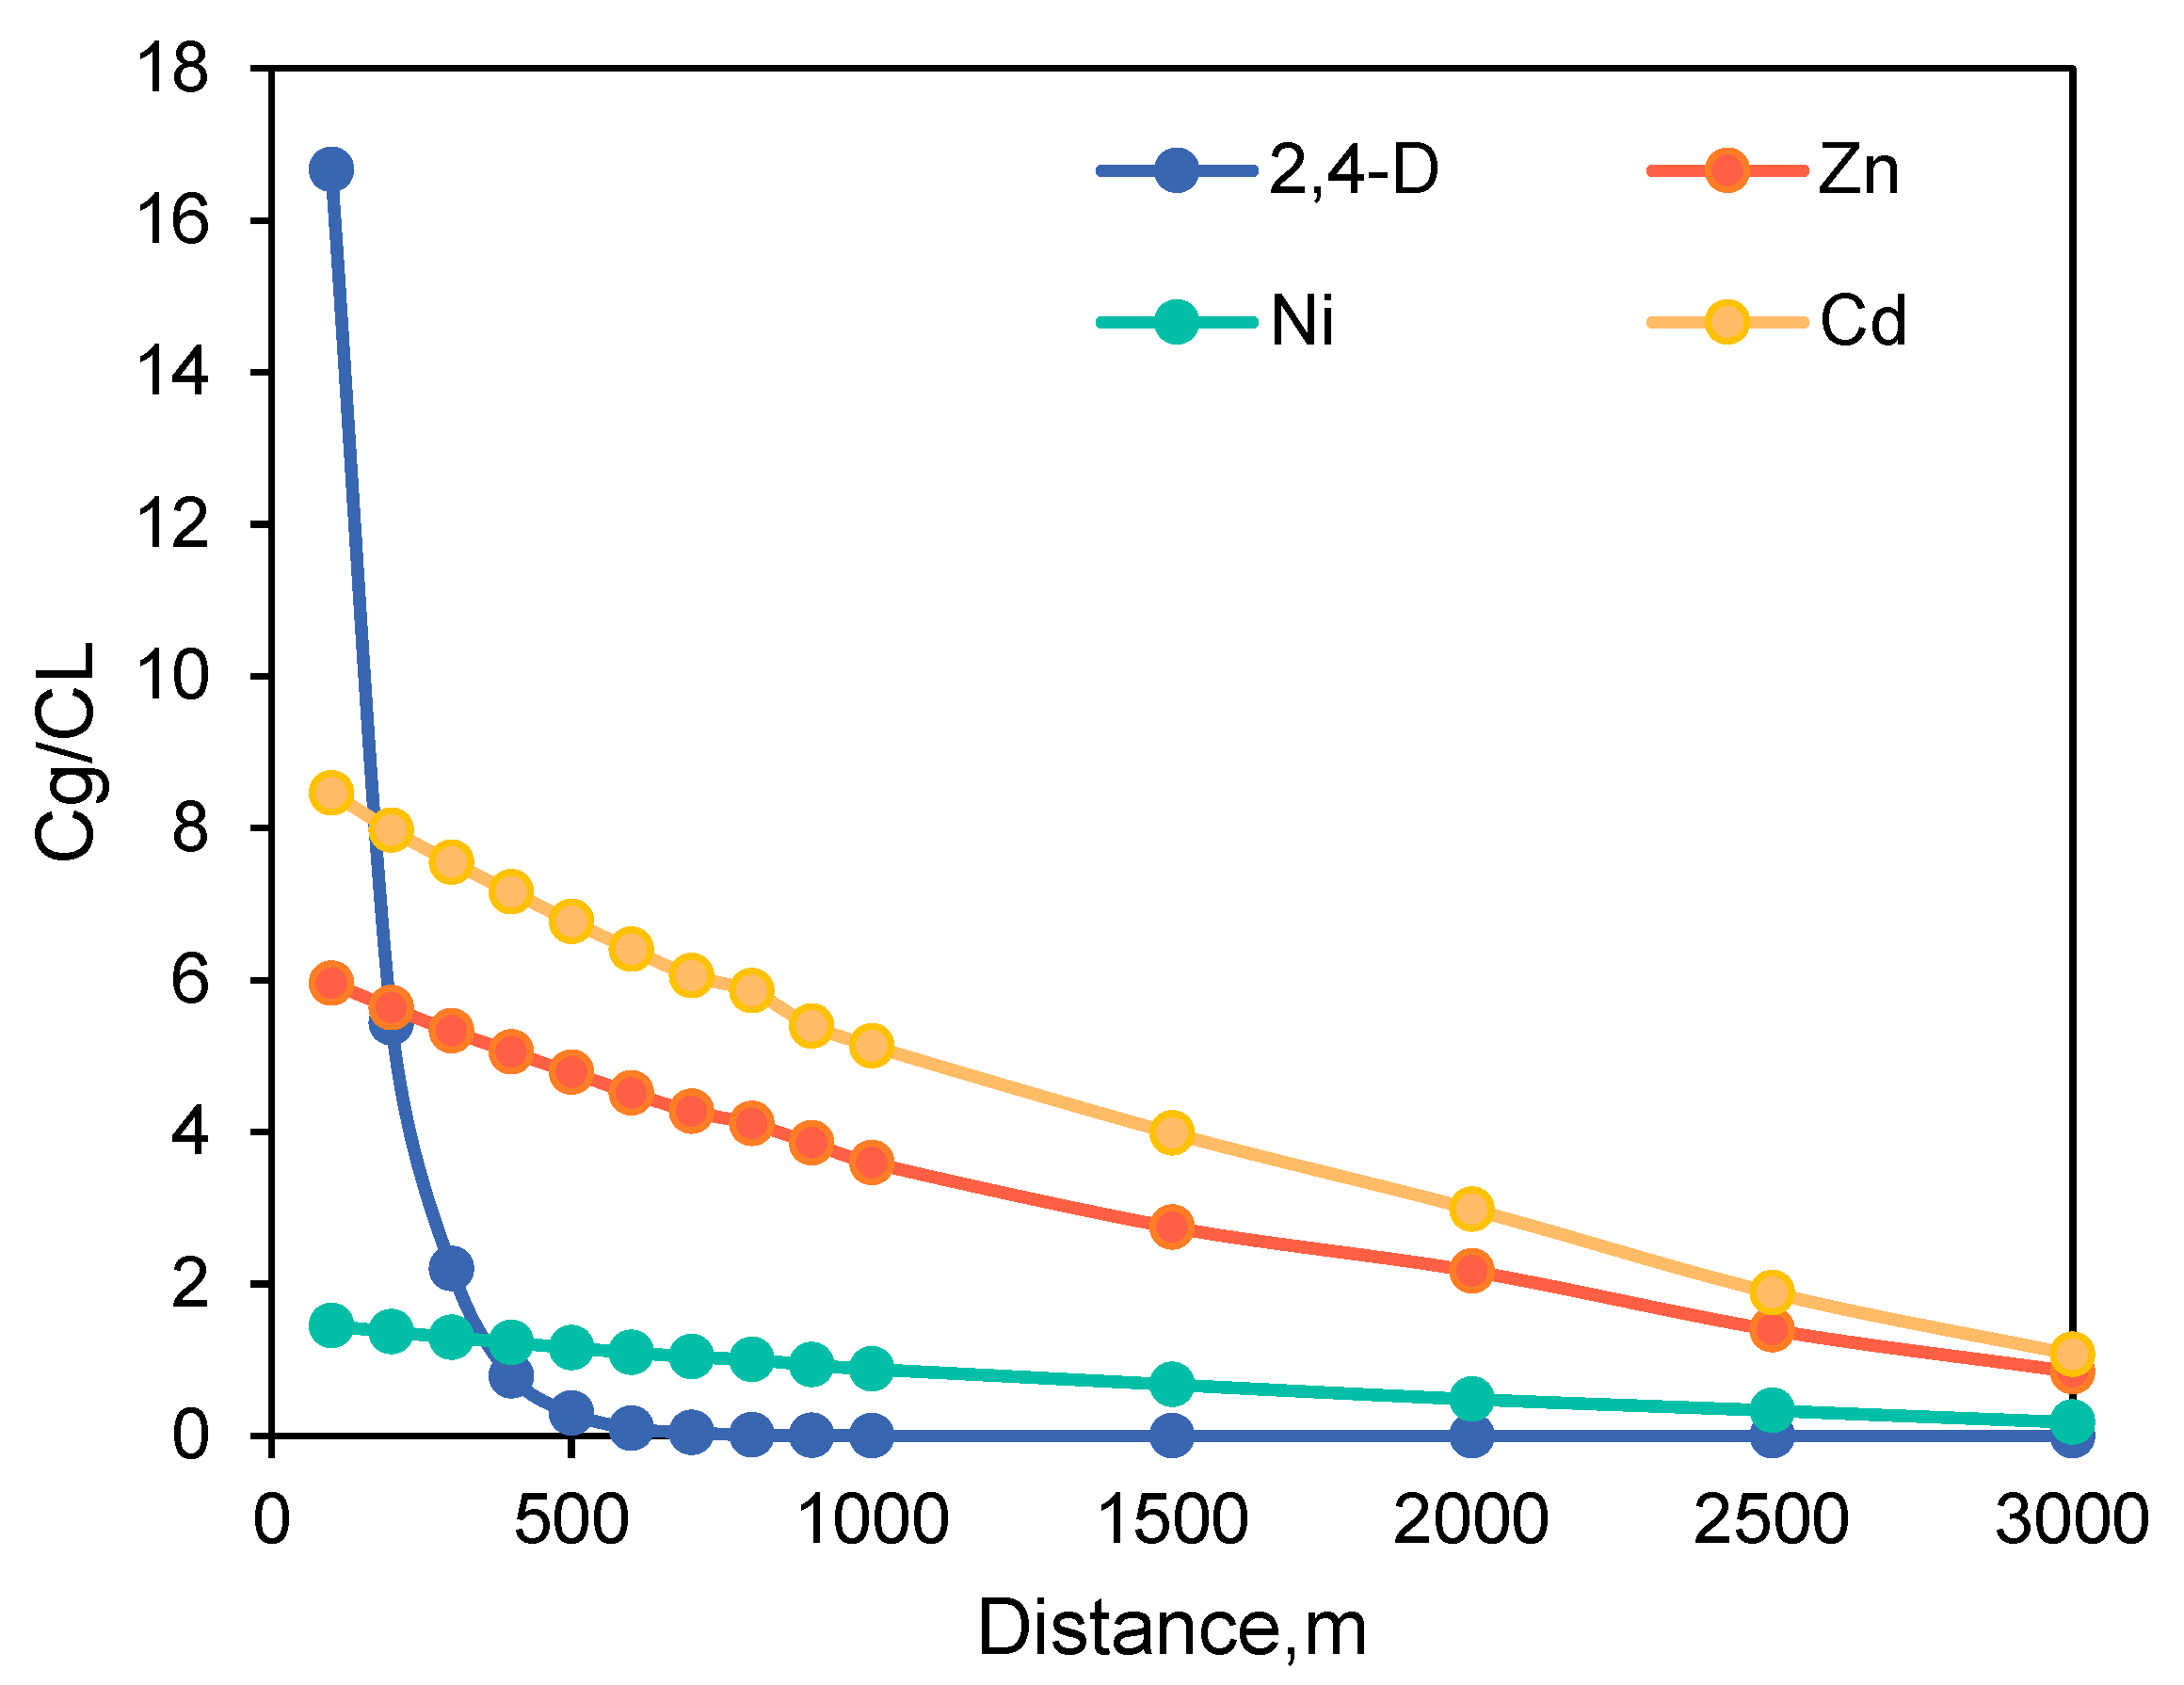
Based on the framework of BFD prediction under landfill performance degradation conditions, the BFD under long-term aging conditions in this case was quantified considering the effect of aging of the HDPE geomembrane. The ratios of contaminant concentrations to the concentration limits (Cg/CL) of various substances in groundwater were calculated for monitoring wells at different distances from the landfill using a leachate leakage time of 1000 years (Figure 4). At a distance of Cg/CL < 1, the hazardous constituents in groundwater have been reduced to acceptable concentrations, and therefore this distance was considered as the BFD. As shown in Figure 3, at a distance of 3000 m between the monitoring wells and the landfill, the Cg/CL of Cd was reduced to 1; so, the corresponding BFD of Cd should be set to 3000 m. Similarly, the BFD of 2,4-D, Ni and Zn were 380 m, 810 and 2800 m. Therefore, in the case of continuous aging of the HDPE geomembrane of the landfill and long-term leachate leakage, a BFD of 3000 m should be set to guarantee that all three pollutants in groundwater decay to the limit concentrations. Compared with the sensitive water sources around the actual landfill in all directions (see Figure 2), the well on the southwest side is the closest to the landfill at 2400 m, 2300 m in the northwest, and 3700 m in the southeast. Clearly, the actual distance between the landfill and the nearby wells is less than the required 3000 m distance. This indicates that increased leachate leakage and deterioration of groundwater quality caused by long-term aging of engineering materials such as HDPE geomembranes in landfills are likely to pose a threat to human health and long-term development in the vicinity of the landfill.
The abovementioned BFD (3000 m) considering the aging of the HDPE geomembrane in the landfill and the long-term leakage of leachate compared with the previous BFD (2070 m) study on the same site without considering the aging [17] are sig-nificantly different. The above result is due to the qualitative changes and deterioration of the properties of the HDPE geomembrane in the capping system and liner system of the landfill from transportation, construction, and long-term operation. After landfill closure, HDPE geomembranes are subject to long-term attack and corrosion by rainwater and leachate, and their physical and chemical properties are altered, resulting in a decline in impermeability, i.e., aging. As a result, leachate can continuously flow into soil and groundwater from the bottom of the landfill through the HDPE geomembrane. At the same time, pollutants carried by the leachate are continuously injected into the groundwater. Therefore, the BFD after considering the aging factor of HDPE geomembrane is significantly higher than the BFD set without considering aging.

4.3. Uncertainty of BFD under Aging Conditions

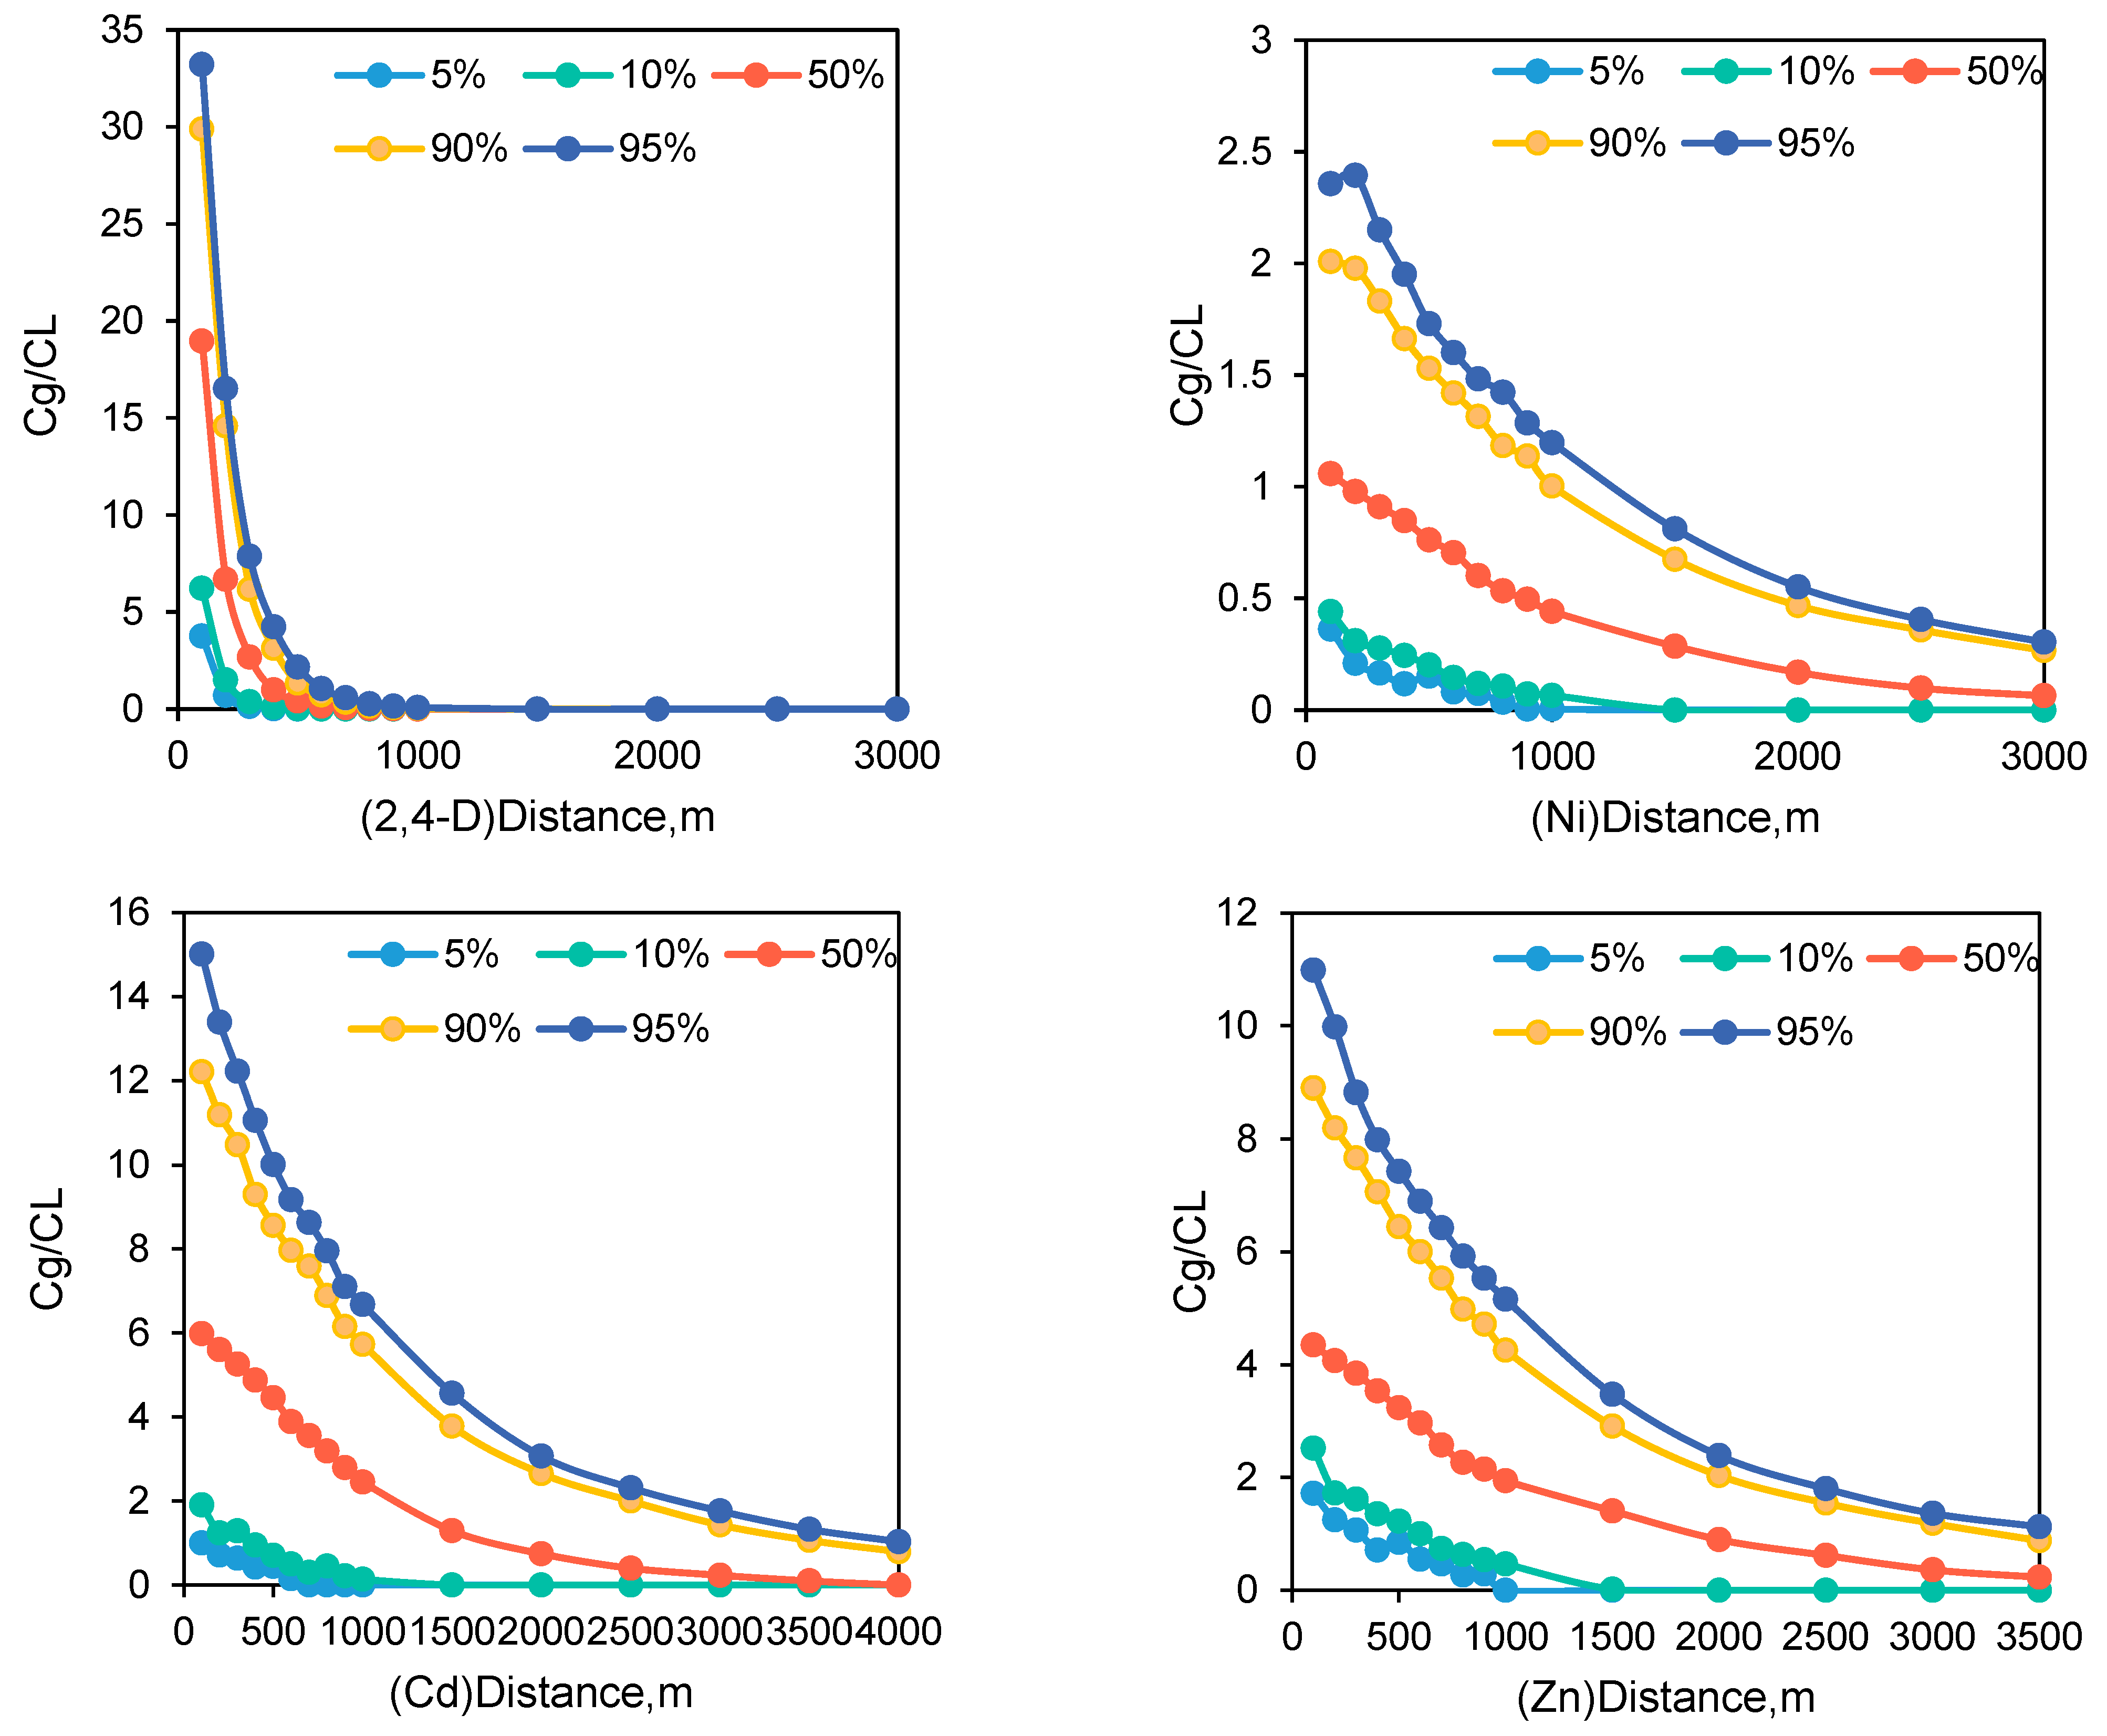
In this study, the vadose zone thickness and its hydraulic conductivity coefficient, the aquifer thickness and its hydraulic conductivity coefficient, and the infiltration amount during the operation period were selected as the parameters with uncertainty (Table 3) that were incorporated in the model in Section 2 to calculate the BFD under the condition of long-term aging. The probability distribution of the parameter values was determined according to the actual site value. Considering the uncertainty of the parameters, the study calculated the BFD of different contaminants at different confidence intervals (Figure 5). The 95% confidence interval can be regarded as the BFD needed under adverse conditions. Figure 5 shows that under unfavorable conditions, the BFD of Cd increases from 3000 m to 4050 m and that of 2,4-D increases from 380 m to 600 m. Therefore, a BFD of 4050 m should be set to reduce the levels of all pollutants to acceptable risk levels under stochastic adverse conditions.

4.4. Management Strategies for BFD under Aging Conditions

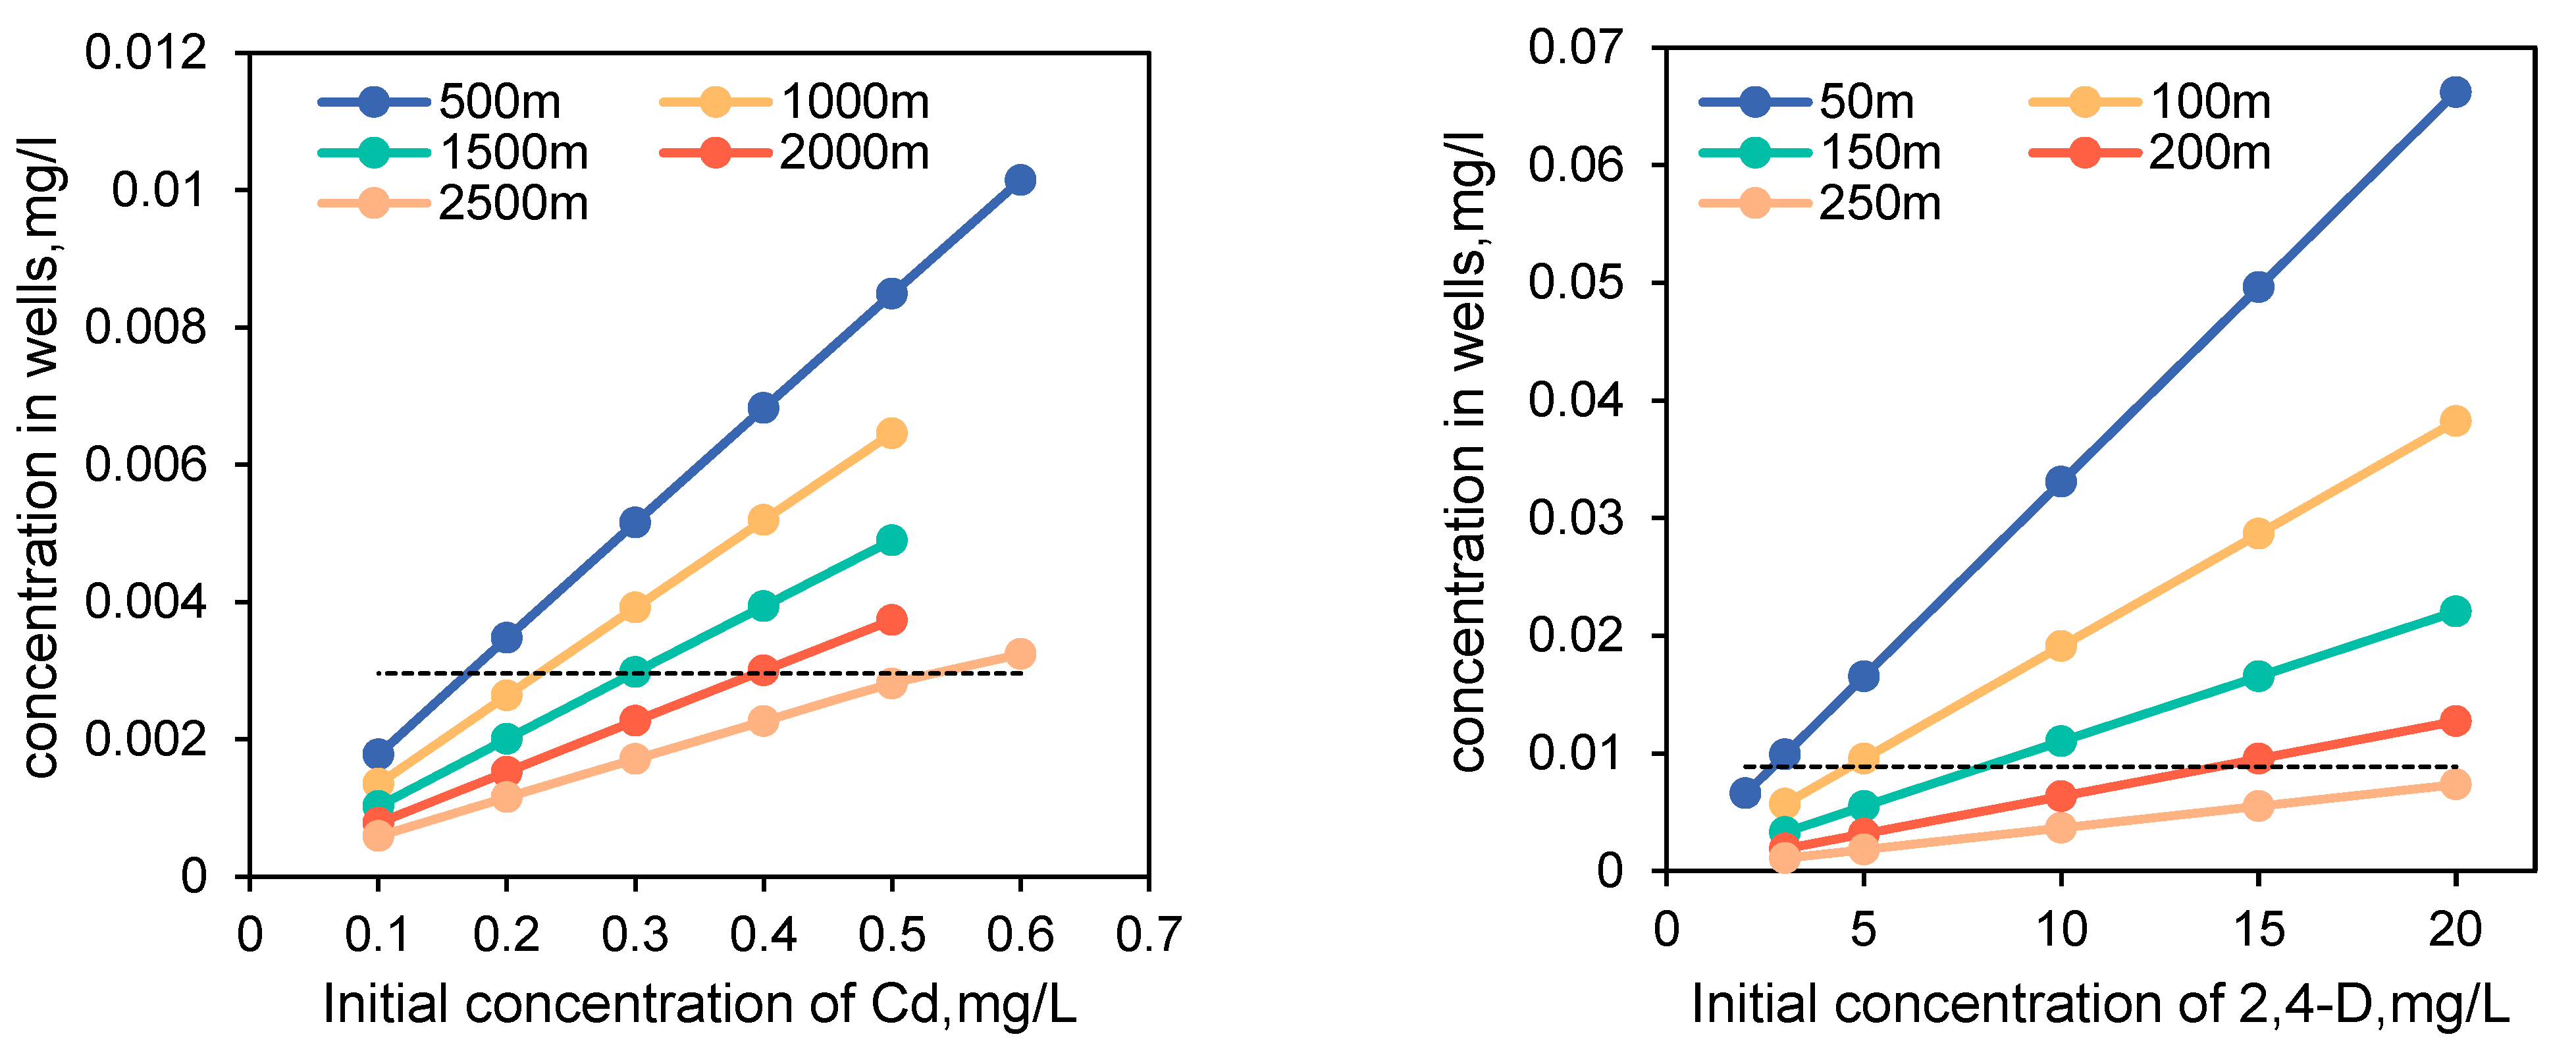
For different pollutants, simulation of the initial leachate concentration to be controlled when the actual distance is less than the BFD is shown in Figure 6. If the actual distance between the sensitive water source and the landfill is 2500, 2000, 1500, 1000, and 500 m, the initial concentration of Cd needs to be reduced by 0.07, 0.21, 0.3, 0.37, and 0.43 mg/L, respectively, in order to reach 0.53, 0.39, 0.3, 0.23, and 0.17 mg/L, through waste pretreatment to ensure water safety. To ensure that the concentration of 2,4-D in groundwater reaches the standard for safe water use, if the actual distance is 200, 150, 100, and 50 m, the initial concentration needs to be reduced by 5.18, 12.48, 14.74 and 17.31 mg/L, respectively, in order to reach 14.82, 7.52, 5.26, and 2.69 mg/L.
Compared to previous studies [17] and other studies that did not consider the effect of HDPE geomembrane aging on BFD, Cd and 2,4-D needed to be reduced more by pretreatment initial concentrations in this study. The reason for this difference is that as the life cycle of a landfill increases, the impermeable membranes covering the top and bottom of the landfill gradually deteriorate due to rainfall and leachate erosion, resulting in a decrease in their performance in blocking leachate leakage, leading to an increase in the amount of leachate leakage through the HDPE geomembrane into the soil and groundwater and an increase in the concentration of contaminants. The buffer distance requirement is reduced by pre-treatment to reduce a greater proportion of the initial concentration.

5. Conclusions

Different types of pollutants require different dilution attenuation factors (RDAF), with more dilution attenuation required for high initial concentrations and high toxicity in leachate. For example, 2,4-D in this case requires a dilution attenuation of 2249.7 times, which is 66.6, 16.7 and 11.1 times higher than that for the heavy metals Ni, Zn and Cd, respectively.
The sensitivity of the dilution attenuation fraction (DAF) to buffer distance is not uniform for different pollutants, with the dilution and attenuation fractions for organic pollutants being more sensitive to buffer distance. For example, for 2,4-D, although the RDAF was the largest, the buffer distance was only 13.6% and 12.6% for the heavy metals Zn and Cd.
A safety BFD of 3000 m is required to consider the impact of long-term aging of the geomembranes on groundwater quality for each pollutant and hazardous waste landfill, and BFD of 4050 m is required to further consider parameter uncertainty and to ensure safe water use at the 95th percentile, which is 1.5 and 2 times the previous BFD (2070 m) that did not emphasize the impact of aging geomembranes.
In the case that the actual BFD cannot meet the demand with the degradation of the landfill performance, the demand for BFD can be reduced by reducing the concentrations of pollutants in the waste through pretreatment methods such as solidification and stabilization. Taking Cd as an example, when the concentration of Cd in waste is reduced from 0.6 mg/L to 0.53, 0.39, 0.3, 0.23 and 0.17 mg/L by pretreatment, the BFD will be adjusted from 3000 m to 2500, 2000, 1500, 1000, and 500 m.

Author Contributions

Conceptualization, Y.X. and J.Y.; methodology, Y.X.; software, Y.X. and Y.L.; formal analysis, J.Y.; investigation, X.L.; resources, Y.X., Y.L. and Q.H.; data curation, P.Q.; writing—original draft preparation, P.Q.; writing—review and editing, J.Y.; visualization, P.Q.; supervision, G.Y.; project administration, Y.L.; funding acquisition, Y.X. and Y.L. All authors have read and agreed to the published version of the manuscript.

Funding

Much of the work presented in this paper was supported by the National Key R&D Program of China (grant number 2020YFC1806304, 2018YFC1800902).

Acknowledgments

The authors would like to express appreciation to the reviewers and the editors for their valuable comments and helpful suggestions that helped improve the quality of our paper.

Conflicts of Interest

The authors declare no conflict of interest.

References

  1. Vaverková, M.D.; Paleologos, E.K.; Adamcová, D.; Podlasek, A.; Pasternak, G.; Červenková, J.; Skutnik, Z.; Koda, E.; Winkler, J. Municipal solid waste landfill: Evidence of the effect of applied landfill management on vegetation composition. Waste Manag. Res. 2022, 40, 1402–1411. [Google Scholar] [CrossRef]
  2. Liu, S.; Zheng, T.; Li, Y.; Zheng, X. A critical review of the central role of microbial regulation in the nitrogen biogeochemical process: New insights for controlling groundwater nitrogen contamination. J. Environ. Manag. 2023, 328, 116959. [Google Scholar] [CrossRef]
  3. Gupta, A.; Paulraj, R. Leachate composition and toxicity assessment: An integrated approach correlating physicochemical parameters and toxicity of leachates from MSW landfill in Delhi. Environ. Technol. 2017, 38, 1599–1605. [Google Scholar] [CrossRef]
  4. Al-Yaqout, A.; Hamoda, M.F. Long-term Temporal Variations in Characteristics of Leachates from a Closed Landfill in an Arid Region. Water Air Soil Pollut. 2020, 231, 319. [Google Scholar] [CrossRef]
  5. Essien, J.P.; Ikpe, D.I.; Inam, E.D.; Okon, A.O.; Ebong, G.A.; Benson, N.U. Occurrence and spatial distribution of heavy metals in landfill leachates and impacted freshwater ecosystem: An environmental and human health threat. PLoS ONE 2022, 17, e0263279. [Google Scholar] [CrossRef]
  6. Alimba, C.G.; Sivanesan, S.; Krishnamurthi, K. Mitochondrial dysfunctions elicited by solid waste leachates provide insights into mechanisms of leachates induced cell death and pathophysiological disorders. Chemosphere 2022, 307, 136085. [Google Scholar] [CrossRef]
  7. de Medeiros Engelmann, P.; dos Santos, V.H.J.M.; Moser, L.I.; do Canto Bruzza, E.; Barbieri, C.B.; Barela, P.S.; de Moraes, D.P.; Augustin, A.H.; Goudinho, F.S.; Melo, C.L.; et al. Environmental monitoring of water resources around a municipal landfill of the Rio Grande do Sul state, Brazil. Environ. Sci. Pollut. Res. 2017, 24, 21398–21411. [Google Scholar] [CrossRef]
  8. Alslaibi, T.M.; Abunada, Z.; Abu Amr, S.S.; Abustan, I. Risk assessment of nitrate transport through subsurface layers and groundwater using experimental and modeling approach. Environ. Technol. 2018, 39, 2691–2702. [Google Scholar] [CrossRef]
  9. Lima, R.M.; Santos, A.H.M.; Pereira, C.R.S.; Flauzino, B.K.; Pereira, A.C.O.S.; Nogueira, F.J.H.; Valverde, J.A.R. Spatially distributed potential of landfill biogas production and electric power generation in Brazil. Waste Manag. 2018, 74, 323–334. [Google Scholar] [CrossRef]
  10. Wang, Q.; Liu, K.; Wang, M.; Koks, E.E. A River Flood and Earthquake Risk Assessment of Railway Assets along the Belt and Road. Int. J. Disaster Risk Sci. 2021, 12, 553–567. [Google Scholar] [CrossRef]
  11. Buehlmann, U.; Bumgardner, M.; Fluharty, T. Ban on landfilling of wooden pallets in North Carolina: An assessment of recycling and industry capacity. J. Clean. Prod. 2009, 17, 271–275. [Google Scholar] [CrossRef]
  12. Xu, Y.; Xue, X.; Dong, L.; Nai, C.; Liu, Y.; Huang, Q. Long-term dynamics of leachate production, leakage from hazardous waste landfill sites and the impact on groundwater quality and human health. Waste Manag. 2018, 82, 156–166. [Google Scholar] [CrossRef]
  13. Aldana, C.; Isch, A.; Bruand, A.; Azaroual, M.; Coquet, Y. Relationship between hydraulic properties and material features in a heterogeneous vadose zone of a vulnerable limestone aquifer. Vadose Zone J. 2021, 20, e20127. [Google Scholar] [CrossRef]
  14. Arora, B.; Dwivedi, D.; Faybishenko, B.; Jana, R.B.; Wainwright, H.M. Understanding and Predicting Vadose Zone Processes. Rev. Mineral. Geochem. 2019, 85, 303–328. [Google Scholar] [CrossRef] [Green Version]
  15. Irhamni Pandia, S.; Purba, E.; Hasan, W. Heavy metal content in final disposal garbage site at Banda Aceh City. J. Phys. Conf. Ser. 2018, 1116, 042014. [Google Scholar] [CrossRef]
  16. Morales-Caselles, C.; Desforges, J.-P.W.; Dangerfield, N.; Ross, P.S. A Risk-Based Characterization of Sediment Contamination by Legacy and Emergent Contaminants of Concern in Coastal British Columbia, Canada. Arch. Environ. Contam. Toxicol. 2017, 73, 270–284. [Google Scholar] [CrossRef]
  17. Ya, X.; Jingcai, L.; Lu, D.; Yuqiang, L.; Weishi, L.; Changxing, N.; Qifei, H. Buffering distance between hazardous waste landfill and water supply wells in a shallow aquifer. J. Clean. Prod. 2019, 211, 1180–1189. [Google Scholar] [CrossRef]
  18. Xiang, R.; Xu, Y.; Liu, Y.Q.; Lei, G.Y.; Liu, J.C.; Huang, Q.F. Isolation distance between municipal solid waste landfills and drinking water wells for bacteria attenuation and safe drinking. Sci. Rep. 2019, 9, 17881. [Google Scholar] [CrossRef] [Green Version]
  19. Ji, D.L.; Zhang, L.Y.; Huang, Z.Q.; Du, B.Y.; Xu, Y.; Yang, F. Buffering Distance between Coastal Hazardous Waste Landfill and Water Source and Its Regulation Strategy. Res. Environ. Sci. 2022, 35, 1499–1508. [Google Scholar]
  20. Fakhreddine, S.; Bourouss, M.; El-Fadel, M. A coupled groundwater transport and land use regression model for optimizing buffer zones around landfills. Sci. Total Environ. 2020, 709, 136166. [Google Scholar]
  21. Wang, X.; Li, L.; Li, J. Optimal design of landfill buffer zones using groundwater modeling and multi-objective genetic algorithm: A case study in China. J. Environ. Manag. 2018, 217, 548–556. [Google Scholar]
  22. Dey, S.; Bhattacharjya, S.; Chakraborty, S. Geospatial analysis for assessing buffer zone requirement around a landfill in India. Sustain. Environ. Res. 2019, 29, 7. [Google Scholar]
  23. Blaschke, A.P.; Derx, J.; Zessner, M.; Kirnbauer, R.; Kavka, G.; Strelec, H.; Farnleitner, A.H.; Pang, L. Setback distances between small biological wastewater treatment systems and drinking water wells against virus contamination in alluvial aquifers. Sci. Total Environ. 2016, 573, 278–289. [Google Scholar] [CrossRef] [Green Version]
  24. Rowe, R.K.; Rimal, S.; Sangam, H. Ageing of HDPE geomembrane exposed to air, water and leachate at different temperatures. Geotext. Geomembr. 2009, 27, 137–151. [Google Scholar] [CrossRef]
  25. Reddy, K.R.; Kumar, G.; Kulkarni, H.S. Two-Phase Flow Modeling to Evaluate Effectiveness of Different Leachate Injection Systems for Bioreactor Landfills. Environ. Model. Assess. 2020, 25, 115–128. [Google Scholar] [CrossRef]
  26. Nannou, C.; Ofrydopoulou, A.; Evgenidou, E.; Heath, D.; Heath, E.; Lambropoulou, D. Analytical strategies for the determination of antiviral drugs in the aquatic environment. Trends Environ. Anal. Chem. 2019, 24, e00071. [Google Scholar] [CrossRef]
  27. Xu, Y.; Yao, G.; Xiang, R.; Liu, Y.; Huang, Q. Spatiotemporal difference of leachate production and its impact on the development and dynamics of LCS clogging. Waste Manag. 2023, 157, 312–320. [Google Scholar] [CrossRef]
  28. Aryampa, S.; Maheshwari, B.; Sabiiti, E.N.; Bukenya, B.; Namuddu, S. The Impact of Waste Disposal Sites on the Local Water Resources: A Case Study of the Kiteezi landfill, Uganda. Ecohydrol. Hydrobiol. 2022, in press. [Google Scholar] [CrossRef]
  29. Herschan, J.; Pond, K.; Malcolm, R. Regulatory-driven risk assessment to improve drinking-water quality: A case study of private water supplies in England and Wales. Environ. Sci. Policy 2023, 140, 1–11. [Google Scholar] [CrossRef]
  30. de Boer, S.; Wiegand, L.; Karges, U. 1,4-dioxane in German drinking water: Origin, occurrence, and open questions. Curr. Opin. Environ. Sci. Health 2022, 30, 100391. [Google Scholar] [CrossRef]
  31. Sani, A.; Idris, K.M.; Abdullahi, B.A.; Darma, A.I. Bioaccumulation and health risks of some heavy metals in Oreochromis niloticus, sediment and water of Challawa river, Kano, Northwestern Nigeria. Environ. Adv. 2022, 7, 100172. [Google Scholar] [CrossRef]
  32. Li, Z.; Yang, Q.; Xie, C.; Wang, H.; Wang, Y. Spatiotemporal characteristics of groundwater quality and health risk assessment in Jinghe River Basin, Chinese Loess Plateau. Ecotoxicol. Environ. Saf. 2022, 248, 114278. [Google Scholar] [CrossRef]
  33. Li, T.; Liu, Y.; Bjerg, P.L. Prioritization of potentially contaminated sites: A comparison between the application of a solute transport model and a risk-screening method in China. J. Environ. Manag. 2021, 281, 111765. [Google Scholar] [CrossRef]
  34. Berger, K.U. On the current state of the Hydrologic Evaluation of Landfill Performance (HELP) model. Waste Manag. 2015, 38, 201–209. [Google Scholar] [CrossRef]
  35. Ren, Y.; Zhang, Z.; Huang, M. A review on settlement models of municipal solid waste landfills. Waste Manag. 2022, 149, 79–95. [Google Scholar] [CrossRef]
  36. Sun, X.-C.; Xu, Y.; Liu, Y.-Q.; Nai, C.-X.; Dong, L.; Liu, J.-C.; Huang, Q.-F. Evolution of geomembrane degradation and defects in a landfill: Impacts on long-term leachate leakage and groundwater quality. J. Clean. Prod. 2019, 224, 335–345. [Google Scholar] [CrossRef]
  37. Ya, X.; Weishi, L.; Qifei, H.; Yuqiang, L.; Jingcai, L.; Li, L.; Dahai, Y. Long-term degradation characteristics of cyanide in closed monofills and its effects on the environment and human health: Evidence from nine landfill sites in northen China. Sci. Total Environ. 2022, 839, 156269. [Google Scholar] [CrossRef]
  38. Mallants, D.; Doble, R.; Beiraghdar, Y. Fate and transport modelling framework for assessing risks to soil and groundwater from chemicals accidentally released during surface operations: An Australian example application from shale gas developments. J. Hydrol. 2022, 604, 127271. [Google Scholar] [CrossRef]
  39. Singh, P.; Andrabi, S.M.; Raina, D.B.; Kumar, A. Three staged integrated community-based water filter system for potable water by effective removal of contaminants from ground water. J. Water Process Eng. 2022, 49, 103044. [Google Scholar] [CrossRef]
  40. Doble, R.; Mallants, D.; Gonzalez, D.; Aghbelagh, Y.B.; Peeters, L.; Crosbie, R.; Marshall, S.K.; Evans, T. Upscaling a chemical screening approach to assess impacts of shale, tight and deep gas development on unconfined aquifers. J. Hydrol. Reg. Stud. 2023, 45, 101296. [Google Scholar] [CrossRef]
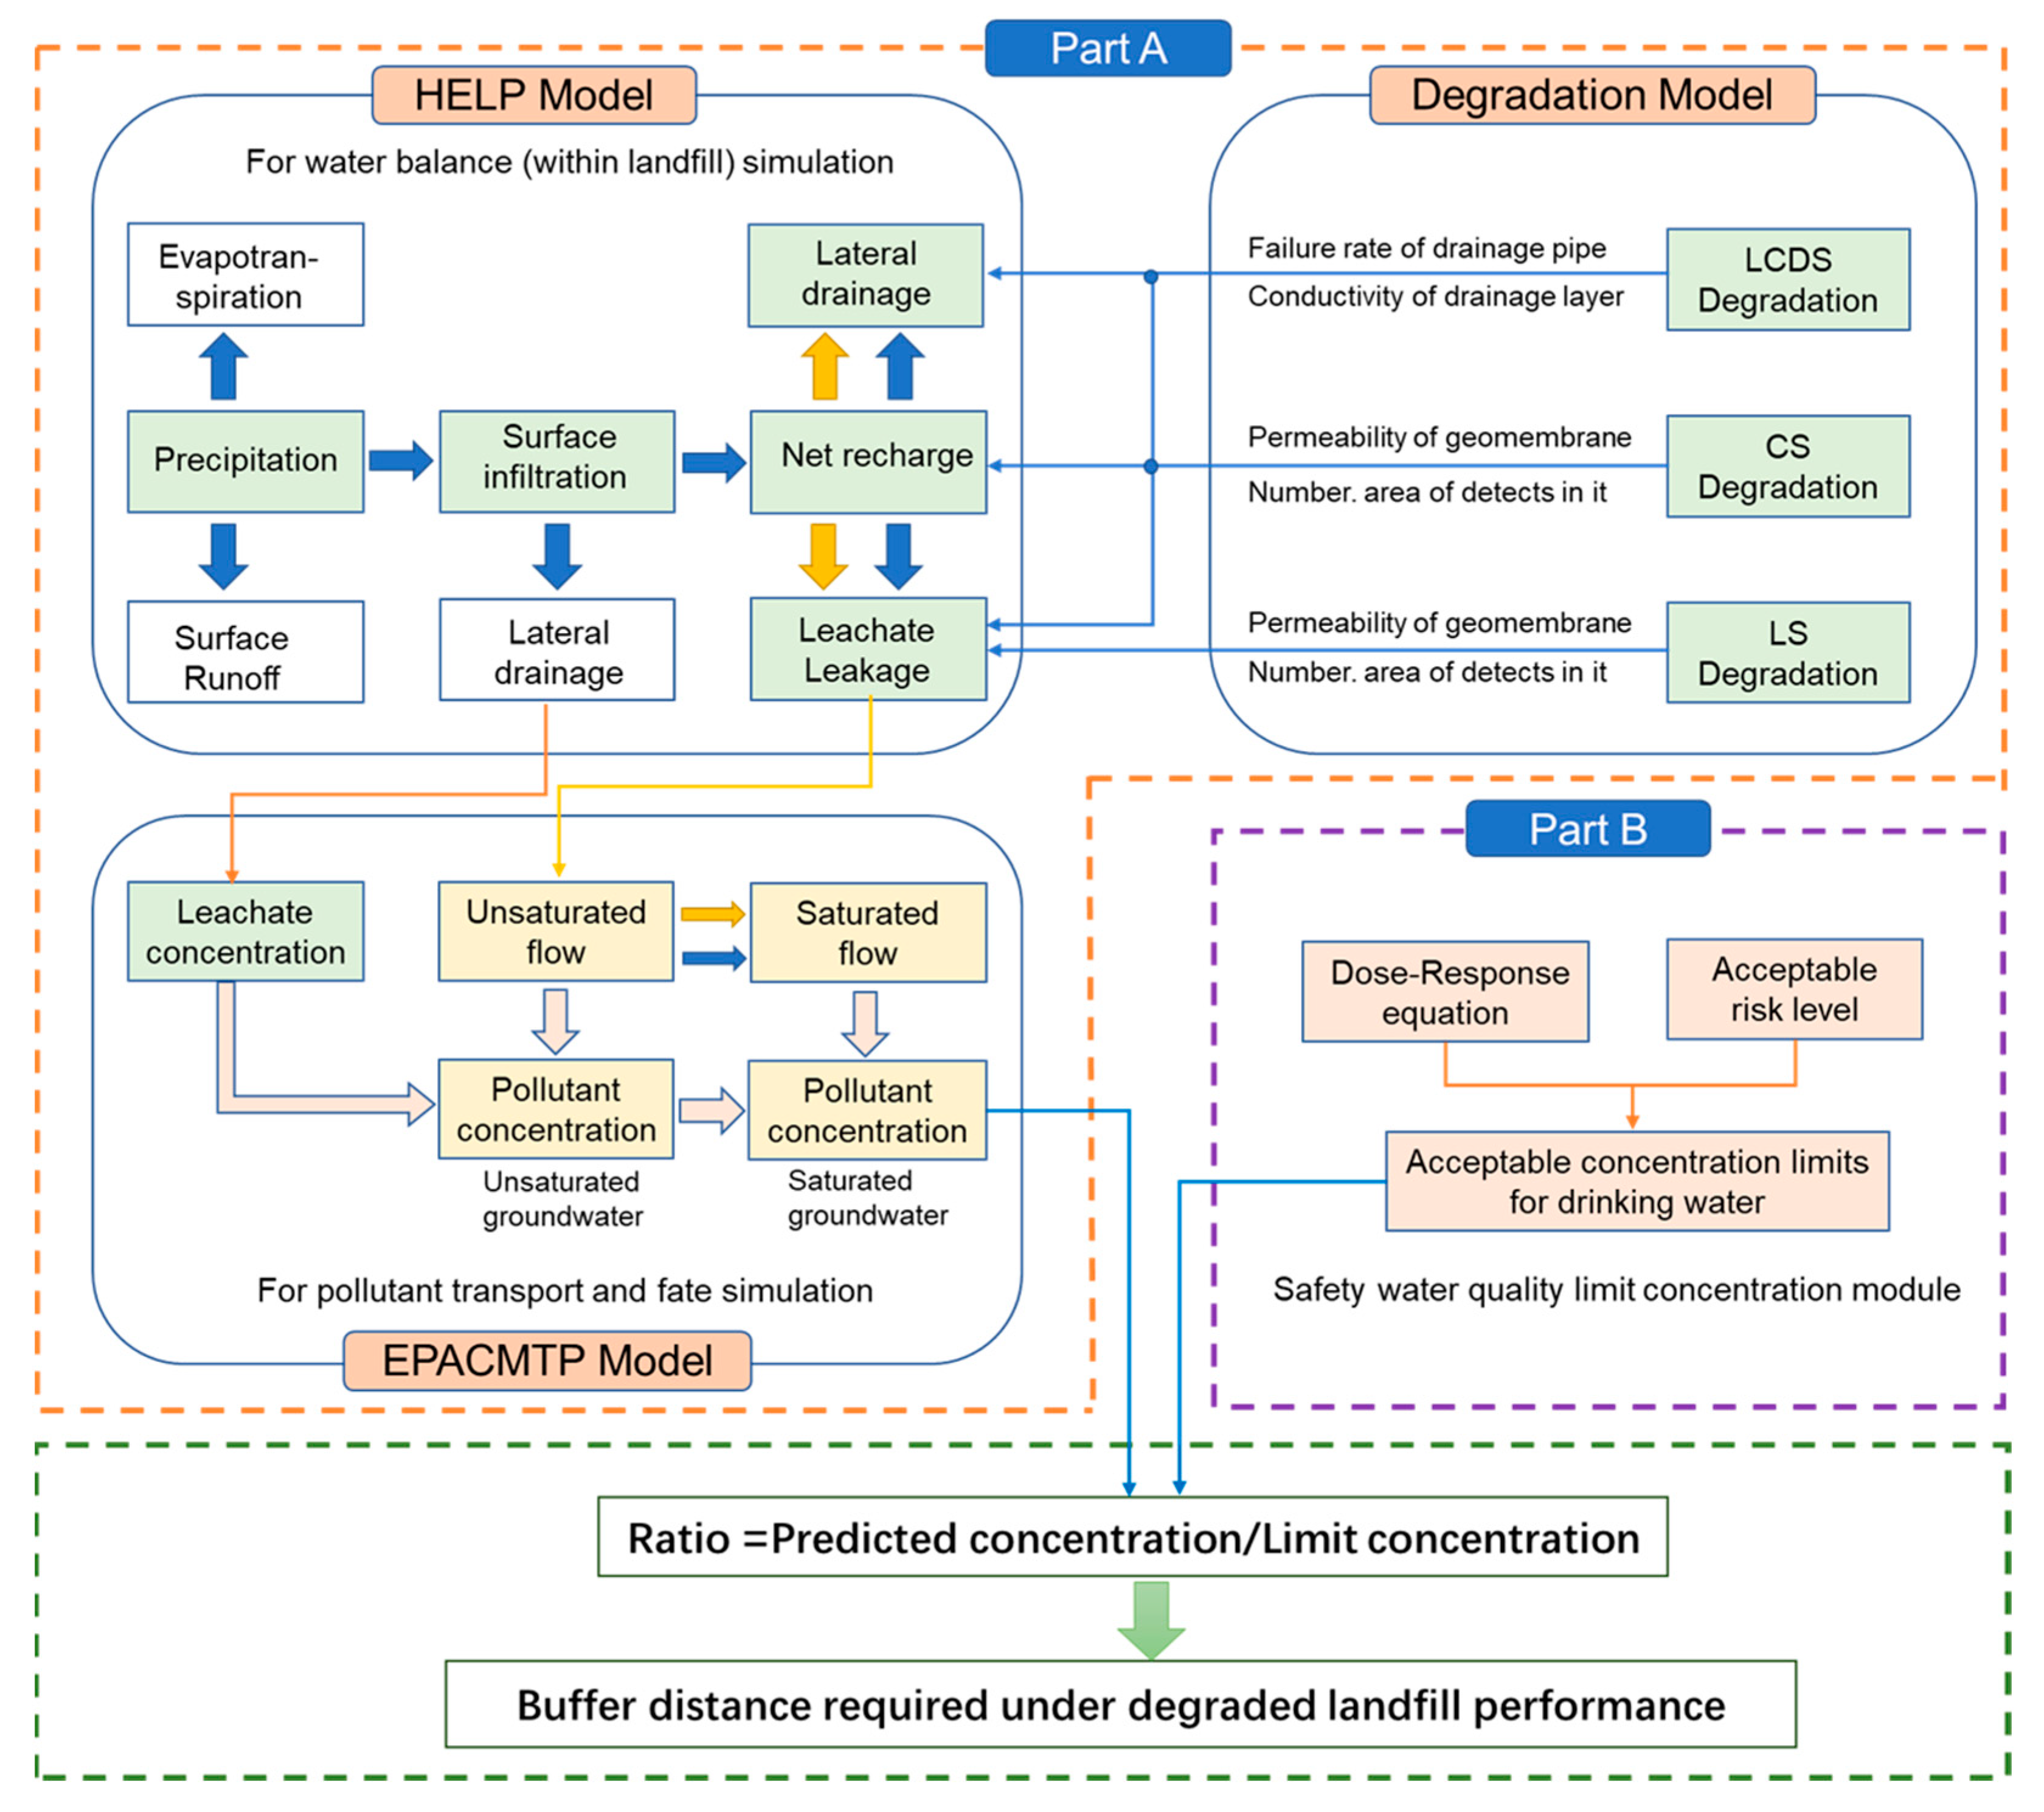
Figure 1. Framework and process of BFD for hazardous waste landfills under long-term aging conditions.
Water 15 01489 g001
Figure 2. Overview of a hazardous waste landfill.
Water 15 01489 g002
Figure 3. Dilution and attenuation of different contaminants at varying distances.
Water 15 01489 g003
Figure 4. Ratio of predicted contaminant concentrations (Cg) to concentration limits (CL) at different distances.
Water 15 01489 g004
Figure 5. Long-term aging BFD of 2,4-D, Ni, Cd and Zn allowing for uncertainty.
Water 15 01489 g005
Figure 6. Initial concentration of leachate required to be controlled for various pollutants at different distances between a sensitive water source and a landfill.
Water 15 01489 g006
Table 1. Parameters involved in concentration limit calculation and aging module.
SymbolParameter DefinitionUnit
Parameters involved in concentration limit calculationCgwthe contaminant concentration in groundwatermg/L
RfD0the reference oral intake dosemg/(kg⸱d)
WAFthe reference dose distribution proportion exposed to groundwater-
CGWERncgroundwater exposure corresponding to drinking the affected groundwater (non-carcinogenic effects)L/(kg∙d)
GWCRathe daily drinking volume of adultsL/d
EFathe adult exposure frequencyd/a
EDathe adult exposure perioda
BWathe adult human body masskg
ATncthe average time of non-carcinogenic effectd
CRthe carcinogenic risk of drinking groundwater-
SFthe cancer slope factor of the target pollutantmg/(kg⸱d)
CGWERcagroundwater exposure corresponding to drinking the affected groundwater (carcinogenic effects)L/(kg⸱d)
Parameters involved in aging moduleKgm(t)the permeability coefficient of HDPE membrane at moment tcm/s
N(t)the number of defects per hectare in year tDefects/Hectare
N0the number of defects per hectare in the first yearDefects/Hectare
Kd(t)the hydraulic conductivity of the drainage layer at the moment tcm/s
Kd0the hydraulic conductivity of the drainage layer at the initial momentcm/s
wastesthe hydraulic conductivity of wastecm/s
Table 2. Main parameters and values of BFD simulation [17].
ParameterUnitValueData Sources
Required parameters for the derivation of water quality indicator limitsDaily drinking volume of adults (GWCRa)L/d1[17]
Adult Exposure Frequency (EFa)d/a350
Adult Exposure Date (EDa)a24
Adult Body Weight (BWa)kg56.8
Average Time of Non-Carcinogenic Effect (ATnc)d2190
Reference dose distribution ratio for exposure to groundwater (WAF) 0.2
Oral Reference Dose (RfD (Ni))mg/(kg∙d)2 × 10−2
Oral Reference Dose (RfD (Zn))mg/(kg∙d)3 × 10−1
Oral Reference Dose (RfD (2,4-D))mg/(kg∙d)3 × 10−3
Oral Reference Dose (RfD (Cd))mg/(kg∙d)1 × 10−3
Parameters required by the HELP moduleSCS curve number 65Measured Data
Hole number in geomembrane0.1–5 mm2ha110
5–100 mm2ha5
100–10,000 mm2ha10
Surface slope-4%
Thickness of geomembrane in capping systemmm1
Design infiltrationmm43.2
Infiltration under cap failuremm321.8
Conductivity of geomembrane cm/s1 × 10−12
Thickness of soil under geomembrane of capping systemmm600
Conductivity of soil under geomembrane of capping systemcm/s1 × 10−5
Final waste thicknessm4.5
Drainage layer thicknessmm300
The initial conductivity of the drainage layercm/s1 × 10−2
Landfill bottom slope-1.15%
Drainage pipe spacing-10
Geomembrane thickness of liner systemmm2
Thickness of compacted soil under geomembranemm600
Conductivity of compacted soil under geomembranecm/s1 × 10−5
Parameters required by the aging moduleStart of geomembrane degradation since fillingcommencedyears6Measured Data
Time for number of holes in geomembrane to doubleyears8
Probability of failure for a single pipe-0.2
Parameters required by the EPACMTP moduleVadose zone thicknessm4Measured Data
Conductivity of vadose zonecm/s1 × 10−5
longitudinal dispersity of vadose zone2,4-Dm0.6
Cd/Zn/Nim0.042
Thickness of aquiferm20
Conductivity of aquifercm/s1 × 10−3
Hydraulic gradient-0.01
Longitudinal dispersity of aquifer2,4-Dm20.9
Cd/Zn/Nim0.17
The initial concentration (C0(Ni))mg/L2
The initial concentration (C0(Zn))mg/L120
The initial concentration (C0(2,4-D))mg/L20
The initial concentration (C0(Cd))mg/L0.6
Table 3. Uncertain parameters and their values in the model.
UnitValue RangeData Sources
Design infiltration mmNORMAL (43.2, 2.1)Site-measured value
Infiltration under cap failuremmNORMAL (321.8, 130.7)
Vadose zone thicknessmNORMAL (4, 1)
Thickness of aquifermNORMAL (30, 5)
Regional Gradient-NORMAL (0.01, 0.003)
Disclaimer/Publisher’s Note: The statements, opinions and data contained in all publications are solely those of the individual author(s) and contributor(s) and not of MDPI and/or the editor(s). MDPI and/or the editor(s) disclaim responsibility for any injury to people or property resulting from any ideas, methods, instructions or products referred to in the content.