Article

Sub-Pixel Surface Water Mapping for Heterogeneous Areas from Sentinel-2 Images: A Case Study in the Jinshui Basin, China

1
Hubei Water Resources Research Institute, Wuhan 430070, China
2
Hubei Water Resources and Hydropower Science and Technology Promotion Center, Wuhan 430070, China
3
Key Laboratory for Environment and Disaster Monitoring and Evaluation, Hubei, Innovation Academy for Precision Measurement Science and Technology, Chinese Academy of Sciences, Wuhan 430077, China
*
Author to whom correspondence should be addressed.
Water 2023, 15(8), 1446; https://doi.org/10.3390/w15081446
Submission received: 11 February 2023 / Revised: 30 March 2023 / Accepted: 5 April 2023 / Published: 7 April 2023
(This article belongs to the Special Issue Inland Surface Water and Deep Learning)

Abstract

:
Mapping high-spatial-resolution surface water bodies in urban and suburban areas is crucial in understanding the spatial distribution of surface water. Although Sentinel-2 images are popular in mapping water bodies, they are impacted by the mixed-pixel problem. Sub-pixel mapping can predict finer-spatial-resolution maps from the input remote sensing image and reduce the mixed-pixel problem to a great extent. This study proposes a sub-pixel surface water mapping method based on morphological dilation and erosion operations and the Markov random field (DE_MRF) to predict a 2 m resolution surface water map for heterogeneous regions from Sentinel-2 imagery. DE_MRF first segments the normalized difference water index image to extract water pixels and then detects the mixed pixels by using combined morphological dilation and erosion operations. For the mixed pixels, DE_MRF considers the intra-pixel spectral variability by extracting multiple water endmembers and multiple land endmembers within a local window to generate the water fraction images through spectral unmixing. DE_MRF was evaluated in the Jinshui Basin, China. The results suggested that DE_MRF generated a lower commission error rate for water pixels compared to the comparison methods. Because DE_MRF considers the intra-class spectral variabilities in the unmixing, it is better in mapping sub-pixel water distribution in heterogeneous regions where different water bodies with distinct spectral reflectance are present.

1. Introduction

Urban and suburban surface water bodies, including lakes, rivers, small reservoirs, fishponds, on-farm reservoirs, and paddy fields, are crucial natural resources. As such, it is important for water resource assessment and for agricultural and irrigation management to accurately monitor and map these surface water bodies to understand their spatial extent and temporal dynamics [1]. Monitoring large-scale water bodies has been greatly facilitated by the development of optical and synthetic aperture radar satellite remote sensing. Compared with synthetic aperture radar images, which are often noisy, optical remote sensing images, in which water and land are distinct in spectral reflectance, have been extensively utilized in mapping surface water at different scales [2]. For example, high-spatial-resolution images, such as from QuickBird and PlanetScope, have greatly facilitated the monitoring of small water bodies and rivers at resolutions finer than 10 m [2,3,4]. However, the high-spatial-resolution images have not been planned to cover the entire surface of the world in a regular time frame, and the commercial images are costly and have a narrow image span, which typically limits their use in mapping large-scale surface water bodies. Compared with high-spatial-resolution images, low-spatial-resolution images such as those from the moderate-resolution imaging spectroradiometer (MODIS), which has a spatial resolution of 250 m to 1 km, enable the mapping of large lakes at the global or continental scale at a daily frequency [5,6] but are limited to monitoring the spatial details of many small ponds and river nets. The medium-spatial-resolution Landsat series, with a history of approximately 50 years, has mapped global and regional water bodies, including rivers and reservoirs, at relatively medium spatial (typically 30 m) and temporal (approximately 16-day repetition rate) resolutions [7,8]. The medium-spatial-resolution Sentinel-2 satellite, launched in 2015, provides a multispectral high-spatial-resolution image at a typically 10 m spatial resolution, which enables the mapping of small water bodies, such as ponds and on-farm reservoirs, in heterogeneous regions [3,9,10,11].
Sentinel-2 image, which has 13 spectral bands, has been extensively used in many surface water mapping studies [9,12,13,14,15,16,17]. With the rich spectral information from Sentinel-2, studies have reported mapping water bodies on the basis of state-of-the-art machine learning methods, such as random forest [18,19] and the naïve Bayes classifier [20,21]. Spatial and spectral information from Sentinel-2 has been combined in an object-based analysis to map surface water bodies [22,23]. Moreover, with the development of deep learning techniques, the convolutional neural network has been utilized to extract deep semantic information about water bodies for Sentinel-2 surface water mapping [15,24,25,26]. The machine learning and deep learning methods require supervision and prior information about the water bodies [15,24,25,26,27]. The water index thresholding method is unsupervised and fully automatic, and has been extensively used because of its robustness and simplicity without inputting any prior information about the study area [14,28,29,30,31]. In particular, the water index method first extracts water indices, such as the normalized difference water index (NDWI) [32], modified NDWI (MNDWI) [33], automated water extraction index (AWEI) [34], 2015 Water Index (WI2015) [35], and Sentinel-2 water index (SWI) [16], and then utilizes thresholding algorithms to the water index image to produce the binary surface water map.
Although the aforementioned surface water mapping methods have mapped various water bodies from Sentinel-2 imagery, they all assign a Sentinel-2 pixel to either the water or land label and produce a binary water–land map. Therefore, these methods suffer from the mixed-pixel problem when both water and land classes contribute to the observed spectral response of the pixel. The mixed-pixel problem results in a large uncertainty in the accurate extraction of the water–land boundary [36,37,38,39]. To reduce the mixed-pixel problem in surface water mapping, spectral unmixing has been utilized to estimate surface water fractions (or area proportions) within each pixel [11,40]. Although the surface water fraction images contain sub-pixel water areal information relative to the pixel-based binary classifications, the spatial distributions of the surface water within the pixels are still unknown.
Sub-pixel mapping (SPM) is a method that predicts the land cover spatial distribution within mixed pixels [41,42]. SPM is a post-processing method applied to class fraction images and provides more information than spectral unmixing in land cover mapping. Various SPM methods have been proposed, including Markov random field (MRF) [43,44], Hopfield neural networks [45,46,47], pixel swapping algorithm (PSA) [42], spatial regularization [48], soft-then-hard model [49,50], attraction model [51,52], maximum a posteriori model [53], multi-objective optimization [44], spatial allocation [54], evolution algorithm [55], radial basis function interpolation [56], and deep learning [57,58]. Furthermore, SPM has been utilized in many fields, including mapping sub-pixel scale forests [59,60], trees [61], impervious surfaces [62], and surface water. For example, SPM has been used to map the spatial extent [36,38,63] and spatial–temporal dynamics of lakes [37]. The sub-pixel waterlines mapped from SPM have satisfied the mapping at 1:5000 standards using 20 m resolution imagery [64,65]. SPM has also been extensively used in mapping floods in floodplain regions [66], wetland regions [67,68], urban regions [69,70], and river basins [71,72,73]. In SPM for surface water mapping, the main focus is mapping sub-pixel surface water distribution within the water–land mixed pixels. Most SPM methods first detect the water–land mixed pixels from the image, which are then spectrally unmixed to water fractions. Finally, an SPM algorithm is utilized as a means to post-process the water fractions and map sub-pixel surface water within the mixed pixels [36,70]. Although SPM can greatly reduce the mixed-pixel problem in surface water mapping, several challenges still exist for SPM in heterogeneous regions.
First, the accuracy of SPM is directly dependent on the detection of the mixed pixels. If the mixed-pixel number is underestimated, the mixed pixel is incorrectly labeled as pure water or land pixels. Recent studies have used different thresholding segmentation methods to detect pure pixels in SPM. For example, Li et al. [36] applied a thresholding method to the histogram of the 250 m MODIS band to find pure water pixels. Liu et al. [70] applied OTSU thresholding segmentation to the NDWI image to extract pure water pixels. To the best of our knowledge, all of these methods apply only the morphological dilation operation to the water pixels in the binary water map to detect the mixed pixels. Dilation operation adds pixels to the boundaries of water pixels, which are assumed to be the water–land mixed pixels in the SPM model. However, the dilation operation fails to consider the existence of the potential mixed pixels within the water pixels that are segmented from the thresholding method. Moreover, considering that the detection of pure water pixels is difficult and has uncertainties and that the detected pure water pixels may be mixed in real scenarios in heterogeneous regions, it may be inappropriate to only use the morphological dilation operation in detecting mixed pixels for SPM.
Furthermore, SPM utilizes spectral unmixing for the mixed pixels, and the accuracy of the surface water fraction images is greatly dependent on the selected endmembers. Currently, sub-pixel surface water mapping has considered the variability of endmembers in unmixing the mixed pixels and uses local water (or land) endmembers within a local window around each target mixed pixel for spectral unmixing [36,70,74,75]. Although spectral unmixing is locally adaptive, recent studies often averaged the water spectrum and the land spectrum within the local window. The methods used in these studies are suitable for mapping large lakes where the water or land reflectance is homogeneous within the local window, but are unsuitable in heterogeneous regions where various water reflectances are encountered owing to factors such as different water contaminations and turbidities. The previous SPM methods, which averaged different water spectra and averaged different land spectra to produce local water and land endmembers in a local window, failed to consider the intra-class variability for water class and land class in spectral unmixing, and may have generated inaccurate water fraction images for SPM as a result.
Finally, various SPM algorithms can be applied to the surface water fraction images to produce the sub-pixel surface water map. The accuracy of the resulting surface water map is dependent on the algorithm used. Most studies often adopt SPM algorithms such as PSA, the attraction model, or the soft-then-hard model, which do not change the water fractions between the water fraction image (as the SPM input) and the sub-pixel surface water map (as the SPM output). In other words, the errors in the spectral unmixing are propagated into the resulting sub-pixel surface water map, resulting in lower accuracy and jagged land cover boundaries in the resulting map [76,77]. Therefore, the use of other SPM algorithms that can deal with spectral unmixing errors should be explored in Sentinel-2 surface water mapping.
This study proposes a new sub-pixel surface water mapping method using Sentinel-2 images that addresses the aforementioned challenges. In particular, the proposed method combines morphological dilation with morphological erosion, which removes pixels on water boundary pixels, to decrease the uncertainty in detecting the mixed water–land pixels, which are then unmixed on the basis of multiple water endmembers and land endmembers. In addition, the proposed method uses the MRF-based SPM algorithm to reduce the impact of water fraction image errors on the resulting surface water map. Unlike other sub-pixel surface water mapping methods that are applied to Landsat images, the proposed sub-pixel surface water mapping using dilation and erosion operations and the MRF (DE_MRF) is applied to a 10 m Sentinel-2 image to produce a 2 m surface water map. The proposed method was applied to the Jinshui Basin, China, which has a heterogeneous landscape of various water bodies, including lakes, rivers, paddy fields, and small reservoirs, near Wuhan, China. The proposed method was then assessed and compared with the state-of-the-art machine learning and deep learning water mapping methods [14,78,79] and several SPM algorithms [36,42].

2. Methods

DE_MRF predicts a 2 m resolution surface water map using Sentinel-2 multispectral images. First, the 20 m Sentinel-2 bands, including B5 (visible and near-infrared (VNIR) band), B6 (VNIR band), B7 (VNIR band), B8a (VNIR band), B11 (short-wave infrared (SWIR) band), and B12 (SWIR band), are downscaled to 10 m on the basis of the area-to-point regression kriging method, which has the advantage of preserving the spatial details when downscaling the low-spatial-resolution band to a high-spatial-resolution scale [80]. Then, the NDWI image is generated, and the edge-guided OTSU method is utilized to produce an initial 10 m binary surface water map. Both the morphological dilation and erosion operations are applied to the water pixels to generate the initial water pixels, land pixels, and mixed pixels. The water pixels and land pixels are then divided into water or land pixels of different sub-classes on the basis of k-means clustering. The mixed pixels are unmixed based on local water and land endmembers from multiple sub-classes (clusters) within a moving window. With the 10 m water fractions in the mixed pixels, an MRF-based SPM is used for producing the final 2 m surface water map. Figure 1 presents a flowchart of DE_MRF.

2.1. Sentinel-2 Mixed-Pixel Detection Using Morphological Operations

The DE_MRF produces an initial 10 m resolution binary surface water map from the Sentinel-2 image and then detects the mixed water–land pixels used for spectral unmixing and SPM. In this study, the water index thresholding method, which is fully automatic without any prior information about the study area, is used to produce the binary surface water map. The NDWI image calculated from the multispectral Sentinel-2 images is selected as the water index used for mapping surface water [81]. The main reason for selecting NDWI is that it is computed from the 10 m resolution green and VNIR bands from Sentinel-2, whereas most of the other water indices, such as MNDWI [33], AWEI [34], WI2015 [35], and SWI [16], require the Sentinel-2 SWIR bands at 20 m spatial resolution in which some spatial details of the water bodies may be distorted [30]. Although pansharpening algorithms can downscale the 20 m SWIR bands to 10 m in the computation of the water index, great uncertainty exists in the selection of the pansharpening algorithm and the selection of a pan-like band in pansharpening [14,70]. In addition, previous studies have suggested the effectiveness of using only finer-spatial-resolution bands instead of combining all of the spectral bands in surface water spectral unmixing and SPM. For example, the spectral unmixing [74] and SPM [36] studies adopted only the 250 m MODIS bands and discarded the 500 m MODIS bands in water–land segmentation to maintain spatial details of water bodies. Finally, the NDWI image has indicated its effectiveness in the SPM for water bodies from Landsat imagery [70]. Therefore, the NDWI image generated from the 10 m Sentinel-2 bands is adopted and segmented into an initial binary water map using the edge-guided OTSU method [82]. Compared with the traditional OTSU segmentation method that is applied to entire image pixels to search for the optimal threshold for distinguishing water/land, which may be inaccurate when the water pixels only account for a small proportion in the image, the edge-guided OTSU selects pixels from edge pixels, so the number of potential water and land pixels used for determining the optimal threshold is similar. With the optimal NDWI threshold determined by the edge-guided OTSU segmentation, the initial 10 m binary water body map is produced.
DE_MRF applies morphological operations to the binary water body map to determine the mixed pixels in the image. In the binary surface water map, the mixed pixels are assumed to be located near the border between the water pixels and land pixels. In contrast to previous methods that only use the dilation operation to determine the mixed pixels [36,70], the proposed method considers that the mixed pixel can be located in both the initial water pixels and land pixels at the water–land pixel borders and uses both dilation and erosion operations to determine the mixed pixels. Assume A is the binary water map and B is the structuring element (e.g., the 3 × 3 structuring element highlighted with gray squares in Figure 2). The morphological dilation operation, i.e., A B , is used for expanding the binary water map (A) using the structuring element (B), and the morphological erosion operation, i.e., A   B , is used for shrinking the binary water map (A) using the structuring element (B). Therefore, dilation adds pixels to the boundaries of water objects, whereas erosion removes pixels on water object boundaries. Figure 2 presents a sketch map illustrating the morphological dilation and erosion operations using the 3 × 3 binary structuring element.

2.2. Mixed-Pixel Spectral Unmixing Using Local Multiple Endmembers

The multispectral Sentinel-2 image is spectrally unmixed using endmembers automatically estimated from the Sentinel-2 image. Considering that the water and land endmembers vary greatly in the image and that using global water and land endmembers in the image would result in a loss of local endmember variability information, the proposed method uses local endmembers for spectral unmixing of the mixed pixels. Thus, for a detected mixed pixel in the Sentinel-2 image, the local endmembers are selected using a local square window that uses the target mixed pixel as the window center. Specifically, for a detected mixed pixel, the local endmembers are selected on the basis of a 5 × 5–sized square local window with the target mixed pixel as the window center. The 5 × 5 local window may be relatively small and does not contain the refined pure water or pure land pixels within the window. In this case, the window size is enlarged iteratively (from 5 × 5 size to 7 × 7, 9 × 9, …, and the target mixed pixel has remained as the local square window center) until the window contains at least one refined pure water pixel and one refined pure land pixel. Then, the refined pure water and pure land pixels within this square window are used to produce the local water and local land endmembers for the target mixed pixel. The local window is applied to each mixed pixel to select the corresponding local endmembers for that mixed pixel.
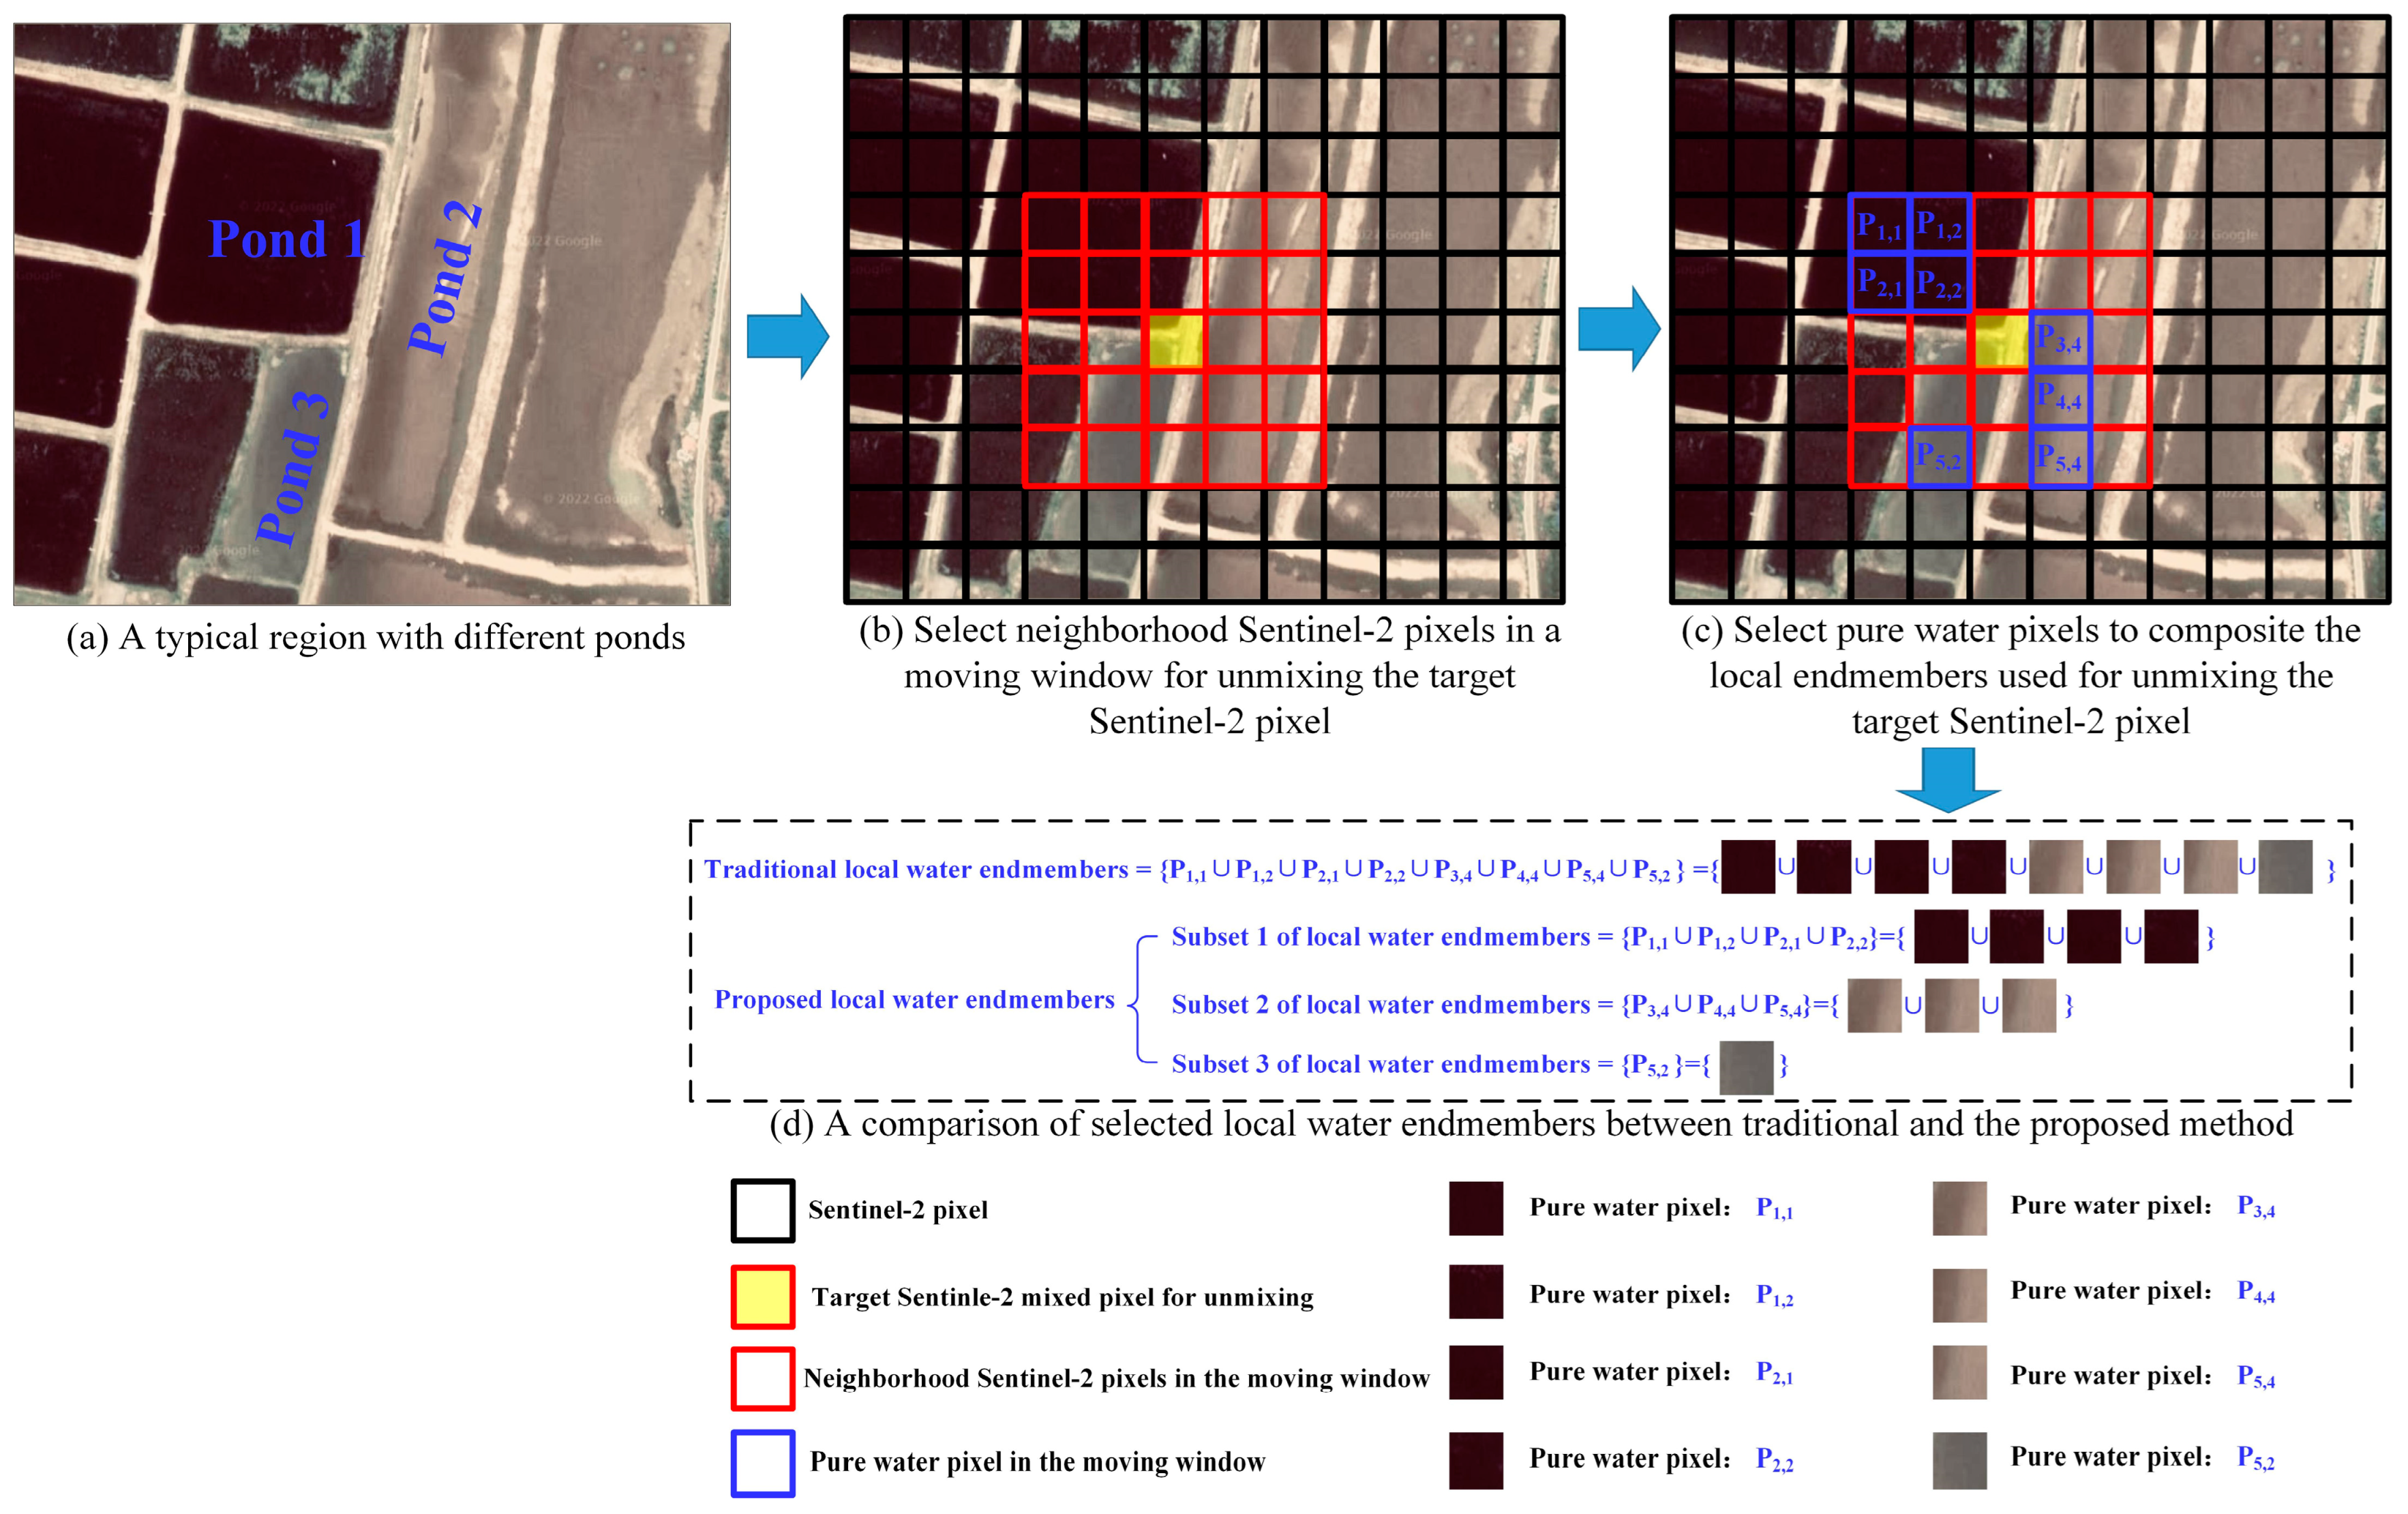
Considering the heterogenic landscapes in urban and suburban regions, the local window may contain water pixels of various water bodies, such as different ponds, rivers, lakes, and reservoirs, and different land objects, such as impervious surfaces, soil, and vegetation, which have different spectral values (Figure 3). Previous SPM methods average the spectra from all pure water (or land) pixels within the local window to produce the local water (or land) endmember, whereas the proposed method considers the intra-class spectral variability within each local window. In particular, the spectral values of the refined pure water pixels are clustered into nwater clusters on the basis of the k-means algorithm, so the pure water pixels belonging to the same water cluster have similar spectral values (Figure 1). Similarly, the spectral values of the refined pure land pixels are clustered into nland clusters on the basis of the k-means algorithm (Figure 1). Then, for each water or land cluster, the local endmembers are calculated by averaging the spectra from pixels belonging to this cluster within the local window. If the local window does not contain the pixels of the cth cluster, then the endmember of the cth cluster is not considered in unmixing this target mixed pixel within the local window.
A sketch map of selecting local pure water pixels from different ponds in a paddy field region is portrayed in Figure 3. The target mixed pixel, which can be detected by applying the morphological operations to the binary surface water map as presented in Figure 2, is highlighted in the red rectangle, and the blue rectangles depict the pure water pixels within the 5 × 5–sized local window with the target mixed pixel as the window center. The target mixed pixel is composed of water from three different ponds in which the water has different spectral reflectances and is thus represented with different colors. The 5 × 5–sized local window contains eight pure water pixels, i.e., P1,1, P1,2, P2,1, P2,2, P3,4, P4,4, P5,4, and P5,2 (the subscript number indicates the row and column number in the local window), highlighted with blue rectangles in Figure 3c. Pixels P1,1, P1,2, P2,1, and P2,2 belong to pond 1; pixels P3,4, P4,4, and P5,4 belong to pond 2; and P5,2 belongs to pond 3 in Figure 3a. The pixels in the same pond are similar in optical presence, and the pixels in different ponds are dissimilar. Traditional SPM methods average the pure water spectra of the pure water pixels from all three ponds, i.e., {P1,1 ∪ P1,2 ∪ P2,1 ∪ P2,2 ∪ P3,4 ∪ P4,4 ∪ P5,4 ∪ P5,2}, as one water endmember in the unmixing without considering the difference in water pixels (Figure 3d). By contrast, the proposed DE_MRF could consider the water spectra from different ponds to incorporate intra-class spectral variability of water and may group different water pixels into different subsets in spectral unmixing (Figure 3d). Therefore, the proposed SPM that uses different subsets of local pixels in endmember estimation and spectral unmixing is expected to generate a more accurate surface water fraction for the mixed pixel.
With the selected local water and local land endmembers, DE_MRF applies the fully constrained least squares linear spectral mixture (FCLS) to the target mixed Sentinel-2 pixel to generate water fractions within this pixel. With the water fractions predicted by FCLS in the mixed pixels and by assigning the water fractions of 100% for the pure water pixels and 0% for the pure land pixels, the 10 m surface water fraction image can be generated (Figure 1).

2.3. Mixed-Pixel Sub-Pixel Mapping

The MRF-based SPM of surface water is utilized to map the water bodies at the sub-pixel scale within mixed pixels. The MRF-SPM is formulated by utilizing the maximum a posteriori rule in the Bayesian framework. The optimal surface water map at the sub-pixel scale is solved by maximizing the posterior probability of the sub-pixel map given the surface water fractions, and it selects the most likely sub-pixel map among all the possible maps given the surface water fraction image. Assuming the resulting sub-pixel map has the Markov random field property, the model assumes that neighboring pixels more possibly belong to the same land cover class than different classes. The MRF-SPM was first proposed by Kasetkasem et al. [44] and has been extended in many fields [36,41,62]. DE_MRF focuses on surface water mapping and adopts the water fraction images as the input, whereas the classic MRF-SPM in [44] focuses on multiple land covers and adopts the multispectral remote sensing images as the input. In particular, the MRF-SPM framework can be demonstrated in Equation (1):
X = argmax P r X | Y = argmax P r Y | X P r X
where X is the high-spatial-resolution surface water map, Y is the surface water fraction image, P r X | Y is the posterior probability of X given Y, P r Y | X is the probability of Y given X, and P r X is the marginal probability density function of X. The details of the MRF-SPM model and parameter setting are introduced in the Supplementary Materials.
Before SPM, the 10 m surface water fraction image is downscaled to a 2 m resolution surface water map with a scale factor s = 5. In this step, if the surface water fraction is f% in a target Sentinel-2 pixel, a total of s × s × f% pixels at 2 m spatial resolution are assigned to water, and s × s × (100% − f%) pixels at 2 m spatial resolution are assigned to land. Then, the surface water pixels are randomly allocated within this Sentinel-2 pixel. Sub-pixels in the pure water pixels and pure land pixels are directly labeled as water and land, respectively. As this study focuses on the sub-pixel mapping of water–land mixed pixels, MRF-SPM was applied only to the detected mixed pixels. Moreover, the simulated annealing (SA) mode is used to update the sub-pixel labels within the range defined by the mixed pixels in the initial 2 m surface water map to produce the final surface water map. The SA ends if less than 0.1% of pixels change between two iterations. Note that the proposed method is only applied to the mixed 10 m Sentinel-2 pixels, and the labels of water and land pixels in the pure water pixels and pure land pixels are unchanged in each iteration.

3. Experiments

3.1. Study Area and Data

Jinshui Basin, located at the border of Wuhan and Xianning City, China, was selected as the study area. This region covers an area of approximately 2616 km2 and has an elevation of approximately 17–25 m (Figure 4). This basin has several lakes, including the three main lakes of Futouhu Lake, Xiliang Lake, and Luhu Lake, and is connected to the Yangtze River. The basin also contains several wetlands and plays an important role in fishing, irrigation, rainwater storage, and shipping.
A Sentinel-2 image acquired on 19 January 2021, was used as the model input (Figure 4). In this study, only the 10 m and 20 m Sentinel-2 bands that are sensitive to surface water were used. The 10 m green and VNIR bands were used to calculate the NDWI image in producing the initial surface water map, and all of the 10 Sentinel-2 bands were used for local endmember extraction in the spectral unmixing.

3.2. Comparison Methods

DE_MRF was compared with several SPM methods and several state-of-the-art spectral indexes–based, machine learning–based, and deep learning–based surface water mapping methods. DE_MRF has two main steps. First, DE_MRF uses morphological dilation and erosion operations to determine the locations of mixed pixels and uses multiple local endmembers for unmixing the mixed pixels to generate the surface water fraction image. Second, with the surface water fraction image, DE_MRF uses the MRF-based SPM to produce the 2 m resolution surface water map. To assess the effectiveness of the first step, DE_MRF was compared with previously proposed methods that use only the dilation operation in mixed-pixel detection and use the average value of the local water endmembers and local land endmembers to produce the initial surface water fraction map via spectral unmixing. To assess the effectiveness of the second step, MRF-based SPM was compared with the popular PSA. The details of the comparison methods are presented in Table 1. Note that all the SPM methods were applied only to the detected mixed pixels.
Furthermore, several state-of-the-art surface water mapping methods were also compared. The methods included the spectral index–based method based on thresholding methods applied to the water index. The first comparator is the edge-guided OTSU thresholding method applied to the NDWI image, that is, NDWI_OTSU [11,83]; the second comparator is the edge-guided OTSU thresholding method applied to the MNDWI image, that is, MNDWI_OTSU [14,33]. The machine learning method support vector machine (SVM), which has been extensively used in image classification and surface water mapping [84,85], was compared, and the deep learning method UNet [78], which has a simple network structure and lightweight parameters for image segmentation and classification, was also compared. SVM and UNet were applied to the 10 m Sentinel-2 multispectral image. The NDWI_OTSU, MNDWI_OTSU, SVM, and UNet all produced a pixel scale 10 m surface water map that was used for comparison.

3.3. Model Parameter and Accuracy Assessment

The model parameters of different methods were set as follows. In DE_MRF, the numbers of water and land clusters for spectral unmixing were set to 4, so that the number of endmembers in spectral unmixing was in the range of 2–8. The reason for this is that the fully constrained least squares linear spectral mixture was used, which required the number of endmembers to be no more than the number of spectral bands (10 bands in this study). Furthermore, for all SPM algorithms, the window size for the calculation of sub-pixel spatial dependence was set to 5 [86]. For the SVM classifier, the water, vegetation, impervious surface, and soil endmembers were directly extracted from the image to avoid the impact of atmosphere circumstances, and the radial basis function was selected as the kernel type used in SVM. In the UNet model, more than 2000 Sentinel-2 multispectral image patches and the corresponding label image with water and land in it, with 256 × 256 pixels in each patch, were used for training. The training images were acquired on similar dates to the images used in this study to reduce impacts such as crop phenology and satellite observation condition. Data augmentation operations such as image rotation were applied to the training image. The graphics processing unit (GPU) is NVIDIA 2060, which has 6 GB of RAM and uses cuDNN 10.0 for acceleration to run the UNet model.
All the SPM algorithms were assessed on the basis of GF-1 and GF-6 images acquired on 18 January 2021 (GF-6), 14 January 2021 (GF-1), and 11 January 2021 (GF-1), which were close to the Sentinel-2 image (19 January 2021) to avoid the impact of land cover change in accuracy assessment. The GF-1 and GF-6 images had multispectral bands at a resolution of 8 m and panchromatic bands at a resolution of 2 m. The 8 m multispectral bands were pansharpened to 2 m resolution. The GF-1 and GF-6 images were co-registered to the Sentinel-2 image and mosaicked, as presented in Figure 5. A total of 6000 sample points were adopted for assessing the accuracy of different methods. The 6000 sample points, including 3000 water pixels and 3000 land pixels, were randomly selected in the study area highlighted with yellow points in Figure 5. Many water pixels were distributed in the homogeneous land cover regions of large lakes. Different SPM algorithms were only applied to the mixed pixels determined by the morphological operations. Another 8000 sample points, including 4000 water pixels and 4000 land pixels that were selected within the mixed pixels determined by the morphological dilation and erosion operations to the NDWI image, were selected to further assess the accuracy of different SPM algorithms. The 8000 sample points were distributed in heterogeneous land cover regions highlighted with green points in Figure 5. All of the sample points were visually interpreted by experts with extensive experience in remote sensing and surface water analysis using the 2 m GF-1 and GF-6 images in Figure 5. The overall accuracy, omission error, and commission error were used for accuracy assessment. The critical success index was also used to quantify the accuracy of surface water [87]. The use of better input data (such as images with finer resolution) and the use of more advanced interpretation methods (such as visual interpretation by using expert knowledge) are effective to quantify the land cover or surface water map [37,88,89,90,91]. As the sample data were interpreted from the 2 m GF-1 and GF-6 images, the accuracy of the pixel scale classification map outputted from NDWI_OTSU, MNDWI_OTSU, SVM, and UNet at the 10 m resolution was not assessed using these 8000 samples.

4. Results

4.1. Visual Comparison of the Results

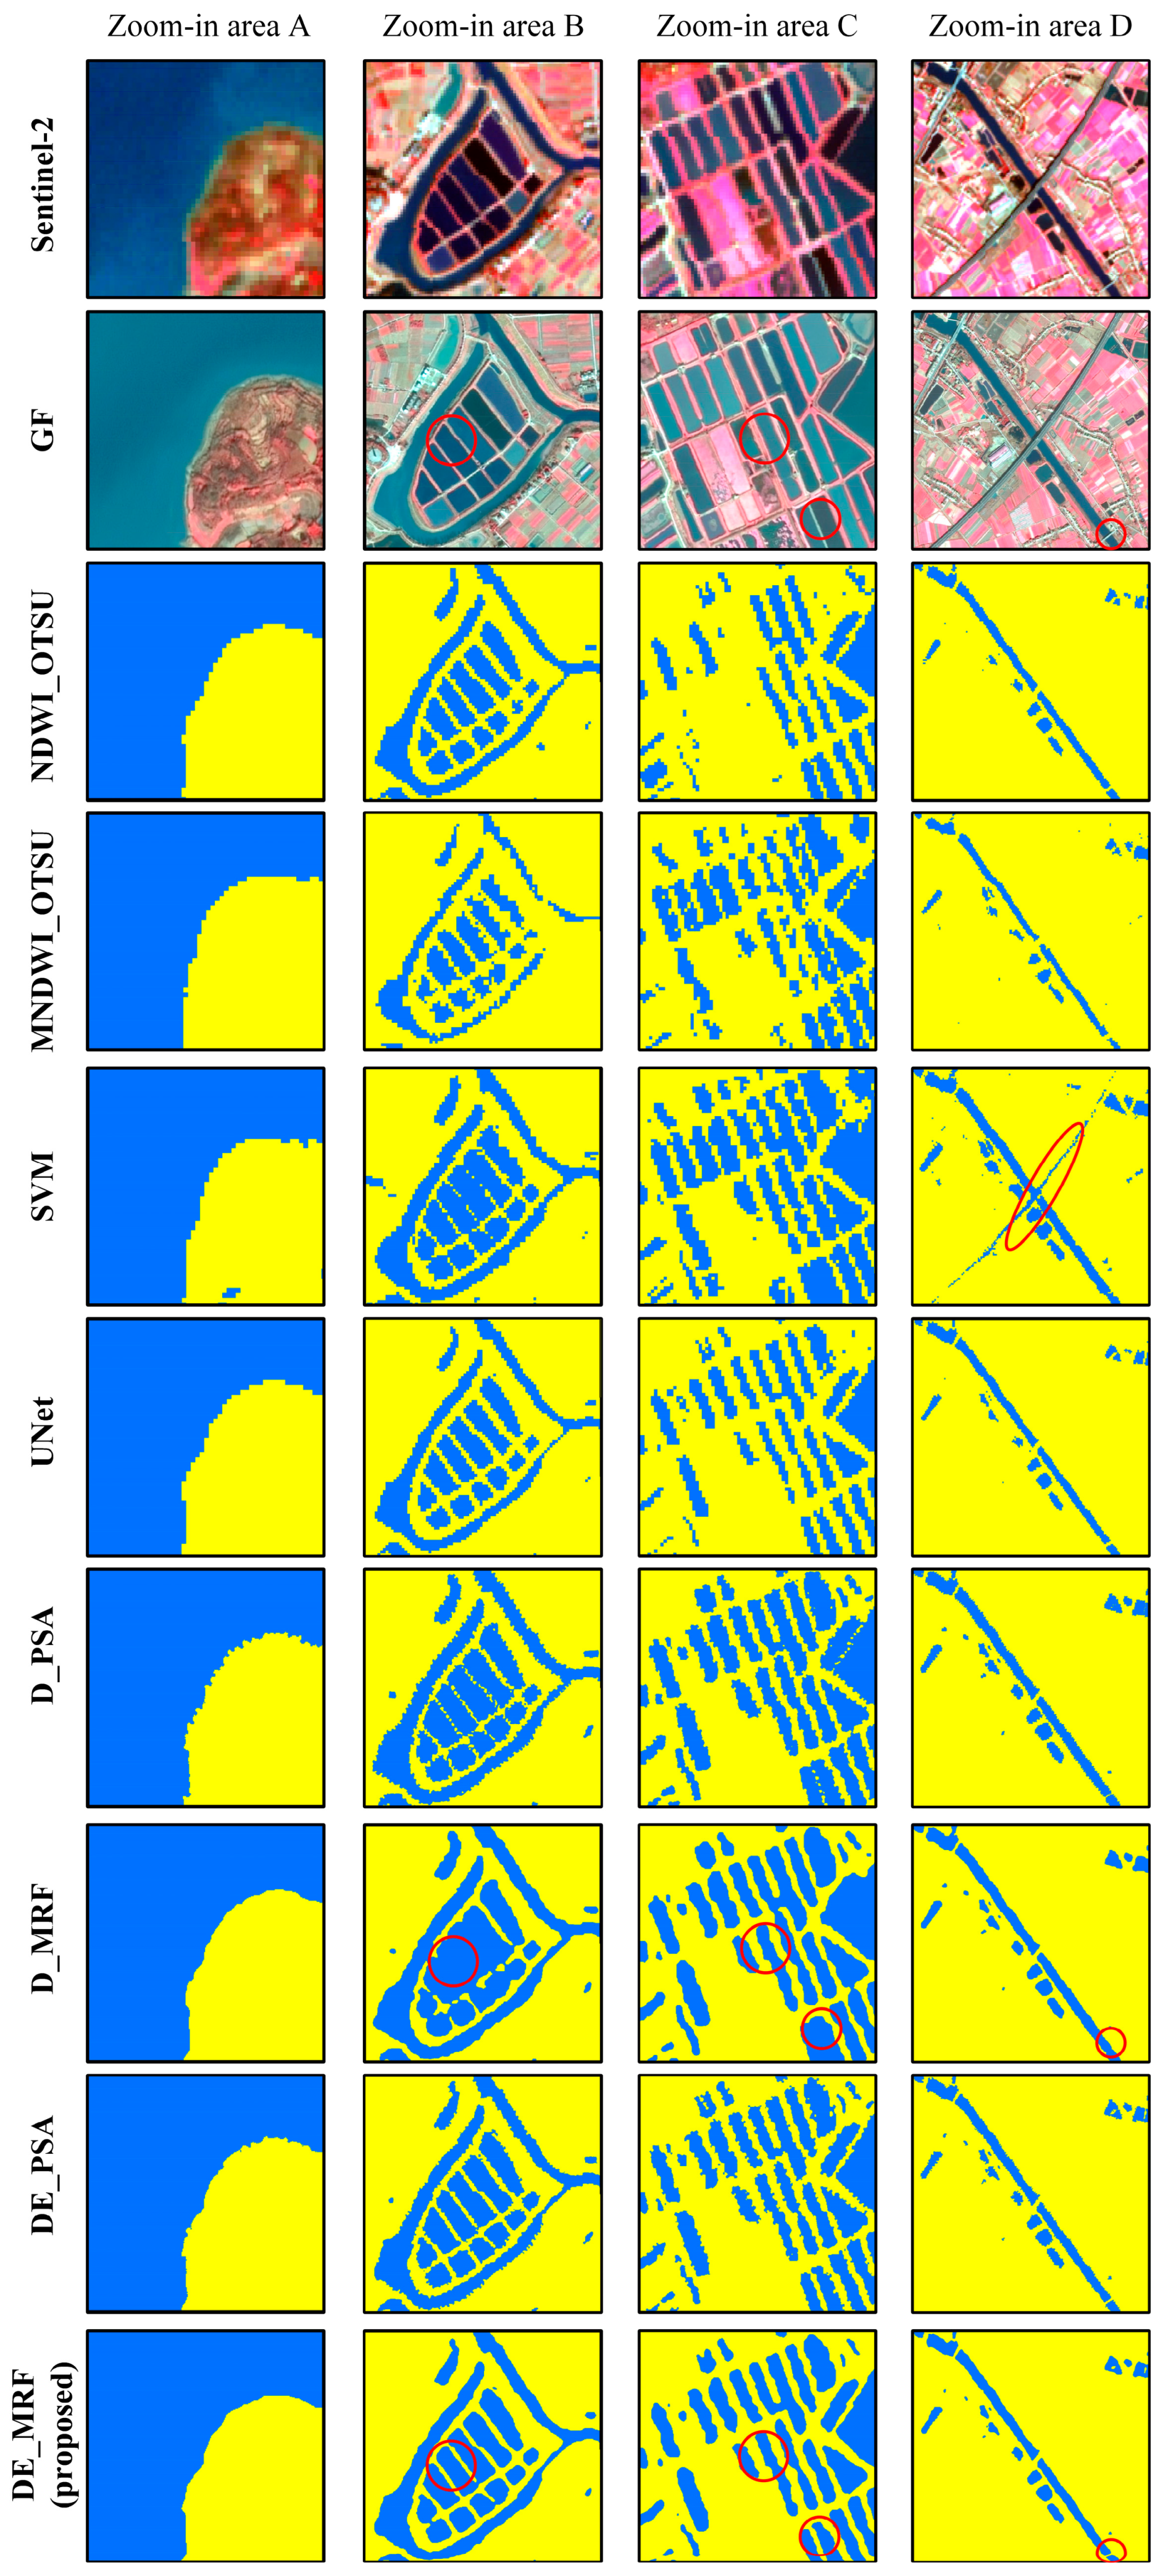
The resulting surface water maps from different algorithms are presented in Figure 6. As shown in Figure 6c, SVM generated more water bodies than other methods. Zoomed-in areas A–D in Figure 6 are presented in Figure 7. Zoomed-in area A is located at the border between Futouhu Lake and the land. As illustrated in Figure 7, NDWI_OTSU, MNDWI_OTSU, SVM, and UNet generated jagged water–land boundaries because the map was generated at the 10 m resolution. SVM incorrectly predicted the linear bridge as surface water, as highlighted with a red ellipse in zoomed-in area D in Figure 6. The main reason is that SVM is a pixel-based classifier based on pixel spectral information, whereas the water and the bridge have similar spectral values in the Sentinel-2 image.
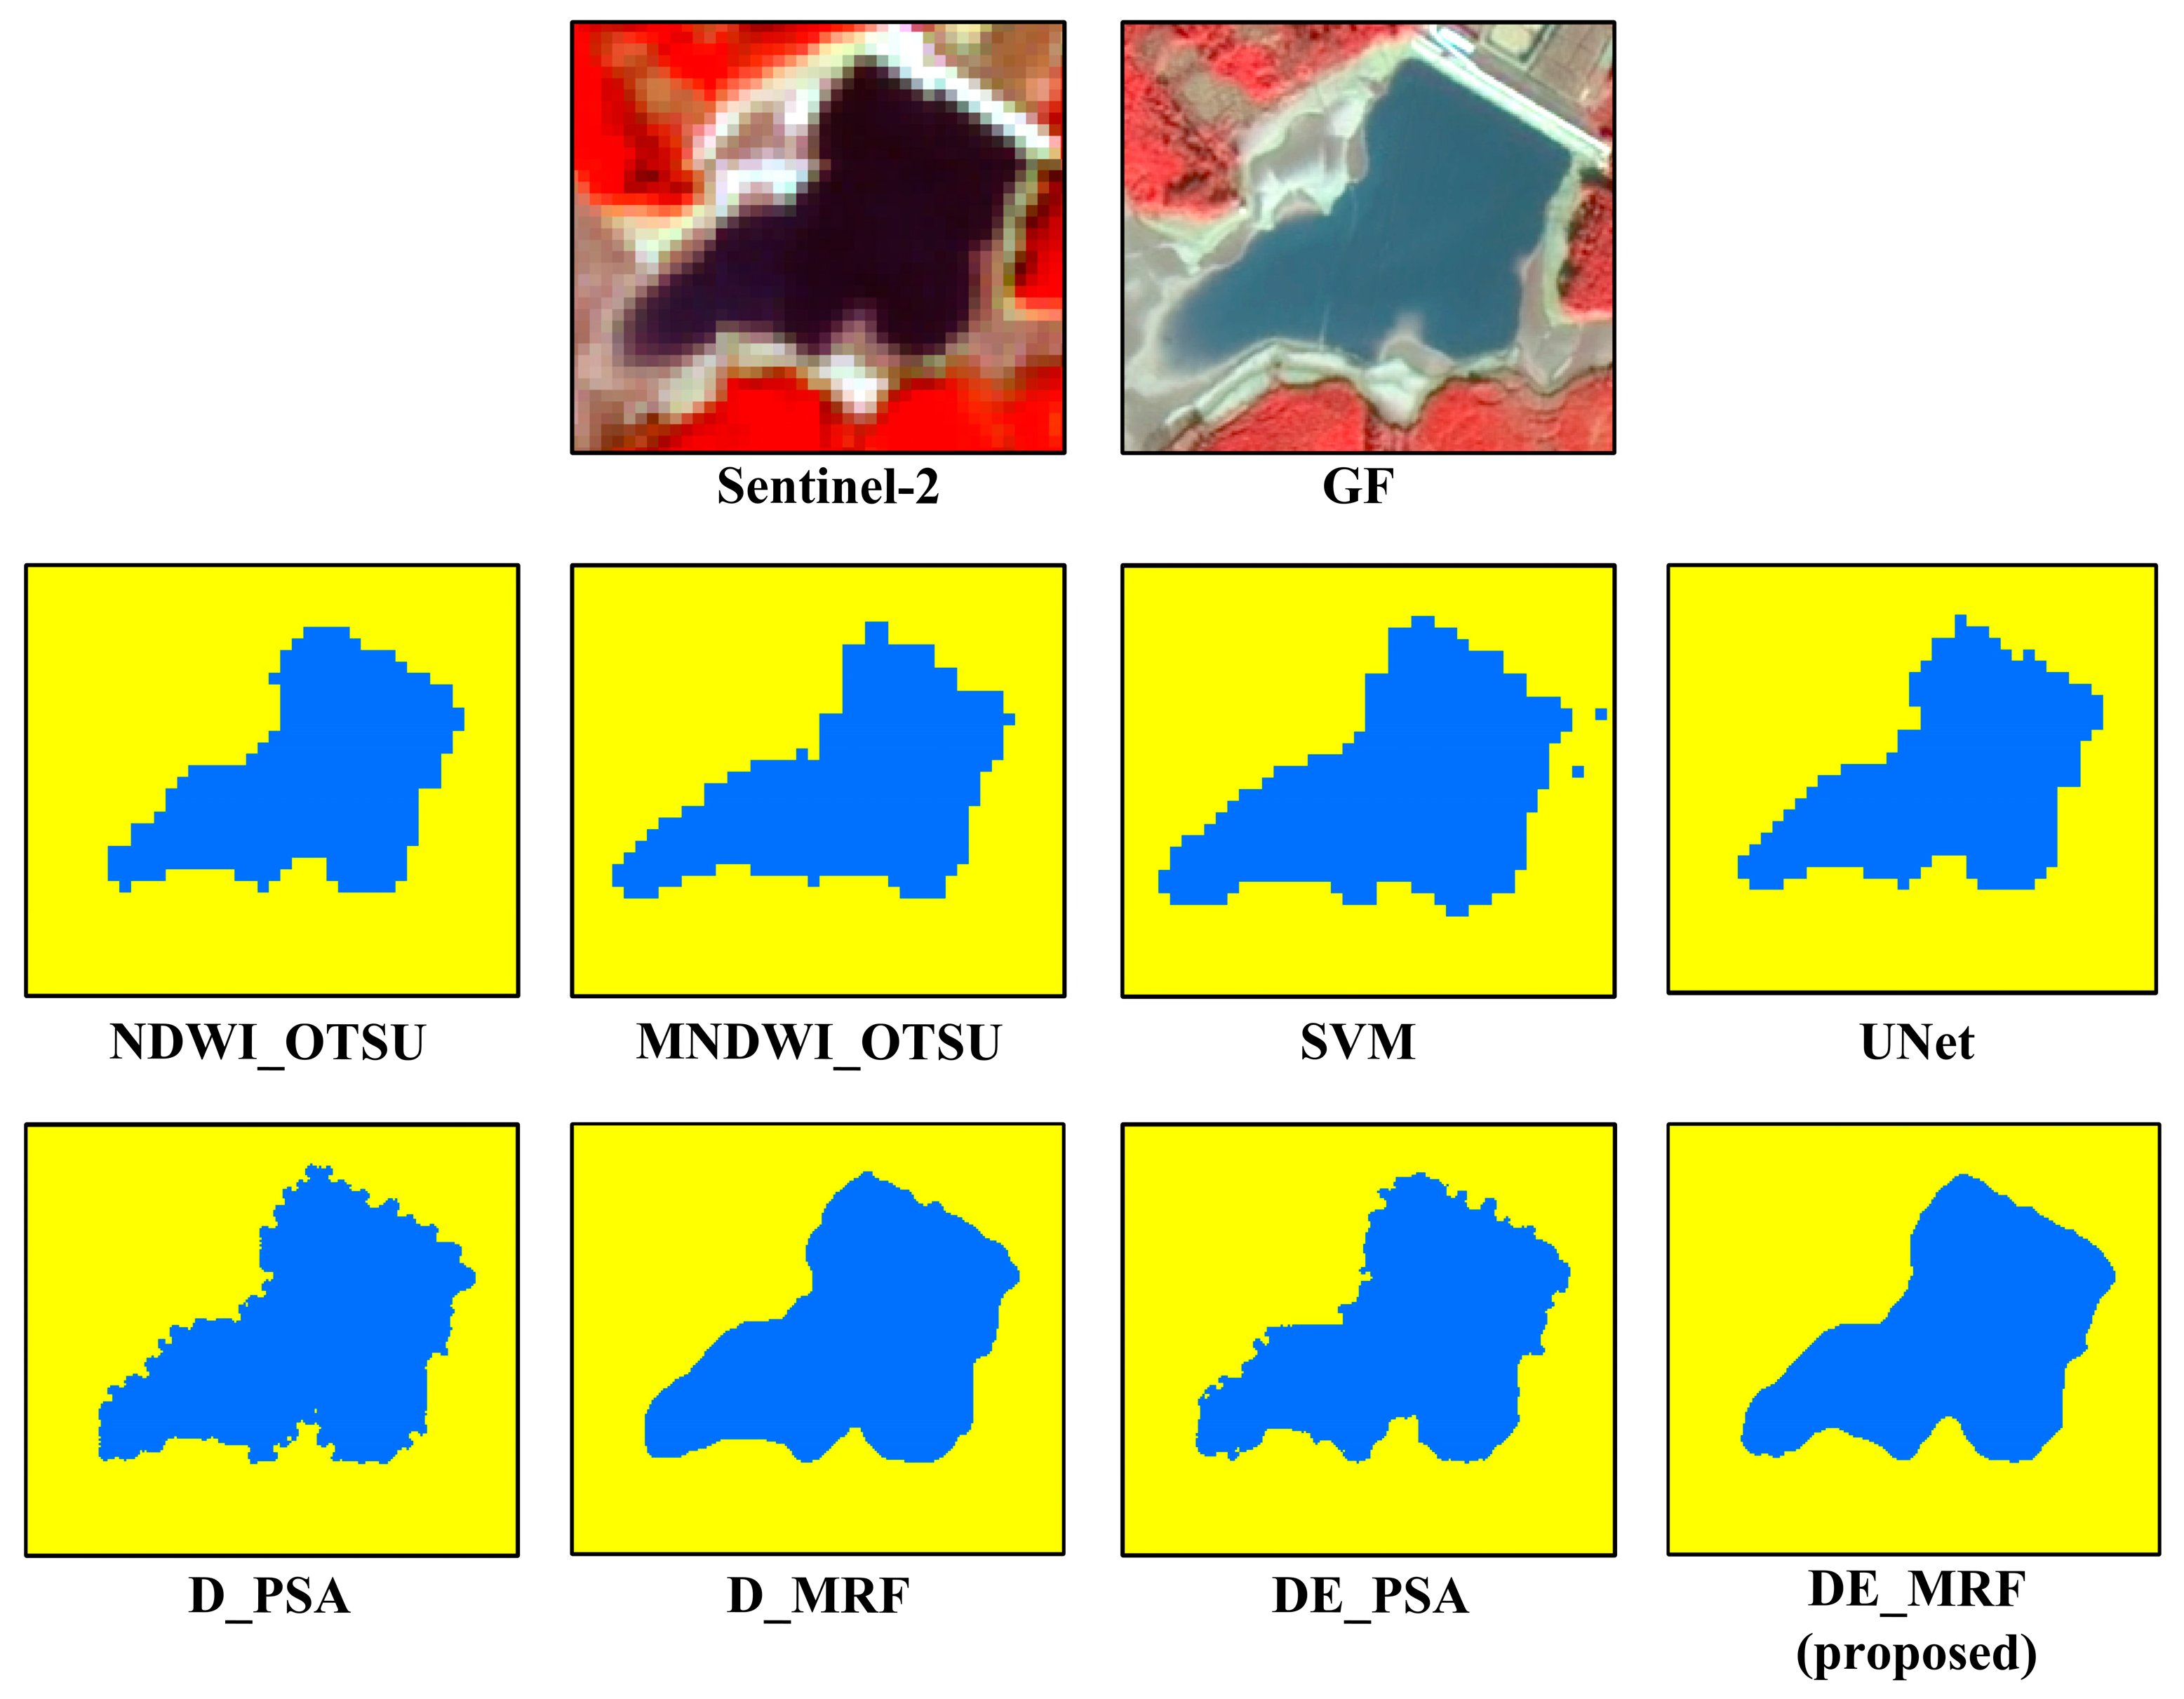
The sub-pixel maps of D_PSA and DE_PSA contain many jagged boundary pixels. This is primarily because the PSA used for SPM does not change the surface water fractions between the input unmixed fraction image and the output sub-pixel surface water map, and the fraction image error is preserved in the resulting map. For example, if the water fraction in the unmixed fraction image is 20% higher than the actual water fraction in a Sentinel-2 pixel, then at least s2 × 20% = 5 land pixels will be incorrectly labeled as a water pixel in this Sentinel-2 pixel, which may result in jagged water patches. In contrast to PSA, the MRF-based SPM algorithm does not necessarily preserve the water fraction from the unmixed fraction images in the final map. As illustrated in Figure 7, D_MRF and DE_MRF generated smoothed water–land boundaries in zoomed-in area A. The differences between the PSA and MRF maps are more evident in the zoomed-in area figure in Figure 8, which is enlarged area E from Figure 6. NDWI_OTSU, MNDWI_OTSU, SVM, and UNet generated jagged boundaries because of the relatively coarse spatial resolution (10 m) of the Sentinel-2 image. Although the four SPM methods were predicted at the sub-pixel scale with a 2 m resolution, D_PSA and DE_PSA both generated jagged boundaries because they strictly preserved the class fractions from the spectral unmixing into the resultant sub-pixel surface water map. By contrast, both D_MRF and DE_MRF, which smoothed the class boundary according to the MRF property and did not strictly preserve the unmixed class fractions to the result, generated more smoothed water–land boundary than D_PSA and DE_PSA. This finding indicates that D_PSA and DE_PSA are sensitive to the error that is propagated from spectral unmixing, whereas D_MRF and DE_MRF are more robust to the spectral unmixing error.
In Figure 7, zoomed-in areas B and C are located in paddy fields in the Jinshui Basin. It is clear that many paddy fields and the channels are not spatially connected and that the spectral reflectances of many water bodies are different. The pixel scale maps outputted from NDWI_OTSU, MNDWI_OTSU, SVM, UNet, and the sub-pixel D_PSA and DE_PSA maps contain jagged water–land boundaries. The D_MRF and DE_MRF maps contain water bodies with more smoothed boundaries. In D_MRF, many paddy fields were mapped to be spatially connected, such as those highlighted with red circles in zoomed-in areas B and C, whereas the water bodies were better mapped in the DE_MRF results. This result reveals that using both morphological dilation and erosion operations in the MRF-based SPM could reduce the over-smoothing of water pixels. Similar results were obtained for river water bodies in zoomed-in area D in Figure 7. D_MRF over-smoothed the water bodies, which are highlighted with the red circle in zoomed-in area D, whereas DE_MRF could map the small bridge over the river.

4.2. Quantitative Comparison of the Results

Table 2 presents the quantitative assessment results of different methods using the 6000 sample points that are randomly selected in the image as highlighted with yellow points in Figure 5. UNet generated higher overall accuracy and critical success index value than the other three hard classifications of NMWI_OTSU, MNDWI_OTSU, and SVM, showing the advantage of the UNet in extracting the deep semantic information for water bodies. Among all of the methods, the proposed DE_MRF generated the highest overall accuracy and the highest critical success index value for the water class. All the methods generated an overall accuracy value higher than 98% and a critical success index value higher than 0.96. The main reason for the high water mapping accuracy is mainly because many water samples were distributed in large lakes with a homogeneous land cover landscape, and the accuracies were assessed for binary maps with only water and land in them. It should be noted that, although UNet generated similar accuracy as the SPM algorithms, it cannot predict sub-pixel water distribution and, therefore, outputted a jagged water-land boundary, as shown in Figure 8.
Table 3 presents the quantitative assessment results of different SPM methods in the mixed pixels using the 8000 sample points that are selected near the water–land boundaries highlighted with green points in Figure 5. In general, all of the SPM methods have lower accuracy in Table 3 than in Table 2, because the samples used for validation in Table 3 were mostly distributed in heterogeneous land cover regions. The overall accuracy for the DE_PSA is higher than that of D_PSA, and the overall accuracy for DE_MRF is higher than that of D_MRF. This finding indicates that using a combination of morphological dilation and erosion operations can improve the overall accuracy more than using only the dilation operation in surface water mapping. D_PSA and D_MRF generated high omission errors in land and high commission errors in water, as presented in Table 2. This is because D_PSA and D_MRF only use the morphological dilation operation, and the mixed pixels, such as those highlighted in light green in Figure 2d, are all predicted as pure water pixels, resulting in an overestimation of water pixels and an underestimation of land pixels. In contrast, DE_PSA and DE_MRF profoundly reduced the omission error rate of land and the commission error rate of water. D_MRF generated the lowest omission error for water and the lowest commission error for land, whereas the proposed DE_MRF generated the lowest omission error for land and the lowest commission error rate for water. Both the omission and commission error rates of water and land classes are lower than 20% in the detected mixed pixels for the proposed DE_MRF, indicating the proposed method’s superior ability to map sub-pixel surface water bodies. Furthermore, both DE_PSA and DE_MRF generated the highest critical success index, and DE_MRF generated the highest overall accuracy among the comparators.

5. Discussion

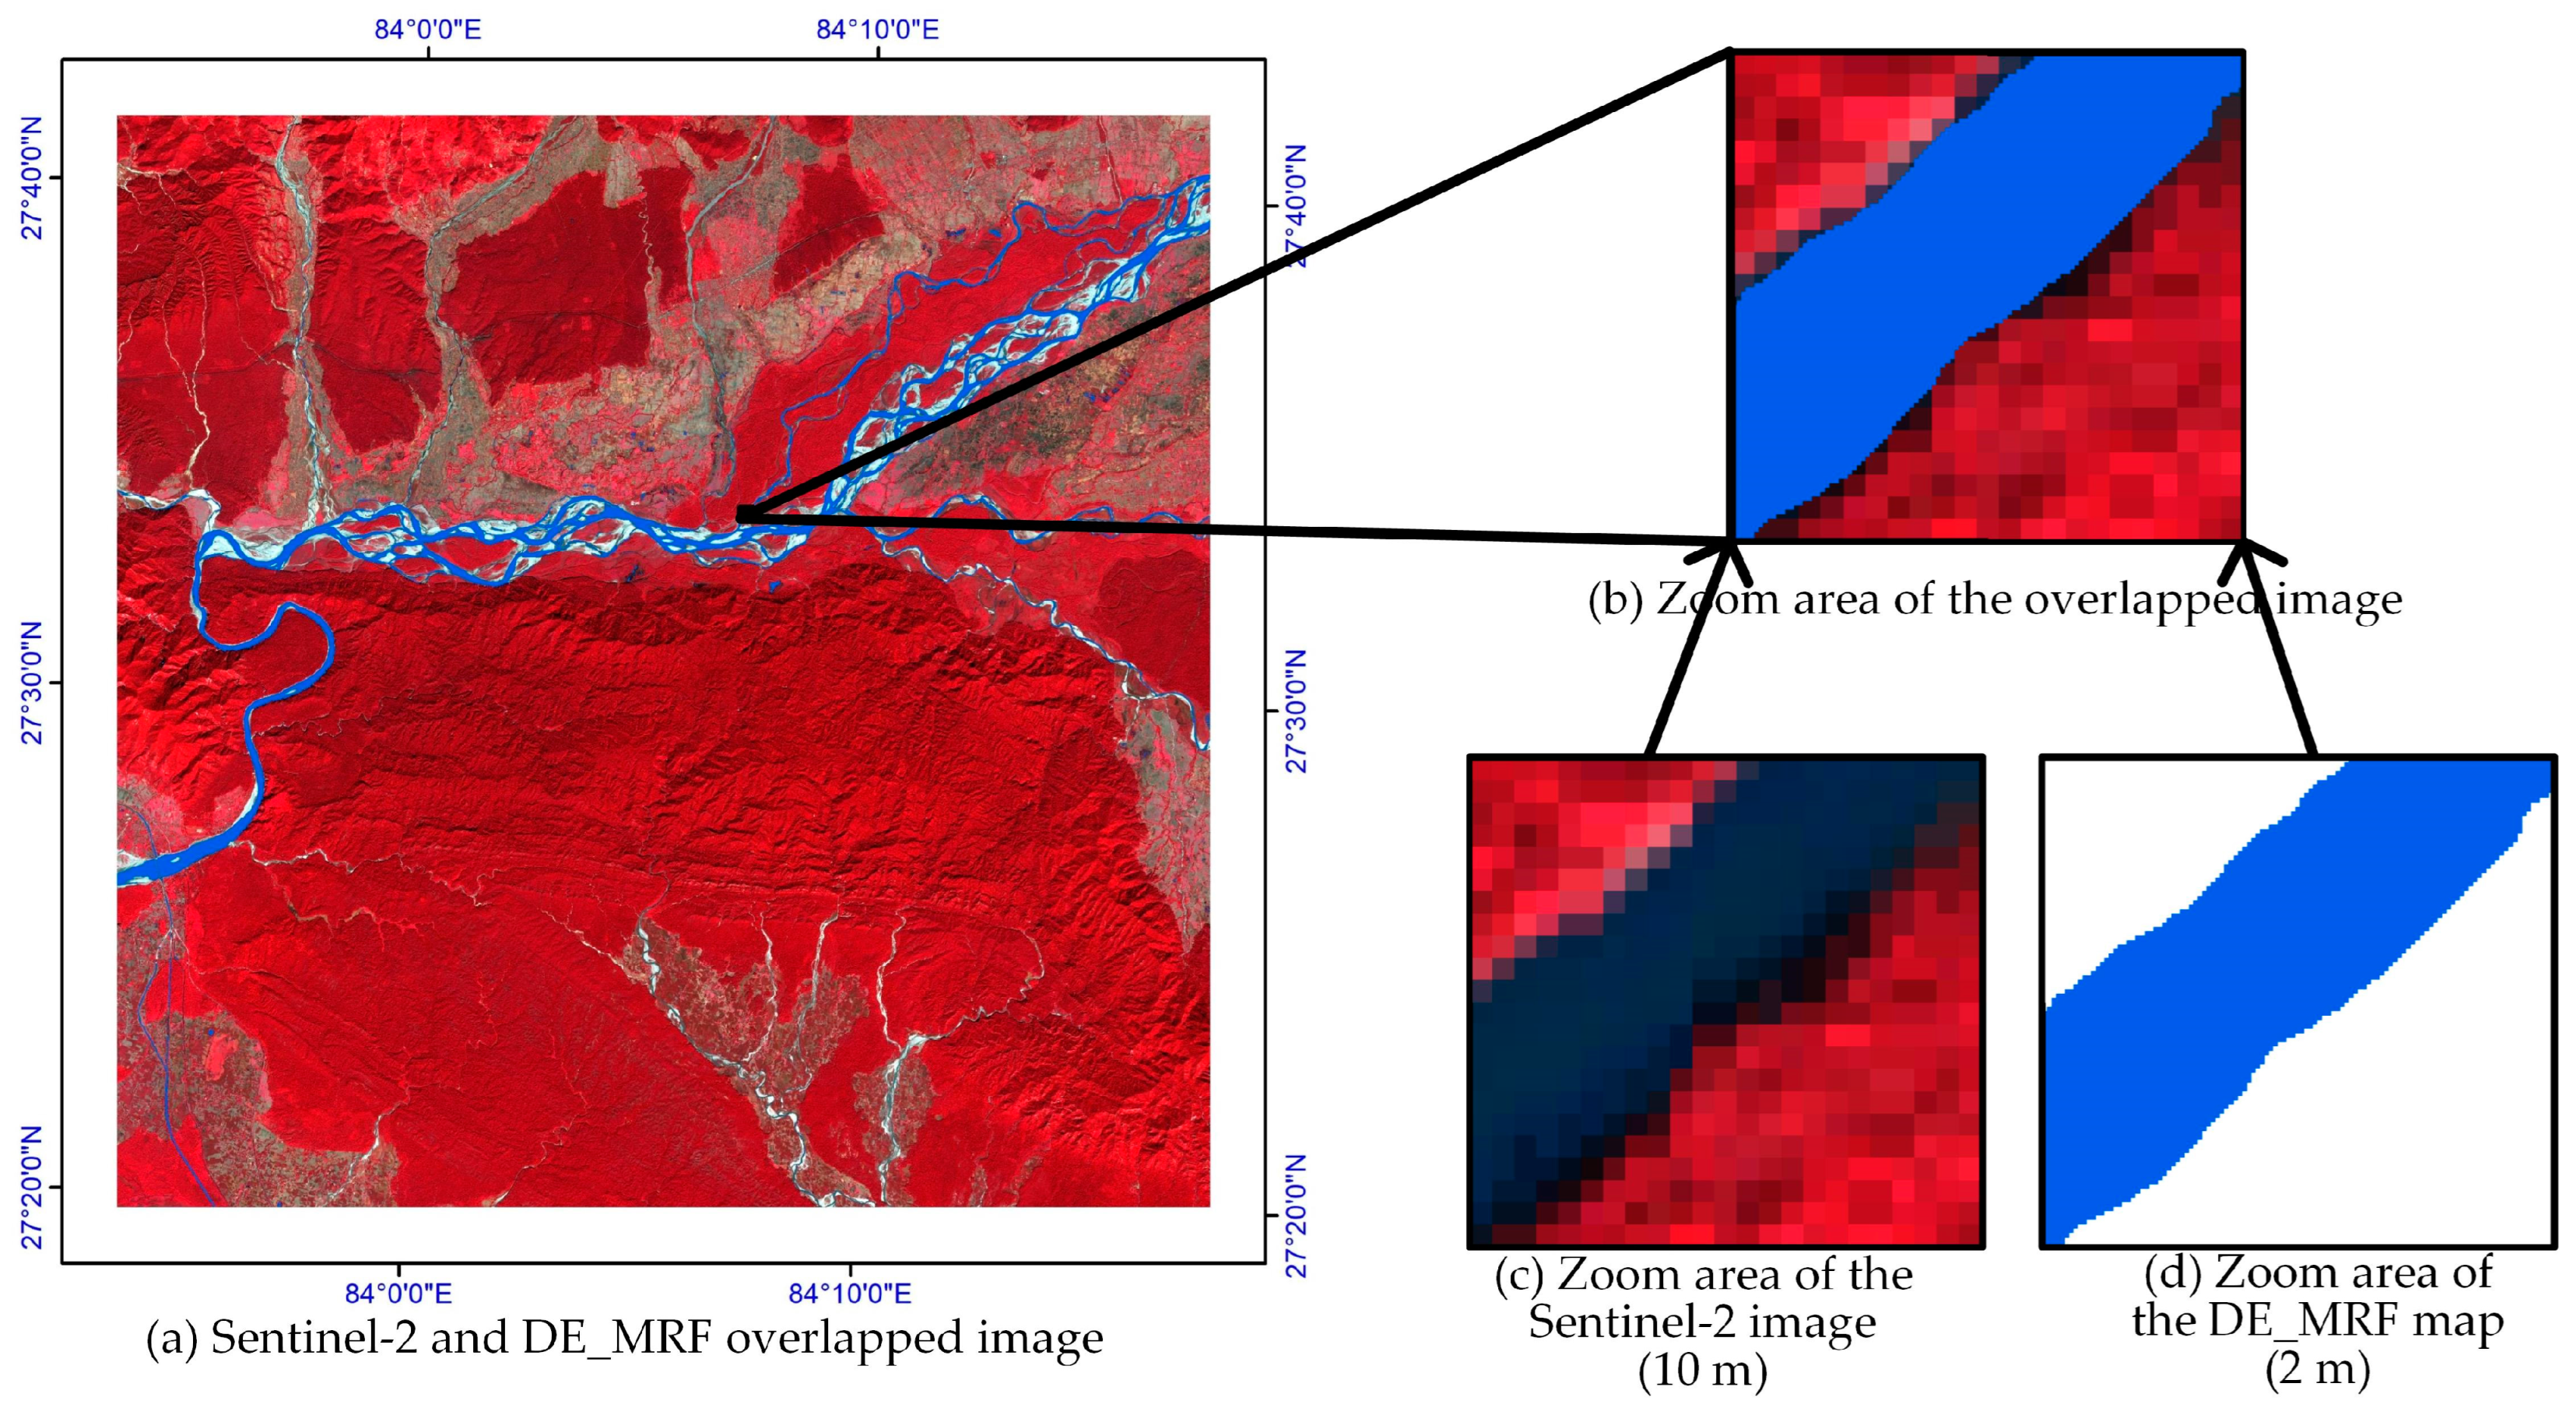
To assess the proposed method for different water bodies in different parts of the world, the DE_MRF was also used in mapping sub-pixel surface water in the Dangara region of Guinea, which borders the Atlantic Ocean to the west (Figure 9), and the Terai region in Nepal in South Asia (Figure 10). The acquisition dates of the Sentinel-2 image are 21 April 2022 for the Dangara region in Guinea, and 11 November 2020 for the Terai region in Nepal. The Sentinel-2 images were processed using the same method that was adopted in the Jinshui Basin region. DE_MRF was performed in the two regions, and the produced 2 m resolution surface water maps were overlapped with the Sentinel-2 imagery as shown in Figure 9 and Figure 10. In the zoomed-in areas, the 10 m Sentinel-2 image is relatively coarse to represent the water–land boundary in Figure 9c and Figure 10c. In contrast, DE_MRF produced a 2 m resolution surface water map, and the waterlines were smoothed according to the sub-pixel mapping result in Figure 9d and Figure 10d. Considering the ability to map surface water within the Sentinel-2 pixel, the proposed DE_MRF has great potential in mapping surface waterbodies at a finer spatial resolution than the input multispectral Sentinel-2 imagery.
This study proposed a surface water mapping model to predict a 2 m surface water map from Sentinel-2 images on the basis of combined morphological dilation and erosion operations and an MRF-based SPM algorithm. The results suggested that DE_MRF improves surface water mapping when compared with previously proposed methods. Compared with the pixel-based classification that produces a 10 m resolution binary surface water map from Sentinel-2 and thus suffers from the mixed-pixel problem, the proposed method can map a 2 m resolution surface water map from Sentinel-2 to reduce the impact of the mixed pixel to a great extent. Compared with the current SPM algorithms, the improvements result from the combination of morphological dilation and erosion operations in detecting the mixed pixels, and the use of local endmembers and MRF-based SPM in determining the sub-pixel water body distribution within the mixed pixel. The advantage of the proposed DE_MRF compared with other SPM methods is evident both visually and quantitatively. The potential impact factors for the proposed method are discussed as follows.
In the proposed method, spectral unmixing and SPM are applied to the mixed pixels detected by applying the morphological operations to the initial surface water map. Therefore, the error in generating the initial surface water map may be propagated in the following mixed-pixel detection, spectral unmixing, and SPM. In this study, the initial surface water map is generated by applying edge-guided OTSU segmentation to the NDWI image. The reason for using NDWI in this study is because NDWI is calculated from the 10 m green and VNIR bands in the Sentinel-2 image. If the study area is located in a region where there are many shadows from buildings, it is helpful to incorporate other water indices, such as MNDWI and AWEI, to further improve the water segmentation in shadow and dark surface regions. In addition, the edge-guided OTSU is applied to the single NDWI water index in this study. Previous studies have indicated that using multiple water indices may produce a more accurate surface water map compared to using a single water index from Landsat images (i.e., different water indices are calculated from bands of the same 30 m spatial resolution) [92,93]. Future studies could focus on using multiple water indices calculated from Sentinel-2 bands with different spatial resolutions in producing the initial surface water map. Finally, the water index thresholding approach is adopted in producing the initial surface water map for its automation without using any prior information and simplicity. If prior knowledge about the endmembers or water label training samples is available, supervised methods such as random forest and deep learning can be adopted to enhance the accuracy in mapping the binary surface water map.
On the basis of the detected mixed pixels according to the water index thresholding method and the morphological operations, the proposed DE_MRF applied optimization algorithms in the spectral unmixing and SPM to the mixed pixels. In particular, the FCLS is used in spectral unmixing, and the SA is used in the SPM. FCLS and SA, which can predict sub-pixel information accurately, are used in this study but are relatively time-consuming. Further research could focus on using fast algorithms, such as partial unmixing algorithms [40] in spectral unmixing, and iterated conditional modes [94] in the SPM, to accelerate the process of the model in large-scale surface water mapping.
The proposed DE_MRF is mainly used to map wall-to-wall water bodies at a finer spatial resolution than the input Sentinel-2 imagery. Considering that the resultant surface water maps have more spatial details than those extracted at the pixel scale, it is promising to further extract water body information from the resulting sub-pixel water map. For example, it is favorable to extract sub-pixel river net to further calculate river width at the pixel scale [73], and it is helpful to extract the small ponds by using SPM to reduce the mixed-pixel problem in current limnology studies [3,11,40].

6. Conclusions

Sub-pixel mapping is effective in reducing the impact of the mixed-pixel problem in mapping surface water at the sub-pixel scale. This study proposed DE_MRF, a sub-pixel surface water mapping method, to map a 2 m resolution sub-pixel surface water map from Sentinel-2 images in the Jinshui Basin, China. Moreover, DE_MRF was compared with several SPM methods; the results suggested that DE_MRF generated the lowest commission error rate for water and the lowest omission error rate for land, and, therefore, had the highest overall accuracy.
Several findings were identified through the experimental results. The sub-pixel surface water mapping that applies only the morphological dilation operation to detect Sentinel-2 water pixels could result in a large commission error rate for the water class because many of the detected water pixels may be mixed. Incorporating the morphological erosion operation enabled the selection of more potential mixed pixels at the water–land boundaries used for spectral unmixing and SPM. Experimental results suggested that DE_MRF using both dilation and erosion operations generated the lowest commission error rate for water pixels. Moreover, compared with previously proposed methods that simply averaged the water (or land) pixel spectra when selecting local endmembers in the local window, the proposed method considered the intra-class spectral variability and was more suitable for mapping different water bodies that were distinctive in spectral reflectance in heterogeneous regions. Finally, the use of the MRF-based SPM algorithm could smooth the jagged boundaries that were present in maps from the PSA-based SPM algorithms and could reduce the propagation of spectral unmixing error in the final sub-pixel surface water map to a great extent. In summary, DE_MRF was found to be a simple and effective method to map sub-pixel surface water from Sentinel-2 imagery, which helps to monitor surface water resources in heterogeneous regions.

Supplementary Materials

The following supporting information can be downloaded at: https://www.mdpi.com/article/10.3390/w15081446/s1. Section S1: The estimation of fine resolution surface water map based on the MRF.

Author Contributions

L.J., C.Z. and X.L. conceived the main idea. L.J. provided data source, software, and validation. X.L. provided methodology. L.J. and X.L. both wrote the paper and provided the funding. All authors have read and agreed to the published version of the manuscript.

Funding

This research was funded by the key scientific research projects of water conservancy in Hubei Province, China (grant number HBSLKY202103), the water conservancy preliminary research and consultation project for Hubei Water Resources Research Institute (420000-2023-218-006-001), the International Science and Technology Cooperation Project from Hubei Province, China (2022EHB018), the Science and Technology Partnership Program, Ministry of Science and Technology of China (grant number KY201802007), the Key Research and Development Project of Hubei Province, China (2020BCA074), the Application Foundation Frontier project of Wuhan (grant number 2020020601012283), and Young Top-notch Talent Cultivation Program of Hubei Province.

Data Availability Statement

The data presented in this study are available on request from the corresponding author.

Conflicts of Interest

The authors declare no conflict of interest.

References

  1. Alsdorf, D.E.; Rodríguez, E.; Lettenmaier, D.P. Measuring surface water from space. Rev. Geophys. 2007, 45. [Google Scholar] [CrossRef]
  2. Perin, V.; Roy, S.; Kington, J.; Harris, T.; Tulbure, M.G.; Stone, N.; Barsballe, T.; Reba, M.; Yaeger, M.A. Monitoring Small Water Bodies Using High Spatial and Temporal Resolution Analysis Ready Datasets. Remote Sens. 2021, 13, 5176. [Google Scholar] [CrossRef]
  3. Perin, V.; Tulbure, M.G.; Gaines, M.D.; Reba, M.L.; Yaeger, M.A. A multi-sensor satellite imagery approach to monitor on-farm reservoirs. Remote Sens. Environ. 2022, 270, 112796. [Google Scholar] [CrossRef]
  4. Polishchuk, Y.; Bogdanov, A.; Muratov, I.; Polishchuk, V.; Lim, A.; Manasypov, R.; Shirokova, L.; Pokrovsky, O. Minor contribution of small thaw ponds to the pools of carbon and methane in the inland waters of the permafrost-affected part of the Western Siberian Lowland. Environ. Res. Lett. 2018, 13, 045002. [Google Scholar] [CrossRef] [Green Version]
  5. Khandelwal, A.; Karpatne, A.; Marlier, M.E.; Kim, J.; Lettenmaier, D.P.; Kumar, V. An approach for global monitoring of surface water extent variations in reservoirs using MODIS data. Remote Sens. Environ. 2017, 202, 113–128. [Google Scholar] [CrossRef]
  6. Ji, L.; Gong, P.; Wang, J.; Shi, J.; Zhu, Z. Construction of the 500-m resolution daily global surface water change database (2001–2016). Water Resour. Res. 2018, 54, 10,270–10,292. [Google Scholar] [CrossRef] [Green Version]
  7. Li, X.; Foody, G.M.; Boyd, D.S.; Ge, Y.; Zhang, Y.; Du, Y.; Ling, F. SFSDAF: An enhanced FSDAF that incorporates sub-pixel class fraction change information for spatio-temporal image fusion. Remote Sens. Environ. 2020, 237, 111537. [Google Scholar] [CrossRef]
  8. Xiao, D.; Niu, H.; Guo, F.; Zhao, S.; Fan, L. Monitoring irrigation dynamics in paddy fields using spatiotemporal fusion of Sentinel-2 and MODIS. Agric. Water Manag. 2022, 263, 107409. [Google Scholar] [CrossRef]
  9. Zhou, Y.; Dong, J.; Xiao, X.; Xiao, T.; Yang, Z.; Zhao, G.; Zou, Z.; Qin, Y. Open surface water mapping algorithms: A comparison of water-related spectral indices and sensors. Water 2017, 9, 256. [Google Scholar] [CrossRef]
  10. Pena-Regueiro, J.; Sebastia-Frasquet, M.-T.; Estornell, J.; Aguilar-Maldonado, J.A. Sentinel-2 application to the surface characterization of small water bodies in Wetlands. Water 2020, 12, 1487. [Google Scholar] [CrossRef]
  11. Wang, Y.; Li, X.; Zhou, P.; Jiang, L.; Du, Y. AHSWFM: Automated and hierarchical surface water fraction mapping for small water bodies using sentinel-2 images. Remote Sens. 2022, 14, 1615. [Google Scholar] [CrossRef]
  12. Caballero, I.; Ruiz, J.; Navarro, G. Sentinel-2 satellites provide near-real time evaluation of catastrophic floods in the west mediterranean. Water 2019, 11, 2499. [Google Scholar] [CrossRef] [Green Version]
  13. Balenzano, A.; Satalino, G.; Lovergine, F.P.; D’Addabbo, A.; Palmisano, D.; Grassi, R.; Ozalp, O.; Mattia, F.; Nafría García, D.; Paredes Gómez, V. Sentinel-1 and Sentinel-2 Data to Detect Irrigation Events: Riaza Irrigation District (Spain) Case Study. Water 2022, 14, 3046. [Google Scholar] [CrossRef]
  14. Du, Y.; Zhang, Y.; Ling, F.; Wang, Q.; Li, W.; Li, X. Water bodies’ mapping from Sentinel-2 imagery with modified normalized difference water index at 10-m spatial resolution produced by sharpening the SWIR band. Remote Sens. 2016, 8, 354. [Google Scholar] [CrossRef] [Green Version]
  15. Li, H.; Zech, J.; Ludwig, C.; Fendrich, S.; Shapiro, A.; Schultz, M.; Zipf, A. Automatic mapping of national surface water with OpenStreetMap and Sentinel-2 MSI data using deep learning. Int. J. Appl. Earth Obs. 2021, 104, 102571. [Google Scholar] [CrossRef]
  16. Jiang, W.; Ni, Y.; Pang, Z.; Li, X.; Ju, H.; He, G.; Lv, J.; Yang, K.; Fu, J.; Qin, X. An effective water body extraction method with new water index for sentinel-2 imagery. Water 2021, 13, 1647. [Google Scholar] [CrossRef]
  17. Gašparović, M.; Singh, S.K. Urban surface water bodies mapping using the automatic k-means based approach and sentinel-2 imagery. Geocarto Int. 2022, 2148757. [Google Scholar] [CrossRef]
  18. Jiang, Z.; Wen, Y.; Zhang, G.; Wu, X. Water Information Extraction Based on Multi-Model RF Algorithm and Sentinel-2 Image Data. Sustainability 2022, 14, 3797. [Google Scholar] [CrossRef]
  19. Xue, Y.; Qin, C.; Wu, B.; Li, D.; Fu, X. Automatic Extraction of Mountain River Surface and Width Based on Multisource High-Resolution Satellite Images. Remote Sens. 2022, 14, 2370. [Google Scholar] [CrossRef]
  20. Cordeiro, M.C.; Martinez, J.-M.; Peña-Luque, S. Automatic water detection from multidimensional hierarchical clustering for Sentinel-2 images and a comparison with Level 2A processors. Remote Sens. Environ. 2021, 253, 112209. [Google Scholar] [CrossRef]
  21. Ren, J.; Lee, S.D.; Chen, X.; Kao, B.; Cheng, R.; Cheung, D. Naive bayes classification of uncertain data. In Proceedings of the 2009 Ninth IEEE International Conference on Data Mining, Miami Beach, FL, USA, 6–9 December 2009; pp. 944–949. [Google Scholar]
  22. Yang, X.; Qin, Q.; Yésou, H.; Ledauphin, T.; Koehl, M.; Grussenmeyer, P.; Zhu, Z. Monthly estimation of the surface water extent in France at a 10-m resolution using Sentinel-2 data. Remote Sens. Environ. 2020, 244, 111803. [Google Scholar] [CrossRef]
  23. Yang, X.; Zhao, S.; Qin, X.; Zhao, N.; Liang, L. Mapping of urban surface water bodies from Sentinel-2 MSI imagery at 10 m resolution via NDWI-based image sharpening. Remote Sens. 2017, 9, 596. [Google Scholar] [CrossRef] [Green Version]
  24. Zhou, P.; Li, X.; Foody, G.M.; Boyd, D.S.; Wang, X.; Ling, F.; Zhang, Y.; Wang, Y.; Du, Y. Deep Feature and Domain Knowledge Fusion Network for Mapping Surface Water Bodies by Fusing Google Earth RGB and Sentinel-2 images. IEEE Geosci. Remote Sens. 2023, 20, 6001805. [Google Scholar] [CrossRef]
  25. Parajuli, J.; Fernandez-Beltran, R.; Kang, J.; Pla, F. Attentional dense convolutional neural network for water body extraction from sentinel-2 images. IEEE J. Sel. Top. Appl. 2022, 15, 6804–6816. [Google Scholar] [CrossRef]
  26. Bai, Y.; Wu, W.; Yang, Z.; Yu, J.; Zhao, B.; Liu, X.; Yang, H.; Mas, E.; Koshimura, S. Enhancement of detecting permanent water and temporary water in flood disasters by fusing sentinel-1 and sentinel-2 imagery using deep learning algorithms: Demonstration of sen1floods11 benchmark datasets. Remote Sens. 2021, 13, 2220. [Google Scholar] [CrossRef]
  27. Li, Y.; Dang, B.; Zhang, Y.; Du, Z. Water body classification from high-resolution optical remote sensing imagery: Achievements and perspectives. ISPRS J. Photogramm. 2022, 187, 306–327. [Google Scholar] [CrossRef]
  28. Li, J.; Peng, B.; Wei, Y.; Ye, H. Accurate extraction of surface water in complex environment based on Google Earth Engine and Sentinel-2. PLoS ONE 2021, 16, e0253209. [Google Scholar] [CrossRef]
  29. Yang, X.; Qin, Q.; Grussenmeyer, P.; Koehl, M. Urban surface water body detection with suppressed built-up noise based on water indices from Sentinel-2 MSI imagery. Remote Sens. Environ. 2018, 219, 259–270. [Google Scholar] [CrossRef]
  30. Liu, H.; Hu, H.; Liu, X.; Jiang, H.; Liu, W.; Yin, X. A Comparison of Different Water Indices and Band Downscaling Methods for Water Bodies Mapping from Sentinel-2 Imagery at 10-m Resolution. Water 2022, 14, 2696. [Google Scholar] [CrossRef]
  31. Yue, H.; Li, Y.; Qian, J.; Liu, Y. A new accuracy evaluation method for water body extraction. Int. J. Remote Sens. 2020, 41, 7311–7342. [Google Scholar] [CrossRef]
  32. McFeeters, S.K. The use of the Normalized Difference Water Index (NDWI) in the delineation of open water features. Int. J. Remote Sens. 1996, 17, 1425–1432. [Google Scholar] [CrossRef]
  33. Xu, H. Modification of normalised difference water index (NDWI) to enhance open water features in remotely sensed imagery. Int. J. Remote Sens. 2006, 27, 3025–3033. [Google Scholar] [CrossRef]
  34. Feyisa, G.L.; Meilby, H.; Fensholt, R.; Proud, S.R. Automated Water Extraction Index: A new technique for surface water mapping using Landsat imagery. Remote Sens. Environ. 2014, 140, 23–35. [Google Scholar] [CrossRef]
  35. Fisher, A.; Flood, N.; Danaher, T. Comparing Landsat water index methods for automated water classification in eastern Australia. Remote Sens. Environ. 2016, 175, 167–182. [Google Scholar] [CrossRef]
  36. Li, W.; Zhang, X.; Ling, F.; Zheng, D. Locally adaptive super-resolution waterline mapping with MODIS imagery. Remote Sens. Lett. 2016, 7, 1121–1130. [Google Scholar] [CrossRef]
  37. Li, X.; Ling, F.; Foody, G.M.; Boyd, D.S.; Jiang, L.; Zhang, Y.; Zhou, P.; Wang, Y.; Chen, R.; Du, Y. Monitoring high spatiotemporal water dynamics by fusing MODIS, Landsat, water occurrence data and DEM. Remote Sens. Environ. 2021, 265, 112680. [Google Scholar] [CrossRef]
  38. Muad, A.M.; Foody, G.M. Super-resolution mapping of lakes from imagery with a coarse spatial and fine temporal resolution. Int. J. Appl. Earth Obs. 2012, 15, 79–91. [Google Scholar] [CrossRef]
  39. Xie, H.; Luo, X.; Xu, X.; Pan, H.; Tong, X. Automated Subpixel Surface Water Mapping from Heterogeneous Urban Environments Using Landsat 8 OLI Imagery. Remote Sens. 2016, 8, 584. [Google Scholar] [CrossRef] [Green Version]
  40. Jarchow, C.J.; Sigafus, B.H.; Muths, E.; Hossack, B.R. Using full and partial unmixing algorithms to estimate the inundation extent of small, isolated stock ponds in an arid landscape. Wetlands 2020, 40, 563–575. [Google Scholar] [CrossRef]
  41. Li, X.; Ling, F.; Foody, G.M.; Ge, Y.; Zhang, Y.; Du, Y. Generating a series of fine spatial and temporal resolution land cover maps by fusing coarse spatial resolution remotely sensed images and fine spatial resolution land cover maps. Remote Sens. Environ. 2017, 196, 293–311. [Google Scholar] [CrossRef]
  42. Thornton, M.W.; Atkinson, P.M.; Holland, D. Sub-pixel mapping of rural land cover objects from fine spatial resolution satellite sensor imagery using super-resolution pixel-swapping. Int. J. Remote Sens. 2006, 27, 473–491. [Google Scholar] [CrossRef]
  43. Wang, L.; Wang, Q. Subpixel mapping using Markov random field with multiple spectral constraints from subpixel shifted remote sensing images. IEEE Geosci. Remote Sens. 2012, 10, 598–602. [Google Scholar] [CrossRef]
  44. Kasetkasem, T.; Arora, M.K.; Varshney, P.K. Super-resolution land cover mapping using a Markov random field based approach. Remote Sens. Environ. 2005, 96, 302–314. [Google Scholar] [CrossRef]
  45. Tatem, A.J.; Lewis, H.G.; Atkinson, P.M.; Nixon, M.S. Super-resolution land cover pattern prediction using a Hopfield neural network. Remote Sens. Environ. 2002, 79, 1–14. [Google Scholar] [CrossRef] [Green Version]
  46. Li, X.; Ling, F.; Du, Y.; Feng, Q.; Zhang, Y. A spatial–temporal Hopfield neural network approach for super-resolution land cover mapping with multi-temporal different resolution remotely sensed images. ISPRS J. Photogramm. 2014, 93, 76–87. [Google Scholar] [CrossRef]
  47. Wang, Q.; Shi, W.; Atkinson, P.M.; Li, Z. Land cover change detection at subpixel resolution with a Hopfield neural network. IEEE J. Sel. Top. Appl. 2014, 8, 1339–1352. [Google Scholar] [CrossRef]
  48. Wang, Q.; Atkinson, P.M. The effect of the point spread function on sub-pixel mapping. Remote Sens. Environ. 2017, 193, 127–137. [Google Scholar] [CrossRef] [Green Version]
  49. Wang, P.; Wang, L.; Chanussot, J. Soft-then-hard subpixel land cover mapping based on spatial-spectral interpolation. IEEE Geosci. Remote Sens. Lett. 2016, 13, 1851–1854. [Google Scholar] [CrossRef]
  50. Wang, P.; Wang, L.; Dalla Mura, M.; Chanussot, J. Using multiple subpixel shifted images with spatial–spectral information in soft-then-hard subpixel mapping. IEEE J. Sel. Top. Appl. Earth Obs. Remote Sens. 2017, 10, 2950–2959. [Google Scholar] [CrossRef]
  51. Chen, Y.; Ge, Y.; Wang, Q.; Jiang, Y. A subpixel mapping algorithm combining pixel-level and subpixel-level spatial dependences with binary integer programming. Remote Sens. Lett. 2014, 5, 902–911. [Google Scholar] [CrossRef]
  52. Mertens, K.C.; De Baets, B.; Verbeke, L.P.; De Wulf, R.R. A sub-pixel mapping algorithm based on sub-pixel/pixel spatial attraction models. Int. J. Remote Sens. 2006, 27, 3293–3310. [Google Scholar] [CrossRef]
  53. Xu, X.; Zhong, Y.; Zhang, L.; Zhang, H. Sub-pixel mapping based on a MAP model with multiple shifted hyperspectral imagery. IEEE J. Sel. Top. Appl. 2012, 6, 580–593. [Google Scholar] [CrossRef]
  54. Ge, Y.; Li, S.; Lakhan, V.C. Development and testing of a subpixel mapping algorithm. IEEE Trans. Geosci. Remote Sens. 2009, 47, 2155–2164. [Google Scholar]
  55. Zhong, Y.; Zhang, L. Remote sensing image subpixel mapping based on adaptive differential evolution. IEEE Trans. Syst. Man Cybern. Part B (Cybern.) 2012, 42, 1306–1329. [Google Scholar] [CrossRef]
  56. Wang, Q.; Shi, W.; Atkinson, P.M. Sub-pixel mapping of remote sensing images based on radial basis function interpolation. ISPRS J. Photogramm. 2014, 92, 1–15. [Google Scholar] [CrossRef]
  57. He, D.; Zhong, Y.; Wang, X.; Zhang, L. Deep convolutional neural network framework for subpixel mapping. IEEE Trans. Geosci. Remote Sens. 2020, 59, 9518–9539. [Google Scholar] [CrossRef]
  58. Ling, F.; Foody, G.M. Super-resolution land cover mapping by deep learning. Remote Sens. Lett. 2019, 10, 598–606. [Google Scholar] [CrossRef]
  59. Zhang, Y.; Ling, F.; Wang, X.; Foody, G.M.; Boyd, D.S.; Li, X.; Du, Y.; Atkinson, P.M. Tracking small-scale tropical forest disturbances: Fusing the Landsat and Sentinel-2 data record. Remote Sens. Environ. 2021, 261, 112470. [Google Scholar] [CrossRef]
  60. Zhang, Y.; Ling, F.; Foody, G.M.; Ge, Y.; Boyd, D.S.; Li, X.; Du, Y.; Atkinson, P.M. Mapping annual forest cover by fusing PALSAR/PALSAR-2 and MODIS NDVI during 2007–2016. Remote Sens. Environ. 2019, 224, 74–91. [Google Scholar] [CrossRef] [Green Version]
  61. Xiong, L.; Deng, R.; Li, J.; Liu, X.; Qin, Y.; Liang, Y.; Liu, Y. Subpixel surface water extraction (SSWE) using Landsat 8 OLI data. Water 2018, 10, 653. [Google Scholar] [CrossRef] [Green Version]
  62. Chen, R.; Li, X.; Zhang, Y.; Zhou, P.; Wang, Y.; Shi, L.; Jiang, L.; Ling, F.; Du, Y. Spatiotemporal Continuous Impervious Surface Mapping by Fusion of Landsat Time Series Data and Google Earth Imagery. Remote Sens. 2021, 13, 2409. [Google Scholar] [CrossRef]
  63. Wang, X.; Ling, F.; Yao, H.; Liu, Y.; Xu, S. Unsupervised sub-pixel water body mapping with Sentinel-3 OLCI image. Remote Sens. 2019, 11, 327. [Google Scholar] [CrossRef] [Green Version]
  64. Foody, G.M.; Muslim, A.M.; Atkinson, P.M. Super-resolution mapping of the waterline from remotely sensed data. Int. J. Remote Sens. 2005, 26, 5381–5392. [Google Scholar] [CrossRef]
  65. Ling, F.; Xiao, F.; Du, Y.; Xue, H.; Ren, X. Waterline mapping at the subpixel scale from remote sensing imagery with high-resolution digital elevation models. Int. J. Remote Sens. 2008, 29, 1809–1815. [Google Scholar] [CrossRef]
  66. Huang, C.; Chen, Y.; Wu, J. DEM-based modification of pixel-swapping algorithm for enhancing floodplain inundation mapping. Int. J. Remote Sens. 2014, 35, 365–381. [Google Scholar] [CrossRef]
  67. Giraldo Osorio, J.D.; García, G.; Galiano, S. Development of a sub-pixel analysis method applied to dynamic monitoring of floods. Int. J. Remote Sens. 2012, 33, 2277–2295. [Google Scholar] [CrossRef]
  68. Li, L.; Chen, Y.; Yu, X.; Liu, R.; Huang, C. Sub-pixel flood inundation mapping from multispectral remotely sensed images based on discrete particle swarm optimization. ISPRS J. Photogramm. 2015, 101, 10–21. [Google Scholar] [CrossRef]
  69. Li, L.; Chen, Y.; Xu, T.; Meng, L.; Huang, C.; Shi, K. Spatial attraction models coupled with Elman neural networks for enhancing sub-pixel urban inundation mapping. Remote Sens. 2020, 12, 2068. [Google Scholar] [CrossRef]
  70. Liu, X.; Deng, R.; Xu, J.; Zhang, F. Coupling the modified linear spectral mixture analysis and pixel-swapping methods for improving subpixel water mapping: Application to the Pearl River Delta, China. Water 2017, 9, 658. [Google Scholar] [CrossRef] [Green Version]
  71. Li, L.; Chen, Y.; Xu, T.; Huang, C.; Liu, R.; Shi, K. Integration of Bayesian regulation back-propagation neural network and particle swarm optimization for enhancing sub-pixel mapping of flood inundation in river basins. Remote Sens. Lett. 2016, 7, 631–640. [Google Scholar] [CrossRef] [Green Version]
  72. Yin, Z.; Ling, F.; Li, X.; Cai, X.; Chi, H.; Li, X.; Wang, L.; Zhang, Y.; Du, Y. A Cascaded Spectral–Spatial CNN Model for Super-Resolution River Mapping with MODIS Imagery. IEEE Trans. Geosci. Remote Sens. 2021, 60, 1–13. [Google Scholar] [CrossRef]
  73. Ling, F.; Boyd, D.; Ge, Y.; Foody, G.M.; Li, X.; Wang, L.; Zhang, Y.; Shi, L.; Shang, C.; Li, X. Measuring river wetted width from remotely sensed imagery at the subpixel scale with a deep convolutional neural network. Water Resour. Res. 2019, 55, 5631–5649. [Google Scholar] [CrossRef]
  74. Ma, B.; Wu, L.; Zhang, X.; Li, X.; Liu, Y.; Wang, S. Locally adaptive unmixing method for lake-water area extraction based on MODIS 250 m bands. Int. J. Appl. Earth Obs. 2014, 33, 109–118. [Google Scholar] [CrossRef]
  75. Liu, C.; Shi, J.; Liu, X.; Shi, Z.; Zhu, J. Subpixel Mapping of Surface Water in the Tibetan Plateau with MODIS Data. Remote Sens. 2020, 12, 1154. [Google Scholar] [CrossRef] [Green Version]
  76. Li, X.; Chen, R.; Foody, G.M.; Wang, L.; Yang, X.; Du, Y.; Ling, F. Spatio-temporal sub-pixel land cover mapping of remote sensing imagery using spatial distribution information from same-class pixels. Remote Sens. 2020, 12, 503. [Google Scholar] [CrossRef] [Green Version]
  77. Atkinson, P.M. Issues of uncertainty in super-resolution mapping and their implications for the design of an inter-comparison study. Int. J. Remote Sens. 2009, 30, 5293–5308. [Google Scholar] [CrossRef]
  78. Ronneberger, O.; Fischer, P.; Brox, T. U-net: Convolutional networks for biomedical image segmentation. In Proceedings of the Medical Image Computing and Computer-Assisted Intervention–MICCAI 2015: 18th International Conference, Munich, Germany, 5–9 October 2015; pp. 234–241. [Google Scholar]
  79. Foody, G.M.; Mathur, A. Toward intelligent training of supervised image classifications: Directing training data acquisition for SVM classification. Remote Sens. Environ. 2004, 93, 107–117. [Google Scholar] [CrossRef]
  80. Wang, Q.; Shi, W.; Atkinson, P.M. Area-to-point regression kriging for pan-sharpening. ISPRS J. Photogramm. 2016, 114, 151–165. [Google Scholar] [CrossRef]
  81. Gao, B.-C. NDWI—A normalized difference water index for remote sensing of vegetation liquid water from space. Remote Sens. Environ. 1996, 58, 257–266. [Google Scholar] [CrossRef]
  82. Donchyts, G.; Schellekens, J.; Winsemius, H.; Eisemann, E.; Van de Giesen, N. A 30 m resolution surface water mask including estimation of positional and thematic differences using landsat 8, srtm and openstreetmap: A case study in the Murray-Darling Basin, Australia. Remote Sens. 2016, 8, 386. [Google Scholar] [CrossRef] [Green Version]
  83. Li, W.; Du, Z.; Ling, F.; Zhou, D.; Wang, H.; Gui, Y.; Sun, B.; Zhang, X. A comparison of land surface water mapping using the normalized difference water index from TM, ETM+ and ALI. Remote Sens. 2013, 5, 5530–5549. [Google Scholar] [CrossRef] [Green Version]
  84. Han, X.; Chen, X.; Feng, L. Four decades of winter wetland changes in Poyang Lake based on Landsat observations between 1973 and 2013. Remote Sens. Environ. 2015, 156, 426–437. [Google Scholar] [CrossRef]
  85. Nandi, I.; Srivastava, P.K.; Shah, K. Floodplain mapping through support vector machine and optical/infrared images from Landsat 8 OLI/TIRS sensors: Case study from Varanasi. Water Resour. Manag. 2017, 31, 1157–1171. [Google Scholar] [CrossRef]
  86. Makido, Y.; Shortridge, A. Weighting function alternatives for a subpixel allocation model. Photogramm. Eng. Remote Sens. 2007, 73, 1233–1240. [Google Scholar] [CrossRef]
  87. Liu, Q.; Huang, C.; Shi, Z.; Zhang, S. Probabilistic river water mapping from Landsat-8 using the support vector machine method. Remote Sens. 2020, 12, 1374. [Google Scholar] [CrossRef]
  88. Tulbure, M.G.; Broich, M.; Stehman, S.V.; Kommareddy, A. Surface water extent dynamics from three decades of seasonally continuous Landsat time series at subcontinental scale in a semi-arid region. Remote Sens. Environ. 2016, 178, 142–157. [Google Scholar] [CrossRef]
  89. Pekel, J.F.; Cottam, A.; Gorelick, N.; Belward, A.S. High-resolution mapping of global surface water and its long-term changes. Nature 2016, 540, 418–422. [Google Scholar] [CrossRef]
  90. Pickens, A.H.; Hansen, M.C.; Hancher, M.; Stehman, S.V.; Tyukavina, A.; Potapov, P.; Marroquin, B.; Sherani, Z. Mapping and sampling to characterize global inland water dynamics from 1999 to 2018 with full Landsat time-series. Remote Sens. Environ. 2020, 243, 111792. [Google Scholar] [CrossRef]
  91. Olofsson, P.; Foody, G.M.; Herold, M.; Stehman, S.V.; Woodcock, C.E.; Wulder, M.A. Good practices for estimating area and assessing accuracy of land change. Remote Sens. Environ. 2014, 148, 42–57. [Google Scholar] [CrossRef]
  92. Acharya, T.D.; Subedi, A.; Lee, D.H. Evaluation of water indices for surface water extraction in a Landsat 8 scene of Nepal. Sensors 2018, 18, 2580. [Google Scholar] [CrossRef] [Green Version]
  93. Guo, Q.; Pu, R.; Li, J.; Cheng, J. A weighted normalized difference water index for water extraction using Landsat imagery. Int. J. Remote Sens. 2017, 38, 5430–5445. [Google Scholar] [CrossRef]
  94. Kasetkasem, T. Markov Random Field Models. In Advanced Image Processing Techniques for Remotely Sensed Hyperspectral Data; Springer: Berlin/Heidelberg, Germany, 2004; pp. 159–178. [Google Scholar]
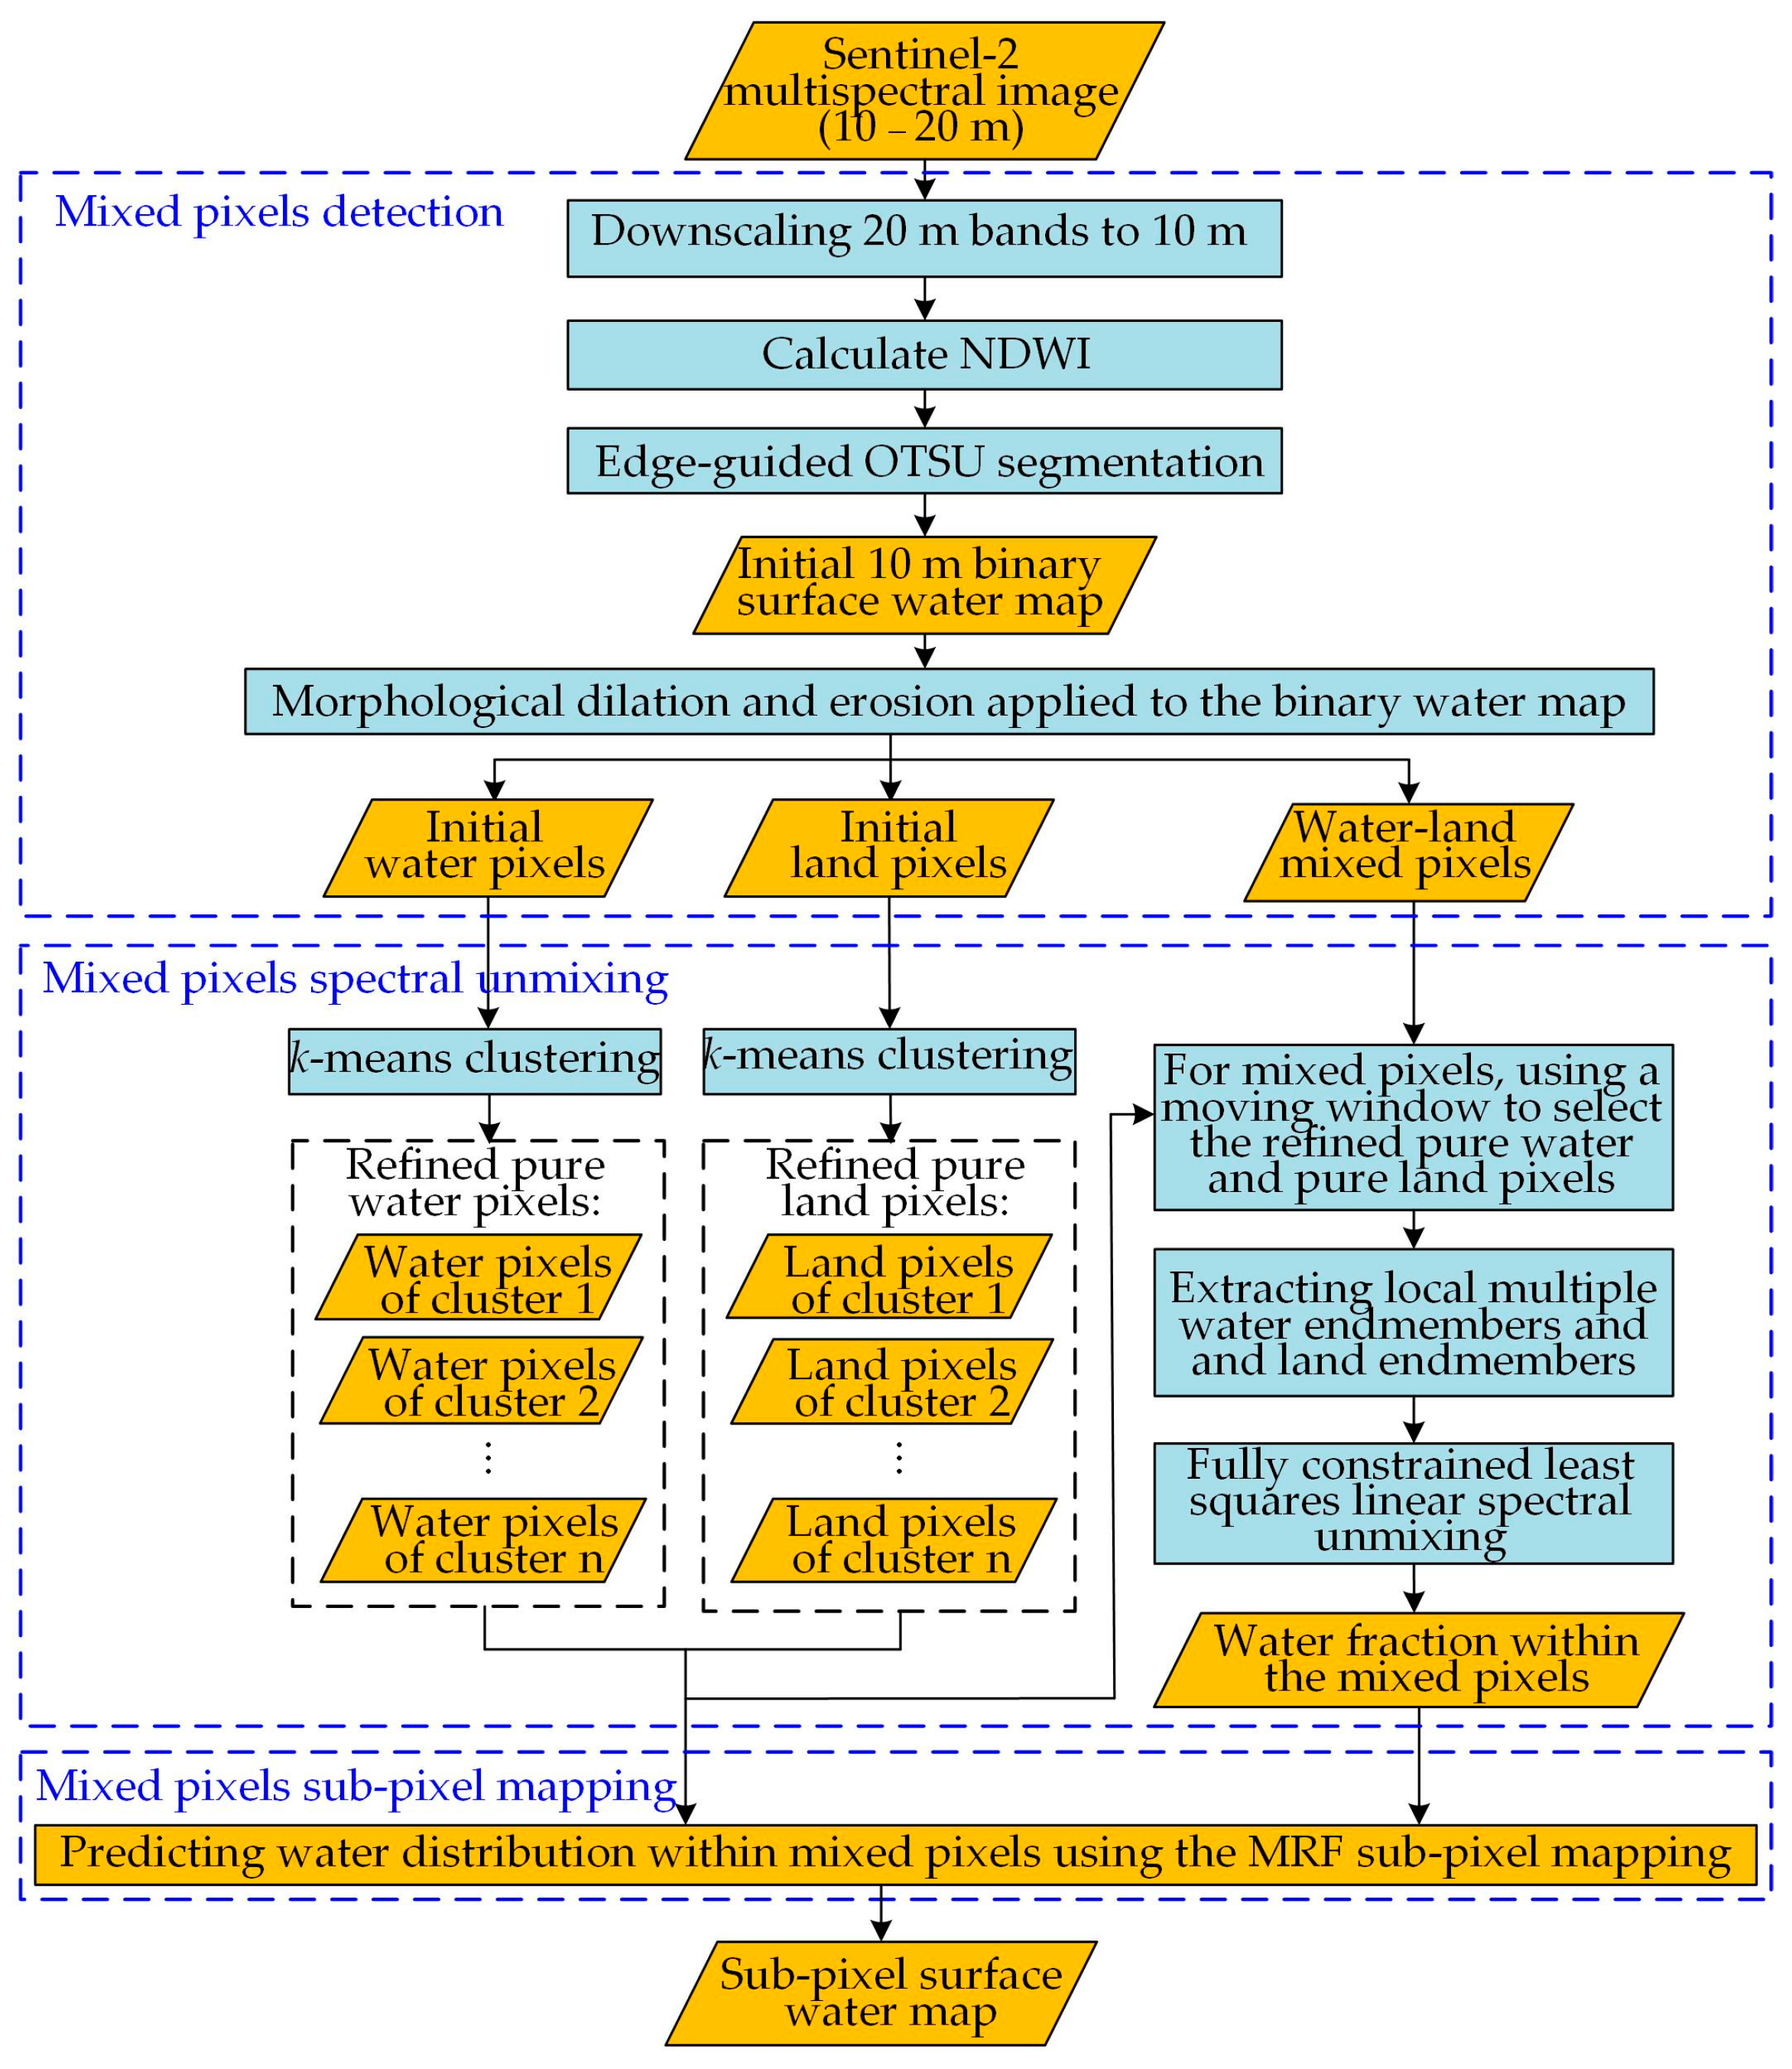
Figure 1. Flowchart of the proposed sub-pixel surface water mapping method.
Water 15 01446 g001
Figure 2. Sketch map illustrating the mixed pixels determined by the morphological dilation and erosion operations. (a) The high-spatial-resolution image overlapped with Sentinel-2 pixels. The pond is represented with dark green in (a). The Sentinel-2 pixels in the black squares contain many mixed water–land pixels that have red lines (border between water and land) in (a). (b) The binary water map (A) generated by the segmentation of the Sentinel-2 NDWI image. (c,d) The maps of A   B and A   B are the results of applying the morphological dilation and erosion operations to A using the 3 × 3 binary structuring element (B). The dark green pixels in (c) indicate the dilated pixels, and the light green pixels in (d) indicate the eroded pixels. The dilated and eroded pixels are combined as the potential mixed water–land pixels in (e). The real water–land mixed pixels are those where the water–land borderline (highlighted with the red line) is located within. (e) The water–land borderline is located within both the dark green pixels (dilated pixels) and light green pixels (erosion pixels), illustrating that both dilation and erosion operations are required to fully determine the potential mixed water–land pixels. NDWI, normalized difference water index.
Water 15 01446 g002
Figure 3. Sketch map illustrating the pure water pixels from different clusters for local water endmember extraction. (a) A typical region with different ponds. (b) Neighborhood Sentinel-2 pixels selected in a moving window. (c) Pure water pixels to composite the local endmembers. (d) Selected local water endmembers. The 5 × 5–sized local window contains eight pure water pixels, i.e., P1,1, P1,2, P2,1, P2,2, P3,4, P4,4, P5,4, and P5,2, highlighted with blue rectangles in (c). Pixels P1,1, P1,2, P2,1, and P2,2 belong to pond 1; pixels P3,4, P4,4, and P5,4 belong to pond 2; and P5,2 belongs to pond 3 in (a). Traditional SPM methods average the pure water spectra of the pure water pixels from all three ponds, i.e., {P1,1 ∪ P1,2 ∪ P2,1 ∪ P2,2 ∪ P3,4 ∪ P4,4 ∪ P5,4 ∪ P5,2}, as one water endmember in the unmixing without considering the difference in water pixels in (d). DE_MRF could consider the water spectra from different ponds to incorporate intra-class spectral variability of water and may group different water pixels into different subsets, i.e., {P1,1 ∪ P1,2 ∪ P2,1 ∪ P2,2}, {P3,4 ∪ P4,4 ∪ P5,4}, and {P5,2}, in spectral unmixing in (d). SPM, sub-pixel mapping; MRF, Markov random field.
Water 15 01446 g003
Figure 4. The study area of the Jinshui Basin and the input Sentinel-2 image. The false color image is composited with VNIR-red-green as RGB.
Water 15 01446 g004
Figure 5. 2 m resolution GF-1 and GF-6 mosaicked image and the sample points used for the model assessment. The yellow points were used to assess different surface water mapping algorithms. The green points, which were mostly distributed within the mixed Sentinel-2 pixels, were used to assess different SPM algorithms. SPM, sub-pixel mapping. The false color image is composited with VNIR-red-green as RGB.
Water 15 01446 g005
Figure 6. Resulting surface water maps from different methods. (a) NDWI_OTSU, (b) MNDWI_OTSU, (c) SVM, (d) UNet, (e) D_PSA, (f) D_MRF, (g) DE_PSA, and (h) DE_MRF (proposed). The enlarged areas of the five zoom-in areas (A, B, C, D, and E) are shown in Figure 7 and Figure 8.
Water 15 01446 g006
Figure 7. Zoomed-in areas A–D in Figure 6 (the surface water maps predicted by different methods).
Water 15 01446 g007
Figure 8. Zoomed-in area E in Figure 6 (the surface water maps predicted by different methods).
Water 15 01446 g008
Figure 9. 2 m resolution DE_MRF surface water map (blue indicates surface water, and white indicates land) overlapped with the Sentinel-2 image in the Dangara region in Guinea. The false color image is composited with VNIR-red-green as RGB.
Water 15 01446 g009
Figure 10. 2 m resolution DE_MRF surface water map (blue indicates surface water, and white indicates land) overlapped with the Sentinel-2 image in the Terai region in Nepal. The false color image is composited with VNIR-red-green as RGB.
Water 15 01446 g010
Table 1. Explanation of different sub-pixel mapping methods.
NameProcesses in Spectral Unmixing and SPM
Spectral Unmixing for the Mixed PixelsSPM to Generate the Sub-Pixel Surface Water Map
D_PSAUsing only dilation operations in mixed-pixel detection and averaging local water and local land endmembers in the unmixingPSA
D_MRFUsing only dilation operations in mixed-pixel detection and averaging local water and local land endmembers in the unmixingMRF
DE_PSAUsing dilation and erosion operations in mixed-pixel detection and using multiple local endmembers in the unmixingPSA
DE_MRF
(proposed)
Using dilation and erosion operations in mixed-pixel detection and using multiple local endmembers in the unmixingMRF
Table 2. Quantitative assessment results of different methods using the 6000 sample points that are randomly selected in the image as highlighted with yellow points in Figure 5. The highest overall accuracy, highest critical success index, lowest omission, and lowest commission errors are in bold.
NDWI_OTSUMNDWI_OTSUSVMUNetD_PSAD_MRFDE_PSADE_MRF
Overall Accuracy (%)99.016798.216798.400099.616799.533399.600099.633399.7167
Critical success index (Water)0.98030.96440.96880.99230.99070.99200.99270.9943
Omission Error (%)Water1.93333.26670.50000.70000.36670.40000.26670.3667
Land0.03330.30002.70000.06670.56670.40000.46670.2000
Commission Error (%)Water0.03400.30922.64190.06710.56550.40000.46570.2003
Land1.89733.17250.51120.69560.36740.40000.26720.3661
Table 3. Quantitative assessment results of different SPM methods in the mixed pixels using the 8000 sample points that are selected near the water–land boundaries highlighted with green points in Figure 5. The highest overall accuracy, highest critical success index, lowest omission, and lowest commission errors are in bold.
D_PSAD_MRFDE_PSADE_MRF
Overall Accuracy (%)79.162580.200083.937584.4125
Critical success index (Water)0.69070.70230.73610.7361
Omission Error (%)Water7.00006.600010.475013.0500
Land34.675033.000021.650018.1250
Commission Error (%)Water27.158826.107619.473817.2496
Land9.64738.967411.768013.7477
Disclaimer/Publisher’s Note: The statements, opinions and data contained in all publications are solely those of the individual author(s) and contributor(s) and not of MDPI and/or the editor(s). MDPI and/or the editor(s) disclaim responsibility for any injury to people or property resulting from any ideas, methods, instructions or products referred to in the content.