Article

Removal of Haloacetic Acids via Adsorption and Biodegradation in a Bench-Scale Filtration System

Department of Civil, Construction, and Environmental Engineering, University of Alabama, Tuscaloosa, AL 35487, USA
*
Author to whom correspondence should be addressed.
Water 2023, 15(8), 1445; https://doi.org/10.3390/w15081445
Submission received: 21 March 2023 / Revised: 31 March 2023 / Accepted: 5 April 2023 / Published: 7 April 2023
(This article belongs to the Section Water Quality and Contamination)

Abstract

:
Brominated disinfection byproducts (DBPs) are a concern to drinking water utilities due to their toxicity and increasing prevalence in water systems. Haloacetic acids (HAAs) are a class of DBPs that are partially regulated by the United States Environmental Protection Agency (USEPA), but regulations are likely to increase as evidenced by the brominated HAAs listed on the USEPA Fourth Unregulated Contaminant Monitoring Rule and Fifth Contaminant Candidate List. Utilities often use a pre-oxidant to assist in their treatment training, but this can lead to increased HAA formation during treatment. In this study, tap water was spiked with bromine (Br2) at varying concentrations to simulate bromine-to-chlorine ratios found in the natural environment and the DBPs that may be formed from those waters. The water was fed through a bench-scale biological filter (biofilter) with a small layer of fresh granular activated carbon (GAC) media followed by acclimated anthracite media. The HAA species studied were found to be removable by an average of 89.5% through combined GAC filtration and biofiltration. Biodegradation occurred predominantly in the first five minutes for the acclimated anthracite, with minimal additional removal observed at longer empty bed contact times (15 and 30 min EBCT). This study provides recommendations on biofilter parameters for utilities to reduce the formation of both regulated and unregulated HAAs during the drinking water treatment process.

1. Introduction

The disinfection of drinking water with chlorine has prevented many waterborne illnesses and is considered a major advancement of engineering technology in the last century [1]. However, unintended consequences of disinfection are a challenge for drinking water utilities [2]. Chlorine used for disinfection reacts with dissolved organic matter (DOM), a heterogeneous mixture of compounds ubiquitous in all water sources, to create a variety of disinfection byproducts (DBPs) [3]. Utilities that employ pre-oxidation to mitigate taste and odor concerns or to enhance coagulation can form DBPs at the beginning of treatment as well as in the distribution system [2], as chemical pre-oxidants are often the same chemicals used at the end of treatment for disinfection. Haloacetic acids (HAAs) are a class of DBPs that are known carcinogens and are partially regulated by the United States Environmental Protection Agency (USEPA) under the Stage 1 and Stage 2 Disinfectants and Disinfection Byproducts Rules [4]. Of the nine chlorinated and brominated HAAs (Table 1; HAA9), the USEPA currently regulates the sum of only five compounds (HAA5) at a total maximum contaminant level (MCL) of 60 μg·L−1. While HAA5 have been studied extensively, the bromo-chlorinated HAAs warrant more research as they are considered more toxic than their chlorinated counterparts [2,5,6] and will likely soon be regulated by the USEPA, as evidenced by their listing on the USEPA Fourth Unregulated Contaminant Monitoring Rule and Fifth Contaminant Candidate List [7]. The Disinfection Byproducts Rule has existed in its current form since 2006, yet many utilities still struggle with compliance. Further HAA regulations will likely exacerbate compliance struggles; therefore, more investigations are needed for sustainable treatment options.
Bromide (Br) is a natural constituent in all waters and can be introduced to the water body from an anthropogenic source, such as coal mine leachate [8]. Previous surveys of bromide levels present in natural waters were in the ranges of 6–83 ug/L in reservoirs, 3–2000 µg·L−1 in other surface waters, 2–2226 µg·L−1 in groundwaters, and 65,000 µg·L−1 in the sea, as summarized by Magazinovic et al. [9]. Hypochlorous acid (HOCl), a typical disinfectant, oxidizes bromide in the source water to form hypobromous acid (HOBr), which reacts more quickly with DOM than HOCl [8].
HOCl + Br HOBr +   Cl
The use of different disinfectants, such as hydrogen peroxide and peracetic acid, can also influence DBP formation and speciation [10]. Studies have shown that even small concentrations of active brominated species (Br, HOBr) will yield increased speciation of brominated HAAs due to this reactivity [11], and higher bromide concentrations increase total DBP concentrations over time in drinking water utility. The study of brominated HAAs is especially relevant as bromide levels are expected to increase with climate change and deteriorating water quality in the coming years [5,12,13]. Coastal utilities using groundwater will be particularly impacted due to seawater intrusion resulting from rising sea levels [5,14].
There is some debate in the literature as to whether HAAs can be effectively removed from drinking water via adsorption onto granular activated carbon (GAC) media. It was once a common assumption that HAAs would not be adsorbed, as they are hydrophilic molecules [15]. Some studies have found, however, that fresh GAC does adsorb HAAs [15,16,17], while other studies have found removal via adsorption to be far less significant than removal via biodegradation [18,19]. However, the adsorptive properties of GAC media can be exhausted, and the media are often expensive to replace. Another treatment method to remove HAAs in drinking water is biological filtration (biofiltration), which consists of standard filter media (anthracite, granular activated carbon (GAC), sand, etc.) with an established biomass of a community of indigenous bacteria [20]. In addition to achieving the traditional purpose of a filter, which consists of physically removing particulate matter and certain pathogens, biofilters have been proven in previous studies to remove other contaminants of concern, including DOM [20,21,22,23,24,25] and HAA5 [15,17,18,24,26,27,28]. Thus, biofiltration can reduce the concentration of HAA5 leaving the utility, as well as the potential of HAA5 to form within the distribution system, by removing DOM which serves as a DBP precursor. Adsorption and biodegradation as removal mechanisms can be isolated from each other by choosing the appropriate filter media. Per reviews of biofiltration studies [20,21], it is commonly accepted that GAC is an adsorptive media while anthracite does not have substantial adsorptive sites. This is because the cumulative pore volume of anthracite media is approximately 1000 times smaller than that of GAC media [29,30]. Most target contaminants, including DOM, DBP precursors, DBPs, and taste and odor compounds are smaller than about 20 Angstroms (or 2 nm). Anthracite media effectively have a minimal pore volume in the range needed to adsorb these target compounds [30]. Therefore, anthracite medium was chosen for the biofilters such that biodegradation was the dominant removal mechanism.
To the knowledge of the authors, no studies have examined adsorption and biodegradation as independent and synergistic removal mechanisms of pre-formed HAAs. The objectives of this work are to (1) investigate the formation potential of HAAs in tap water spiked with environmentally relevant concentrations of bromine; and (2) evaluate the removal of HAAs via adsorption onto fresh GAC and via biodegradation in an acclimated anthracite biofilter. The results of this study will strengthen the scientific community’s understanding of HAA behavior in filtration systems and enable utilities to mitigate the effects of HAAs in their respective distribution systems as utilities navigate increasing regulations, climate change, and water security.

2. Materials and Methods

2.1. Biofiltration System

A bench-scale biofilter setup was operated using the combined recirculating batch reactor and single-pass plug flow reactor experimental protocol developed by Terry et al. [31]. The recirculation batch mode consisted of a 5-day recirculation period to determine the total biodegradability of the HAAs. The single-pass mode consisted of a 4 h single-pass operation followed by sampling to determine the biofilter performance at the targeted empty bed contact times (EBCTs). A peristaltic pump (Masterflex L/S Digital Drive, 600 rpm, 115/230 VAC [Model 07522–20], Cole-Parmer, Vernon Hills, IL, USA) was used to pump source water at a flow rate of 7.1 mL/min (HLR: 2.44 m/h) through the bench-scale biofiltration system. Three clear glass chromatography columns (1.5 cm ID) and PTFE caps (Ace Glass 5820-24 and 5844-34, Vineland, NJ) with stainless-steel metal fittings (Swagelock Fittings SS-400-1-4, SS-6P4T, and SS-400-3, Cleveland, OH, USA) were set up in series. A column was packed with fresh granular activated carbon (GAC) to quench the remaining free chlorine residual from the tap water, such that the bacterial makeup of the anthracite biofilters would not be negatively impacted by the chlorine [32]. This column served to simulate a small layer of GAC media on top of an anthracite media biofilter during single-pass tests. The GAC was packed to an EBCT of approximately 2.5 min. A single pass of each water sample was run through the GAC column prior to placement on the biofilter (Figure 1). The three biofilter columns were packed with biologically active anthracite with an effective size of 1.0 mm and an approximate uniformity coefficient of 1.3 from the Shoal Creek Filter Plant in Gwinnett County, GA. The bottoms of the columns were packed with 5 cm of support media (2 mm diameter Signature Glass Beads, VWR, Radnor, PA, USA), supported by a wire mesh to prevent media loss or clogging, and the anthracite was packed to heights of 20, 41, and 61 cm, respectively. The media depths corresponded to total EBCTs of 5, 15, and 30 min. Sampling ports were located directly before and after each column to assess performance within each biofilter column. To minimize the growth of photosynthesizing microorganisms within the biofilters, the columns were covered to prevent light penetration within the filter. The filters were operated at lab temperature for all experiments (20 °C ± 2).

2.2. Feed Water

Tap water collected from Tuscaloosa, AL (USA) was spiked with bromine (Liquid Bromine 99.5+% ACS, Thermo Scientific, Waltham, MA, diluted in laboratory grade deionized water) at concentrations simulating the Br:Cl ratios [9,33] observed in the environment. Br2 reacts in water to produce active compounds (e.g., OBr- and HOBr), and the weight ratio was calculated based on Br2 concentration and free chlorine residual. The feed water was created twice for the combined recirculating batch reactor and single-pass plug flow reactor experimental protocols, with each test run in triplicate (six total feed water batches). The concentration of bromine added varied based on the concentration of free chlorine (HOCl) in the tap water sample during collection, which averaged 1.73 ± 0.2 mg·L−1 (n = 6), using a commercial test kit (Pocket Colorimeter II, HACH, Loveland, CO, USA). The added bromine concentration averaged 5.43 × 10⁻³ ± 1.2 × 10⁻³ mg·L−1 (n = 6). After 48 h of reaction time, the free chlorine concentration decreased to 1.00 ± 0.2 mg·L−1 (n = 6).

2.3. Biological Activity

Adenosine triphosphate (ATP) was measured as an indicator of acclimated biofilter media, as ATP is the primary energy carrier of all cells and has been correlated with microbial activity in the biofilter [34]. Media samples were analyzed for ATP concentrations using a commercial test kit and following the manufacturer’s instructions (Deposit and Surface Analysis Kit, LuminULTRA Technologies, Fredericton, NB, Canada). To report biomass activity on a per-unit of media volume basis, the bed density (0.814 g·mL−1) and dry–wet ratio (64%) of the media were used to calculate ATP concentrations as ngATP·mL−1 media.

2.4. Organic Matter Analysis

Organic matter surrogates include dissolved organic carbon (DOC), ultraviolet absorbance at a wavelength of 254 nm (UV254), and specific ultraviolet absorbance (SUVA). For organic matter analysis, water samples were collected in duplicate in 40 mL glass vials and filtered through a 0.45 µm membrane filter (Whatman Cellulose Acetate Membrane Circles, VWR, Radnor, PA, USA), and then refrigerated for a maximum of seven days before analysis. Dissolved organic carbon (DOC) and ultraviolet absorbance at a wavelength of 254 nm (UV254) served as organic matter surrogates and were collected for all samples to measure organic matter (Table 2). These values were collected on a Sievers M5310C TOC Analyzer (Suez, Boulder, CO, USA) and a HACH DR 6000 spectrophotometer (HACH, Loveland, CO, USA), respectively. Specific ultraviolet absorbance (SUVA) was calculated using the equation below.
SUVA = UV 254 DOC × 100

2.5. HAA Analysis and Gas Chromatography

For HAA analysis, water samples were collected in triplicate in 60 mL vials containing 6.5 g of ammonium chloride to quench further reactions occurring after the time of collection. The vials were filled with sample until there was a convex meniscus at the top of the vial and no headspace remained. Seven HAAs, which included chloroacetic acid (CAA), dichloroacetic acid (DCAA), trichloroacetic acid (TCAA), bromoacetic acid (BAA), dibromoacetic acid (DBAA), bromochloroacetic acid (BCAA), and bromodichloroacetic acid (BDCAA), were identified and quantified via gas chromatography using the USEPA Method 552.2 [35]. Standards for each of these analytes were obtained from Absolute Standards (Part 33254, Absolute Standards, Hamden, CT, USA) and were run individually to identify the retention times of the analytes. The calibration curve was built by spiking a combined standard containing all HAAs (Part 30107, Absolute Standards, Hamden, CT, USA) into deionized water at concentrations of 2, 5, 10, 20, 30, 50, 100, and 200 ppb and extracting the standards according to the method outlined below. The r2 value for the calibration curve of each of the seven analytes studied herein was above 0.98. The surrogate standard, 20 µL of 2,3-dibromopropionic acid (Part 30108, Absolute Standards, Hamden, CT), was added to each 40 mL sample aliquot for quality assurance of the extraction procedure. One gram of copper sulfate (CuSO4) was added to each vial, and then each sample was acidified with 2 mL of concentrated sulfuric acid (H2SO4). Subsequently, 4 mL of methyl-tertiary-butyl ether (MTBE) was added to each sample for organics extraction, immediately followed by 15 g of sodium sulfate (Na2SO4). The samples were shaken for 4 min and allowed to sit for 10–15 min to allow for separation and extraction. Extracted HAAs were methylated via the addition of 1 mL of a 10% H2SO4 solution in methanol. The samples were then warmed to 50 °C on a heating block for two hours. After heating, the extracted samples were neutralized with 4 mL of a 10% sodium bicarbonate (NaHCO3) solution in reagent water added dropwise. The samples were allowed to sit for another 10–15 min and 1 mL was extracted from the top layer and put into a labeled autosampler vial (2 mL clear screw-top vial with write-on spot, Agilent Technologies, Santa Clara, CA, USA). Finally, the internal standard, 10 µL of 1,2,3 trichloropropane (Part 30055, Absolute Standards, Hamden, CT, USA), was added to each 1 mL sample vial for quality assurance of the instrument. HAAs were identified and quantified via gas chromatography using a micro-electron capture detector (GC-µECD; Agilent GC8860, Agilent Technologies, Santa Clara, CA, USA). A fused silica capillary column (30 m × 0.25 mm i.d. × 0.25 µm film thickness; DB-1701 part number 122-0732, Agilent Technologies, Santa Clara, CA, USA) was used for the chromatography separation. The GC oven was programmed to run at 50 °C for 5 min, and then ramp from 50–80 °C at a rate of 5 °C·min−1, then 80–150 °C at a rate of 15 °C·min−1, and finally 150–210 °C at a rate of 30 °C·min−1 for a total run time of 21.67 min. The injector was set to 200 °C and run in split mode with a 10:1 ratio and 15 mL·min−1 split flow. The detector temperature was set to 300 °C.

3. Results and Discussion

3.1. Biological Activity

The combined recirculating batch reactor and single-pass plug flow reactor experimental protocol was run in triplicate, and media were sampled in duplicate for microbial activity during each experiment. Similarly to literature studies [21], microbial activity was highest at the top of the filter and decreased with increasing filter depth. The ATP values at the top of the filter, EBCT of 5 min, and EBCT of 15 min averaged 338 ± 47 ngATP·mL−1 (n = 12), 280 ± 79 ngATP·mL−1 (n = 12), and 159 ± 41 ngATP·mL−1 (n = 12), respectively. According to Pharand et al. [34], the data are consistent with a biologically active biofilter, as the top of the filter’s ATP values fall within the 100–1000 ngATP·mL−1 range that is typical of active and acclimated biofilters.

3.2. Organic Matter Removal

Biofilter performance in terms of organic matter removal was measured via DOC and UV254 and evaluated for GAC (EBCT 2.5 min) followed by anthracite media (EBCT 5, 15, and 30 min). The influent DOC concentrations averaged 1.67 ± 0.50 ppm (Table 2), and the influent BDOC percent averaged 2 ± 1.9% (n = 12). The influent BDOC percentage was low due to the use of finished water as the base organic carbon matrix for feed waters. GAC adsorption removed 45 ± 15% (n = 12) of DOC and biofiltration removed an additional 2 ± 1.9% (n = 12) of the DOC; thus, effluent DOC values averaged 0.79 ± 0.05 ppm post treatment (GAC and biofiltration). Influent UV254 values averaged 0.019 ± 0.002 cm−1 (Table 2). GAC adsorption removed 63 ± 9% (n = 12) of UV254 and no additional removal was observed via biofiltration. Thus, effluent UV254 values averaged 0.010 ± 0.004 cm−1 post treatment (GAC and biofiltration). Organic carbon removal was similar to other GAC and acclimated anthracite filters [21].

3.3. HAA Speciation

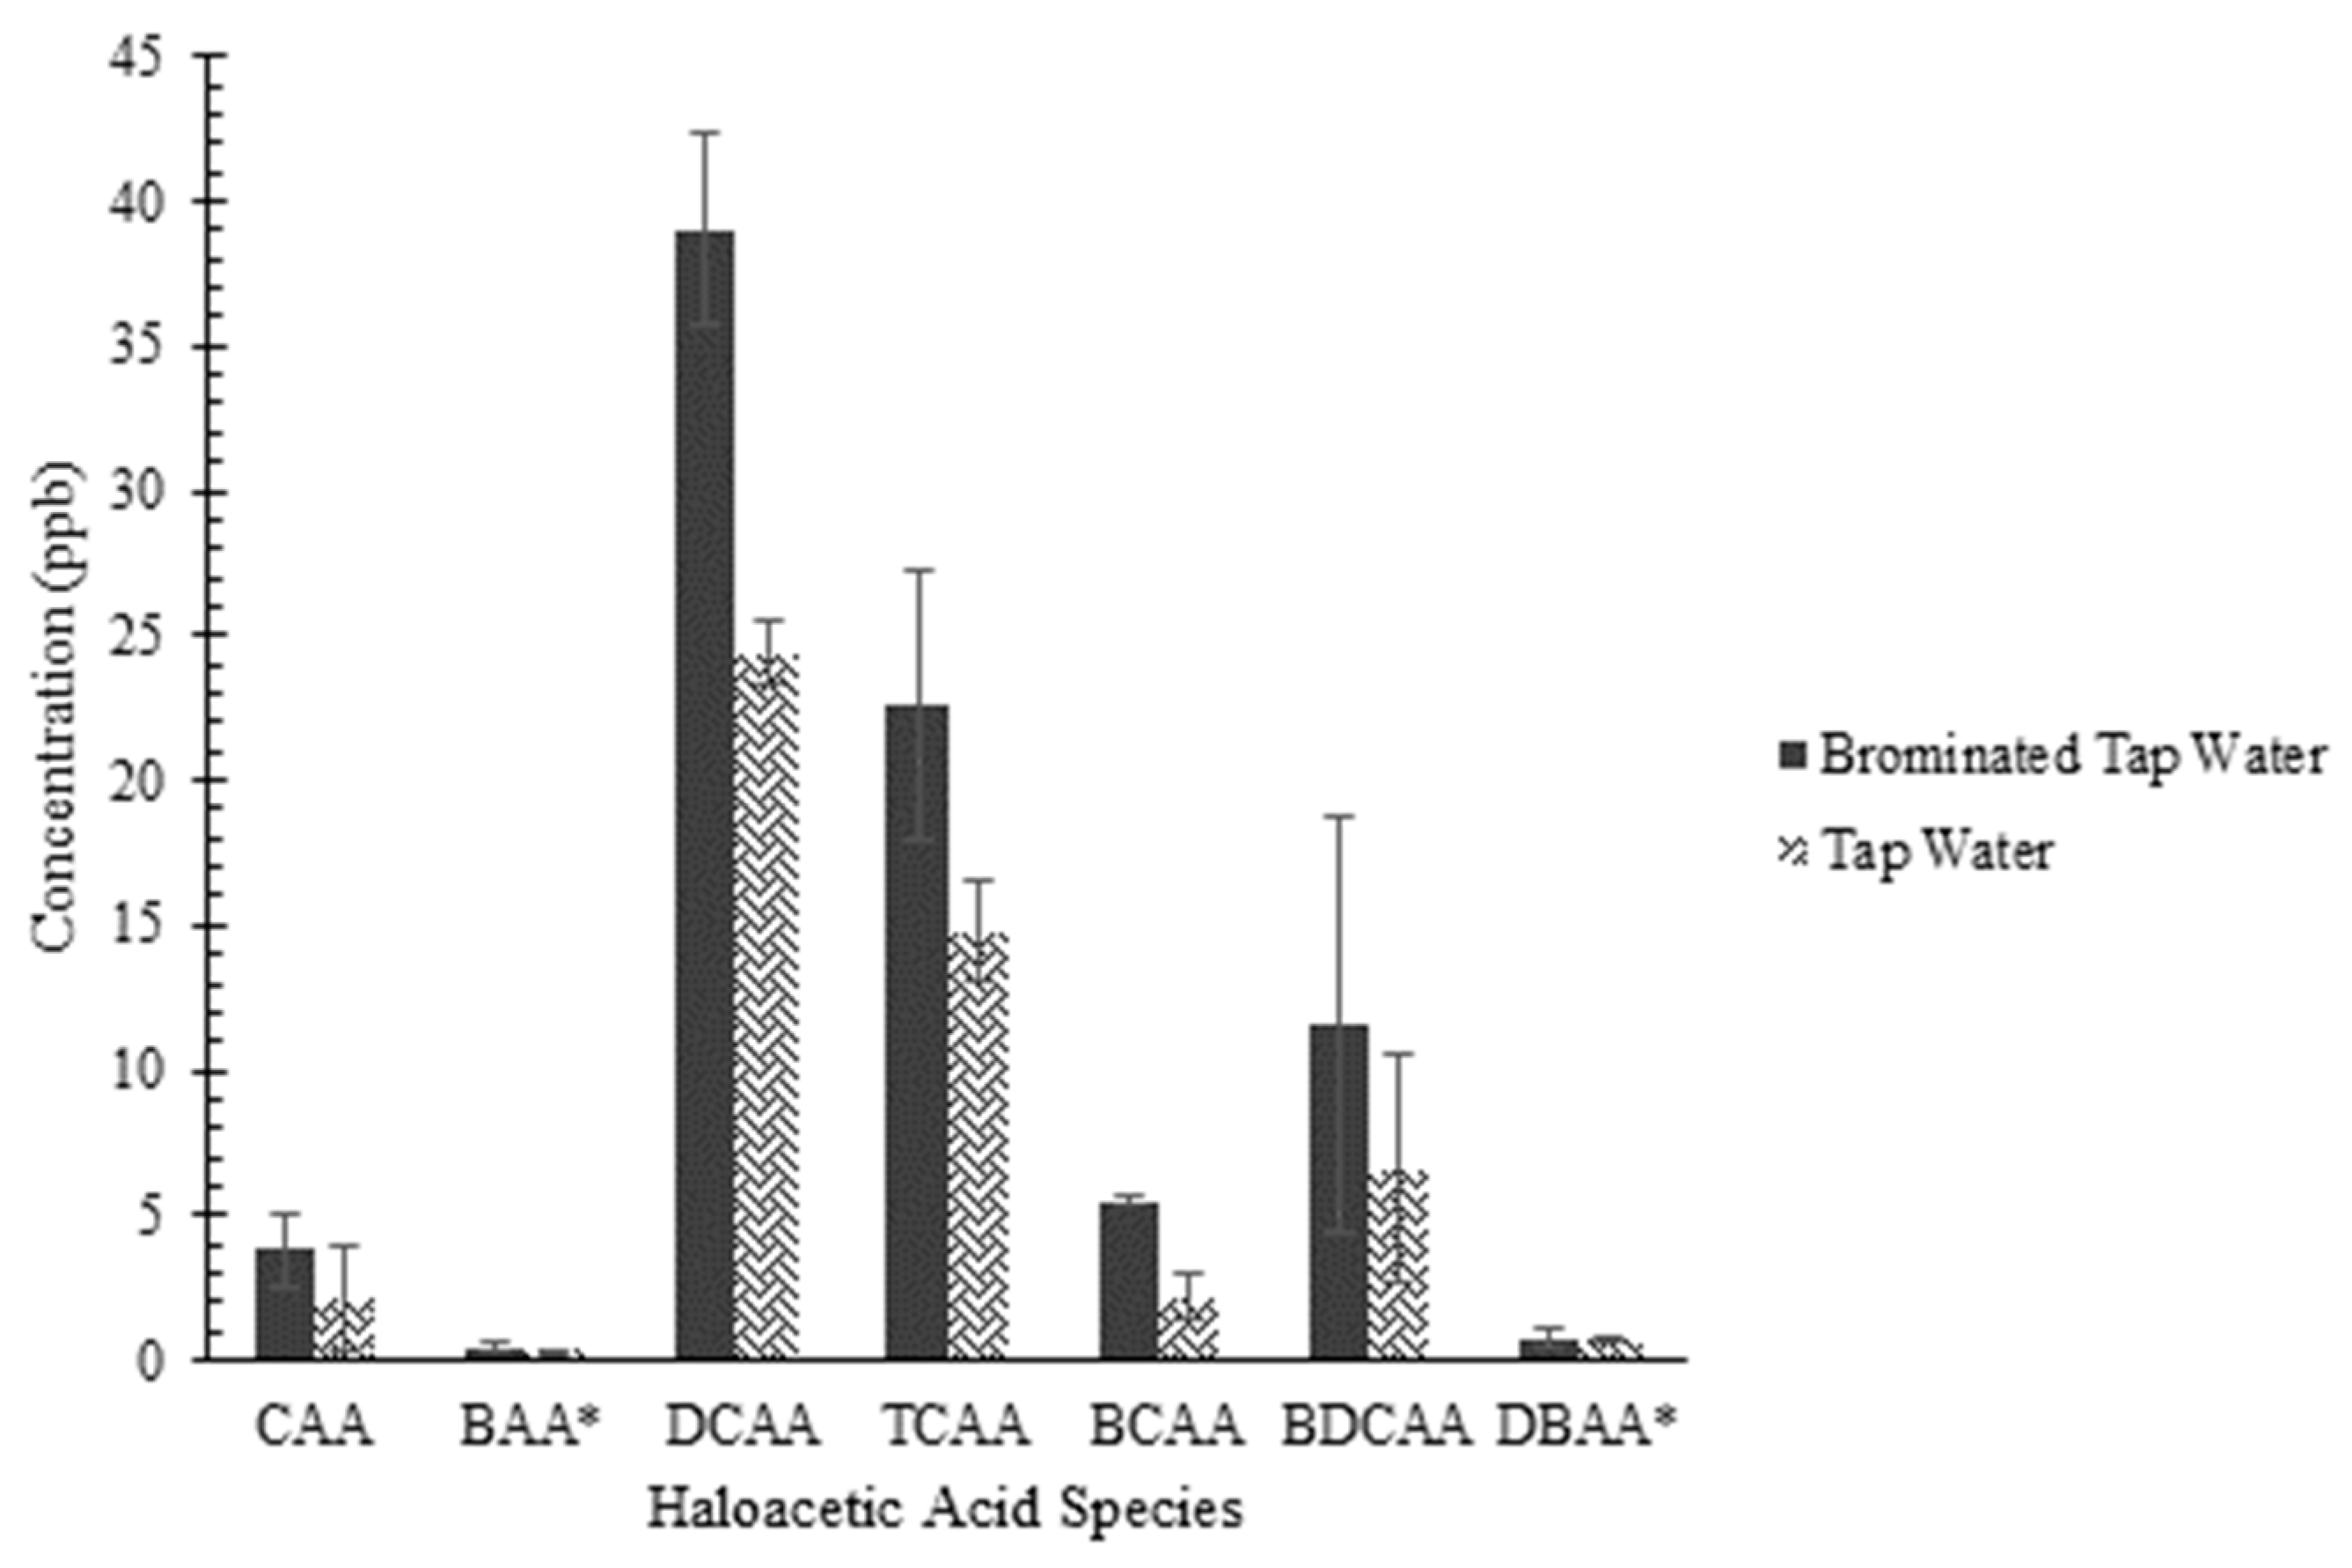
The cumulative HAA concentrations formed at 66.8 ± 1.92 ppb HAA5 and 82.6 ± 2.43 ppb HAA9 in the brominated tap water, which is above the USEPA maximum contaminant level (MCL) for HAA5 of 60 ppb [4]. Seven of the nine HAAs studied were detected by the analytical method and were present in the sample, yet only five HAAs formed above the analytical limit of quantification of 2 ppb (Figure 2). Individual HAAs formed at an average concentration of 3.8 ± 1.3 ppb (CAA), 39.0 ± 3.3 ppb (DCAA), 22.6 ± 4.6 ppb (TCAA), 5.5 ± 0.2 ppb (BCAA), and 11.6 ± 7.2 ppb (BDCAA). BAA and DBAA consistently formed below the level of quantification, yet they formed at detectable levels and thus are included in the analysis.
For comparison of HAA speciation, the tap water without the addition of bromine was analyzed for HAA compounds. Concentrations of 42.4 ± 0.95 ppb HAA5 and 51.3 ± 1.37 ppb HAA9 were detected, which are lower than those found in tap water spiked with bromine due to the low concentration of bromide in the finished tap water (0.0092 mg·L−1 bromide). Individual HAAs were detected at an average concentration of 2.2 ± 1.8 ppb (CAA), 24.4 ± 1.1 ppb (DCAA), 14.8 ± 1.7 ppb (TCAA), 2.2 ± 0.8 ppb (BCAA), and 6.6 ± 3.9 ppb (BDCAA). BAA and DBAA were consistently detected under the quantification limit of 2 ppb.
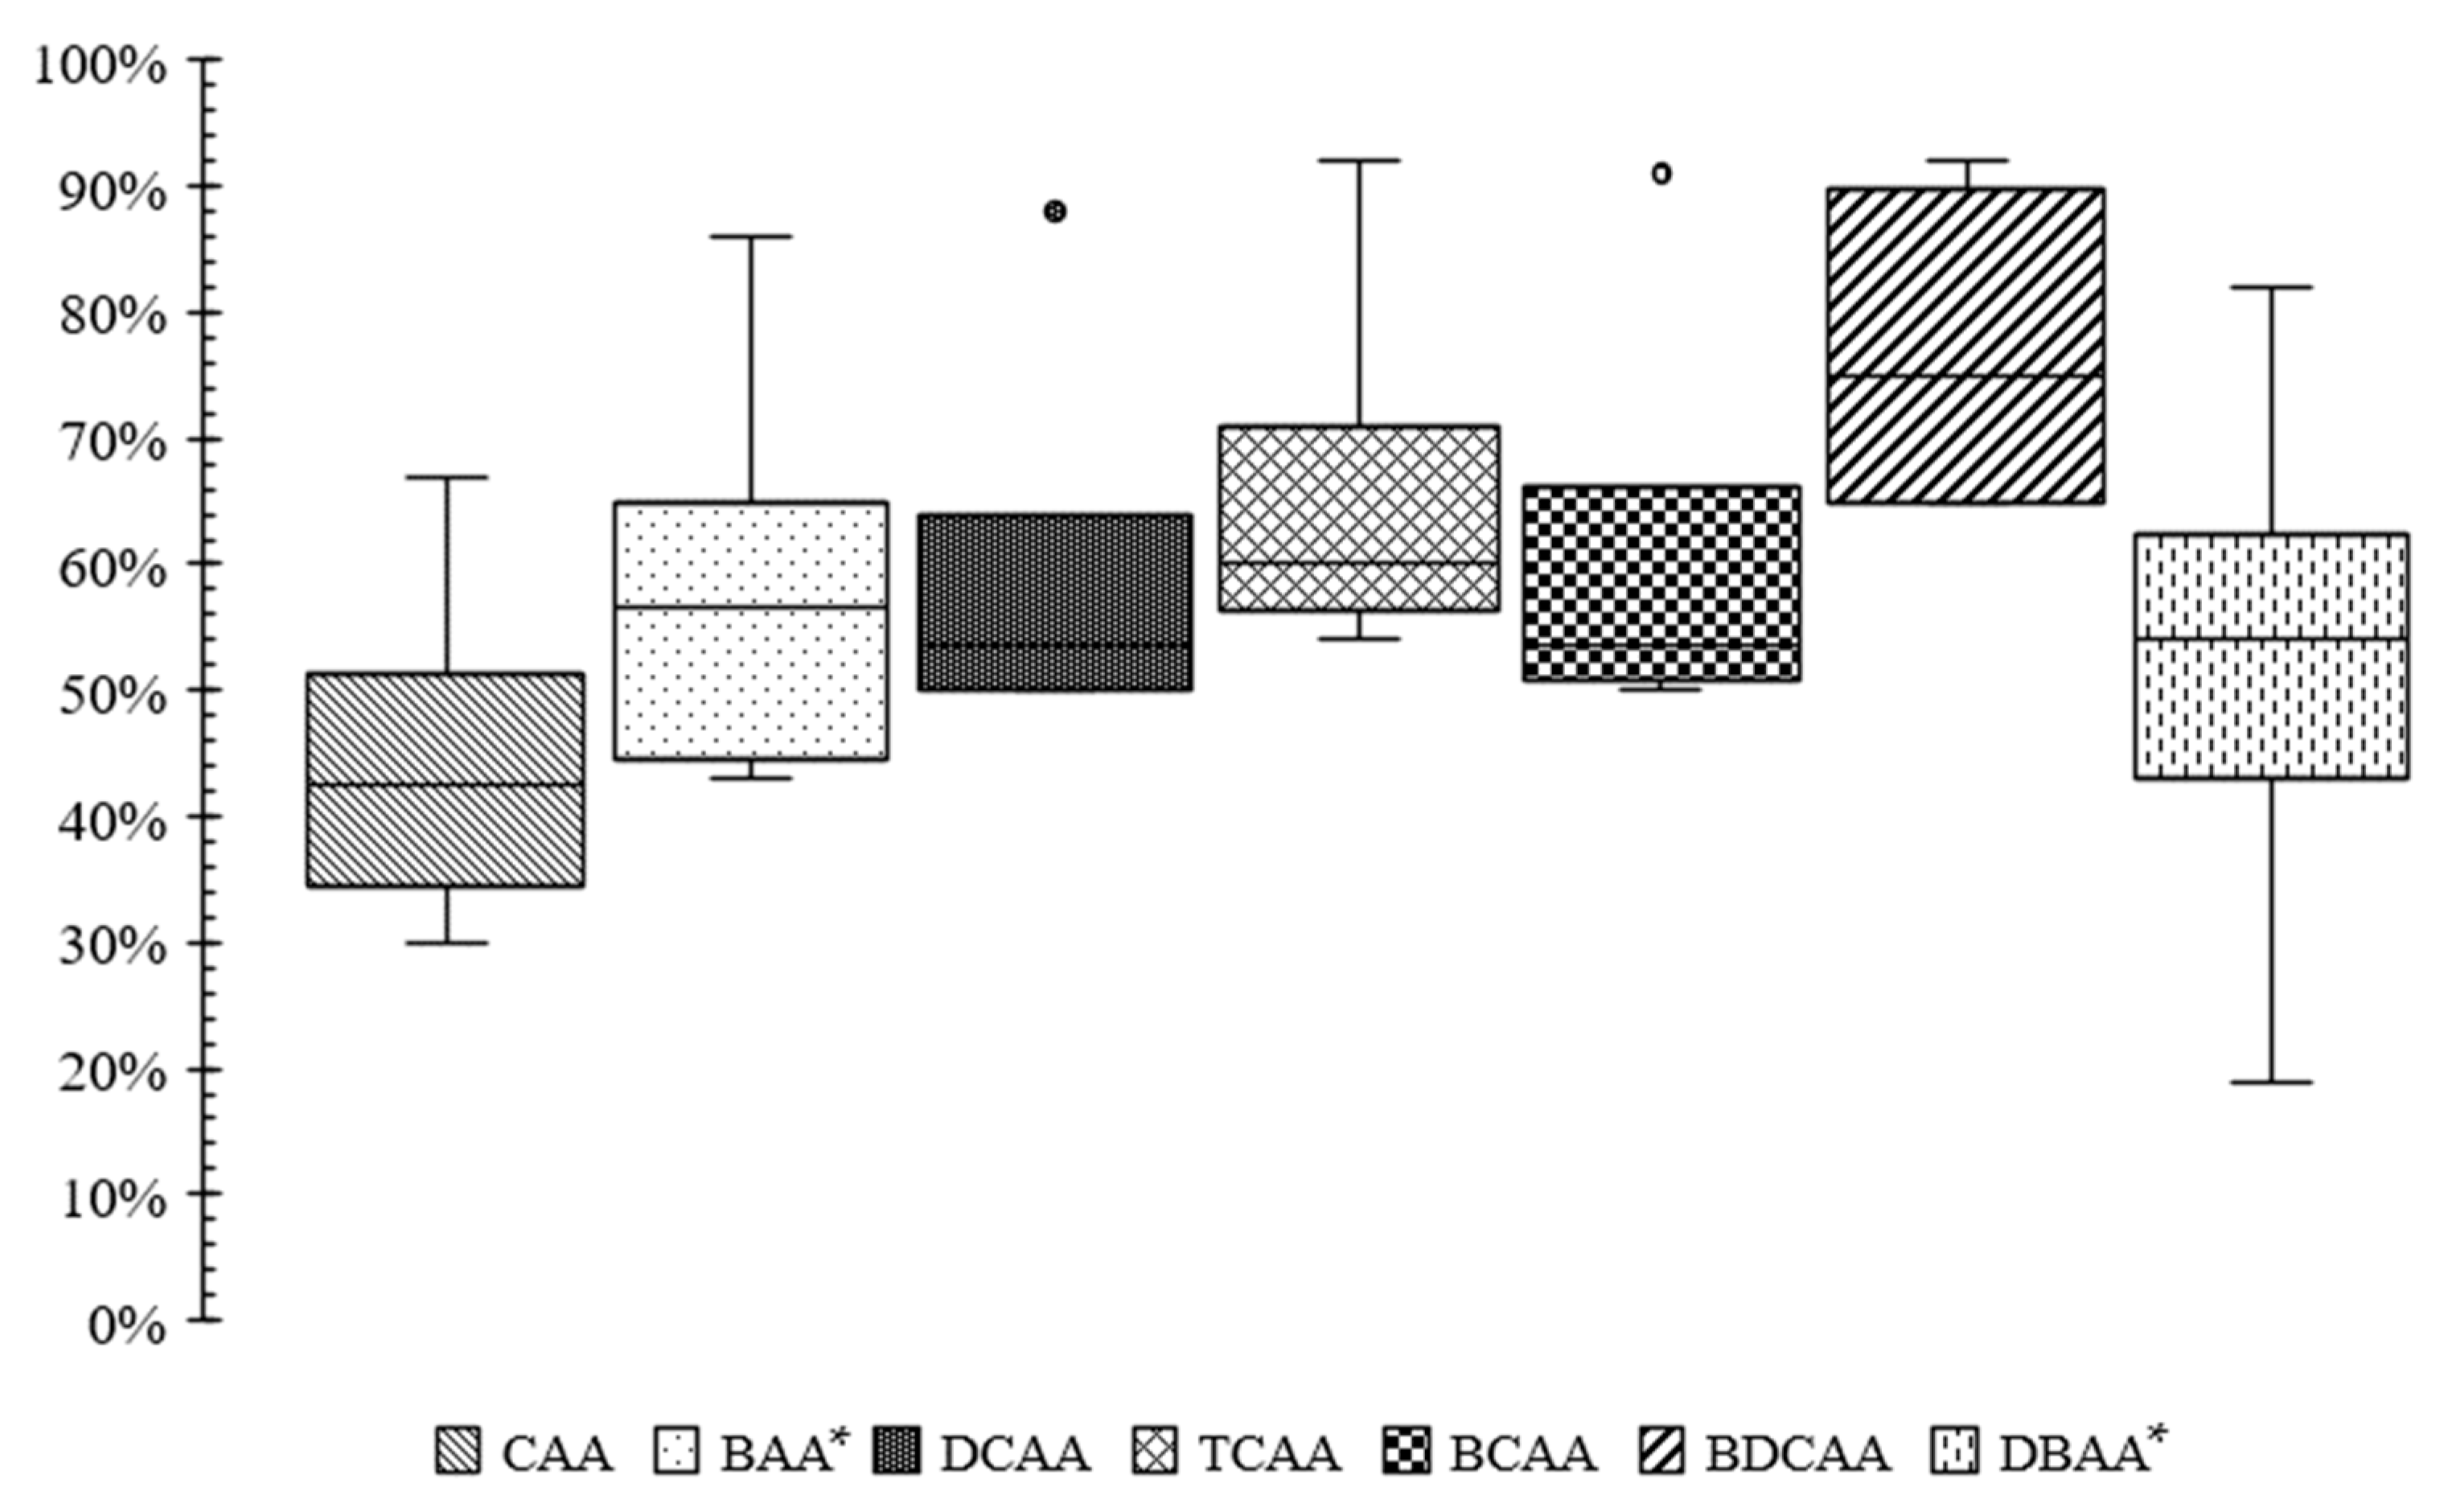
The removal of HAA was evaluated in both recirculating batch reactor experiments and single-pass plug flow reactor experiments using GAC. The experiments were conducted in triplicate, and three separate aliquots were taken from each feedwater sample; thus, a total of 18 samples were collected for HAA analysis. HAA concentration removals ranged from 20% to over 90% in the GAC filter (EBCT of 2.5 min; Figure 3, n = 18). BDCAA was removed most efficiently, with an average removal of 77 ± 12% (n = 18). CAA was removed least efficiently, with an average removal of 44 ± 13% (n = 18). These results are consistent with the findings of Tung et al. [19], which found brominated HAAs to be adsorbed more effectively than their chlorinated counterparts. Tung et al. also found TCAA, a tri-halogenated compound, to be removed the most effectively. However, their study did not assess BDCAA, so it stands to reason that BDCAA would be removed most effectively by GAC adsorption. The remaining HAAs, BAA, DCAA, TCAA, BCAA, and DBAA, were removed on averages of 58 ± 15%, 59 ± 15%, 65 ± 14%, 60 ± 16%, and 53 ± 20%, respectively (n = 18). These results are consistent with the findings of Xie and Zhou [15] and Kim and Kang [16], which both found HAA5 to be effectively adsorbed onto GAC filters. Xie and Zhou [15] observed 100% removal of HAA5 by GAC filtration with an EBCT of 20 min. Kim and Kang [16] observed >99% removal of HAA5 by GAC filtration with an EBCT of 9.8 min. According to Xie and Zhou [15], TCAA exhibited the greatest level of adsorption removal among HAA5 compounds. Consistent with their findings, the present study found that TCAA was the most efficiently removed HAA5 compound through adsorption. However, the unregulated BDCAA compound demonstrated the highest level of adsorption removal for all HAA9 compounds.

3.4. HAA Biodegradability

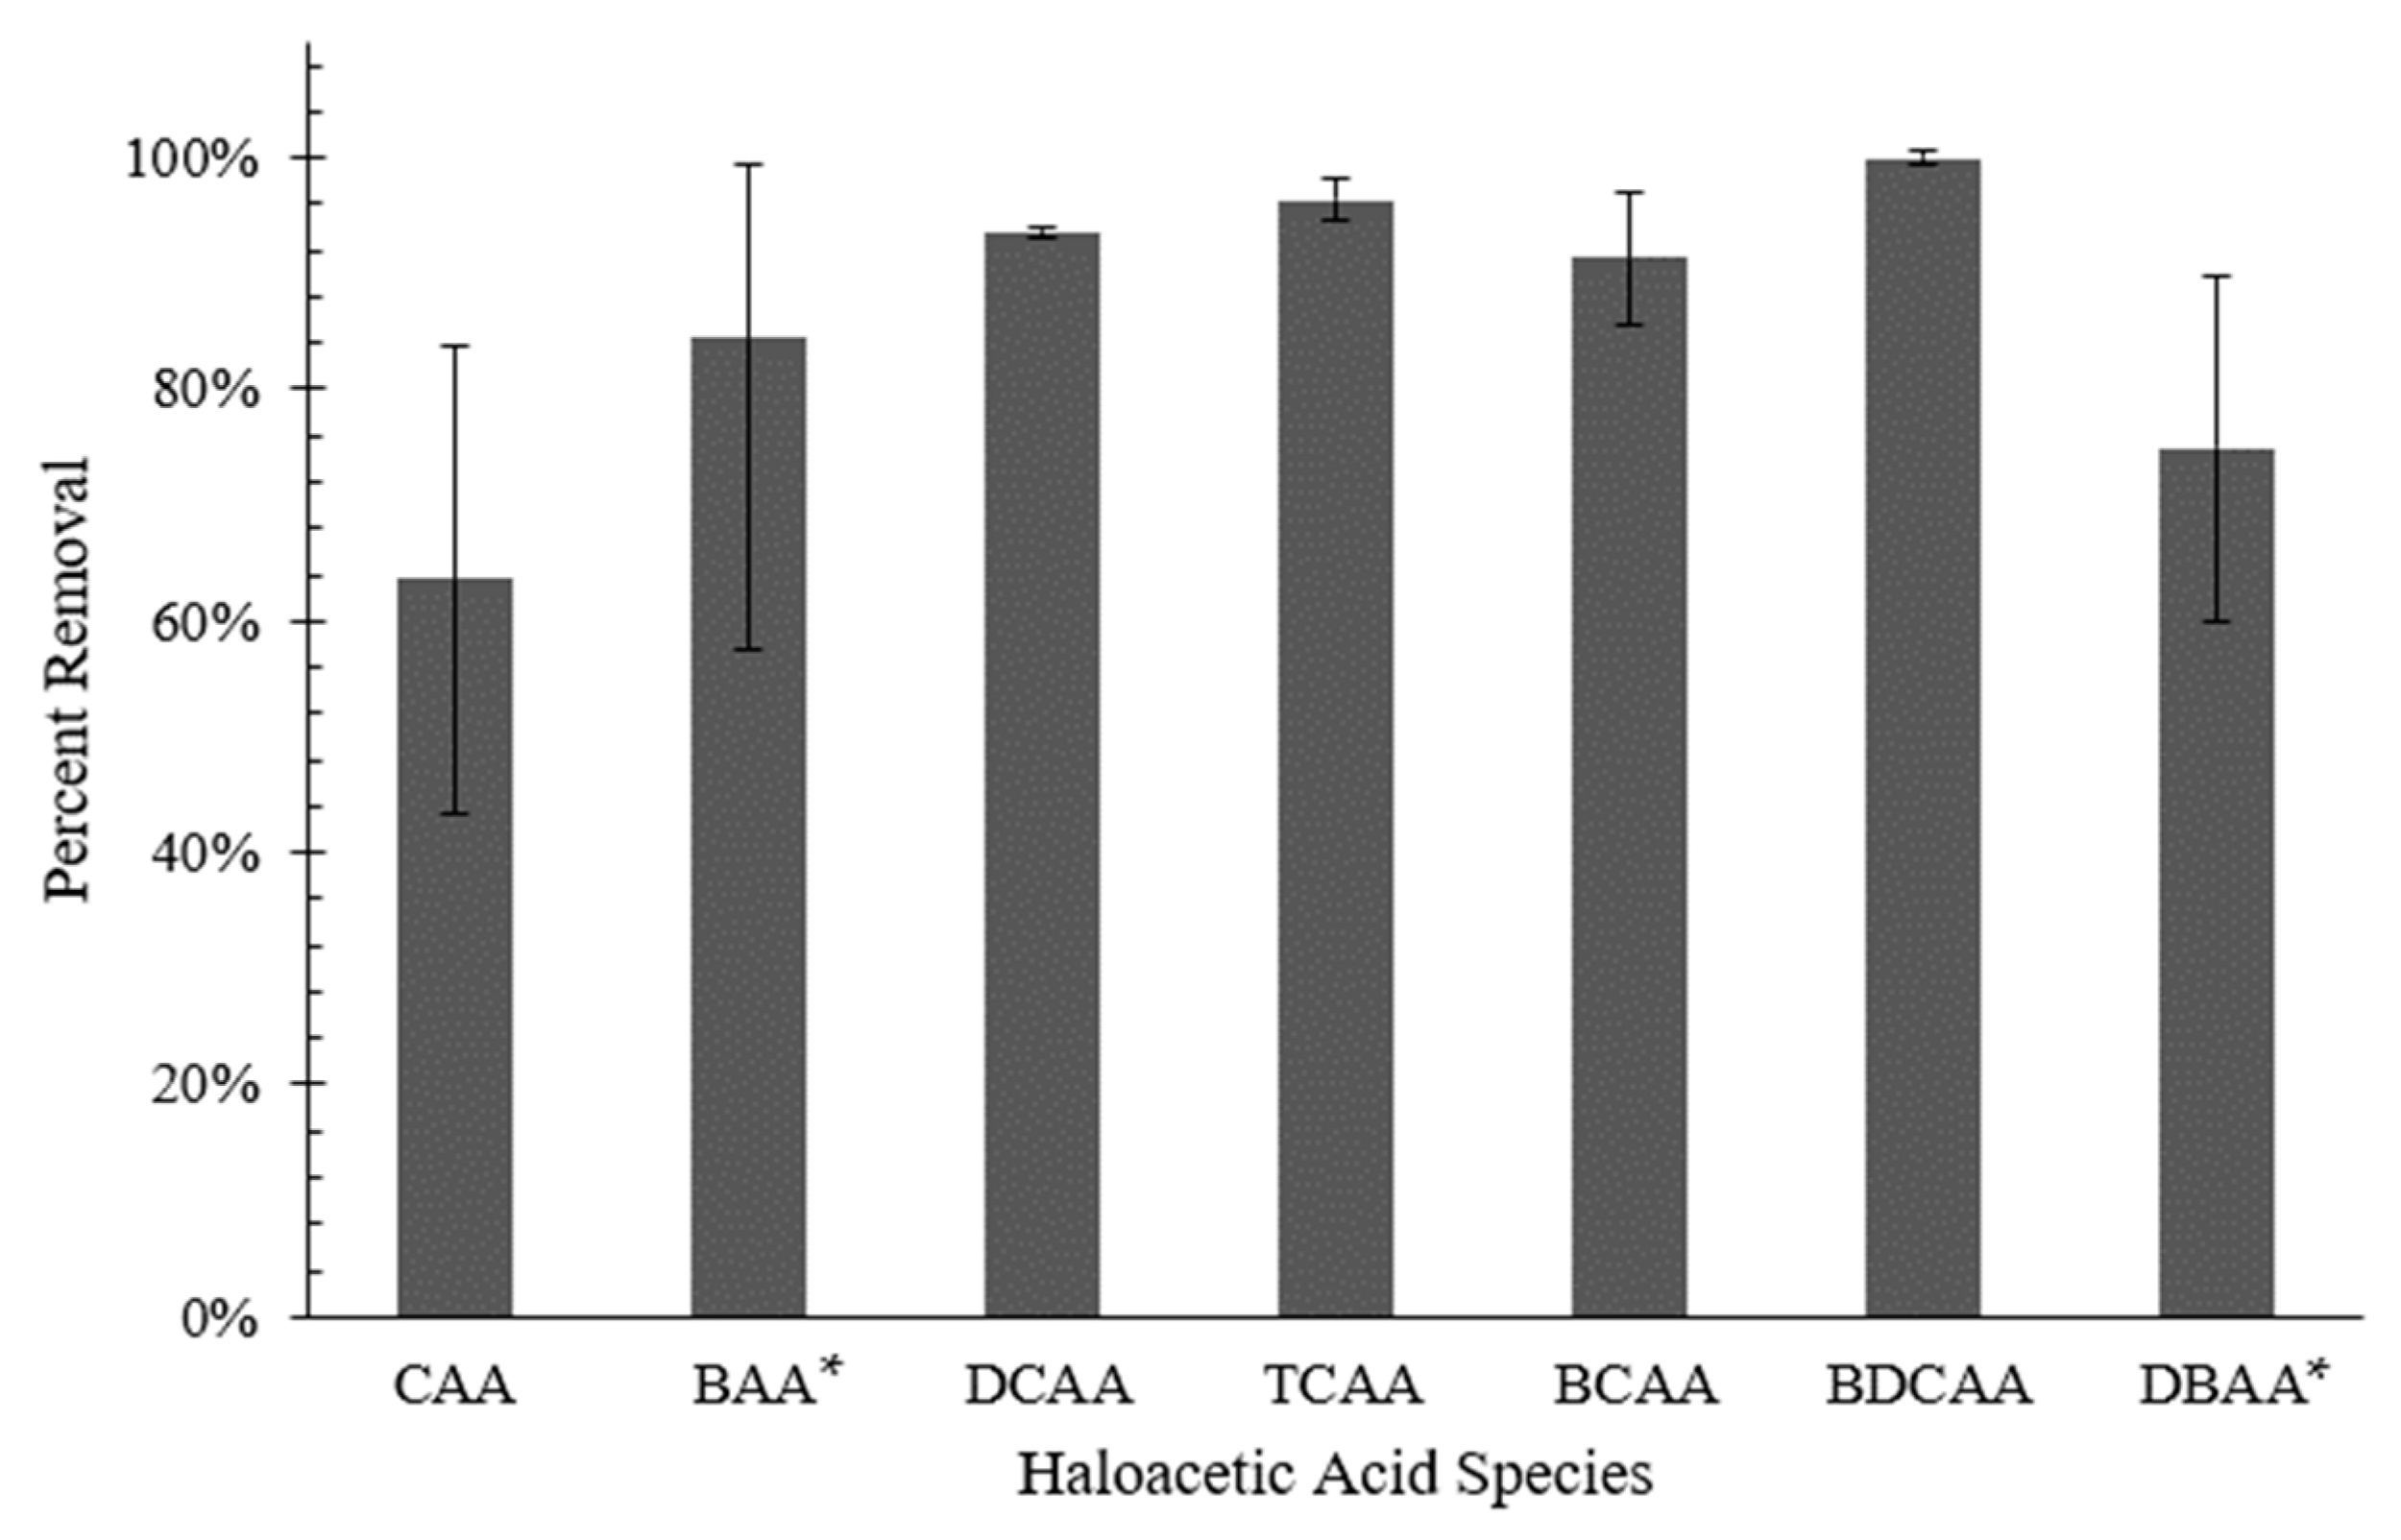
The recirculating batch reactor experiments were used to assess the total biodegradability of HAAs (Figure 4). HAA biodegradation removals (n = 9) from highest to lowest consisted of BDCAA (100 ± 1%), TCAA (96 ± 2%), DCAA (94 ± 1%), BCAA (91 ± 6%), BAA (84 ± 27%), DBAA (75 ± 15%), and CAA (64 ± 20%). While BAA and DBAA were consistently formed below the level of quantification, they were formed at detectable levels and thus included in the analysis. Overall, total biodegradation removals were similar across all compounds, with the tri-HAA (BDCAA and TCAA) removal efficiency slightly higher than that of the di-HAAs and the mono-HAAs. Historically, biofiltration preferentially removes mono- or di-HAAs [27,36], yet previous studies did not investigate recirculating batch reactors. Thus, this study demonstrated that the tri-HAAs can be effectively biodegraded similarly to mono- or di-HAAs when the rate of reaction is not a limiting step.

3.5. HAA Single Pass Removal

The single-pass plug flow reactor experiments were used to simulate HAA biofilter removal at EBCTs of 5, 15, and 30 min (Figure 5). The di-HAAs (DCAA, BCAA, and DBAA) saw similar patterns of biodegradation removal across the biofilter. At EBCT of 5 min, the removals were 53 ± 7%, 54 ± 8%, and 47 ± 12% for DCAA, BCAA, and DBAA, respectively. After an EBCT of 15 min, the original concentrations were reduced by 75 ± 2%, 78 ± 8%, and 67 ± 15% for DCAA, BCAA, and DBAA, respectively. After an EBCT of 30 min, the original concentrations were reduced by 82 ± 4%, 86 ± 4%, and 75 ± 2%, respectively, for DCAA, BCAA, and DBAA. Mono-HAAs (CAA and BAA) saw different removal patterns, as BAA was removed by 71 ± 4% (EBCT 5 min), 91 ± 15% (EBCT 15 min), and 100 ± 0% (EBCT 30 min), and CAA was removed by 58 ± 5 % (EBCT 5 min), 69 ± 4% (EBCT 15 min), and 71 ± 3% (EBCT 30 min). The tri-HAAs (TCAA and BDCAA) saw more removal with extended EBCTs, as removal increased from 6 ± 7% for TCAA and 20 ± 19% for BDCAA at an EBCT of 5 min, to 26 ± 20% for TCAA and 67 ± 15% for BDCAA, respectively, at an EBCT of 15 min, to 53 ± 10% for TCAA and 80 ± 18% for BDCAA at EBCT of 30 min. Although TCAA saw higher removals initially in the biofilter, BDCAA was consistently removed more efficiently than TCAA at an EBCT of 30 min. No significant difference was observed between the biodegradation of brominated HAAs and chlorinated HAAs.
Overall, an average of 44 ± 23% removal of HAA compounds occurred at an EBCT of 5 min. All but two compounds, TCAA and BDCAA, were removed by 45% or more, similarly to the results of Wu and Xie [36], who found that an EBCT of 5 min effectively removes 50% of HAAs in waters above 20 °C. Extending the EBCTs to 15 min provided an extra 10–26% removal. This finding is consistent with a previous study by Ratasuk et al. [37], who found an EBCT of 20 min removed HAAs by 90%. Extending the EBCTs to 30 min did not result in further removal of HAAs, indicating that operational EBCTs ranging from 5 to 15 min are most effective for removing HAAs generated during the drinking water treatment process due to pre-oxidation.

4. Conclusions

Although the USEPA Disinfection Byproduct Rule has been in place since 2006 in its current Stage 2 form, compliance remains a challenge for many utilities in the United States, as they struggle to keep regulated DBPs below the designated MCLs. This challenge may be exacerbated by future regulations, which are anticipated given the inclusion of all bromo-chlorinated HAAs in the USEPA Fourth Unregulated Contaminant Monitoring Rule and Fifth Contaminant Candidate List. In this study, biofiltration, utilizing fresh GAC media in combination with acclimated anthracite media, was found to effectively remove HAA9 concentrations by 77–100%. A small layer of GAC (EBCT 2.5 min) can provide some removal of pre-formed HAAs and quench the disinfectant residual, allowing an acclimated biofilter to subsist in the underlying layers. These findings suggest that utilities employing a pre-oxidant in their treatment system should consider incorporating a filter comprising a thin layer of GAC, optimized for the disinfectant residual present, followed by a biofilter layer with an EBCT ranging from 5 to 15 min to achieve optimal removal rates of HAA compounds formed during treatment. Future research studies should investigate HAA9 formation and removal seasonally through a full-scale treatment plant.

Author Contributions

Conceptualization, L.G.T.; data curation, M.V.; formal analysis, M.V. and L.G.T.; funding acquisition, L.G.T.; investigation, M.V.; methodology, L.G.T.; project administration, L.G.T.; resources, L.G.T.; supervision, L.G.T.; writing—original draft, M.V.; writing—review and editing, M.V. and L.G.T. All authors have read and agreed to the published version of the manuscript.

Funding

This research was funded by the National Science Foundation “RII Track-2 FEC: IGM--A Framework for Harnessing Big Hydrological Datasets for Integrated Groundwater Management,” Grant No. OIA-2019561.

Data Availability Statement

The data gathered and analyzed in this study are presented within the article.

Acknowledgments

The authors would like to thank Dorothy Noble at the University of Colorado Boulder for her assistance in the HAA analysis process. The authors would also like to thank the Alabama Water Institute for funding publishing fees.

Conflicts of Interest

The authors declare no conflict of interest.

References

  1. Cutler, D.; Miller, G. The role of public health improvements in health advances: The twentieth-century United States. Demography 2005, 42, 1–2. [Google Scholar] [CrossRef] [PubMed]
  2. Richardson, S.D.; Plewa, M.J.; Wagner, E.D.; Schoeny, R.; DeMarini, D.M. Occurrence, genotoxicity, and carcinogenicity of regulated and emerging disinfection by-products in drinking water: A review and roadmap for research. Mutat. Res. Rev. Mutat. Res. 2007, 636, 178–242. [Google Scholar] [CrossRef]
  3. Krasner, S.W.; McGuire, M.J.; Jacangelo, J.G. Occurrence of disinfection by-products in US drinking water. J. Am. Water. Work. Assoc. 1989, 81, 41–53. [Google Scholar] [CrossRef]
  4. USEPA (U.S. Environmental Protection Agency). Water: Stage 2 DBPR 2012. Available online: http://water.epa.gov/lawsregs/rulesregs/sdwa/stage2/compliance.cfm (accessed on 20 March 2023).
  5. Sawade, E.; Fabris, R.; Humpage, A.; Drikas, M. Effect of increasing bromide concentration on toxicity in treated drinking water. J. Water Health 2015, 14, 183–191. [Google Scholar] [CrossRef] [PubMed] [Green Version]
  6. Kolb, C.; Francis, R.A.; VanBriesen, J.M. Disinfection byproduct regulatory compliance surrogates and bromide-associated risk. J. Environ. Sci. 2017, 58, 191–207. [Google Scholar] [CrossRef]
  7. EPA. Monitoring Unregulated Contaminants in Drinking Water. EPA 2022. Available online: https://www.epa.gov/dwucmr (accessed on 20 March 2023).
  8. VanBriesen, J.M. Potential Drinking Water Effects of Bromide Discharges From Coal-Fired Electric Power Plants; Formal Comments of the Environmental Integrity Project et al. on the Effluent Limitations Guidelines and Standards for the Steam Electric Power Generating Point Source Category, Appendix B of Water Docket EPA-HQ-OW-2009-0819-4687; EPA: Washington, DC, USA, 2013; pp. 1–38.
  9. Magazinovic, R.S.; Nicholson, B.C.; Mulcahy, D.E.; Davey, D.E. Bromide levels in natural waters: Its relationship to levels of both chloride and total dissolved solids and the implications for water treatment. Chemosphere 2004, 57, 329–335. [Google Scholar] [CrossRef]
  10. Xue, R.; Xue, R.; Shi, H.; Ma, Y.; Yang, J.; Hua, B.; Inniss, E.C.; Adams, C.D.; Eichholz, T. Evaluation of thirteen haloacetic acids and ten trihalo-methanes formation by peracetic acid and chlorine drinking water disinfection. Chemosphere 2017, 189, 349–356. [Google Scholar] [CrossRef]
  11. Ged, E.C.; Boyer, T.H. Effect of seawater intrusion on formation of bromine-containing trihalomethanes and haloacetic acids during chlorination. Desalination 2014, 345, 85–93. [Google Scholar] [CrossRef]
  12. Li, Z.; Clark, R.M.; Buchberger, S.G.; Yang, Y.J. Evaluation of Climate Change Impact on Drinking Water Treatment Plant Operation. J. Environ. Eng. 2014, 140, 824. [Google Scholar] [CrossRef]
  13. Kolb, C.; Pozzi, M.; Samaras, C.; VanBriesen, J.M. Climate Change Impacts on Bromide, Trihalomethane Formation, and Health Risks at Coastal Groundwater Utilities. ASCE-ASME J. Risk Uncertain. Eng. Syst. Part A Civ. Eng. 2017, 3, 04017006. [Google Scholar] [CrossRef]
  14. Motz, L.H.; Kurki-Fox, J.; Ged, E.C.; Boyer, T.H. Increased Total Dissolved Solids, Chloride, and Bromide Concentrations Due to Sea-Level Rise in a Coastal Aquifer. In Proceedings of the World Environmental and Water Resources Congress 2014, Portland, OR, USA, 1–5 June 2014. [Google Scholar] [CrossRef]
  15. Xie, Y.F.; Zhou, H. Use of BAC for HAA removal—Part 2, column study. J. Am. Water Work. Assoc. 2002, 94, 126–134. [Google Scholar] [CrossRef]
  16. Kim, J.; Kang, B. DBPs removal in GAC filter-adsorber. Water Res. 2008, 42, 145–152. [Google Scholar] [CrossRef] [PubMed]
  17. Sinha, R.; Gupta, A.K.; Ghosal, P.S. A review on Trihalomethanes and Haloacetic acids in drinking water: Global status, health impact, insights of control and removal technologies. J. Environ. Chem. Eng. 2021, 9, 106511. [Google Scholar] [CrossRef]
  18. Tung, H.-H.; Xie, Y.F.; Evaluate, H.A.A. Removal in biologically active carbon filters using the ICR database. Front. Environ. Sci. Eng. China 2011, 5, 489–496. [Google Scholar] [CrossRef]
  19. Tung, H.H.; Unz, R.F.; Xie, Y.F. HAA removal by GAC adsorption. J.-Am. Water Work. Assoc. 2006, 98, 107–112. [Google Scholar] [CrossRef]
  20. Urfer, D.; Huck, P.M.; Booth, S.D.J.; Coffey, B.M. Biological filtration for BOM and particle removal: A critical review: The authors review key parameters and engineering variables influencing biological filtration and identify areas requiring further research. J. Am. Water Work. Assoc. 1997, 89, 83–98. [Google Scholar] [CrossRef]
  21. Terry, L.G.; Summers, R.S. Biodegradable organic matter and rapid-rate biofilter performance: A review. Water Res. 2018, 128, 234–245. [Google Scholar] [CrossRef]
  22. Chen, F.; Peldszus, S.; Elhadidy, A.M.; Legge, R.L.; Van Dyke, M.I.; Huck, P.M. Kinetics of natural organic matter (NOM) removal during drinking water biofiltration using different NOM characterization approaches. Water Res. 2016, 104, 361–370. [Google Scholar] [CrossRef]
  23. Peleato, N.M.; McKie, M.; Taylor-Edmonds, L.; Andrews, S.A.; Legge, R.L.; Andrews, R.C. Fluorescence spectroscopy for monitoring reduction of natural organic matter and halogenated furanone precursors by biofiltration. Chemosphere 2016, 153, 155–161. [Google Scholar] [CrossRef]
  24. Liu, C.; Olivares, C.I.; Pinto, A.J.; Lauderdale, C.V.; Brown, J.; Selbes, M.; Karanfil, T. The control of disinfection byproducts and their precursors in biologically active filtration processes. Water Res. 2017, 124, 630–653. [Google Scholar] [CrossRef]
  25. Vines, M.; Terry, L.G. Evaluation of the biodegradability of fluorescent dissolved organic matter via biological filtration. AWWA Water Sci. 2020, 2, 1201. [Google Scholar] [CrossRef]
  26. Grigorescu, A.S.; Hozalski, R.M. Modeling HAA biodégradation in biofilters and distribution systems. J. Am. Water Work. Assoc. 2010, 102, 67–80. [Google Scholar] [CrossRef]
  27. Tang, H.L.; Xie, Y.F. Biologically active carbon filtration for haloacetic acid removal from swimming pool water. Sci. Total. Environ. 2016, 541, 58–64. [Google Scholar] [CrossRef]
  28. Li, J.; Zhang, Y.; Zhou, Y.; Bian, Y.; Hu, C.; Wang, Z.-H.; Feng, X.-S. Haloacetic Acids in the Aquatic Environment. Sep. Purif. Rev. 2022, 2002, 1–25. [Google Scholar] [CrossRef]
  29. Moore, B.C.; Cannon, F.S.; Westrick, J.A.; Metz, D.H.; Shrive, C.A.; DeMarco, J.; Hartman, D.J. Changes in GAC pore structure during full-scale water treatment at Cincinnati: A comparison between virgin and thermally reactivated GAC. Carbon 2001, 39, 789–807. [Google Scholar] [CrossRef]
  30. Hong, L.; Wang, W.; Gao, D.; Liu, W. Critical pore size for micropore filling in coal samples with different rank coals. PLoS ONE 2022, 17, e0264225. [Google Scholar] [CrossRef]
  31. Terry, L.G.; Pruisner, P.; Peterson, E.; Dickenson, E.; Wang, J.; Summers, R.S. Scale-Up Methodology for Biological Filtration Removal of Dissolved Organic Matter. Environ. Eng. Sci. 2019, 36, 405–412. [Google Scholar] [CrossRef]
  32. de Vera, G.A.; Lauderdale, C.; Alito, C.L.; Hooper, J.; Wert, E.C. Using upstream oxidants to minimize surface biofouling and improve hydraulic performance in GAC biofilters. Water Res. 2019, 148, 526–534. [Google Scholar] [CrossRef]
  33. Young, T.R.; Deem, S.; Leslie, J.C.; Salo-Zieman, V.; He, H.; Dodd, M.C. Drivers of disinfection byproduct formation and speciation in small, chlorinated coastal groundwater systems: Relative roles of bromide and organic matter, and the need for improved source water characterization and monitoring. Environ. Sci. Water Res. Technol. 2020, 6, 3361–3379. [Google Scholar] [CrossRef]
  34. Pharand, L.; Van Dyke, M.I.; Anderson, W.B.; Huck, P.M. Assessment of biomass in drinking water biofilters by adenosine triphosphate. J. Am. Water Work. Assoc. 2014, 106, E433–E444. [Google Scholar] [CrossRef] [Green Version]
  35. Baird, R.; Bridgewater, L. Standard Methods for the Examination of Water and Wastewater, 23th ed.; American Public Health Association: Washington, DC, USA, 2012. [Google Scholar]
  36. Wu, H.; Xie, Y.F. Effects of EBCT and Water Temperature on HAA Removal using BAC. J. Am. Water Work. Assoc. 2005, 97, 94–101. [Google Scholar] [CrossRef]
  37. Ratasuk, C.; Kositanont, C.; Ratanatamskul, C. Removal of haloacetic acids by ozone and biologically active carbon. Sci. Asia 2008, 34, 293–298. [Google Scholar] [CrossRef]
Figure 1. Bench-scale granular activated carbon filter followed by an anthracite biofilter (operated in three-column series) via recirculating batch reactor method (dotted red line) and single-pass flow-through method (solid blue line) as detailed in Terry et al., 2019. GAC, granular activated carbon; EBCT, empty bed contact time; recirc., recirculating.
Water 15 01445 g001
Figure 2. Concentrations of chloroacetic acid (CAA), bromoacetic acid (BAA) *, dichloroacetic acid (DCAA), trichloroacetic acid (TCAA), bromochloroacetic acid (BCAA), bromodichloroacetic acid (BDCAA), and dibromoacetic acid (DBAA) * in tap water alone (n = 3) and formed in brominated tap water (n = 18). ppb = parts per billion. * below the limit of quantification. Error bars depict standard deviation.
Water 15 01445 g002
Figure 3. Percent removal of chloroacetic acid (CAA), bromoacetic acid (BAA) *, dichloroacetic acid (DCAA), trichloroacetic acid (TCAA), bromochloroacetic acid (BCAA), bromodichloroacetic acid (BDCAA), and dibromoacetic acid (DBAA) * after granular activated carbon (GAC) media filtration (n = 18 for each HAA). The box plot represents percentiles, with the center line representing the 50th percentile, the outsides of the box representing the 25th and 75th percentiles, and the lines outside of the box representing the 0th and 100th percentiles. Outliers from the data set are represented by the circles outside of the boxes. * Below the limit of quantification.
Water 15 01445 g003
Figure 4. Percent removal of chloroacetic (CAA), bromoacetic (BAA) *, dichloroacetic (DCAA), trichloroacetic (TCAA), bromochloroacetic (BCAA), bromodichloroacetic (BDCAA), and dibromoacetic (DBAA) * acids after the recirculating batch reactor experiments. n = 9. * Formed below the limit of quantification. Error bars represent standard deviation.
Water 15 01445 g004
Figure 5. Removal of chloroacetic (CAA), bromoacetic (BAA) *, dichloroacetic (DCAA), trichloroacetic (TCAA), bromochloroacetic (BCAA), bromodichloroacetic (BDCAA), and dibromoacetic (DBAA) * acids after a single pass through a biological filter. EBCT = empty bed contact time. N = 9. * Formed below the limit of quantification. Error bars represent standard deviation.
Water 15 01445 g005
Table 1. The nine brominated and chlorinated haloacetic acids (HAAs) and their common abbreviations and structures. This study focuses on the first seven.
AnalyteAbbreviationChemical FormulaDesignation
Chloroacetic acidCAAC2H3ClO2HAA5
Dichloroacetic acidDCAAC2H2Cl2O2HAA5
Trichloroacetic acidTCAAC2HCl3O2HAA5
Bromoacetic acidBAAC2H3BrO2HAA5
Dibromoacetic acidDBAAC2H2Br2O2HAA5
Bromochloroacetic acidBCAAC2H2BrClO2HAA9
Bromodichloroacetic acidBDCAAC2HBrCl2O2HAA9
Chlorodibromoacetic acidCDBAAC2HBrClO2HAA9
Tribromoacetic acidTBAAC2HBr3O2HAA9
Notes: HAA5 = sum of 5 HAAs regulated by the United States Environmental Protection Agency (USEPA); HAA9 = sum of all 9 HAAs, including those brominated HAAs not currently regulated by the USEPA.
Table 2. Br to Cl ratios by weight and water quality parameters for bromine-spiked feed water (n = 6).
Br/Cl (×10−3)UV254 (cm−1) *DOC (mg/L) *SUVA *Ph *
3.11 ± 0.50.019 ± 0.0021.67 ± 0.501.22 ± 0.257.46 ± 0.05
Notes: UV254 = ultraviolet absorbance at a wavelength of 254 nm; DOC = dissolved organic carbon; SUVA = specific ultraviolet absorbance * average for n = 18 samples. Difference represents standard deviation.
Disclaimer/Publisher’s Note: The statements, opinions and data contained in all publications are solely those of the individual author(s) and contributor(s) and not of MDPI and/or the editor(s). MDPI and/or the editor(s) disclaim responsibility for any injury to people or property resulting from any ideas, methods, instructions or products referred to in the content.