Article

Experimental Investigation of Fluid Flow through Zinc Open-Cell Foams Produced by the Excess Salt Replication Process and Suitable as a Catalyst in Wastewater Treatment

1
Laboratory of Biomaterials and Transport Phenomena (LBMTP), University Yahia Fares, Medea 26000, Algeria
2
Laboratoire de Génie des Procédés Chimiques, Department of Process Engineering, University of Ferhat Abbas, Setif 19000, Algeria
3
Faculty of Sciences, University of Medea, Nouveau Pole Urbain, Medea 26000, Algeria
4
Department of Chemical Engineering, Faculty of Process Engineering, University of Salah Boubnider Constantine 3, Constantine 25000, Algeria
5
Research Unit on Analysis and Technological Development in Environment (URADTE-CRAPC), BP 384, Bou-Ismail, Tipaza 42004, Algeria
6
Ecole Nationale Supérieure de Chimie de Rennes, Centre National de la Recherche Scientifique (CNRS), ISCR—UMR6226, University Rennes, F-35000 Rennes, France
7
School of Engineering, Merz Court, Newcastle University, Newcastle upon Tyne NE1 7RU, UK
8
Laboratory of Management and Valorization of Natural Resources and Quality Assurance, SNVST Faculty, Akli Mohand Oulhadj University, Bouira 10000, Algeria
*
Authors to whom correspondence should be addressed.
Water 2023, 15(7), 1405; https://doi.org/10.3390/w15071405
Submission received: 22 January 2023 / Revised: 25 March 2023 / Accepted: 31 March 2023 / Published: 4 April 2023

Abstract

:
The “excess salt replication process” is a new simple method of fabrication of open-cell metal foam based on the commonly known salt replication method. Porous materials with porosity between 46% and 66% result when the employed alloy is 25% antimonial lead alloy and when it is 58% to 65% zamak 5. These foams are proposed as structured catalysts instead of packed beds in the treatment of wastewater. The local regimes influencing macroscopic air flow behaviour through these foams are delimited and boundaries are analysed in terms of sample length. Most of the experimental tests in this work exhibited a general trend of air flow in ESR foams dominated by the “strong inertia regime”. It was established that the law governing the unidirectional air flow through these foams was the full cubic law. The permeability and inertia coefficient of five samples with a cell diameter between 2.5 and 4.5 mm were calculated, and an empirical correlation was fitted. The irregular cuboid shape of salt grains used in the ESR foam was the origin of the special cell form of ESR foams leading to an anisotropic ordered porous media. This can explain the macroscopic turbulence of air flow because there were many dead zones present in the corner of each cubic cell, thus causing kinetic energy loss starting at earlier regimes.

1. Introduction

Recently, many industrial applications of open-cell metal foams have been reported due to their remarkable combination of properties [1]. They can be used as energy absorbers in packaging, coating, and (more often) in thermal applications such as in heat exchangers [2]. This is especially true when the metal matrix is fabricated with good thermal conductors such as aluminium [3]. They can also be employed as filters for high-temperature gas and fluids [4]. Magnetite wash-coated metal foams were found to be an effective cathode for electro-Fenton systems for removing dyes in wastewater [5,6,7] because when employed as conducting and porous catalyst supports, they maximize the reaction efficiency by increasing the exposed surface area of the cathode and minimize mass transport limitations.
Furthermore, the foams could be easily lifted up from the treated water, leaving no sludge and no magnetite powder in the solution after wastewater treatment [5].
Thus, open-cell foams usually made of aluminium can be used as catalytic support for biodegradation filters. Good thermal conductivity, elevated corrosion resistance, low melting temperature, and high fluidity promotes zinc alloys to make them a strongly competitive cellular material with aluminium and magnesium alloys, particularly when a good benefit is reached in comparison to the cost of fabrication. Zinc foams with moderate porosity (~60%) are believed to be a promising alternative for traditional catalysts and packed beds due to their surface area density, interesting thermal conductivity, and good fluid flow permeability. These attributes motivated this research.
Sahu and Ansari [8] discussed the most popular manufacturing processes for Zn–Al foams, namely powder metallurgy [9] and liquid metallurgy (stir casting) [10]. The former method is less popular in practice due to high manufacturing cost. The latter one is mostly preferred for materials with low melting temperature, but stabilizing agents are mixed with the molten metal to attain an optimum melt viscosity and avoid the rise and collapse of the bubbles.
For several decades, a lot of different studies on fluid flow through each new foam were conducted. In this paper, the air flow through open-cell foams resulting from a new variant of the salt replication process was used in order to gain insight on their morphology (mesostructure). This process, which belongs to the space holder technics, was named “excess salt replication process” (abbreviated as ESR Process) [11]. Different forms and shapes of cellular materials with different alloys have been successfully fabricated with this process. Cells produced by this process have the same shape as the space holder particles (salt), providing an easy way to control the cell shape. The zinc alloy used with this process to elaborate the foams in question was zamak 5 because of its commercial availability. According to our knowledge, no one has tried this method with this alloy before.
Many researchers have confirmed that the manufacturing process strongly influences the foam’s properties, which in turn has a direct impact on their applications, as reported by Dukhan [12], because of the relationship between intrinsic properties of the cells and the different thermal and hydrodynamic transports. Savaci et al. [13] and Banhart [14] noted that the maximum porosities that can be achieved using space holders are limited to values below 80%. This research studied the transport of air in these ESR open-cell foams with porosities generally of 60%. Porous metals with low porosity are more attractive in chemical catalysis, but they are rarely reported in the literature [15].
The unique morphology of every new open-cell foam and the absence of general laws or rules relating their properties with their transport behaviour initially led to the building of an experimental database in this work. To our knowledge, such work has not been reported before.

2. Materials and Methods

Flow Laws

Permeability indicates the material’s ability to allow the passage of a fluid, and each porous medium has its own permeability. If the open-cell metal foam had lower resistance to fluid flow through, the energy spent on driving it is lower. With known permeability for a particular porous medium, the control of fluid flow, internal residual time, optimal flow analysis, and practical designs can be carried out.
The permeability of open-cell porous materials has been the subject of several prior investigations. Special attention was given to low-density microcellular metals of the type derived from polyurethane foams: rigid and “hyperporous” materials [16] made with the best thermal or electrical conductors or noble materials for special applications. However, understanding fluid flow performance in porous materials with a porosity between 0.4 and 0.8 is necessary. This paper contributes experimentally to improve this understanding.
Recently, there was a general agreement on the classification of flow regimes in porous media. According to this classification, flow regimes are generally characterized by the dimensionless number (the Reynolds number (Re)), which has the following changes (from small to large Re): Darcy, transition from Darcy to Forchheimer (Weak inertia), Forchheimer (strong inertia), transition from Forchheimer to turbulence (we will call it strong transition), and turbulence [17]. Some researchers [15,18,19] reported the existence of a pre-Darcy regime at very low velocity whose data are very scarce because of the difficulty of measuring an ultra-low pressure drop and velocity.
The Reynolds number Re based on cell diameter (DC) is defined by Equation (1)
R e D c = ρ v l μ = v l ν  
where ρ is the fluid density, which is air (kg m−3) in this study, v is the superficial velocity (known also as seepage velocity or Darcy velocity) (m s−1), l is the characteristic length (DC in this case) (m), μ is the dynamic viscosity of air (kg m−1s−1), and ν is the kinematic viscosity of air (m²s−1).
The flow at very low Reynolds (creeping flow) is governed by the famous Darcy’s law (Equation (2)), which assumes that viscous forces dominate over inertial forces in porous media; hence, inertial forces can be neglected:
P L = μ K   v
where ΔP/L is the pressure drop along the main flow z-direction, v is Darcy’s velocity, and K (m2) is the Darcy’s permeability of the foam of length L (m). It is obvious that this relation is linear in terms of v but only for lower velocities (v < 1 m s−1); then permeability can be deduced knowing μ. Creeping flows are difficult to sustain in the laboratory, and measurements of velocity and pressure drop are challenging, as these quantities may be too small to capture with good accuracy using common instruments, as stated by Dukhan [20], which is the case in this study.
For high Reynolds numbers (strong inertia regime), the empirical Forchheimer–Dupuit equation expressed by Equation (3) is often used in homogeneous porous media. Thus, Equation (2) became the sum of two terms: a viscous (v, Darcy’s law) term and an inertia (v²) term
Δ P L = μ K v + ρ β v 2
Equation (3) can be rearranged to Equation (4)
P v   L = μ K + ρ β v  
where K is the Forchheimer permeability, β is the inertia coefficient or the Forchheimer coefficient or form drag coefficient (m−1), and ρ is the fluid (air) density in (kg m−3). The coefficient β represents the blockage of the internal structure (ligaments, nodes, and occasional closed faces of open-cell metal foam) to the flow.
Mauroy et al. [21] reported a major problem when working on modelling flow through trees that arises from the fact that, due to inertial effects, Darcy’s law breaks down as a phenomenological description for large Reynolds numbers. Even at moderate Reynolds numbers, the inertial nonlinearities become relevant as compared to viscous effects. Firoozabadi et al. [22] concluded that Darcy’s law is inadequate to represent high-velocity flow and that the effect of gas properties does not account for high-velocity flow in porous media.
Andrade Jr et al. [23] investigated the origin of the deviations from the classical Darcy’s law by numerical simulation of the Navier–Stokes equations in two-dimensional disordered porous media. They applied the Forchheimer equation as a phenomenological model to correlate variations of the friction factor for different porosities and flow conditions. At sufficiently high Reynolds numbers, when inertia becomes relevant, they observed a transition from linear to nonlinear behaviour, which is typical of experiments. They found that such a transition can be understood and statistically characterized in terms of the spatial distribution of kinetic energy in the system. Then they concluded that the Forchheimer model should be valid for low Re and also for a limited range of high Re numbers, even when inertial nonlinearities can significantly affect the momentum transport at the pore scale.
Coulaud et al. [24] numerically solved the flow equations at a pore scale by introduction of a nonlinear term into Darcy’s equation (Equation (3)) to describe inertial effects in a porous medium modelled by cylinders of either equal or unequal diameters arranged in a regular pattern with a square or triangular base. This work corroborated certain experiments by confirming that Darcy’s and Forchheimer’s laws were only valid in well-established ranges of Reynolds numbers.
However, Takhanov [25] and Skjetne and Auriault [26] explained that as the flow rate (Reynolds number) increases, inertial forces become more significant, and Darcy’s law is generally corrected by a cubic term as in Equation (5)
P L = μ K v + C μ ρ 2 v 3
where K is the foam’s permeability (Darcy permeability) (m2), C is the weak inertia factor or dimensionless C—cubic factor (-). Weak inertia is a regime in which the inertial force is of the same order as the viscous force.
Sivanesapillai et al. [27], when discussing numerical results for macroscopically steady and unidirectional flow through a rigid fully saturated fibrous porous medium for Re up to 103, claimed that the necessity of using a cubic transition equation in the weak inertia regime, where the Forchheimer equation is often observed to fail, was quite possibly due to the fact that 𝛾 > 1 for certain pore space morphologies (while 𝛾 was a free parameter dictating the effective width of inertial transition).
Lage et al. [16] tried fitting their experimental results with a cubic law of the form in Equation (6)
P L = μ K v + ρ C f K 1 / 2 v 2 + C v 3
where the cubic term coefficient C had the units (Pa s3 m−4). They found that the permeability and the inertia coefficients were the same as the ones obtained interpolating the low velocity range. Thus, they concluded that the fitting of the high-velocity range was affected only by the cubic term.
Panfilov and Fourar [28] described an explicit model for the high flow rate obtained by Bues et al. in [29] when working on a macroscale model and viscous–inertia effects for Navier–Stokes flow in a radial fracture with corrugated walls, which was conducted by asymptotic expansions over a channel diameter that was much smaller than the channel length. The obtained series for a corrugated channel revealed a full cubic law for moderate Re~1–10 given by Equation (7)
P L = μ K v + β ρ v 2 α ρ 2 μ v 3
where the new parameters β′ and α′ can be negative or positive depending on channel geometry.
A general cubic formula including quadratic term, shown in Equation (8), has also been proposed by [16,30,31] to better depict flow in this transitional regime
P L = μ K v + C 1 ρ v 2 + C 2 ρ 2 μ   v 3
where C1 and C2 are dimensionless experimental parameters.
Rojas and Koplik [30] studied the flow of an incompressible liquid at a nonzero Reynolds number Re in a two-dimensional model porous medium via numerical simulation. The geometry was a random array of cylinders of square cross section. Additionally, they re-casted the reduced pressure drop equation (Equation (7)) into a fully dimensionless form using the Reynolds number based on the square root of permeability by defining a dimensionless pressure gradient normalized to Darcy flow (F) as F = 1 + b (Re) + c (Re)², where the coefficients b and c are dimensionless. A transition from linear Darcy flow at vanishing Re to a cubic transitional regime at low Re, and then a quadratic Forchheimer was found when Re = 1.
Venkataraman and Rao [32] demonstrated that the empirical power law of the form proposed by Missbach [33], as given in Equation (9), was simple in form and accurate enough to describe the behaviour of flow through porous media at large Reynolds numbers in practical field problems
i = b v m
where i is the hydraulic gradient, b is a coefficient depending upon the fluid and porous media properties, and m is an index; they are both to be determined experimentally. This law was not investigated during this study.
The conclusion is that the creeping flow and Forchheimer flow have been understood quite well in various porous media with different fluids, and various reasons were suggested by different researchers cited in [28] to explain the nonlinear relationship between pressure gradient and superficial velocity, but the situation at higher velocities has received less attention for relatively dense foams such as the ESR foams, which are the subject of this study.
All previous laws described very well packed beds and hyper-porous materials, and many outcomes have been established among what was reported. For instance, a single sample displayed completely distinct permeability constants depending only on the range of data chosen for analysis, and the Darcian permeability constant K had higher variation than the non-Darcian permeability constants [34].
In this paper, various air flow regimes were analysed, and their boundaries were established for the ESR foams. Works dedicated to such a delimitation of fluid flow regimes through such metal foams are very scarce. Among the most recent and modest studies purposely geared toward establishing various flow regimes from pre-Darcy to turbulent in porous media include the following: Yang et al. [35] experimentally investigated the flow domain division in beds packed with differently sized particles; Kundu et al. [36] investigated the flow in homogeneous and mixed isotropic porous media; Dukhan et al. [19] investigated the flow in 20 ppi/87% porous metal foams; and Chai et al. [31] investigated the flow in disordered porous media.
In fact, the pressure drop in a porous medium is supposed to be due to two effects related to the energy losses caused by both viscous and inertial attrition [37]. Different contributions of these last two effects on behaviour in open-cell foams made by the ESR process are to be expected because of their proper intrinsic rigid matrix and moderate porosity situated between packed beds (ε < 0.4) and hyper-porous materials (ε > 0.9).
To simplify the calculations, it is assumed that:
  • The flow is horizontal and uniform all along the main flow z-direction (Figure 2);
  • Air is treated as a monophasic Newtonian fluid;
  • The dense wall effect in our case is neglected because the tested foams are relatively dense [2];
  • The static gas pressure was constant throughout the porous medium and was equal to the difference between the inlet and outlet pressures of the test section.
Among the abundant literature on the calculation of the permeability K and the inertia coefficient C, there is no explicit agreement on the method of their calculations, and many discrepancies exist. This led Dukhan and Minjeur [38] to insist on the necessity of a distinction between the Darcy and Forchheimer permeabilities that was usually either absent or overlooked in several studies, which may lead to significant errors. This was also claimed earlier by Innocentini et al. [37] when they said that if experimental results were used only to predict permeability within a short range of low velocity, then the Darcian permeability term was reliable. On the other hand, if prediction of pressure drop at a higher flow rate was the purpose, errors could be high depending only on the velocity chosen. The current study compared three air flow laws: Forchheimer (Equation (4)), cubic (Equation (5)), and full cubic laws (Equation (8)). It also determined which law best describes the flow through the ESR foams using the minimum residuals method, as was conducted in [19]. However, the first step was to carefully delimit the flow regime in terms of superficial velocity for all foams. The permeability and fluid transport properties through these foams were obtained from least-squares fitting of the full cubic equation, and they are discussed.

3. Experimental Process

The extensive demand for inexpensive and good-quality open-cell metal foams has promoted the development of processes of replication for making these porous materials using salt, such as those in [39].
Figure 1 represents the ESR process steps to produce zamak 5 foams with porosities ranging from 58% to 65% and a salt grain size between 2.5 mm and 4.5 mm. This process has been attempted successfully with alloys of good fluidity and low melting temperature (below that of salt), such as a 25% antimony–lead alloy [11] and the zamak 5 alloy of this study. The four steps of this method are: metal fusion, excess salt compaction, cooling, and salt leaching.
Sieved salt was poured in a coated iron mould and manually shacked so that it arranged tightly in maximum-dense packing. A weighted disc of zamak 5 alloy was prepared by the same mould so that it would later fit and cover the top of the salt later, and this allows us to gain 15 mm of excess salt after fusion. When placed in a furnace at a temperature between that of melting the alloy and achieving salt fusion, infiltration occurs without the need to preheat the salt. Then with the perforated piston having the same internal mould diameter, the excess of salt was manually compacted so that any entrapped air in the foam is released from bottom and top through mould vents and 1 mm piston holes, respectively. This ensures, on the other hand, that salt grains contacted each other and remained immobilised when cooling at room temperature. This is where the appellation of “excess salt replication process” came from.
After cooling the samples, they were machined into discs and cylinders, microscopically inspected before and after leaching the salt with water for one night, then kept to dry at room temperature. Recently, Pola et al. [40] stated that zinc alloys could be a promising alternative to iron and magnesium as a new biodegradable metal [41]. This is because they offer a number of properties that make them particularly attractive for die casting manufacturing and, in general, for foundry technologies. For example, zamak 5 is available and widely used in die casting foundry [42], which makes it a very convenient porous metal obtained with the ESR process. The appellation of samples was ZkSX; “Zk” refers to the zamak 5 alloy, S refers to salt preform, and X refers to the salt grains size decimal diameter of grains of salt. D or T is added to each appellation to indicate the length of sample; D is for the disc when L ≤ 35 mm, and T is for the tube otherwise.
Every sample was carefully measured and weighted to determine ρ*, which is the apparent density. Porosity (ε) was determined by Equation (10)
ε = 1 ρ * ρ
where ρ is the commercial density of zamak 5 equal to 6400 kg m−3.
It is established that the permeability constant of a porous medium is a property of the medium and is independent of the fluid used in its determination [43]. Thus, our experiments of pressure drop measurements were conducted in an air channel facility as illustrated in Figure 2.
The experimental setup shown in Figure 2 consists of an open loop wind tunnel with a test cell in the middle, where the coated sample with suitable shrinkable tube was fixed horizontally to eliminate the effect of gravity. The tested sample was well coated and sealed because Akbarnejad et al. [44] proved that if the test medium is not well sealed, the measured parameter deviates greatly from its real value. An ambient air compressor was attached to one end. The pressure drop and temperature acquisition units were connected to the extremities of the test cell with adequate sensors.
The superficial velocity range considered in this work varied between 0.06 and 10 m s−1 depending on the flow sensors threshold. This is the range used in most practical applications [45].
The entrance effects and wall effects were avoided by the test cell geometry, which guaranteed good sealing and a suitable shrinkable tube to ensure that the average flow rate was representative of the foams tested [20].
In order to investigate the effect of sample dimensions on the limits of flow regimes, the tested foams were machined with a different length (L) in the flow direction (z-direction) but with about the same diameter of Φ = 38 mm (see Figure 2). A dimensionless number NCLD was defined by Equation (13) as the ratio between the number of cells in length of the sample (NCL) in the flow direction (Equation (11)) and the number of cells in the sample outer diameter (NCD) calculated by Equation (12). Table 1 summarises all morphological properties of the ESR foams tested.
N C L = L D C
N C D = Φ D C
N C L D = N C L N C D = L Φ

4. Results and Discussion

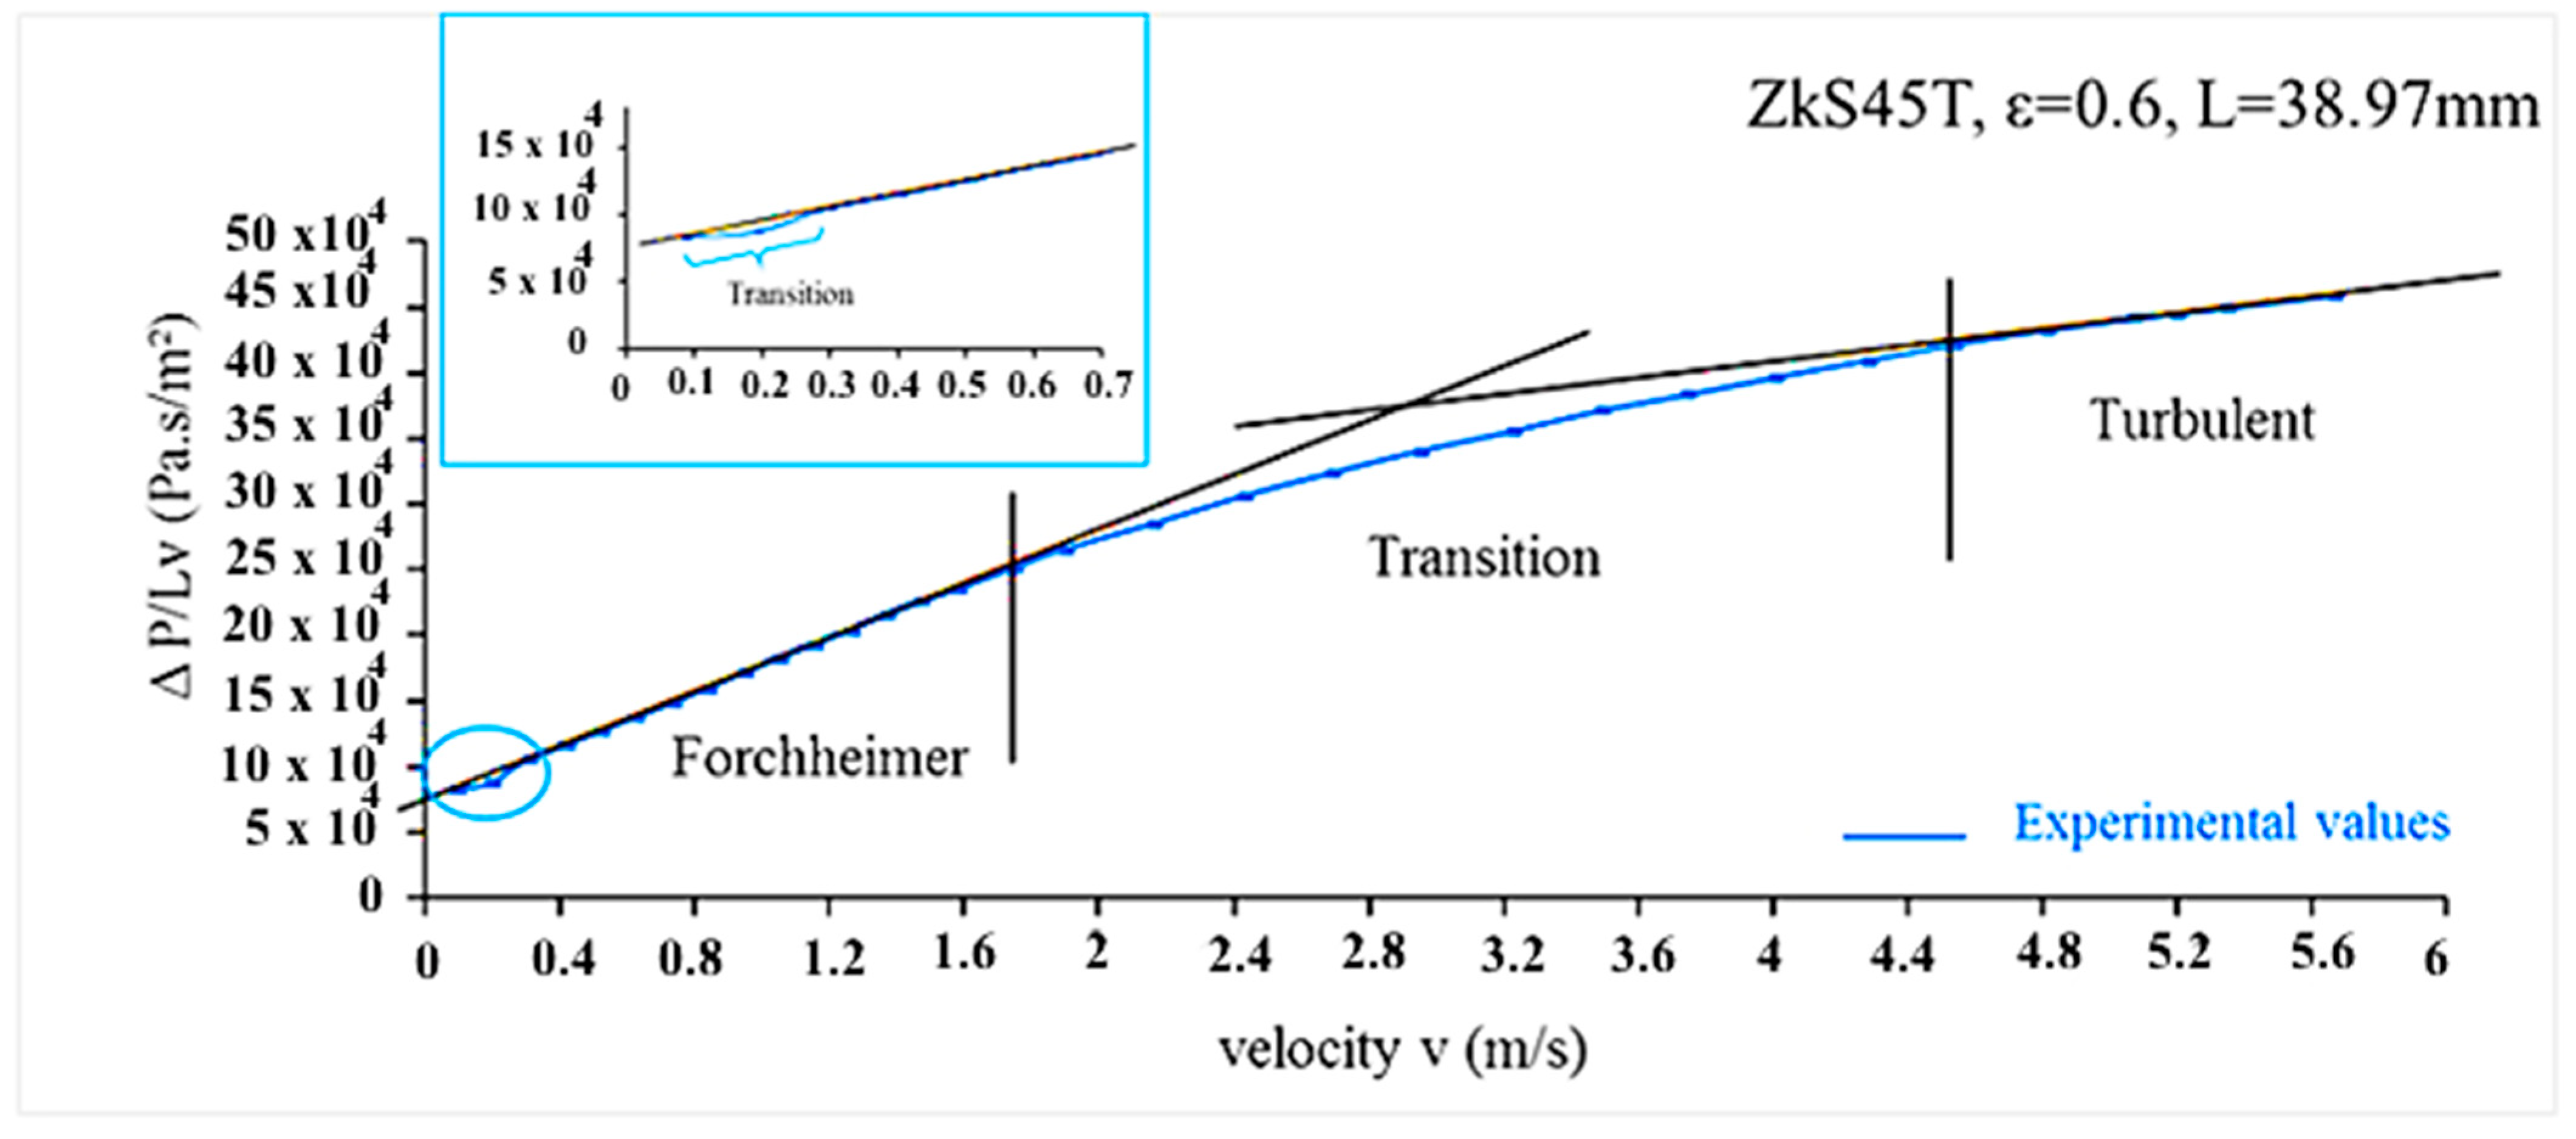
4.1. Description of Air Flow through ESR Foams

The goal of this research was to investigate the mesostructure of zamak foams obtained with the ESR process by studying the air flow through them, i.e., to discover which type of regimes are to be expected from these foams when air flows through them. This characterization is very deterministic to their industrial applications in view of the absence of a tomographic tool.
It is well known that porosity is a morphological property of open-cell metal foams that has a considerable impact on its structure. The wide range of porosities of metal foams in thermal and hydrodynamic applications has attracted the attention of many researchers. This is why during this study, every representation of ESR zamak foams was associated with its porosity and sample length.
In this section, the experimental results are discussed in terms of the superficial velocity due to a number of controversial characteristic lengths of the Reynolds numbers present in the literature. Figure 3 displays the variations of measured pressure drop per unit length of the foams versus the velocity of air flow. The general trends of the pressure drop were in qualitative agreement with previous studies such as those of [46,47].
The overlapping of the curves of ZkS35D and ZkS35T is because both samples were identical and cut from the same initial sample, but with two different lengths in the flow direction, in order to inspect the reproducibility and uniformity along the sample. The curves of pressure drop through ZkS40D and ZkS25D were superimposed and had the smaller pressure loss per unit of length because they had nearly the same high porosity and length among all samples. However, this method of data representation is ambiguous and does not depict the length effect of foam on the pressure drop. Many researchers have chosen a linear form of Equation (4) to clearly represent and distinguish individual regimes.
By comparing all the results together, it was clear that the general macroscale trends of the reduced pressure drop were in qualitative agreement with previous studies such as those of Dukhan and Patel [20]. Figure 4 shows the behaviour of the reduced pressure drop in terms of superficial velocity of all ESR samples, which is influenced by three important parameters: salt grain size (DC), length (L) in the main flow direction, and porosity (ε). Thus, the choice of each sample with a special combination of parameters (DC, L, and ε) was made on purpose. The pressure loss decreases with increased salt grain size (DC) and porosity (ε) of the samples [48], which supposes that permeability also increases in this case. However, when length (L) increases, the pressure drop increases as well. This was also confirmed by Paek et al. [49], who showed that as the cell size DC of a foam metal decreases, the surface-area-to-volume ratio increases, and this causes additional flow resistance, thus resulting in an increased pressure drop. The latter is substantially influenced by the void fraction as well as the shape of the cell of the metal foam. The effect of length (L) on pressure drop behaviour is quite clear between ZkS35D and ZkS35T, which both belong to the same sample and have only a 2% difference in porosity. This effect is detailed later.
Nevertheless, prior to deciding which law best describes the air flow through ESR foams, identification and delimitation of the different regimes present are required in order to define microscale behaviour.

4.2. Identification of Flow Regimes

Many studies do not give details of the flow within cells but instead give details on the flux-to-force governing laws at length scales including a large number of cells. However, comprehensive analyses at the pore scale remain the corner stone in any progress towards the derivation of governing laws at larger scales, as declared by Lasseux and Valdés-Parada [50]. In other words, the distinction between macroscale and microscale analyses of air flow through these foams is important.
This microscale behaviour was studied here by investigating the nature of local delimited regimes and which law described best the macroscale flow through these foams. The macroscale flow referred to entire flow regime, meaning that the full range data of reduced pressure drop as a function of superficial velocity was considered. It is believed that the macroscale flow was influenced by one of the local microscale regimes. The relationship between these two scales was studied here.
It is worth noting that the available experimental equipment did not allow us to precisely capture the onset of viscous effects (pre-Darcy and Darcy’s regime). The deviation of experimental data from linearity was clear, which is presumably due to the presence of different regimes corresponding to each portion. The flow regimes were identified by slope changes in each portion of the reduced pressure drop plots as in [18,35,36]. Most notably, experimental tests exhibited a general trend of air flow in ESR foams dominated by a “strong inertia regime”.
Zhong et al. [51] reported that it was almost impossible to define a universal boundary for the transition of regimes applicable to all kinds of porous media. Although some researchers presented a definite boundary of the Reynolds number for the regime transition (e.g., [52]), it depended on the properties of the porous material and the working fluid used. Nevertheless, no sharp transition between laminar and turbulent flow could be observed in porous media because flow through a complex cell structure significantly differed from flow in a conduit. This is confirmed in Figure 5; the macroscale transition from linear laminar Darcy flow to nonlinear laminar flow, and eventually to fully turbulent flow, is a gradual process. Each inset in Figure 5 represents the flow at low velocities; no Darcy regime was identified.
The nature of nonlinearity (transitional regimes) in the relationship between the macroscopic drag force and superficial velocity can be explained from the signature of viscous and inertial forces at the microscale. Pauthenet et al. [53] presented a review on historical developments aimed at including inertial and slip effects, respectively, when the Reynolds and Knudsen numbers are not exceedingly small compared to unity. On one hand, several mechanisms suggest that inertia alone, at the pore scale, can explain the macroscale behaviour. This may be put forth as: (i) streamlines bending due to the tortuosity of the structure and to local converging–diverging flow patterns; (ii) backflows and separations resulting from form drag; and (iii) pore networks actively involved in the flow that are velocity-dependent as a consequence of (i) and (ii) yielding variations in the dissipation of kinetic energy [23]. On the other hand, microscale viscous drag effects may be considered to contribute to the nonlinearity when boundary layers at the solid–fluid interfaces, which became thicker when the Reynolds number increases, were taken into account. With this mechanism, the inertial core flow (in the centre of the cells) may be easily understood as being strongly dependent upon the Reynolds number, thus partly explaining the different regimes.
These samples present an important pressure drop even for low velocities. The weak inertia zone was undetectable in the ZkS35D sample curve because of its short length and low porosity, and it was present but narrower than the Forchheimer regime in the strong transitional and turbulent zones for the remaining samples. The weak (transition D–F) and strong inertia (Forchheimer) regimes before instability appears were called “the stable flow” by Panfilov and Fourar [28]. All graphs displayed the inertial macroscopic behaviour of the flow through the samples, which was clearly revealed by the locally calculated air flow properties presented in the next section. In the first couple zones (transition D–F, Forchheimer regimes), a concurrence between viscous and inertia forces existed at the microscopic level with a constant stable flow. The term “concurrence” was used because the two forces coexisted together in all regimes, and naming each regime separately did not mean that each regime had a different mechanism [54]. Then from the transitional regime between Forchheimer and turbulent regimes and beyond, pure inertia effects dominated the flow, and instability governed the macroscopic flow. Additionally, the turbulent regime was reached earlier in the ZkS35T and ZkS35D with a high pressure drop.
This interpretation is related to the mesostructure of the foams. According to Kouidri and Madani [55], the surface roughness accelerates the reaching of the turbulent regime. Thus, in these two samples that have a high pressure drop and a significant roughness, there is no need for an important energy to reach the turbulent regime. Panfilov and Fourar [28] showed that inertia–viscous cross phenomena were negligible when the flow structure was clearly non-periodic. Thus, the ESR foam structure began to reveal itself. ZkS25D and ZkS40D samples exhibited a greater linearity trend of air flow than other samples, which is perhaps because of the large range of velocity in the experiments, given the fact that they were discs with the highest porosity but the lowest length.
Deviations of the data from straight lines in the lower portion, according to Firoozabadi and Katz [54] were due to the slip effect (Klinkenberg effect), and deviations of the data from straight lines in the upper portion were due to inadequacy of the Forchheimer equation to describe the flow at high velocities. However, Andrade, Jr et al. [23] found that such a transition can be understood and statistically characterized in terms of the spatial distribution of the kinetic energy in the system.
Lage et al. [16] investigated the relationship between the hydrostatic pressure gradient of a fluid (air) in what is called “transition to turbulence in a porous medium” and the average seepage fluid velocity.
A theoretical analysis based on the semi-variance model validation principle indicated that the relationship between the pressure gradient and the fluid speed indeed departs from the quadratic Forchheimer-extended Darcy flow model and can be correlated by a cubic function of fluid speed for the velocity range of their experiments.

4.3. Laws Governing Air Flow through ESR Foams

In the following sections, experimental results of reduced pressure drop of every sample are fitted linearly or quadratically to determine which law best describes the air flow for all ESR samples. Figure 6 depicts the linear fitting corresponding to the Forchheimer law given in the linear form of Equation (4) (including the Darcy laminar law when v→∞). The quadratic fitting represents that of the cubic law according to Equation (14) and the full cubic law given by Equation (15):
P L v = μ K + C μ ρ 2 v 2
Δ P L v = μ K + C 1 ρ v + C 2 ρ 2 μ   v 2
It is very clear that all experimental data samples deviated from linearity, regardless of whether it is a disc or a tube (except for ZkS25D and ZkS40D). This means that the Forchheimer equation is inadequate to describe air flow through ESR foams, which was later confirmed by residuals analysis. The nonlinear flow was much more significant compared to the literature on liquid for the same velocity, which is due to the lower gas viscosity according to Takhanov [25].
Panfilov and Fourar [28] state that the nonlinearity is not quadratic, which is the case for the ESR foams. It is easy to verify that the relationship is cubic for very low v and exponential for v→∞ (because of experimental results deviation from the quadratic law, which is the subject of an ongoing research paper). The pure inertia and cross inertia-viscosity coexist at any values of v. Panfilov showed that the inertia–viscous cross effects had an exponential character similar to the pure inertia terms, which comprise an exponential deviation from the quadratic law. If at high Re, a little deviation from full cubic law means that pure inertia effects produced at the microscale flow are negligible, and the structure is clearly periodic. This result confirms that the ESR foams have a periodic structure. The coefficient of determination of the fitted relationship was used to calculate the permeability and form drag coefficient for each length. Obviously, the lowest coefficient of determination, R2, was greater than 0.9980. However, maximum likelihood estimation: AIC, AICc, and BIC (calculated according to [56]) better confirmed this. For example, for ZkS35D (in Figure 6), the linear fitting of experimental results of reduced pressure drop gave an AIC, an AICc, and a BIC of 542.9676, 543.1782, and 544.0122, respectively. However, the quadratic fitting gave −849.7924, −849.1257, and −847.7033, respectively, which are quite lower than those of the linear fitting.

4.4. Residuals Analysis

In order to decide which law between the two cubic laws best describes the air flow through ESR foams and eventually confirm that the Forchheimer equation is inadequate, the residuals of each law were calculated and represented versus superficial velocity in Figure 7 [16,47].
It is clear that Forchheimer and cubic equations are not suitable models because their residuals values are higher than that of the full cubic law in all samples. Moreover, the Forchheimer and cubic residuals have an opposite behaviour; when the Forchheimer model overestimates the pressure drop, the cubic model underestimates it. Additionally, both are well described by a third-order fit curve such as R = a. v3. However, the full cubic law residuals were close to random noise, which means that it is the best law describing the air flow through the ESR foams.
When analysing the residuals of each model in terms of regimes, the cubic residuals were always high regardless of the values of the salt grain size, sample length, or porosity. However, when the Forchheimer residuals are important in the strong inertia regimes (which is also called Forchheimer regime), for example, in ZkS35D or ZkS40D, where it is supposed to accurately describe the air flow in those zones, there is a contradiction for which Panfilov et al. [57] have attributed three paradoxes. Moreover, Mei and Auriault [58] show that it is not the Forchheimer law but the cubic law that best describes the flow in the isotropic case at rather low velocities.
The strong transition regime (transition F–T) range is wider than that of the Forchheimer regime for all ESR foams. These foams are best described by the full cubic law, suggesting that the weak inertia regime (interpreted by the cross inertia–viscous effect) always exists and predominates. This dominance is related to a microscale reason: an ordered structure according to Lasseux and Valdés-Parada [50], who asserted that the Forchheimer type of correction is a robust approximation over a very significant range of values of the Reynolds number for disordered structures.
Neither Forchheimer nor the two cubic laws describe the turbulent regimes, which is obvious through the high residuals detected in this zone. This zone obeys an exponential law.
It is believed that the limits of each regime are different from one sample to another because of foams structural properties such as salt grain size, porosity, and length. This will be demonstrated later.
Thus, deviation of reduced pressure drop from linearity gives information on the suitability of the Forchheimer equation, and residuals analysis guides the choice between cubic laws.
Now that the suitable laws to describe the flow through ESR foams have been chosen carefully, curve-fitting constants were used to calculate the full cubic permeability KFC and inertia coefficient C1 and C2, which are then discussed in comparison to that obtained from the Forchheimer equation (KForch and β).

4.5. Air Flow Properties of ESR Foams

The permeability enables prediction of the flow rate obtainable under a given pressure drop or the prediction of the fluid pressure necessary to achieve a specific flow rate. Thus, it is of great interest to explore this in these new porous materials so that their specifications could be established. Evaluation of the permeability and inertia coefficient was done by least square fitting of two models chosen according to their low residuals to be compared, namely the Forchheimer equation and full cubic law.
Antohe et al. [59] presented a study that uses the Forchheimer extended flow model to compute the permeability and inertial coefficient for compressed aluminium matrices. Their results showed that the precision of the coefficients was improved by curve-fitting, with the values of each data point considered. They found that it is important that permeability and inertial coefficient values are associated with the velocity range from which they were determined.
Moreover, these values could not be used with confidence for predicting hydraulic behaviour at velocities outside this range.
Boomsma and Poulikakos [60] experimentally tested open-cell metal foams to evaluate their hydraulic characteristics using water. The experimental matrix of metal foams consisted of open-cell aluminium foams of various porosities and pore diameters in both a compressed and uncompressed form. Among several conclusions drawn was that using different flow velocity regimes resulted in various permeability and form coefficient values. Whenever the permeability and the associated form coefficient for a high-porosity porous medium are stated, the flow velocity ranges over which these terms are calculated must also be specified for accuracy.
Dukhan and Minjeur [38] suggested a two-permeability approach to assess flow properties: one determined and only valid in the Darcy regime, and another valid in the Forchheimer regime. The authors, however, contend to find paired permeability and inertia coefficients suitable for the entire flow range and with a satisfactory accuracy.
Zhong et al. [51] determined the permeability and inertial coefficients of sintered metal porous media using an Isothermal Chamber. The permeability was first determined in the Darcy regime, and then the inertial coefficient was determined in the Forchheimer regime with the resulting permeability. They claimed that this treatment was laborious since at least two types of flow sensors and pressure sensors with different ranges and accuracies were needed to satisfy the requirements of measurements across different flow ranges.
In this study, the curve-fitting constants of the full cubic law and Forchheimer equation were used to calculate the permeability and inertia coefficient in each regime separately then over the full range data for each salt grain size. It is to be contended that the values of the permeability and inertia coefficients given in this study are strictly applicable to the samples that were tested and fabricated with this process and are not material properties that can be applied to other foams.
However, a brief error analysis is first needed to confirm the suitability of the full cubic law to describe air flow in the ESR foams by analysing the percentage of change of permeability K, PCK, between the permeability fitted with Forchheimer equation (KForch) and that fitted with full cubic law (KFC), defined by Equation (16)
P C K = K F o r c h K F C K F C 100
The global PCK values of the full range data shown in Table 2 are high and negative, which means that the Forchheimer permeability is lower than that obtained with the full cubic law. This difference increases when turbulences begin from the transition F–T to turbulent regimes, confirming the previous finding that the Forchheimer model is not suitable to describe the flow in turbulent zones in the ESR foams. PCK values are small, positive, or negligible (sometimes null) in the transition D–F regime, suggesting that the two permeability values are close because the Forchheimer equation is usually accepted to describe the flow in this zone. Nevertheless, combining this result with the residuals of the two models in this regime, one can note that the full cubic law is suitable for predicting the permeability of ESR foams in this zone too.
In order to investigate which local regime influences the global air flow through the ESR foams, permeability and inertia coefficients of each sample calculated locally for each regime were analysed, and even the global values describing the macroscopic flow were determined for comparison.
The air flow properties values from experiments (shown in Table 3, Table 4 and Table 5) are of the same order of magnitude as those reported in the literature, which have the same porosity. For example, Lage et al. [16] studied fluid transport through compressed foams with porosities between 32% and 64%. They obtained permeabilities between 5.36 × 10⁻¹⁰ and 11.36 × 10⁻¹⁰ considering the Forchheimer equation (knowing that their compression ratio was 7 or 14), but there are small discrepancies from one regime to another.
ZkS35D and ZkS35T have a higher inertia coefficient and a lower permeability globally and locally. Most of the published data on flow in metal foam [59] exhibit significant disagreements on the values of permeability and the inertia coefficient for foams with similar porosities and internal structures. This is probably because of [19] the foam sample size in the flow direction used by various researchers [20] and the foam sample size perpendicular to the flow direction [61], which is not the case for these two samples because they have the same sample diameter. In contrast to the earlier foams, ZkS40D and ZkS25D have a higher permeability and lower inertia coefficient. This is probably due to their high porosity compared to other samples.
Additionally, the same sample exhibits different permeability and inertia coefficients depending on the regime data chosen. However, this variation is not very important.
The permeability values KFC of all the ESR samples in the turbulent regime were the lowest compared to those of the remaining regimes whatever the salt grain size, except in the case of ZkS35T because of its important length in the flow direction. However, they were the highest values in the Forchheimer zone compared to those of other regimes, except the permeability of ZkS40D. From the macroscopic point of view of air flow, the full range permeability was identical to that of the transition F–T for ZkS25D, the transition D–F for ZkS40D and ZkS45T, and to the Forchheimer for ZkS35T. However, it was never influenced by the turbulent regime. It is believed that this influence is due to foams’ structural properties such as porosity, length in the air flow direction, and the salt grain size (subject of an ongoing research paper), as open-cell foams generally have a random anisotropic cellular structure that has a significant effect on their permeability, which was demonstrated many times (e.g., [62,63]). The permeability is additionally influenced by the surface hardness of the pores and is extraordinarily impacted by the quantity of closed cells in ESR foams [1].
Van Lopik et al. [64] claimed that the geometry of the pore structure (such as tube-like or blob-like pore surfaces) as well as the total fluid–solid interface and its interface roughness largely determine the flow resistance due to drag force terms in the Forchheimer coefficient C1. Thus, if C1 is high, it means that an important blockage exists due to a very complicated pore structure that may have closed faces (as ZkS35T is suspected to be).
Dukhan et al. [65] reported that the transition to the turbulent regime in porous media is influenced by the internal surface roughness.
After an experimental hydrodynamic study of flow through metallic foams, flow regime transitions, and the influence of surface roughness, Kouidri and Madani [55] concluded that the pressure drop increases from smoother foam to rougher foam. This means that there is a degree of roughness present between ESR foams corresponding to their proper pressure drop.
Boomsma and Poulikakos [60] found that holding the porosity constant and decreasing the pore diameter increased the flow resistance in the uncompressed metal foams by reducing the permeability and increasing the form coefficient C1. The same remark was observed in ESR foam, for example, between ZkS35T and ZkS45T. This increase is attributed to the higher specific surface area generated by the smaller pore size, which was confirmed by the corresponding global nonlinear cubic coefficient C2, which is −2.59/ZkS35T compared to −0.10/ZkS45T in this example.
The nonlinear cubic term C2 is rather low and occasionally negative or positive depending on the velocity range considered (regime), but overall it is negative, which is likely due to the fact that the internal geometry of the micro-channels where the air flows is tortuous (according to Panfilov et al. [57]). This was an intuitive affirmation from Mei and Auriault [58], who expected that to maintain the same seepage velocity, a higher pressure gradient is needed if fluid inertia becomes increasingly important. Thus, C2 should be non-positive.
Bues et al. [29], when working on a macroscale model and viscous–inertia effects for Navier–Stokes flow in a radial fracture with corrugated walls, presented an interesting analysis of the changes in the sign of the nonlinear cubic term C2. They considered a generalized Darcy’s law, including two additional nonlinear terms (quadratic and cubic) with respect to the mean flow velocity. The quadratic term described the pure inertia effect, which was caused by an irreversible loss of kinetic energy due to flow acceleration. The cubic term corresponds to a cross inertia–viscous effect, which consists of an additive viscous dissipation caused by the streamline deformation due to inertia forces. As inertia forces tend to straighten the flow streamlines, reducing the viscous dissipation, the inertia–viscous parameter should be negative. However, the formation of secondary flows, such as reverse jets, may invert this tendency and may thus change the sign of the inertia–viscous parameter. For a high amplitude of wall corrugation, the local inertia forces become somewhat greater than the global inertia. Therefore, the total viscous dissipation decreases, and the inertia–viscous parameter becomes negative. Note that the negative viscous–inertia dissipation increment is equivalent to a reduction in effective permeability, and the wall corrugation of the fracture corresponds to the tortuosity in the ESR foams. This is another important piece of information on the cell internal structure of these foams.

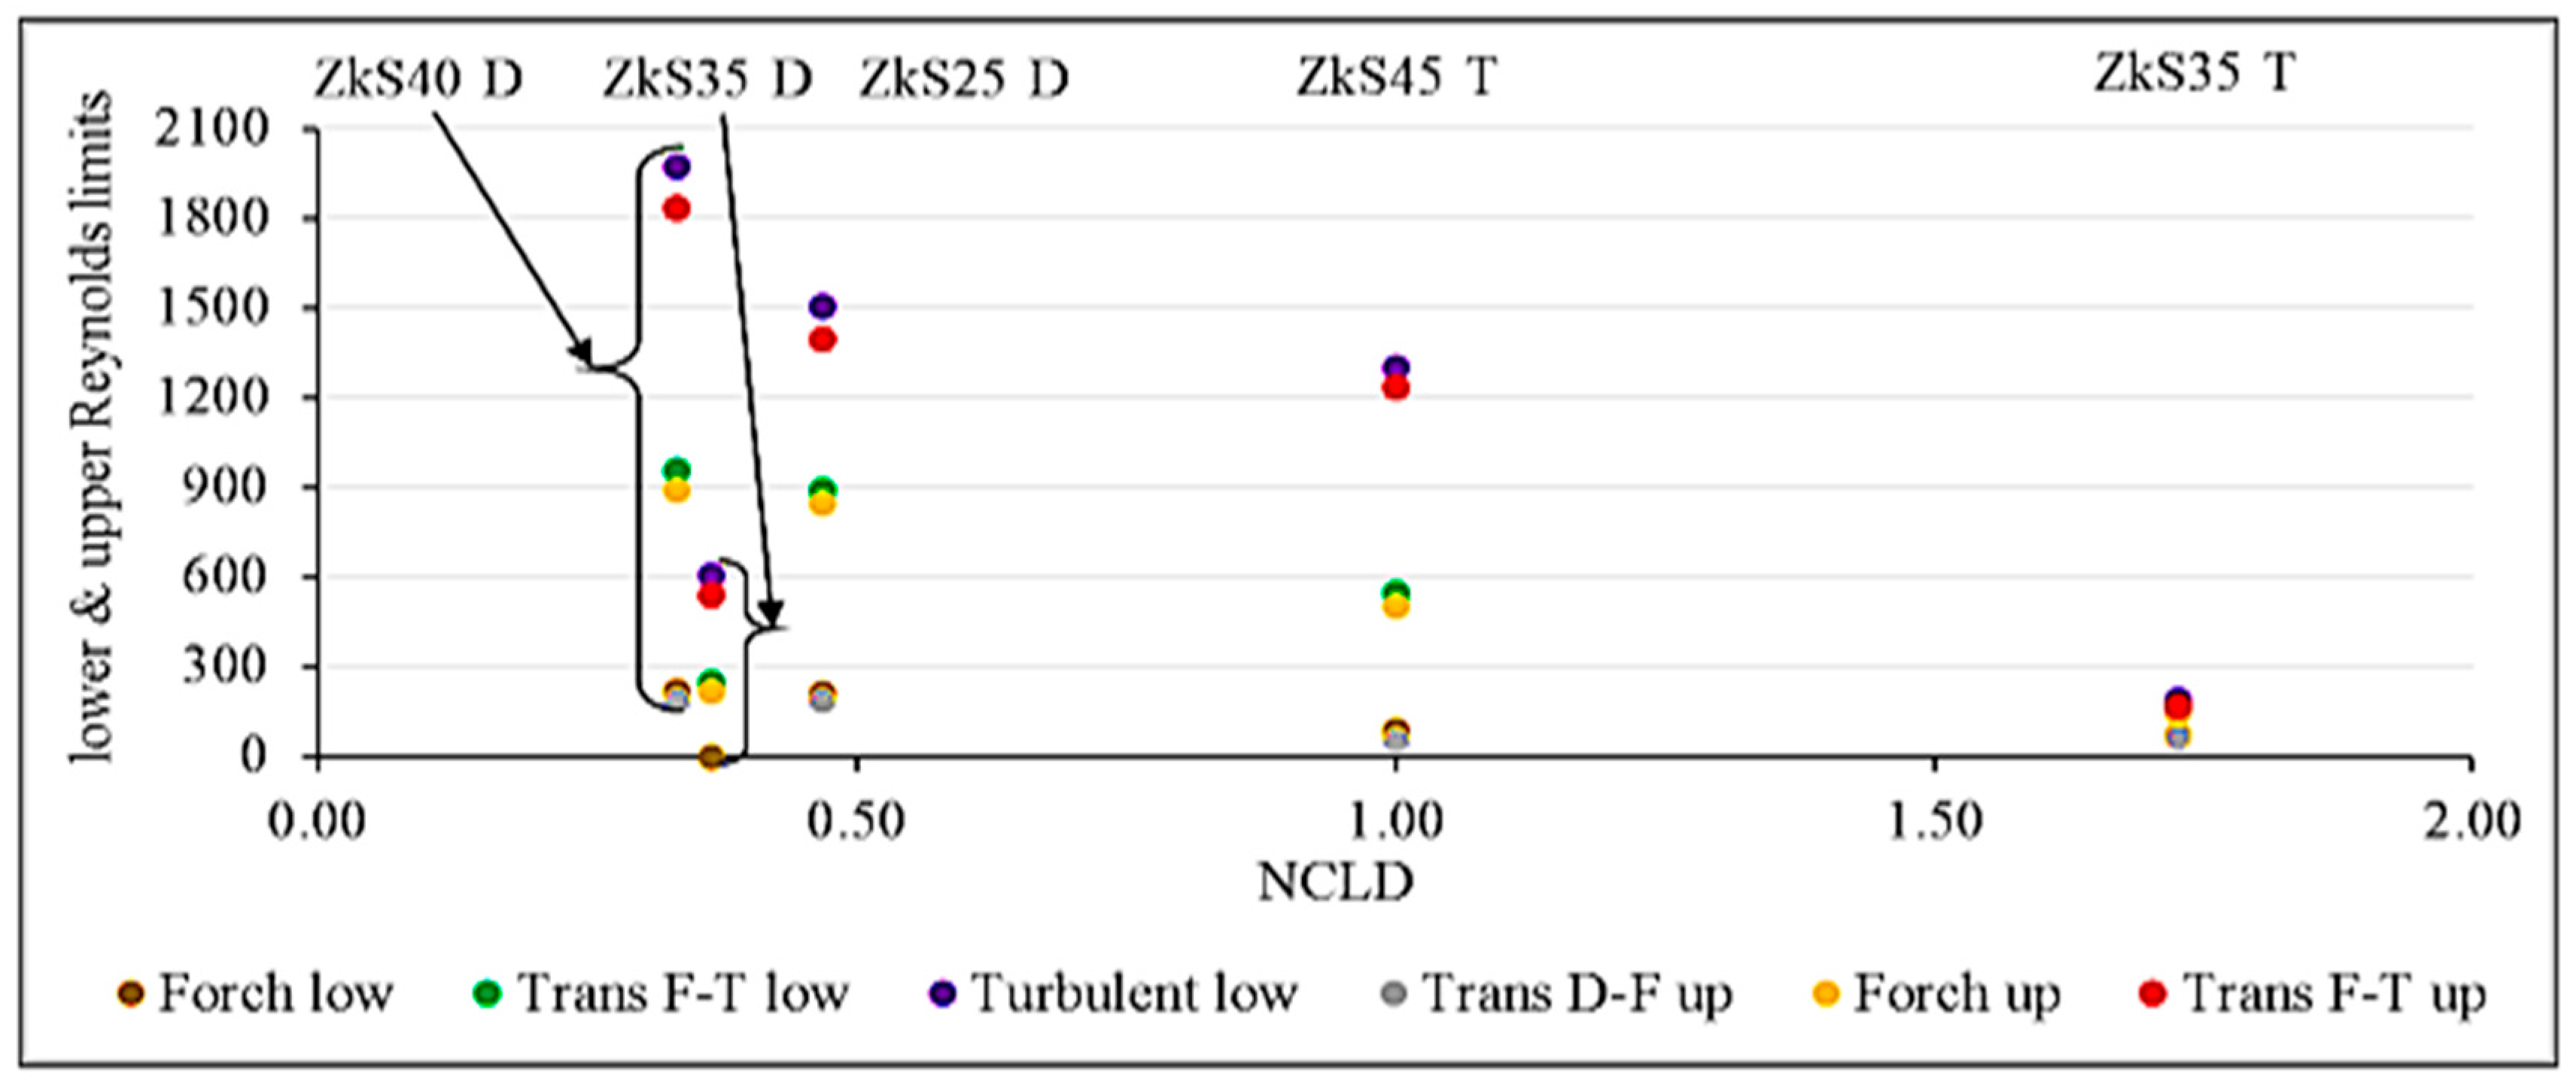
4.6. Sample Length Effect on Airflow Regimes

Previous research such as Dukhan and Patel [20] showed that the permeability and form coefficient depend on the length of the sample until a critical thickness.
Pauthenet et al. [53] stated that accurate prediction of the transition between different flow regimes is an important challenge with repercussions for many engineering applications. Many attempts have been made to define a criterion to describe the upper limit of special regimes such as the Darcy regime. Besides the Reynolds number, based on the average particle size of the porous medium, which is used to indicate whether fluid flow is laminar or turbulent, various other criterions (reviewed in [64]) have been proposed.
When presenting the results of high-resolution Navier–Stokes simulations and laboratory measurements of nonlinear regime fluid flow in a natural sandstone fracture, Zimmerman et al. [66] recommended (for engineering purposes) the definition of a “critical” value of Re at which the non-Darcy pressure drop contributes, say, 10% of the total pressure drop (this was not considered in this study). They found that this critical Reynolds number decreases with increasing fracture roughness.
In order to perform a dimensionless analysis of the sample length effect on air flow behaviour, a Reynolds number based on the nominal salt grain diameter DC (as a characteristic length) was calculated by Equation (1), and values are presented in Table 6. A dimensionless number NCLD is defined by Equation (13), where NCL and NCD are the number of cells by sample length and the number of cells by sample diameter, respectively. This number linked external macroscale properties and internal microscale properties of the ESR samples. The Reynolds number based on the salt grain diameter represents fluid flow information. Lower and upper limits of the Reynolds number are calculated using the lower and upper values of superficial velocity of each regime.
Figure 8 clearly shows that the lower and upper limits of the Reynolds number of each regime, from weak inertia (transition D–F) to turbulent flow, are greatly influenced by the dimensions of foam samples. They were very scattered when there were a few cells by length of sample in the airflow direction (ZkS35D vs. ZkS35T). For samples with the same porosity (ZkS35T vs. ZkS45T), the scatter was less when the foam had the highest NCLD ratio. This means that less time was spent to reach the turbulent regime when the foam length was greater than two-thirds of the NCLD. This is because each air flow regime needs a necessary length to be established simultaneously with other regimes. Although they had high porosity, foams in the form of a disc had a lower NCLD and presented the highest scatter in Reynolds limits because each regimes needs more time to be established along the disc foam, which means that more energy is spent reaching it.
It was noticed that for the thinnest disc ESR sample (ZkS35D), which had a low NCLD ratio, the weak inertia regime (transition D-F) disappeared, which might need more precise equipment to detect it. In the ZkS45T, the number of cells in sample length and sample diameter were equal, but this does not mean that the scatter of regimes is unimportant. To summarize, if ESR foams were used in air flow transport, the choice of sample length depends on the energy and time intended to be consumed to reach the desired regime.

4.7. Qualitative description of the ESR foams

The cell size considered in this study is the salt grain size determined by sieving. It is a qualitatively appropriate length scale for studying flow properties mainly because at the mesoscale level, it appears that after salt removal, the cell was a replica of the salt grain, and sieved salt gave uniform cuboid grains as demonstrated in Figure 9a,b. The pore diameter dp used by some researchers was not considered because of the confusing definition of the pore; it is defined sometimes as the cell diameter and sometimes as the window diameter [67].
The strut shape is supposed to be visibly uniform, filled, and closed, which means that open porosity equals the total calculated porosity given in Table 1.
All the concerns of this study are about the general form of the air flow through the ESR foams, which needs information on the cell dimension and shape. As mentioned previously, full cubic permeability, as a deterministic property for ESR foams, is influenced by the porosity and nominal cell diameter as Figure 10 demonstrates and as is fitted by Equation (17)
K F C = 26263 D C 2 ε 42
The permeability of ZkS35T was not represented because it had the same porosity as ZkS45T.
The irregular cuboid shape of the salt grain used in the ESR foam was the origin of the special cell form of ESR foams leading to an anisotropic ordered porous media. This can explain the macroscopic turbulence of air flow because of the many dead zones present in the corner of each cubic cell causing kinetic energy loss starting at earlier regimes.
During this research, we became firmly convinced that experimental characterization is essential each time a new foam appears because of its unique morphological structure. We believe that temptations to derive new correlations taking into account both viscous and inertial regimes could encompass different morphological parameters on a common basis. This could also be valid for different sets of foam structures having different strut cross sections over a wide range of Reynolds numbers, but this will be a very complicated task, as demonstrated by the sheer volume of this study.

5. Conclusions

This study reported an accurate global and local evaluation of the air flow characteristics through samples of 60% porosity zinc foams fabricated with a new method named the excess salt replication process (ESR Process). The qualitative analysis of the experimental data on pressure drop of the air flow in a non-Darcy regime through these cellular materials revealed an anisotropic periodic ordered structure responsible for their strong inertial behaviour, and the following conclusions were obtained. The ESR process, based on the space holder method, proved to be an efficient and low-cost way to produce porous metals with controllable cell size and shape. The macroscopic behaviour of airflow through these foams revealed an inertial non-laminar trend influenced by strong transitional local regimes which were delimited by the slope changes method of reduced pressure drop curves as a function of surface velocity. The full cubic law best described the flow of fluid through these foams compared to the cubic law and the Forchheimer equation. The ESR foams’ permeability can be classified between that of the highly porous medium and that of traditional porous media (packed beds of grains). The permeability and the Forchheimer coefficients were different in every fluid regime type. An empirical correlation predicting ESR foam full cubic permeability using cell diameter and sample porosity was fitted. A well-defined fluid dynamics exploration procedure applied to each new porous material is necessary.

Author Contributions

Conceptualization, A.H.H.-B., A.-E.B., A.N.E.H.S., H.T., D.C., A.A., J.Z. and L.M.; Methodology, A.H.H.-B., S.T., H.T., M.K., A.A., J.Z. and L.M.; Software, A.H.H.-B., H.T., S.T., A.N.E.H.S., D.C. and J.Z.; Validation, A.H.H.-B., A.-E.B., H.T., S.T., M.K., D.C., A.A., J.Z. and L.M.; Formal analysis, A.H.H.-B., A.-E.B., H.T., S.T., A.N.E.H.S., M.K., A.A., J.Z. and L.M.; Investigation, A.H.H.-B., A.-E.B., H.T., S.T., A.N.E.H.S., M.K., A.A., J.Z. and L.M.; Resources, A.H.H.-B., A.-E.B., H.T., A.N.E.H.S., M.K., D.C., A.A., J.Z. and L.M.; Data curation, A.H.H.-B., H.T., A.N.E.H.S., D.C., A.A. and J.Z.; Writing—original draft, A.H.H.-B. and S.T.; Writing—review & editing, A.-E.B., H.T., A.N.E.H.S., M.K., A.A., J.Z. and L.M.; Visualization, A.-E.B., H.T., S.T., A.N.E.H.S., M.K., D.C., A.A., J.Z. and L.M.; Supervision, A.-E.B., A.A. and J.Z.; Project administration, A.-E.B., D.C., A.A. and J.Z. All authors have read and agreed to the published version of the manuscript.

Funding

This research received no external funding.

Data Availability Statement

Not applicable.

Conflicts of Interest

The authors declare no conflict of interest.

References

  1. Harshit, K.; Gupta, P. Advanced Research Developments and Commercialization of Light Weight Metallic Foams. In Handbook of Nanomaterials and Nanocomposites for Energy and Environmental Applications; Springer: Berlin/Heidelberg, Germany, 2020; pp. 1–31. [Google Scholar]
  2. Goodall, R.; Mortensen, A. 24—Porous Metals A2—Laughlin, David E. In Physical Metallurgy, 5th ed.; Hono, K., Ed.; Elsevier: Oxford, UK, 2014; pp. 2399–2595. [Google Scholar]
  3. Durmus, F.Ç.; Maiorano, L.P.; Molina, J.M. Open-cell aluminum foams with bimodal pore size distributions for emerging thermal management applications. Int. J. Heat Mass Transf. 2022, 191, 122852. [Google Scholar] [CrossRef]
  4. Ashby, M.F.; Evans, T.; Fleck, N.; Hutchinson, J.W.; Wadley, H.N.G.; Gibson, L.J. Metal Foams: A Design Guide; Elsevier Science: Amsterdam, The Netherlands, 2000. [Google Scholar]
  5. Do, T.M.; Byun, J.Y.; Kim, S.H. An electro-Fenton system using magnetite coated metallic foams as cathode for dye degradation. Catal. Today 2017, 295, 48–55. [Google Scholar] [CrossRef]
  6. Klegova, A.; Pacultová, K.; Kiška, T.; Peikertová, P.; Rokicińska, A.; Kuśtrowski, P.; Obalová, L.J.M.C. Washcoated open-cell foam cobalt spinel catalysts for N2O decomposition. Mol. Catal. 2022, 533, 112754. [Google Scholar] [CrossRef]
  7. Choe, Y.J.; Kim, J.; Byun, J.Y.; Kim, S.H.J.C.T. An electro-Fenton system with magnetite coated stainless steel mesh as cathode. Catal. Today 2021, 359, 16–22. [Google Scholar] [CrossRef]
  8. Sahu, S.; Ansari, M.Z. A Study on Manufacturing Processes and Compressive Properties of Zinc-Aluminium Metal Foams. Am. J. Mater. Sci. 2015, 5, 38–42. [Google Scholar]
  9. Chethan, A.; García-Moreno, F.; Wanderka, N.; Murty, B.; Banhart, J. Influence of Oxides on the Stability of Zinc Foam; Springer: Berlin/Heidelberg, Germany, 2011; Volume 46, pp. 7806–7814. [Google Scholar]
  10. Yu, S.; Liu, J.; Wei, M.; Luo, Y.; Zhu, X.; Liu, Y. Compressive property and energy absorption characteristic of open-cell ZA22 foams. Mater. Des. 2009, 30, 87–90. [Google Scholar] [CrossRef]
  11. Hassein-Bey, A.H.; Belhadj, A.-E.; Gavrus, A.; Abudura, S. Elaboration and Mechanical-Electrochemical Characterisation of Open Cell Antimonial-lead Foams Made by the “Excess Salt Replication Method” for Eventual Applications in Lead-acid Batteries Manufacturing. Kem. Ind. Časopis Kemičara Kem. Inženjera Hrvat. 2020, 69, 387–398. [Google Scholar] [CrossRef]
  12. Dukhan, N. Metal Foams: Fundamentals and Applications; Destech Publications: St, Lancaster, PA, USA, 2013. [Google Scholar]
  13. Savaci, U.; Yilmaz, S.; Güden, M. Open cell lead foams: Processing, microstructure, and mechanical properties. J. Mater. Sci. 2012, 47, 5646–5654. [Google Scholar] [CrossRef] [Green Version]
  14. Banhart, J. Manufacture, characterisation and application of cellular metals and metal foams. Prog. Mater. Sci. 2001, 46, 559–632. [Google Scholar] [CrossRef]
  15. Lu, X. Fluid Flow and Heat Transfer in Porous Media Manufactured by a Space Holder Method; Springer Nature: Berlin/Heidelberg, Germany, 2020. [Google Scholar]
  16. Lage, J.; Antohe, B.; Nield, D. Two types of nonlinear pressure-drop versus flow-rate relation observed for saturated porous media. J. Fluids Eng. 1997, 119, 700–706. [Google Scholar] [CrossRef]
  17. Skjetne, E. High-Velocity Flow in Porous Media; Norwegian University of Science and Technology: Trondheim, Norway, 1995. [Google Scholar]
  18. Kececioglu, I.; Jiang, Y. Flow through porous media of packed spheres saturated with water. J. Fluids Eng. 1994, 116, 164–170. [Google Scholar] [CrossRef]
  19. Dukhan, N.; Bağcı, Ö.; Özdemir, M. Metal foam hydrodynamics: Flow regimes from pre-Darcy to turbulent. Int. J. Heat Mass Transf. 2014, 77, 114–123. [Google Scholar] [CrossRef]
  20. Dukhan, N.; Patel, K. Effect of sample’s length on flow properties of open-cell metal foam and pressure-drop correlations. J. Porous Mater. 2011, 18, 655–665. [Google Scholar] [CrossRef]
  21. Mauroy, B.; Filoche, M.; Andrade Jr, J.; Sapoval, B. Interplay between geometry and flow distribution in an airway tree. Phys. Rev. Lett. 2003, 90, 148101. [Google Scholar] [CrossRef] [Green Version]
  22. Firoozabadi, A.; Thomas, L.; Todd, B. High-Velocity Flow in Porous Media (includes associated papers 31033 and 31169). SPE Reserv. Eng. 1995, 10, 149–152. [Google Scholar] [CrossRef]
  23. Andrade, J., Jr.; Costa, U.; Almeida, M.; Makse, H.; Stanley, H. Inertial effects on fluid flow through disordered porous media. Phys. Rev. Lett. 1999, 82, 5249. [Google Scholar] [CrossRef] [Green Version]
  24. Coulaud, O.; Morel, P.; Caltagirone, J. Numerical modelling of nonlinear effects in laminar flow through a porous medium. J. Fluid Mech. 1988, 190, 393–407. [Google Scholar] [CrossRef]
  25. Takhanov, D. Forchheimer Model for Non-Darcy Flow in Porous Media and Fractures. Masters Thesis, Imperial College London, London, UK, 2011. [Google Scholar]
  26. Skjetne, E.; Auriault, J.-L. High-Velocity Laminar and Turbulent Flow in Porous Media. Transp. Porous Media 1999, 36, 131–147. [Google Scholar] [CrossRef]
  27. Sivanesapillai, R.; Steeb, H.; Hartmaier, A. Transition of effective hydraulic properties from low to high Reynolds number flow in porous media. Geophys. Res. Lett. 2014, 41, 4920–4928. [Google Scholar] [CrossRef]
  28. Panfilov, M.; Fourar, M. Physical splitting of nonlinear effects in high-velocity stable flow through porous media. Adv. Water Resour. 2006, 29, 30–41. [Google Scholar] [CrossRef]
  29. Bues, M.; Panfilov, M.; Crosnier, S.; Oltean, C. Macroscale model and viscous-inertia effects for Navier-Stokes flow in a radial fracture with corrugated walls. J. Fluid Mech. 2004, 504, 41. [Google Scholar] [CrossRef]
  30. Rojas, S.; Koplik, J. Nonlinear flow in porous media. Phys. Rev. E 1998, 58, 4776. [Google Scholar] [CrossRef]
  31. Chai, Z.; Shi, B.; Lu, J.; Guo, Z. Non-Darcy flow in disordered porous media: A lattice Boltzmann study. Comput. Fluids 2010, 39, 2069–2077. [Google Scholar] [CrossRef]
  32. Venkataraman, P.; Rao, P.R.M. Darcian, transitional, and turbulent flow through porous media. J. Hydraul. Eng. 1998, 124, 840–846. [Google Scholar] [CrossRef]
  33. Scheidegger, A.E. The Physics of Flow Through Porous Media, 3rd ed.; University of Toronto Press: Toronto, ON, Canada, 1974. [Google Scholar]
  34. Innocentini, M.D.; Salvini, V.R.; Pandolfelli, V.C.; Coury, J.R. Assessment of Forchheimer’s equation to predict the permeability of ceramic foams. J. Am. Ceram. Soc. 1999, 82, 1945–1948. [Google Scholar] [CrossRef]
  35. Yang, X.; Yang, T.; Xu, Z.; Yang, B. Experimental investigation of flow domain division in beds packed with different sized particles. Energies 2017, 10, 1401. [Google Scholar] [CrossRef]
  36. Kundu, P.; Kumar, V.; Mishra, I.M. Experimental and numerical investigation of fluid flow hydrodynamics in porous media: Characterization of pre-Darcy, Darcy and non-Darcy flow regimes. Powder Technology 2016, 303, 278–291. [Google Scholar] [CrossRef]
  37. Innocentini, M.; Salvini, V.; Pandolfelli, V. The Permeability of Ceramic Foams. Am. Ceram. Soc. Bull. 1999, 78, 78–84. [Google Scholar]
  38. Dukhan, N.; Minjeur, C.A. A two-permeability approach for assessing flow properties in metal foam. J. Porous Mater. 2011, 18, 417–424. [Google Scholar] [CrossRef]
  39. Goodall, R.; Marmottant, A.; Salvo, L.; Mortensen, A. Spherical pore replicated microcellular aluminium: Processing and influence on properties. Mater. Sci. Eng. A 2007, 465, 124–135. [Google Scholar] [CrossRef]
  40. Pola, A.; Tocci, M.; Goodwin, F.E. Review of Microstructures and Properties of Zinc Alloys. Metals 2020, 10, 253. [Google Scholar] [CrossRef] [Green Version]
  41. Katarivas Levy, G.; Goldman, J.; Aghion, E. The prospects of zinc as a structural material for biodegradable implants—A review paper. Metals 2017, 7, 402. [Google Scholar] [CrossRef] [Green Version]
  42. Hanna, M.D.; Rashid, M.S. ACuZinc: Improved Zinc Alloys for Die Casting Applications; Society of Automotive Engineers: Warrendale, PA, USA, 1993. [Google Scholar]
  43. Buonomo, B.; di Pasqua, A.; Manca, O.; Sekrani, G.; Poncet, S. Numerical Analysis on Pressure Drop and Heat Transfer in Nanofluids at Pore Length Scale in Open Metal Porous Structures with Kelvin Cells. Heat Transf. Eng. 2020, 42, 1614–1624. [Google Scholar] [CrossRef]
  44. Akbarnejad, S.; Pour, M.S.; Jonsson, L.T.I.; Jönsson, P.G. Effect of fluid bypassing on the experimentally obtained Darcy and non-Darcy permeability parameters of ceramic foam filters. Metall. Mater. Trans. B 2017, 48, 197–207. [Google Scholar] [CrossRef] [Green Version]
  45. Firdaouss, M.; Guermond, J.-L.; Le QuÉRÉ, P. Nonlinear corrections to Darcy’s law at low Reynolds numbers. J. Fluid Mech. 1997, 343, 331–350. [Google Scholar] [CrossRef]
  46. Carpio, A.R.; Martínez, R.M.; Avallone, F.; Ragni, D.; Snellen, M.; Van Der Zwaag, S. Broadband Trailing Edge Noise Reduction Using Permeable Metal Foams. In Proceedings of the 46th International Congress and Exposition on Noise Control Engineering Taming Noise and Moving Quiet: Taming Noise and Moving Quiet, Hong Kong, China, 27–30 August 2017. [Google Scholar]
  47. Bonnet, J.-P.; Topin, F.; Tadrist, L. Flow laws in metal foams: Compressibility and pore size effects. Transp. Porous Media 2008, 73, 233–254. [Google Scholar] [CrossRef]
  48. Dyga, R.; Brol, S. Pressure Drops in Two-Phase Gas–Liquid Flow through Channels Filled with Open-Cell Metal Foams. Energies 2021, 14, 2419. [Google Scholar] [CrossRef]
  49. Paek, J.W.; Kang, B.H.; Kim, S.Y.; Hyun, J.M. Effective Thermal Conductivity and Permeability of Aluminum Foam Materials1. Int. J. Thermophys. 2000, 21, 453–464. [Google Scholar] [CrossRef]
  50. Lasseux, D.; Valdés-Parada, F.J. On the developments of Darcy’s law to include inertial and slip effects. Comptes Rendus Mec. 2017, 345, 660–669. [Google Scholar] [CrossRef]
  51. Zhong, W.; Ji, X.; Li, C.; Fang, J.; Liu, F. Determination of Permeability and Inertial Coefficients of Sintered Metal Porous Media Using an Isothermal Chamber. Appl. Sci. 2018, 8, 1670. [Google Scholar] [CrossRef] [Green Version]
  52. Kumar, P.; Jobic, Y.; Topin, F. Comment Identifier les Régimes D’écoulement et Déterminer les Coefficients D’échange dans les Mousses à Cellules Ouvertes. In Proceedings of the 25ème Congrès Français de Thermique, Marseille, France, 30 May–2 June 2017. [Google Scholar]
  53. Pauthenet, M.; Davit, Y.; Quintard, M.; Bottaro, A. Inertial sensitivity of porous microstructures. Transp. Porous Media 2018, 125, 211–238. [Google Scholar] [CrossRef] [Green Version]
  54. Firoozabadi, A.; Katz, D.L. An analysis of high-velocity gas flow through porous media. J. Pet. Technol. 1979, 31, 211–216. [Google Scholar] [CrossRef]
  55. Kouidri, A.; Madani, B. Experimental hydrodynamic study of flow through metallic foams: Flow regime transitions and surface roughness influence. Mech. Mater. 2016, 99, 79–87. [Google Scholar] [CrossRef]
  56. Spiess, A.-N.; Neumeyer, N.J.B. An evaluation of R2 as an inadequate measure for nonlinear models in pharmacological and biochemical research: A Monte Carlo approach. BMC Pharmacol. 2010, 10, 6. [Google Scholar] [CrossRef] [PubMed] [Green Version]
  57. Panfilov, M.; Oltean, C.; Panfilova, I.; Buès, M. Singular nature of nonlinear macroscale effects in high-rate flow through porous media. Comptes Rendus Mec. 2003, 331, 41–48. [Google Scholar] [CrossRef]
  58. Mei, C.; Auriault, J.-L. The effect of weak inertia on flow through a porous medium. J. Fluid Mech. 1991, 222, 647–663. [Google Scholar] [CrossRef]
  59. Antohe, B.; Lage, J.; Price, D.; Weber, R. Experimental determination of permeability and inertia coefficients of mechanically compressed aluminum porous matrices. J. Fluids Eng. 1997, 119, 404–412. [Google Scholar] [CrossRef]
  60. Boomsma, K.; Poulikakos, D. The effects of compression and pore size variations on the liquid flow characteristics in metal foams. J. Fluids Eng. 2002, 124, 263–272. [Google Scholar] [CrossRef]
  61. Zhong, W.; Li, X.; Liu, F.; Tao, G.; Lu, B.; Kagawa, T. Measurement and correlation of pressure drop characteristics for air flow through sintered metal porous media. Transp. Porous Media 2014, 101, 53–67. [Google Scholar] [CrossRef]
  62. Trinh, V.H. Microstructure and Permeability of Anisotropic Open-Cell Foams. In Proceedings of the International Conference on Engineering Research and Applications, Thai Nguyen, Vietnam, 1–2 December 2019; pp. 471–476. [Google Scholar]
  63. Magnico, P. Analysis of permeability and effective viscosity by CFD on isotropic and anisotropic metallic foams. Chem. Eng. Sci. 2009, 64, 3564–3575. [Google Scholar] [CrossRef]
  64. van Lopik, J.H.; Snoeijers, R.; van Dooren, T.C.; Raoof, A.; Schotting, R.J. The effect of grain size distribution on nonlinear flow behavior in sandy porous media. Transp. Porous Media 2017, 120, 37–66. [Google Scholar] [CrossRef] [Green Version]
  65. Dukhan, N.; Bağcı, Ö.; Özdemir, M. Experimental flow in various porous media and reconciliation of Forchheimer and Ergun relations. Exp. Therm. Fluid Sci. 2014, 57, 425–433. [Google Scholar] [CrossRef]
  66. Zimmerman, R.W.; Al-Yaarubi, A.; Pain, C.C.; Grattoni, C.A. Non-linear regimes of fluid flow in rock fractures. Int. J. Rock Mech. Min. Sci. 2004, 41, 163–169. [Google Scholar] [CrossRef]
  67. Inayat, A.; Klumpp, M.; Lämmermann, M.; Freund, H.; Schwieger, W. Development of a new pressure drop correlation for open-cell foams based completely on theoretical grounds: Taking into account strut shape and geometric tortuosity. Chem. Eng. J. 2016, 287, 704–719. [Google Scholar] [CrossRef]
Figure 1. Steps of the ESR process and the resultant open-cell foams made by zamak 5.
Water 15 01405 g001
Figure 2. Experimental setup of the air channel used for permeability measurements of the different zamak 5 foams.
Water 15 01405 g002
Figure 3. Measured pressure gradient normalized by the thickness versus air superficial velocity across all zamak 5 samples.
Water 15 01405 g003
Figure 4. Reduced pressure drop vs. superficial velocity for the ESR foam samples.
Water 15 01405 g004
Figure 5. Delimitation of different regimes identified when air flows through ESR open-cell foams. It seems that all samples present nonlinear turbulence trends even for low velocity (v~0.4 m/s).
Water 15 01405 g005aWater 15 01405 g005b
Figure 6. Linear and quadratic fitting of experimental results of reduced pressure drop versus superficial air velocity for each sample.
Water 15 01405 g006
Figure 7. Comparison between Forchheimer, cubic, and full cubic law residuals for each ESR sample.
Water 15 01405 g007
Figure 8. Dimensionless analysis of the effect of sample length on airflow limits using the number of cells per length normalised by the number of cells per sample diameter (NCLD). It is clear that each extension of the regime is deeply influenced by the length of the sample.
Water 15 01405 g008
Figure 9. (a) Photography of the salt used in the ESR process: the particle had an irregular cuboid form. (b) SEI image magnification by JOEL JSM-6360 of cuboid cell shape replicas of the salt grain used and the interconnection windows of ESR foam from [12]. In this study, the nominal cell diameter (DC) considered was the diameter of the internal sphere surrounding the cuboid cell and having the same salt grain circumscribing sphere diameter determined by sieving.
Water 15 01405 g009
Figure 10. Description of the relationship between full cubic permeability normalised by the square cell diameter in terms of porosity of the ESR sample.
Water 15 01405 g010
Table 1. Morphological parameters of the tested porous metal foams.
FoamL (mm)Φ (mm)DC (mm)ε (%)NCLNCDNCLD
ZkS25D18.3037.502.5064.777150.47
ZkS35D15.1038.183.5057.654110.36
ZkS35T68.8338.183.5059.7319111.73
ZkS40D15.3038.094.0062.56390.33
ZkS45T38.9738.284.5060.00881.00
Table 2. Percentage of change of ESR foams between the permeability fitted with Forchheimer equation and that fitted with full cubic law.
SampleTransition D–FForchheimerTransition F–TTurbulentFull Range
ZKS25 D3.32−31.09−48.61−47.53−48.84
ZKS35 D-−8.13−47.61−22.73−39.06
ZKS35 T7.64−4.1738.36−8.43−18.65
ZKS40 D−0.50−11.79−38.21101.43−35.72
ZKS45 T0.00−13.59−44.50−61.60−52.94
Table 3. The permeability fitted by the full cubic law and Forchheimer equation for all flow regimes of air flow through ESR foams.
Full Cubic Permeability KFC (m²)Forchheimer Permeability KForch (m²)
SampleTransition D–FForchheimerTransition F–TTurbulentFull Range *Transition D–FForchheimerTransition F–TTurbulentFull Range *
ZkS25 D1.58 × 10−91.96 × 10−91.83 × 10−96.31 × 10−101.83 × 10−91.63 × 10−91.35 × 10−99.41 × 10−103.31 × 10−109.35 × 10⁻¹⁰
ZkS35 D-4.75 × 10−114.49 × 10−112.15 × 10−113.60 × 10⁻¹¹-4.36 × 10−112.35 × 10−111.66 × 10−112.19 × 10⁻¹¹
ZkS35 T3.23 × 10−113.32 × 10−112.49 × 10−112.73 × 10−113.49 × 10−113.48 × 10−113.18 × 10−113.45 × 10−112.50 × 10−112.84 × 10⁻¹¹
ZkS40 D2.18 × 10−92.34 × 10−92.48 × 10−94.65 × 10−102.19 × 10−92.17 × 10−92.07 × 10−91.53 × 10−99.37 × 10−101.41 × 10⁻⁹
ZkS45 T2.36 × 10−102.84 × 10−102.03 × 10−101.78 × 10−102.35 × 10−102.36 × 10−102.46 × 10−101.12 × 10−106.83 × 10−111.11 × 10⁻¹⁰
Note: (*) full range designates the resulting fitted properties describing the macroscopic air flow for velocity from 0~∞ m/s.
Table 4. The inertia coefficient fitted by the full cubic law and the Forchheimer equation for all regimes of air flow through ESR foams.
C1 (m−1) (Full Cubic Law)β (m−1) (Forchheimer Law)
SampleTransition D–FForchheimerTransition F–TTurbulentFull RangeTransition D–FForchheimerTransition F–TTurbulentFull Range
ZkS25 D11,583.4914,100.6413,179.7912,188.0013,611.9112,442.4811,959.3010,910.227561.9810,770.95
ZkS35 D-589,388.41609,391.31269,496.22469,425.78-495,386.9324,8916.45137,176.77206,951.25
ZkS35 T140,171.70521,216.880.00359,694.79606,814.26524,663.65436,902.63480,645.54258,975.56328,123.88
ZkS40 D13,047.4113,472.8913,350.307278.4713,063.3412,894.3112,650.4411,907.2811,085.3711,706.81
ZkS45 T34,851.68100,090.9488,252.9982,705.8192,231.8134,851.6884,141.3848,054.4027,310.8744,912.40
Table 5. The cubic coefficient fitted using the full cubic law for all regimes of air flow through ESR foams.
C2 (-) (Full Cubic Law)
SampleTransition D–FForchheimerTransition F–TTurbulentFull Range
ZkS25 D0.0083−0.0045−0.0024−0.0037−0.0033
ZkS35 D-−1.0708−1.5207−0.3152−0.8304
ZkS35 T15.1539−1.30405.1841−0.7381−2.5935
ZkS40 D−0.0023−0.0027−0.00200.0033−0.0016
ZkS45 T0.0000−0.1043−0.0970−0.0846−0.1008
Table 6. Air flow regime boundaries of ESR foams.
Re Lower LimitRe Upper Limit
SampleTransition D–FForchheimerTransition F–TTurbulentTransition D–FForchheimerTransition F–TTurbulent
ZkS25 D/209.24889.481502.79185.42847.351395.07/
ZkS35 D/0244.48602.00-220.82542.93/
ZkS35 T/73.59156.36191.8661.74144.56168.15/
ZkS40 D/216.24954.681973.65189.27889.611836.3/
ZkS45 T/85.87543.981304.2455.22501.361231.52/
Disclaimer/Publisher’s Note: The statements, opinions and data contained in all publications are solely those of the individual author(s) and contributor(s) and not of MDPI and/or the editor(s). MDPI and/or the editor(s) disclaim responsibility for any injury to people or property resulting from any ideas, methods, instructions or products referred to in the content.

