Article

Effects of Climate Change on Navigability Indicators of the Lower Athabasca River, Canada

1
Watershed Hydrology and Ecology Research Division, Environment and Climate Change Canada, University of Victoria Queenswood Campus, 2474 Arbutus Road, Victoria, BC V8N 1V8, Canada
2
Department of Geography, University of Victoria, Victoria, BC V8W 2Y2, Canada
3
Department of Civil Engineering, University of Victoria, Victoria, BC V8W 2Y2, Canada
4
Environment and Climate Change Canada, Canadian Rivers Institute, Faculty of Forestry and Environmental Management, University of New Brunswick, Fredericton, NB E3B 5A3, Canada
5
Environment and Climate Change Canada, Canadian Rivers Institute, Department of Biology, University of New Brunswick, Fredericton, NB E3B 5A3, Canada
*
Author to whom correspondence should be addressed.
Water 2023, 15(7), 1373; https://doi.org/10.3390/w15071373
Submission received: 14 February 2023 / Revised: 16 March 2023 / Accepted: 22 March 2023 / Published: 3 April 2023
(This article belongs to the Special Issue Hydrology and Climate Change)

Abstract

:
The lower Athabasca River (Canada) has experienced notable declines in streamflow and increasing oil sands development since the 1970s. This study investigates the potential impacts of climate change on navigability using both observed historical and projected future flows derived via hydrological simulations driven by an ensemble of statistically downscaled general circulation model climate data. Our use of proposed indices that form the Aboriginal Navigation Index (ANI) and a new index based on percentage over threshold (POT) occurrences yielded novel insights into anticipated changes to the flow regime. Comparisons of near (2041–2070) and far (2071–2100) future periods with the historical baseline (1981–2010) yielded results that project significant reductions in the 500 m3 s−1 POT during the fall navigability period spanning weeks 34 to 43, as well as reductions in the integrated ANIFall. These results indicate that challenging navigational conditions may become more frequent in the second half of the 21st century, not only during this fall period but also earlier into the summer, due to a shift in the flow regime, with potentially severe impacts on the users of the river channels. Our assessment approach is transferable to other regional study areas and should be considered in water management and environmental flow frameworks.

1. Introduction

During the past century, climate change and variability, land- and water-use changes, and instream flow alterations for the purposes of development have all affected the quantity and timing of water flowing in river systems [1,2,3,4]. Globally, forty-eight percent of river volume is moderately to severely affected by flow and/or fragmentation [5]. Furthermore, only ~37% of rivers longer than 1000 km remain free-flowing over their entire length [6]. Over the past decades, both free-flowing and instream-altered river systems have been affected by extreme seasonal low flow periods, which have had substantial impacts on society and the economy, such as navigable flows [7,8,9]. The latter has been of interest for several decades as part of examining environmental flows (e.g., [10,11,12]).
Western Canada is an area of particular concern given the historical and projected rate of climate warming combined with the increasing demand for water from industrial and municipal development [13,14,15,16]. Many northern communities rely on waterways not only for water supply but also to support economic activities and livelihoods [8,9]. A cold-region river system that provides a range of ecosystem services is the Athabasca River, one of the longest undammed rivers in North America that flows more than 1450 km and has received international attention due to an impending water scarcity crisis postulated by Western scientists [16] and Indigenous Peoples [17].
In response to concerns regarding growing water use allocations for development and declining summer flows, the Government of Alberta approved the Surface Water Quantity Management Framework for the lower Athabasca River to manage water withdrawals by the oil sands sector based on a set of weekly flow triggers and limits, while balancing social, environmental, and economic interests [18]. The framework incorporates an Aboriginal Navigation Index that recognizes the river as an important transportation corridor providing access to Indigenous traditional lands and activities, such as hunting during the seasonal open-water low-flow period when there is a need to get the boat “on step” with the added weight of a harvested moose on board [19].
Navigability along a river reach is affected by channel characteristics that convey a given flow and generate a corresponding water depth, which may be impacted by water withdrawals, past dredging and its cessation, and fluctuating flows due to a varying and changing climate, as well as changing geomorphology. River users have noted that sections of the lower Athabasca River system have experienced poor navigability. Hence, there is a concern that water withdrawals from the river and tributaries exacerbate the natural changes and adversely affect navigation during seasonal low-flow periods.
A navigation study for Transport Canada examined more than 11 high-risk sites along the lower 200 km reach of the Athabasca River [20]. Important conclusions that can be gleaned from this report are that current water withdrawals by the oil sands sector (<8 m3 s−1) decrease the daily open-water depth by less than 0.02 m, with climate change likely resulting in a relatively much greater impact on water depth. The assessment of the projected climate change effects on navigability on the river via the application of the Aboriginal Navigation Index has yet to be carried out. This important knowledge gap thus warrants a more in-depth consideration to gain an understanding of anticipated changes to the river flows during times of the year when access by boat is critical for Indigenous Peoples.
The goal of this paper is to present the results of an investigation assessing the potential impacts of climate change on navigability indices for the lower Athabasca River streamflow using both observed historical flows and projected future flows derived via hydrological simulations driven by multiple statistically downscaled general circulation model climate data outputs. The focus will be on employing a suite of navigational flow-related hydrological indices to inform users of the river system and incorporate this knowledge into water management and holistic environmental flow frameworks.

2. Study Area

The Athabasca River forms one of the headwater source rivers of the Mackenzie River Basin in western Canada (Figure 1). The river originates from the melt of snow and ice of the Columbia Icefields in the Rocky Mountains. From there, the river travels through the rugged alpine, sub-alpine, and forested montane natural sub-regions of Jasper National Park, further through foothills and onto the low relief, mixed wood forest of the Boreal plains. At Fort McMurray, the Hangingstone (Boreal highlands) and Clearwater (Athabasca plains and Boreal shield) Rivers join the mainstem. Flowing north, the mainstem is joined by several smaller tributaries, including the Steepbank, Muskeg, Mackay, Firebag, and Richardson Rivers that drain the nearby hills.
The Athabasca River is the largest direct inflow to the connected Lake Athabasca and Peace–Athabasca Delta. The latter is a wetland ecosystem of international significance recognized by the Ramsar Convention, and 80% lies within the Wood Buffalo National Park, a UNESCO World Heritage Site. The Athabasca River Basin (~159,000 km2) and downstream Peace–Athabasca Delta (~6000 km2) are located predominantly on Treaty 8 Land, with a portion of the headwaters on Treaty 6. Several First Nation and Métis Nation people utilize the lower Athabasca River and connected waterways.
The Athabasca River Basin drains eight physiological sub-regions of Alberta [22]. Agriculture, oil and gas, and forestry-related land-use change activities are present within the basin [23]. Several pulp mills are located on the river between the town of Hinton and Athabasca, and oil sand mining occurs near Fort McMurray. Landscape alteration associated with open-pit mining of oil sands commenced in the late 1960s. Approximately 740 km2 of the 4800 km2 available for surface mining have been disturbed as of 2020 [24] (Figure 1). Less than 5% of the annual river flow is allocated for water use; withdrawals by the oil sands industry comprise the bulk of this allocation [18]. The oil sands industry has a maximum cumulative allowable water extraction of 29 m3 s−1 from the Athabasca River when the flow is ample (e.g., summer time), reducing to 4.4 m3 s−1 when the flow is restricted (e.g., winter time) [18]. In recent years, approximately 3 to 7 m3 s−1 have been extracted from the lower Athabasca River on a daily basis by the oil sands industry [25,26].
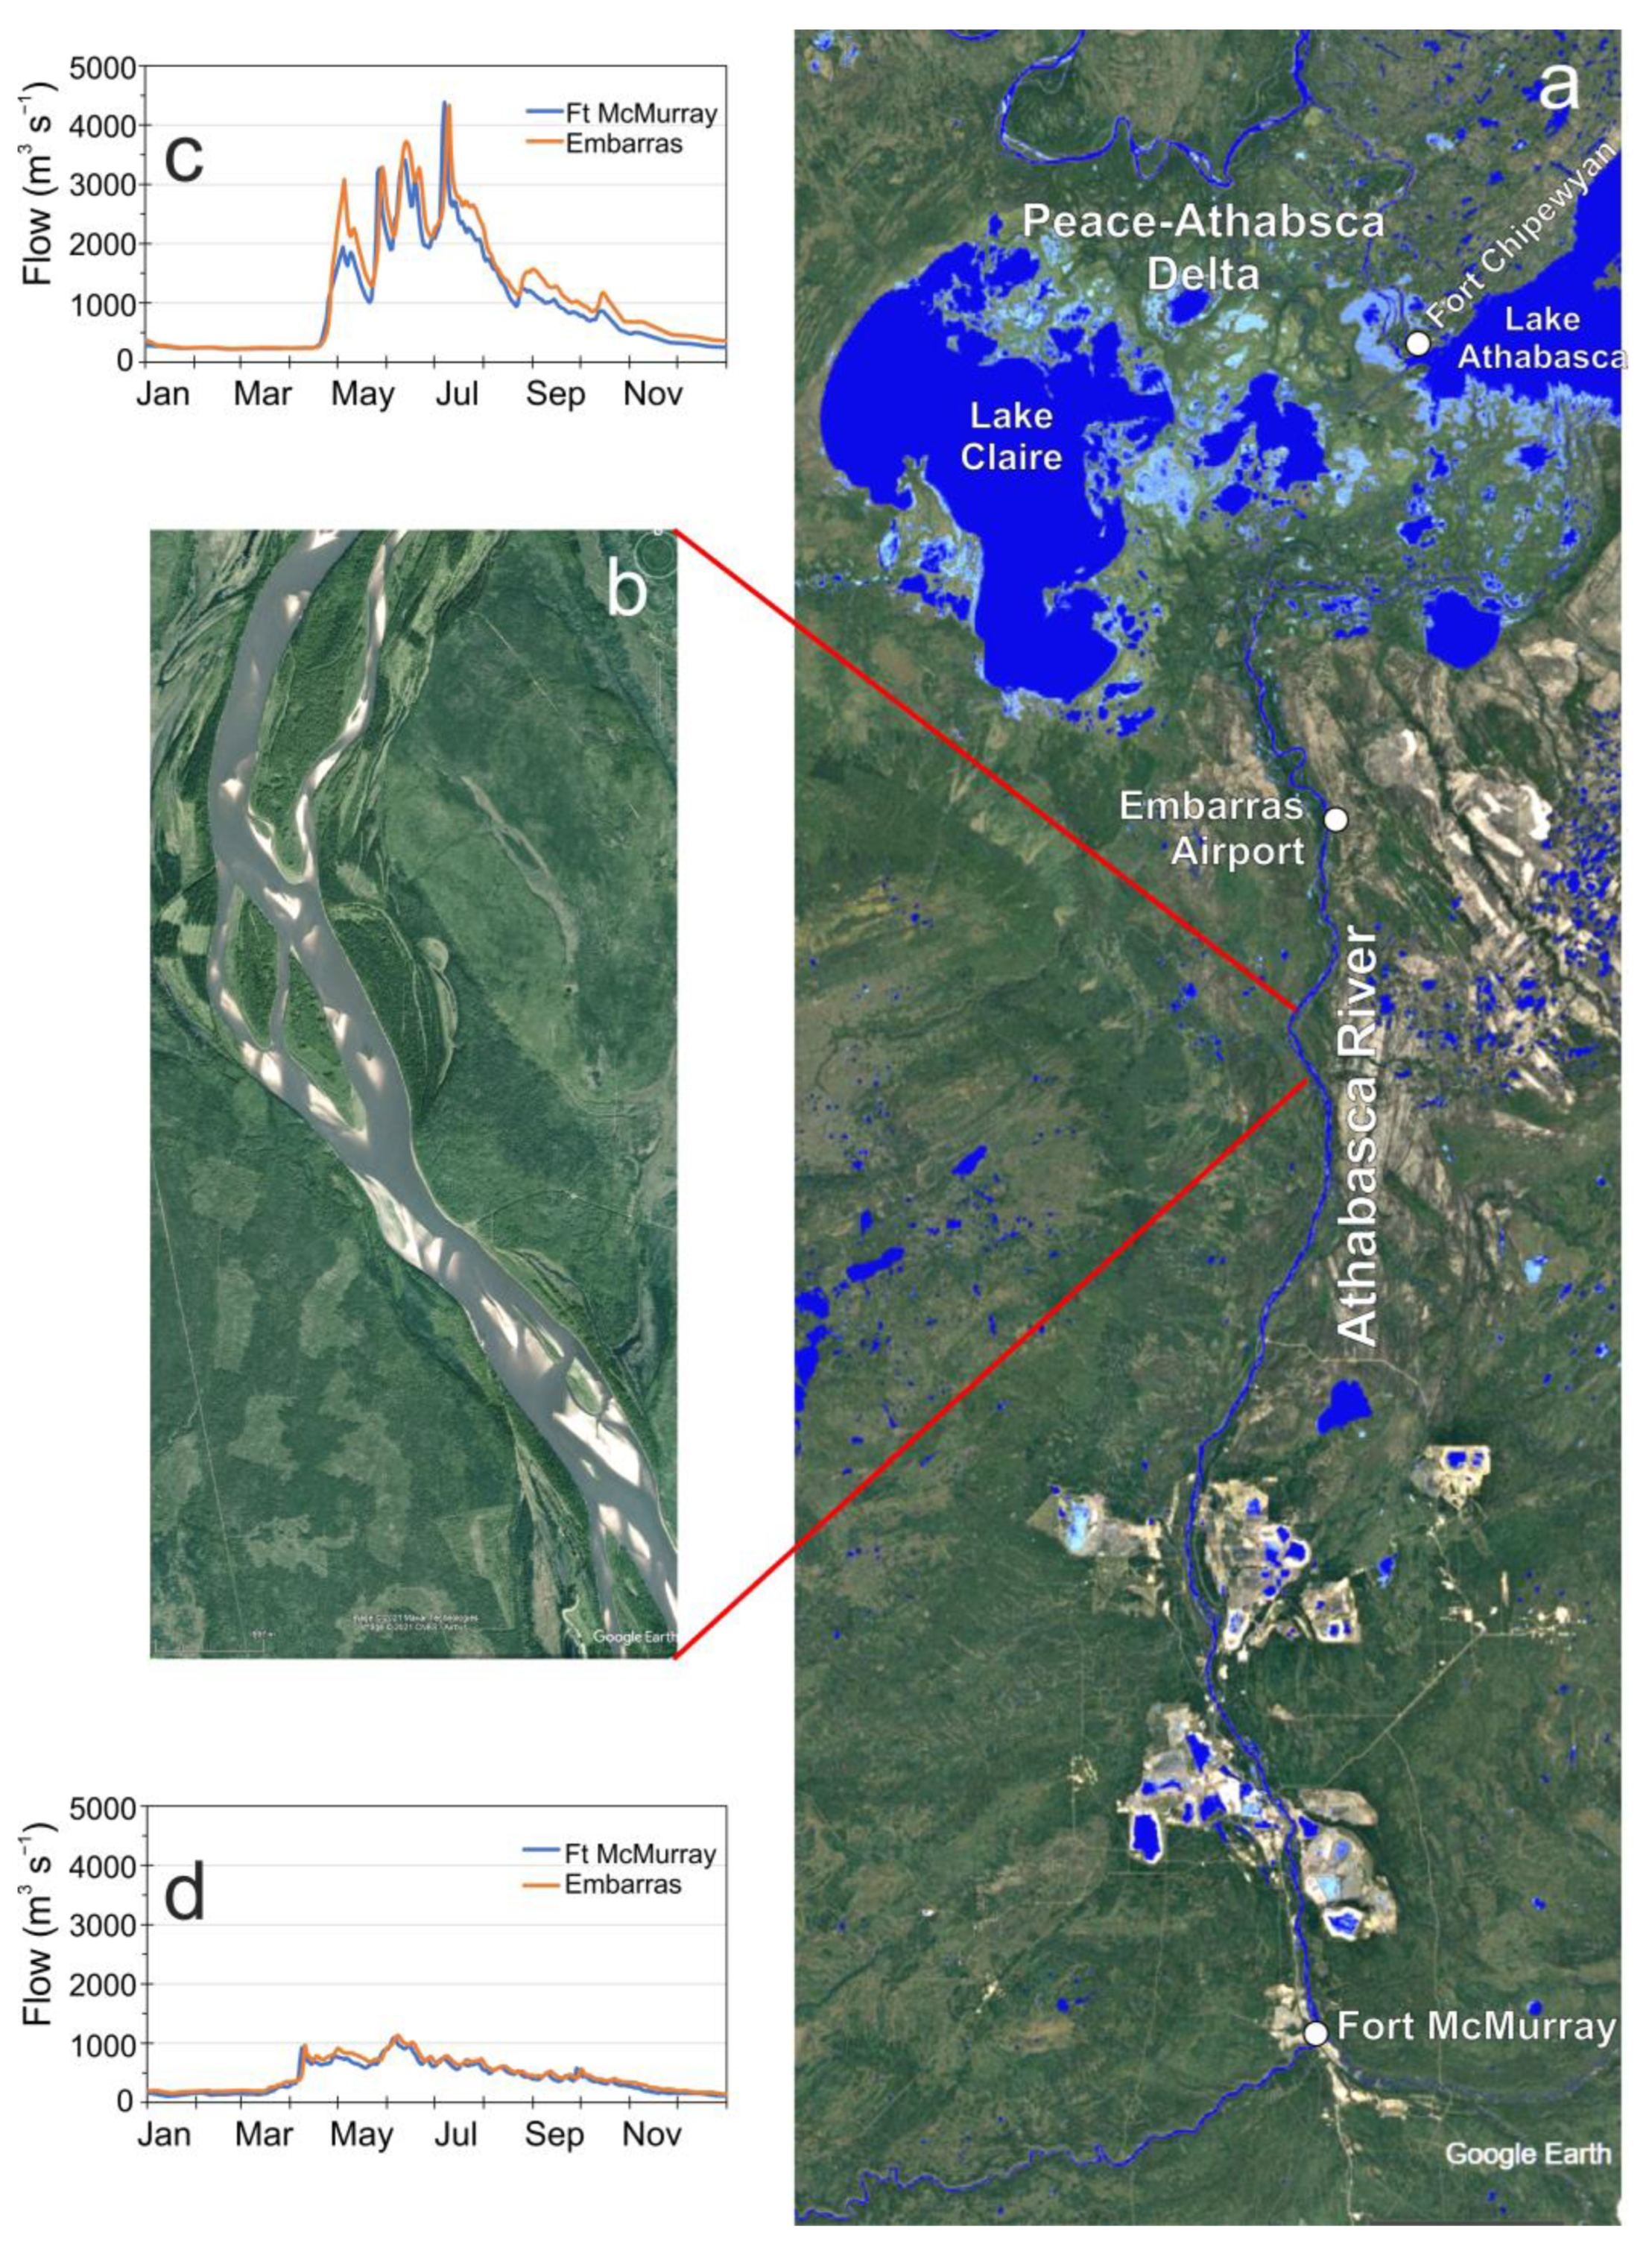
The river gradient changes dramatically from the headwaters to the mouth, dropping > 1200 m. The 181 km reach downstream of Fort McMurray to Embarras Airport has a river slope of approximately 1.06 cm km−1, and the slope drops to 0.25 cm km−1 in the last 115 km to Lake Athabasca [27] (Figure 2a). The lower Athabasca River mainstem has numerous small islands, mid-channel bars, and sand bars around curves (Figure 2b), with meanders progressing downstream closer and within delta distributary channels, such as the Embarras River [28].
An ice cover typically forms on the length of the Athabasca River in early November [29]. Shortly thereafter flows decrease to a minimum of ~200 m3 s−1 at Fort McMurray. The ice cover remains until late April to early May when it disintegrates in response to warming air temperatures and the addition of snowmelt runoff. River discharge rises rapidly in mid-April near the delta, producing the first peak of the year at ~1000 m3 s−1, on average. With the addition of rainfall runoff from the lower portions and snowmelt runoff from the upper portions of the drainage basin, the mainstem discharge continues to increase and experiences a second, higher peak of >1500 m3 s−1 in mid-summer. Streamflow typically decreases along the entire mainstem subsequent to August. Figure 2c,d show the divergence between an open-water high-flow year (2020) versus a low-flow (2015) year.
Recognizing the importance of the Athabasca River to the ecology and economy of the area, the government of Canada and Alberta initiated a Joint Oil Sands Monitoring Program (JOSMP) to ‘‘implement scientifically rigorous, comprehensive, integrated and transparent environmental monitoring of the oil sands region to ensure this important national resource is developed in a responsible way” [30,31,32]. Furthermore, the Surface Water Quantity Management Framework for the lower Athabasca River (hereafter “the Water Framework”) established weekly environmental flow targets and triggers to check the oil sands sector water use to protect river health [18].

3. Methods

3.1. Hydrometric Data Sources

Historical observed daily flows (m3 s−1) for the Athabasca River just below Fort McMurray (07DA001; 1958–2018) and downstream near Embarras Airport (07DD001; 1971–1984 and 2014–2018) were obtained from the HYDAT archive [33] (see Figure 1 and Figure 2 for locations). Simulated streamflow data were obtained from the study of Dibike et al. [34], which utilized the variable infiltration capacity process-based and distributed hydrologic model to produce the following streamflow time series: (1) historical reference baseline (1981–2010), (2) near future (2041–2070), and (3) far future (2071–2100) periods. The streamflow simulations were generated based on climate data derived from 6 general circulation models from the Coupled Model Intercomparison Project Phase 5 (CMIP5, [35]) corresponding to the representative concentration pathway (RCP 4.5 intermediate and RCP 8.5 worst case) emission scenarios and two statistical downscaling methods, forming an ensemble of 24 hydrologic projections for the 07DA001 hydrometric site on the lower Athabasca River. The variable infiltration capacity model has been successfully applied to simulate historical and future flows in large basins, including the Athabasca River Basin. Details of the rationale for climate scenario selection and the hydrological model application over this basin, its calibration/validation, and derivation of daily flow datasets can be found in Eum et al. [36,37,38] and Dibike et al. [34,39].

3.2. Navigation Indices

Two approaches were used for investigating historical and projected future changes to flow magnitude thresholds that negatively affect Indigenous Peoples’ navigability of the lower Athabasca River mainstem.

3.2.1. Fall Aboriginal Navigation Index (ANIFall)

The preliminary Fall Aboriginal Navigation Index (ANIFall) trigger is an index proposed in the Water Framework [18] that is based on the concepts of the Aboriginal Base Flow (ABF) and Aboriginal Extreme Flow (AXF) developed by Candler et al. [40] for Indigenous users of the river as the range in stream flow where navigability declines from “good” (ABF) to “poor” (AXF). The ABF (1600 m3 s−1) is a level where Treaty and Aboriginal rights with regards to navigation and access may be practiced fully along the lower Athabasca River and adjoining tributaries, while the AXF is a safe navigational depth of 1.2 m required for a fully loaded boat with an outboard motor [18,40].
The ANI is a function of flows entering the lower Athabasca River reach represented by flows (Q) measured at 07DA001 in the following equations:
ANI = { 0        Q < 300   m 3   s 1 0.018 Q 0.605 0.563    300   m 3 / s   Q < 1600   m 3   s 1 1         1600     m 3   s 1   Q
ANI is a value ranging between 0 and 1, where a value of 0 corresponds to flow of <300 m3 s−1 and 1 corresponds to 1600 m3 s−1 (ABF). The ANI is ~0.1 at the original AXFO of 400 m3 s−1 proposed by Candler et al. [40] and is ~0.2 for a revised AXFR of 500 m3 s−1 proposed by Carver [41] based on more recent field-based science [42]. The AXFR was independently supported by hydraulic modeling studies to provide a water depth of 1.2 m [20,43].
Of particular interest is the end of summer/early fall period, which is a time of year when Aboriginal Peoples’ access to traditional waterways and landscape may be impeded by seasonal low flows. The Fall Aboriginal Navigation Index is calculated from [18]:
ANI Fall = 1 10 i = 34 43 ANI ( Q i )
where i is for weeks 34 to 43 (August 20 to October 28), and Qi is the average weekly flow.
Although there is a broader move within Canada towards the use of the term Indigenous, as a collective name for the original peoples of North America and their descendants, the Canadian Constitution specifically recognizes and affirms the existing Aboriginal and Treaty rights of the Aboriginal Peoples (First Nations, Métis, and Inuit—3 distinct peoples with unique histories, languages, cultural practices, and spiritual beliefs). Furthermore, it is formally recognized that Indigenous Peoples in Canada have full control over the collection, ownership, storage, and use of their Indigenous knowledge and Indigenous science. The ANI, ABF, and AXF are, therefore, used hereafter fully respecting the above.

3.2.2. Percentage Days of Flow above a Threshold

To understand the historical behavior of daily flows and facilitate the analysis of projected climate change effects on weekly ANI and ANIFall, as well as on ANI = 0, AXFO, AXFR, and ABF thresholds, the percentage of days in a given week when flows were more than a threshold was calculated. Each daily flow was assigned a value of 1 if the flow was ≥threshold and 0 when <threshold. These values were then summed up for each week and divided by the number of days in a week to derive a percentage over threshold (POT) occurrence for 300, 400, 500, and 1600 m3 s−1 (POT300, POT400, POT500, POT1600). For all weekly indices, the last week of February (week #9) during a leap year and the last week of the year (week #52) were taken as an 8-day week. See Abbreviations for these acronyms.

3.3. Statistical Analyses

As in Peters et al. [21], the Mann–Kendall (M-K; [44,45]) trend test was performed in R (Version 3.6.1; R Development Core Team [46]) using the ‘zyp’ package of Bronaugh and Werner [47], with the Zhang and Zwiers [48] iteratively pre-whitening (IPW) method applied to remove significant serial autocorrelation in the time series [49,50]. The non-parametric slope (β) of each time series was calculated using Sen’s estimate [51], and significant trends were identified at p ≤ 0.05.
Box-and-whisker plots are used to summarize weekly and seasonal index magnitude and change over the historical period and between simulated future versus baseline periods. The box was bound by the lower (Q1; 25th percentile) and upper (Q3; 75th percentile) quartiles, with both the median (line) and mean (X) shown within the box, while the ends of the whiskers (extremes) are 1.5 times the inter-quantile range beyond Q1 and Q3.

4. Results and Discussion

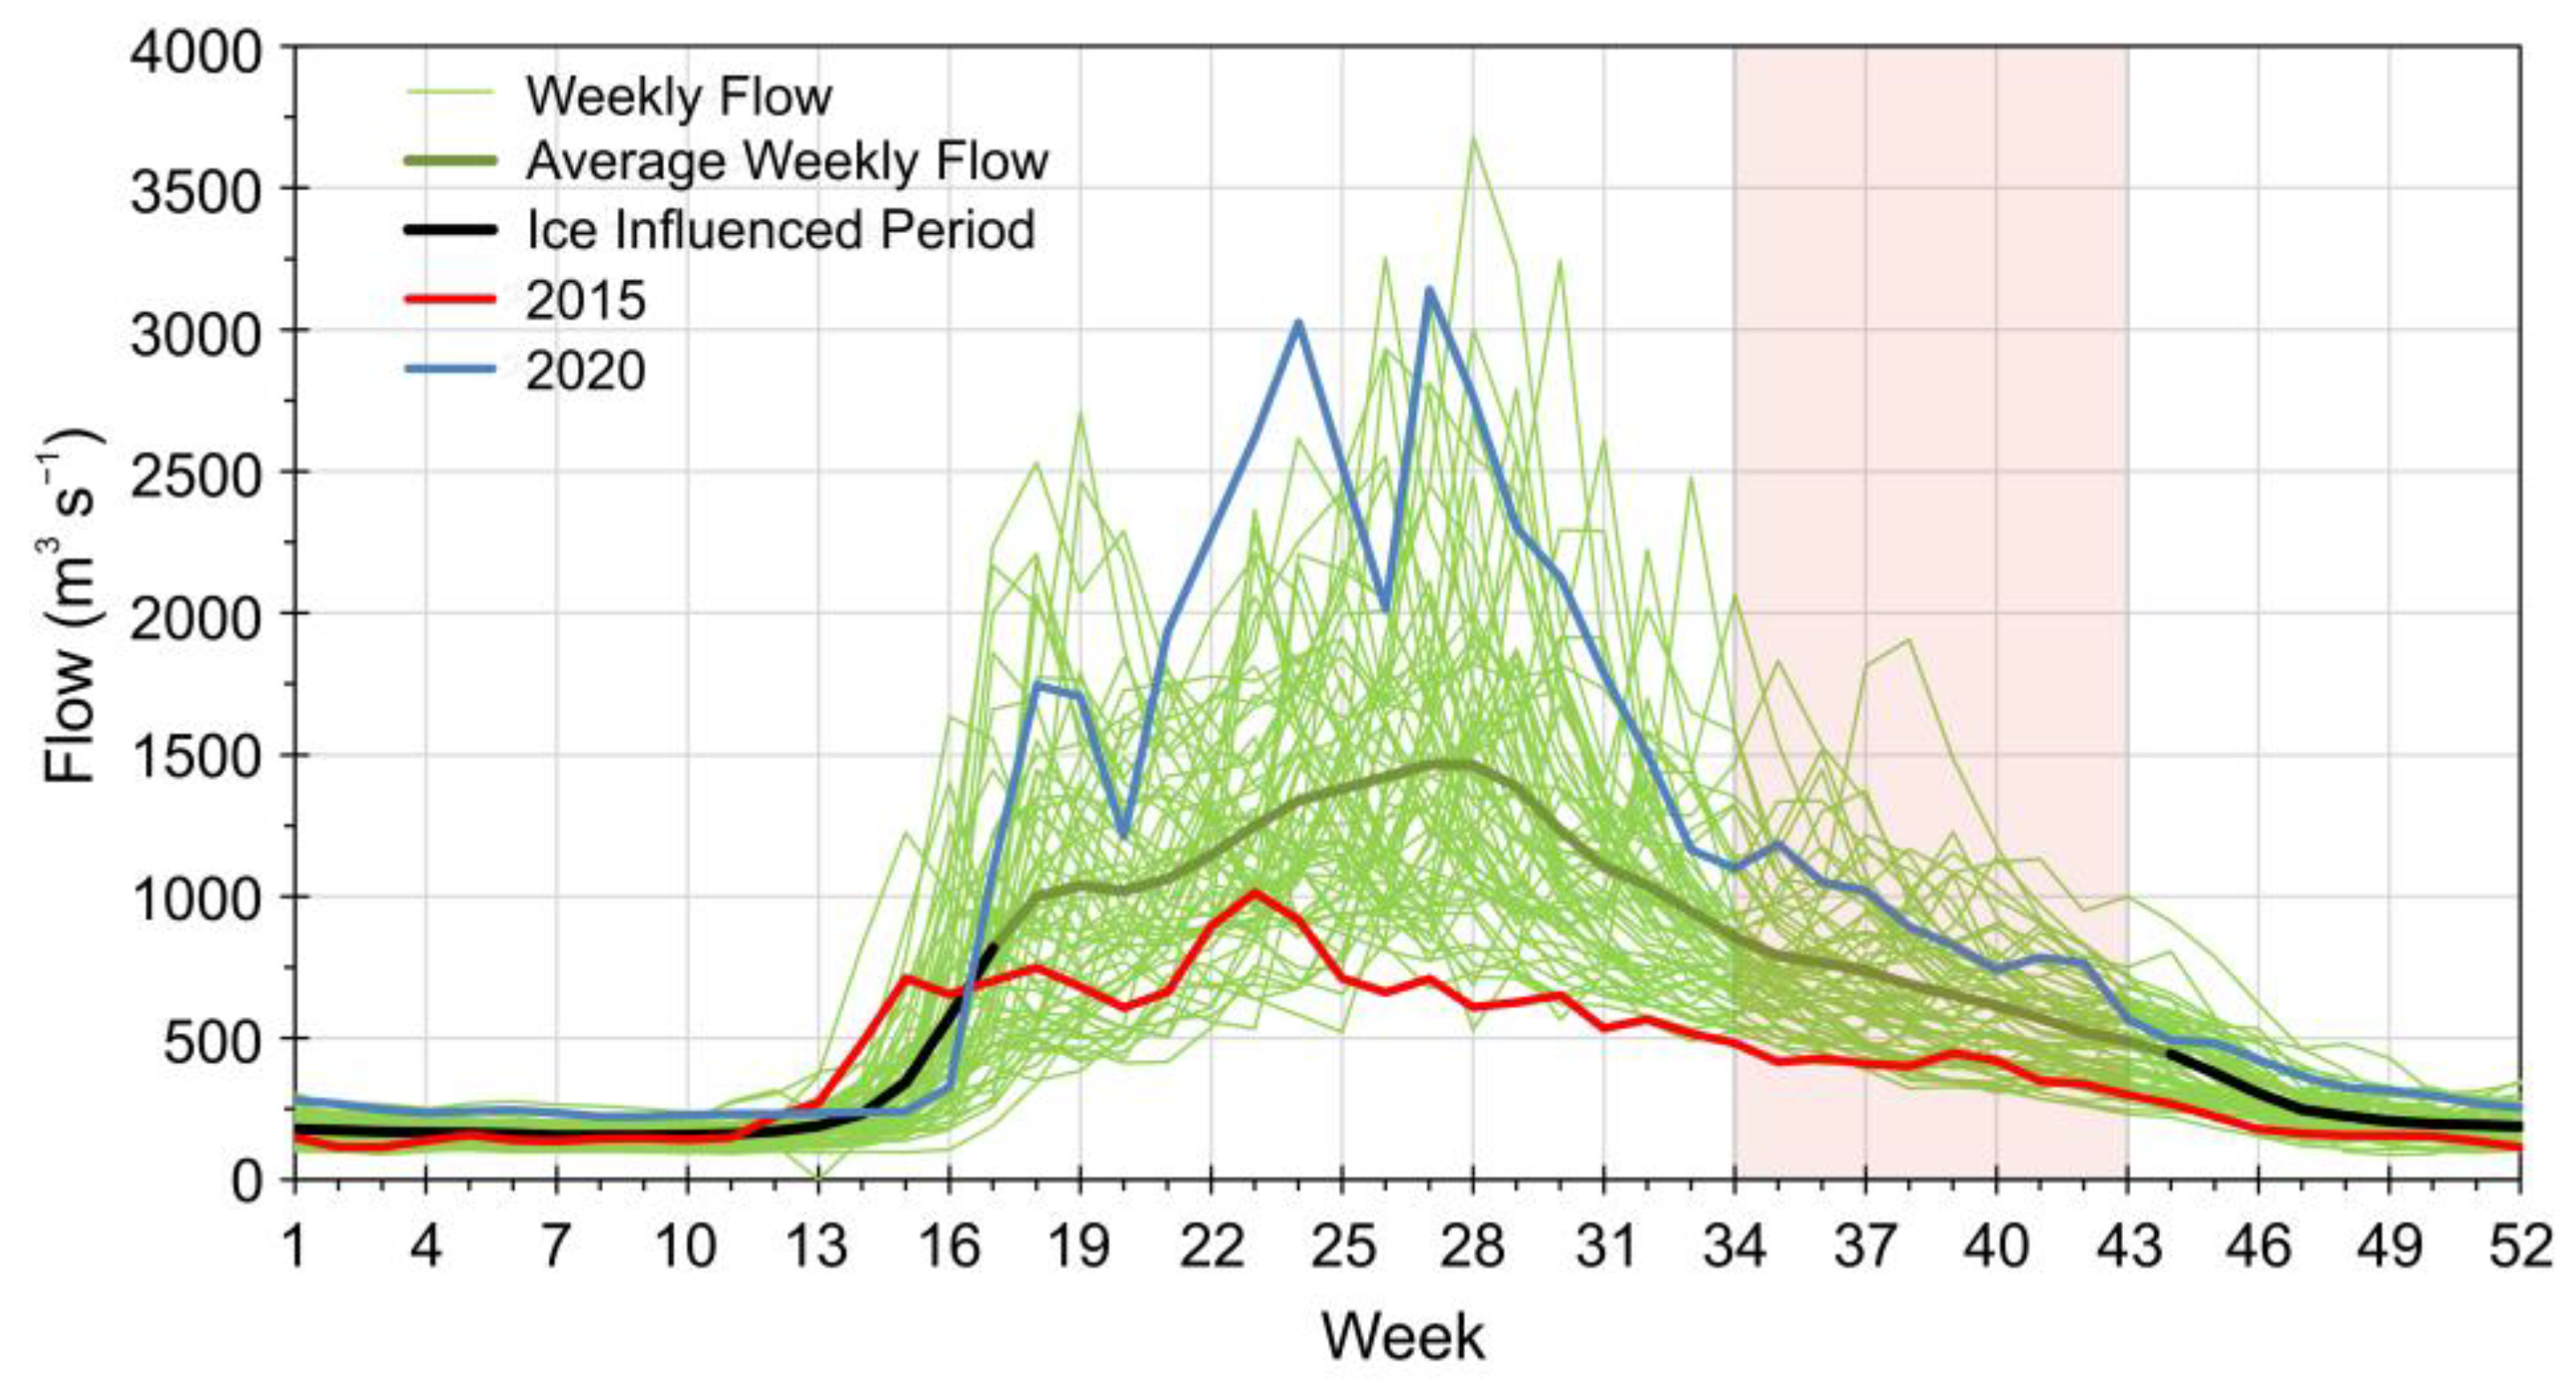
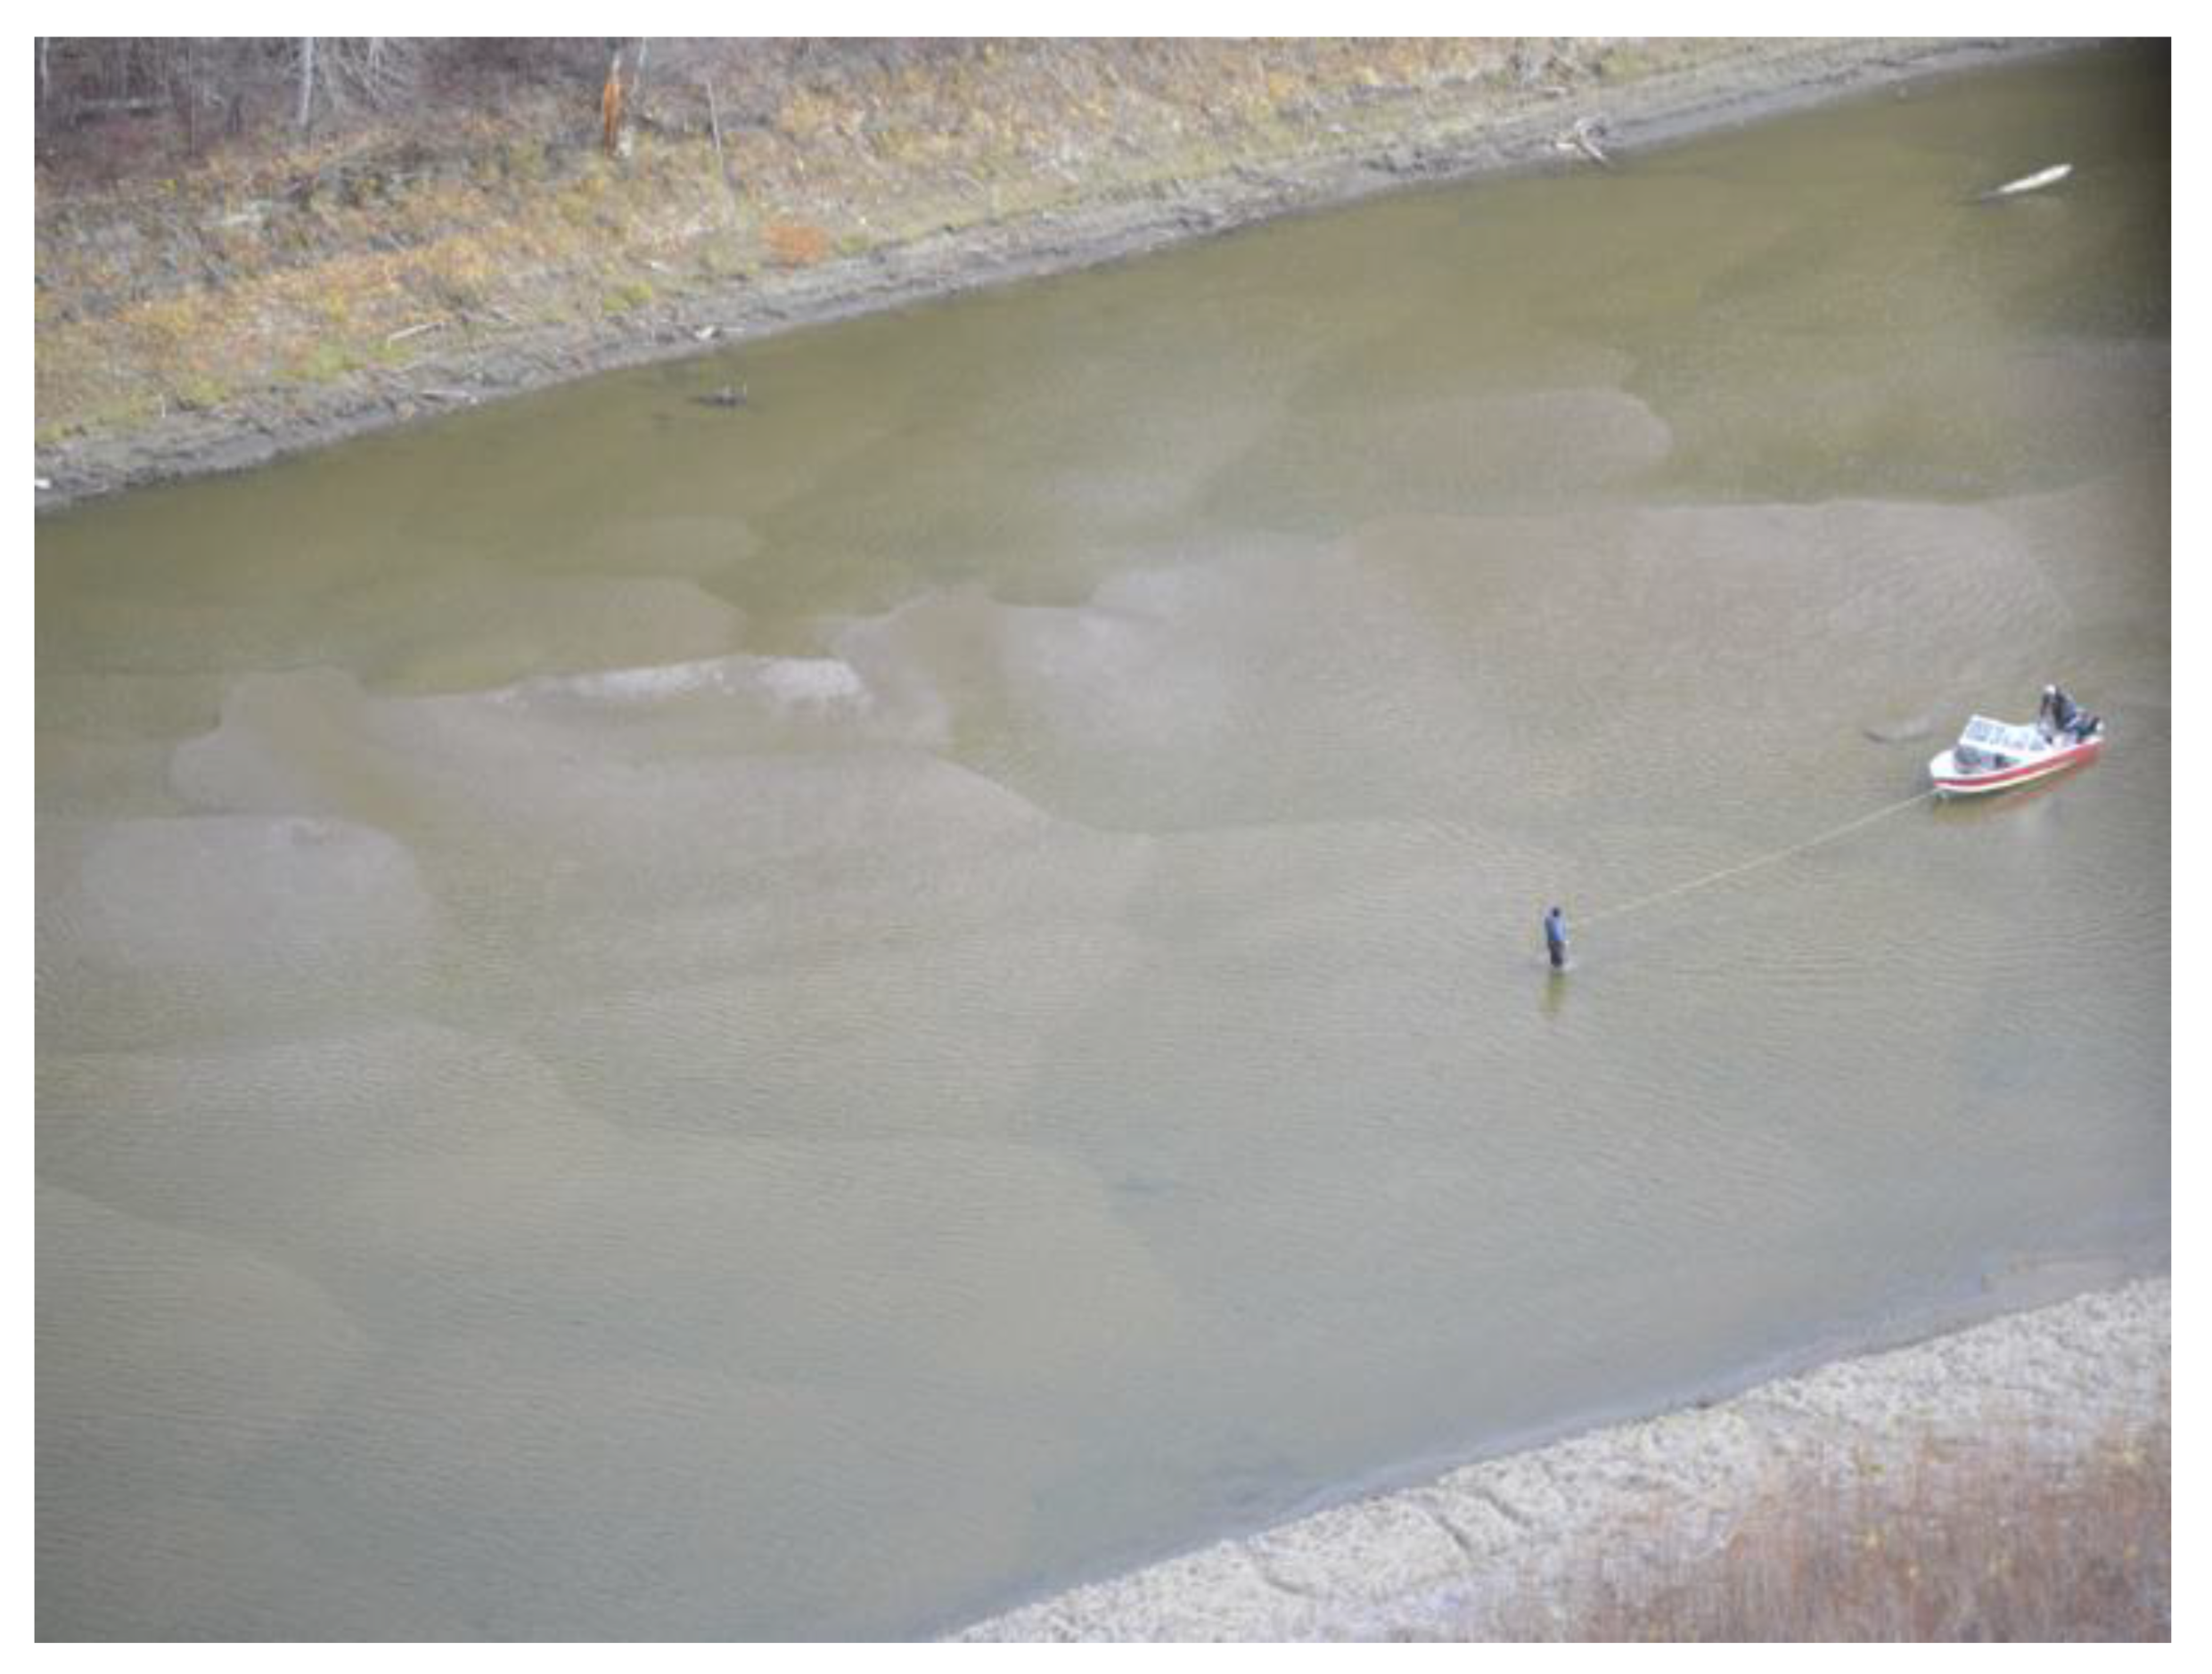
As shown in Figure 3, the average weekly flow regime of this river can be highly variable, both seasonally and from year-to-year. Navigability of small watercrafts can be challenging during lower-than-normal summer and fall flow conditions. For instance, 2015 experienced extremely low flows throughout the open-water period, especially over weeks 34 to 43 with <500 m3 s−1 (Figure 3) and reports of trouble navigating in certain reaches of the rivers as a result of water depths < 1.2 m (Figure 4). See Kashyap et al. [43] for a hydraulic modeling study on the probability of boat access at various flow rates. The year 2015 highlights the need to consider navigability as part of a holistic environmental flow framework, especially for a river system experiencing important changes to the flow regime as a result of a changing climate and increasing development [21].

4.1. Historical Flow Thresholds

As outlined in the Methods section, the key flow thresholds have been derived based on Indigenous knowledge and science. These include the ABF (1600 m3 s−1; flow above which Indigenous People are able to fully practice their rights and access territories [40]), AXFO (400 m3 s−1; [40]) and AXFR (500 m3 s−1; flow below which widespread and extreme difficulties in Indigenous navigation occurs due to loss of access [41]), and ANI = 0 (300 m3 s−1; reflecting a depth at which navigation with a loaded boat may become impossible) [18].
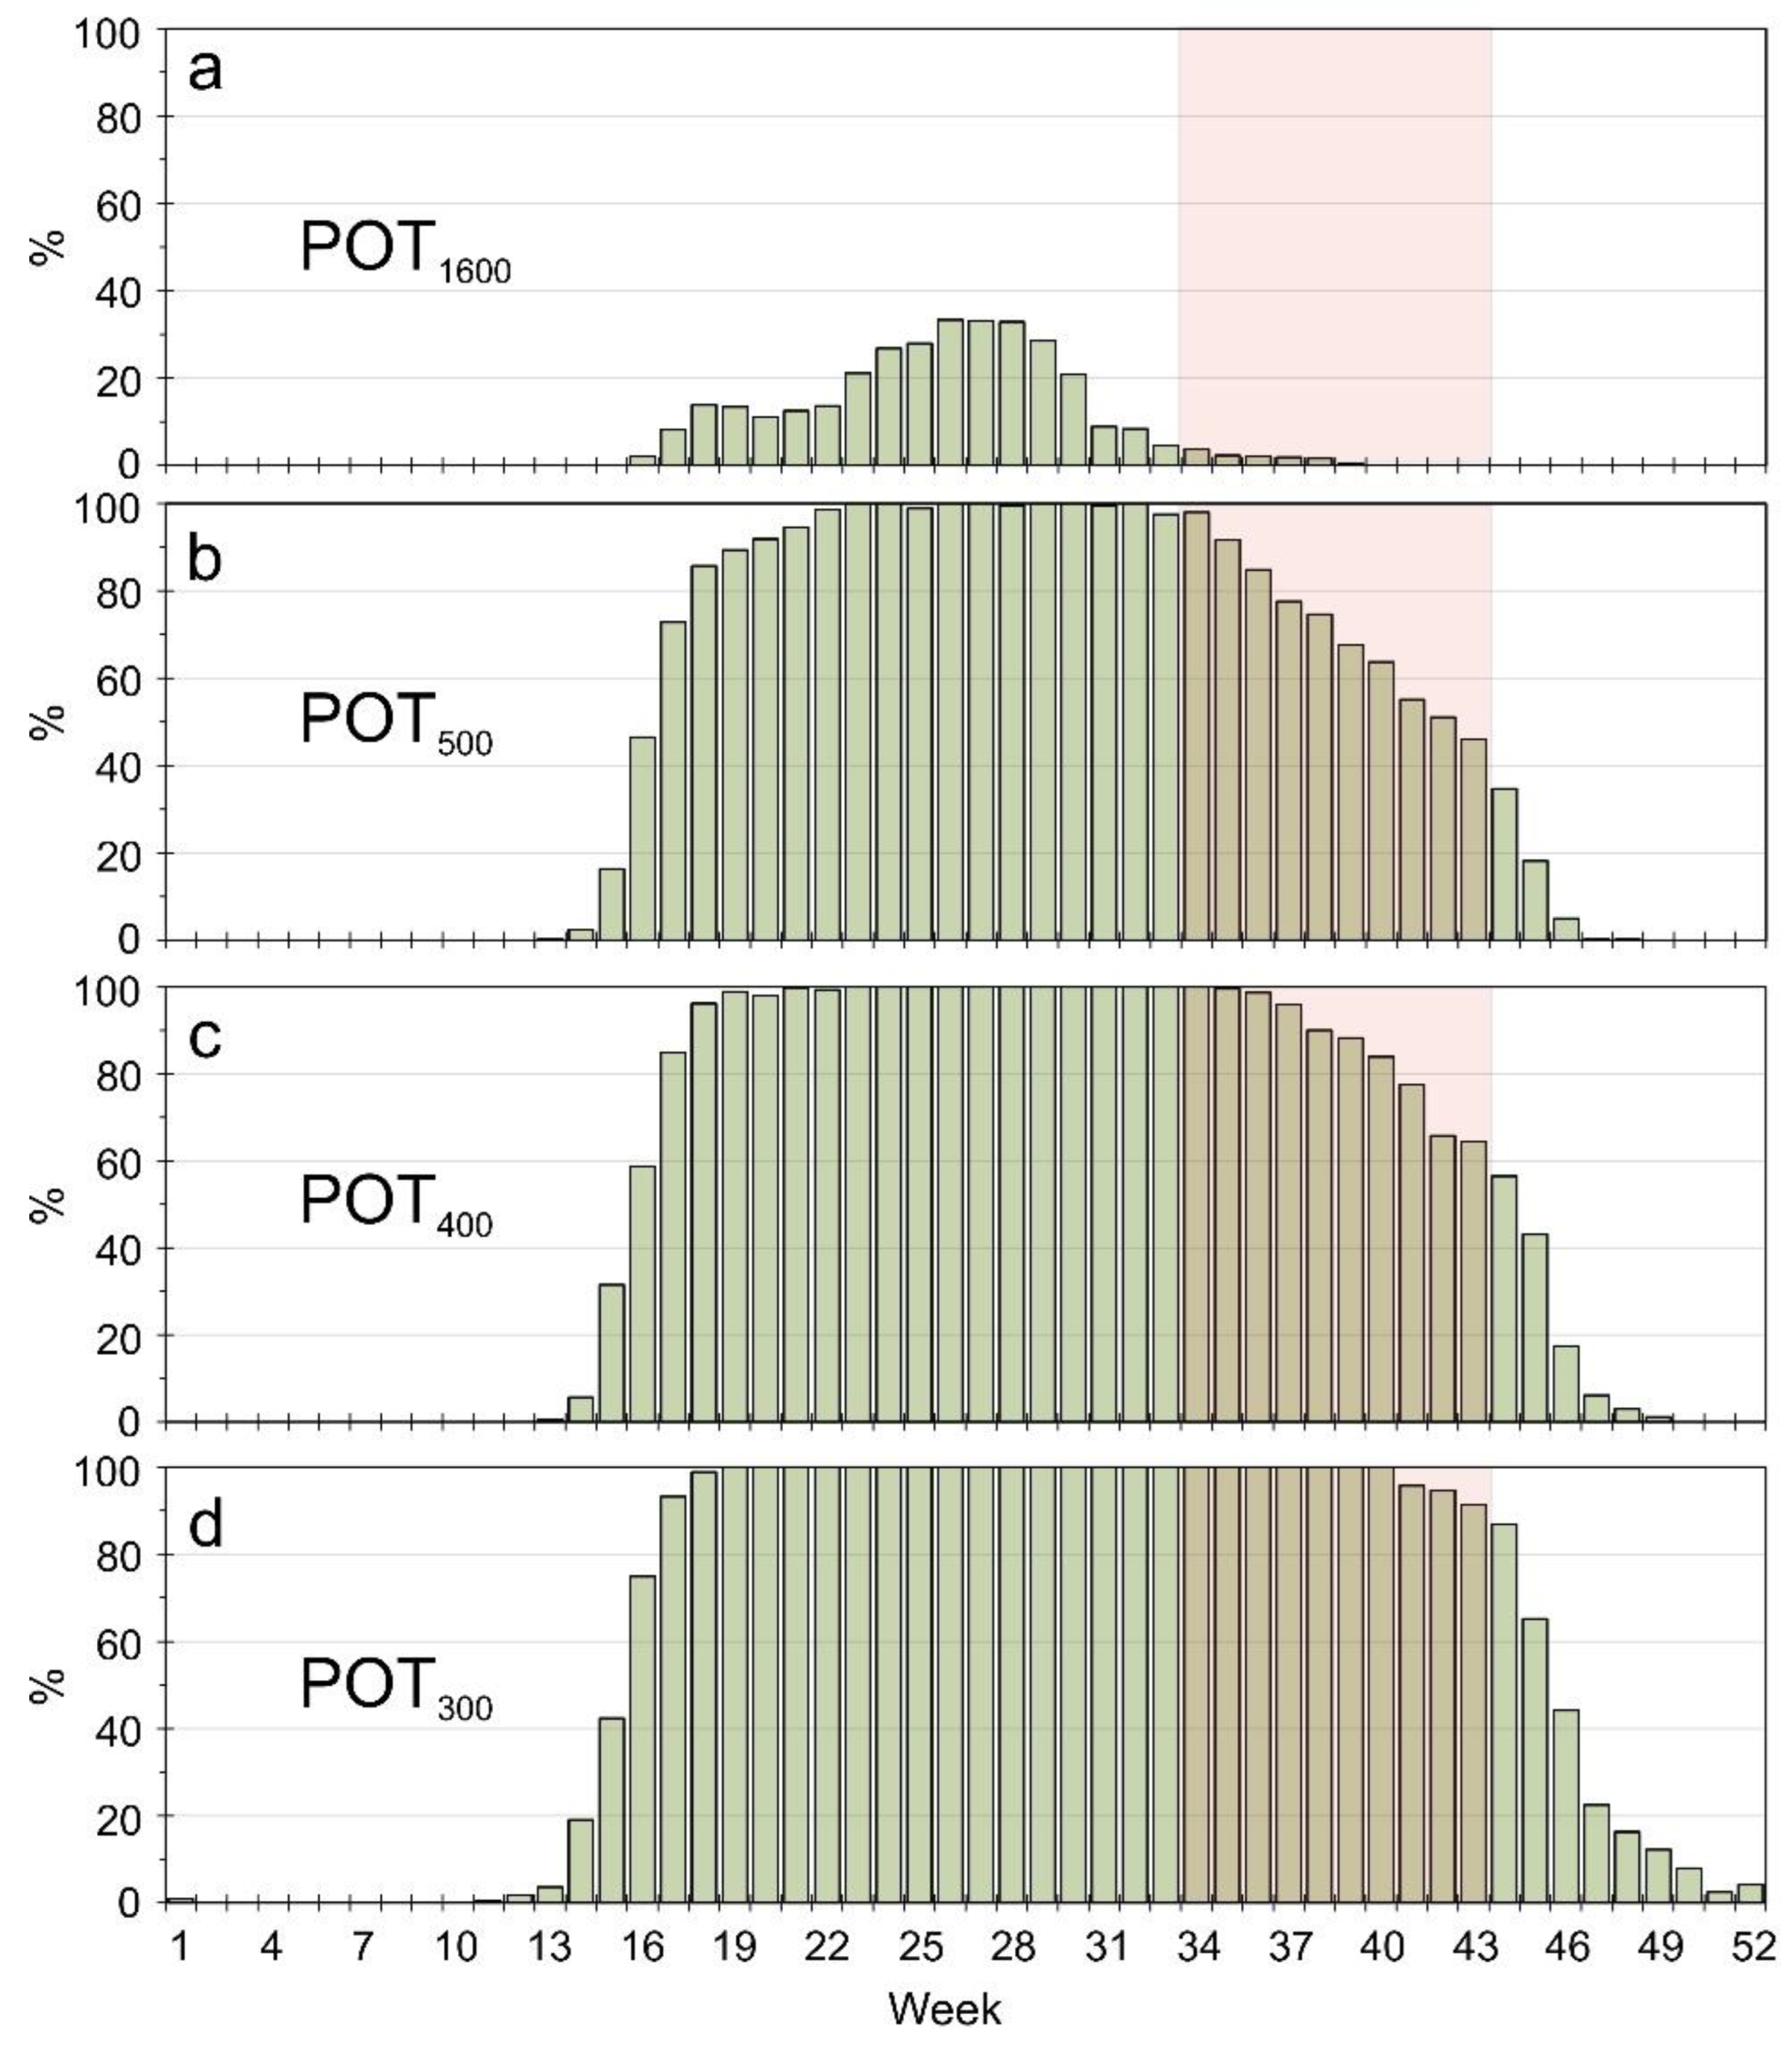
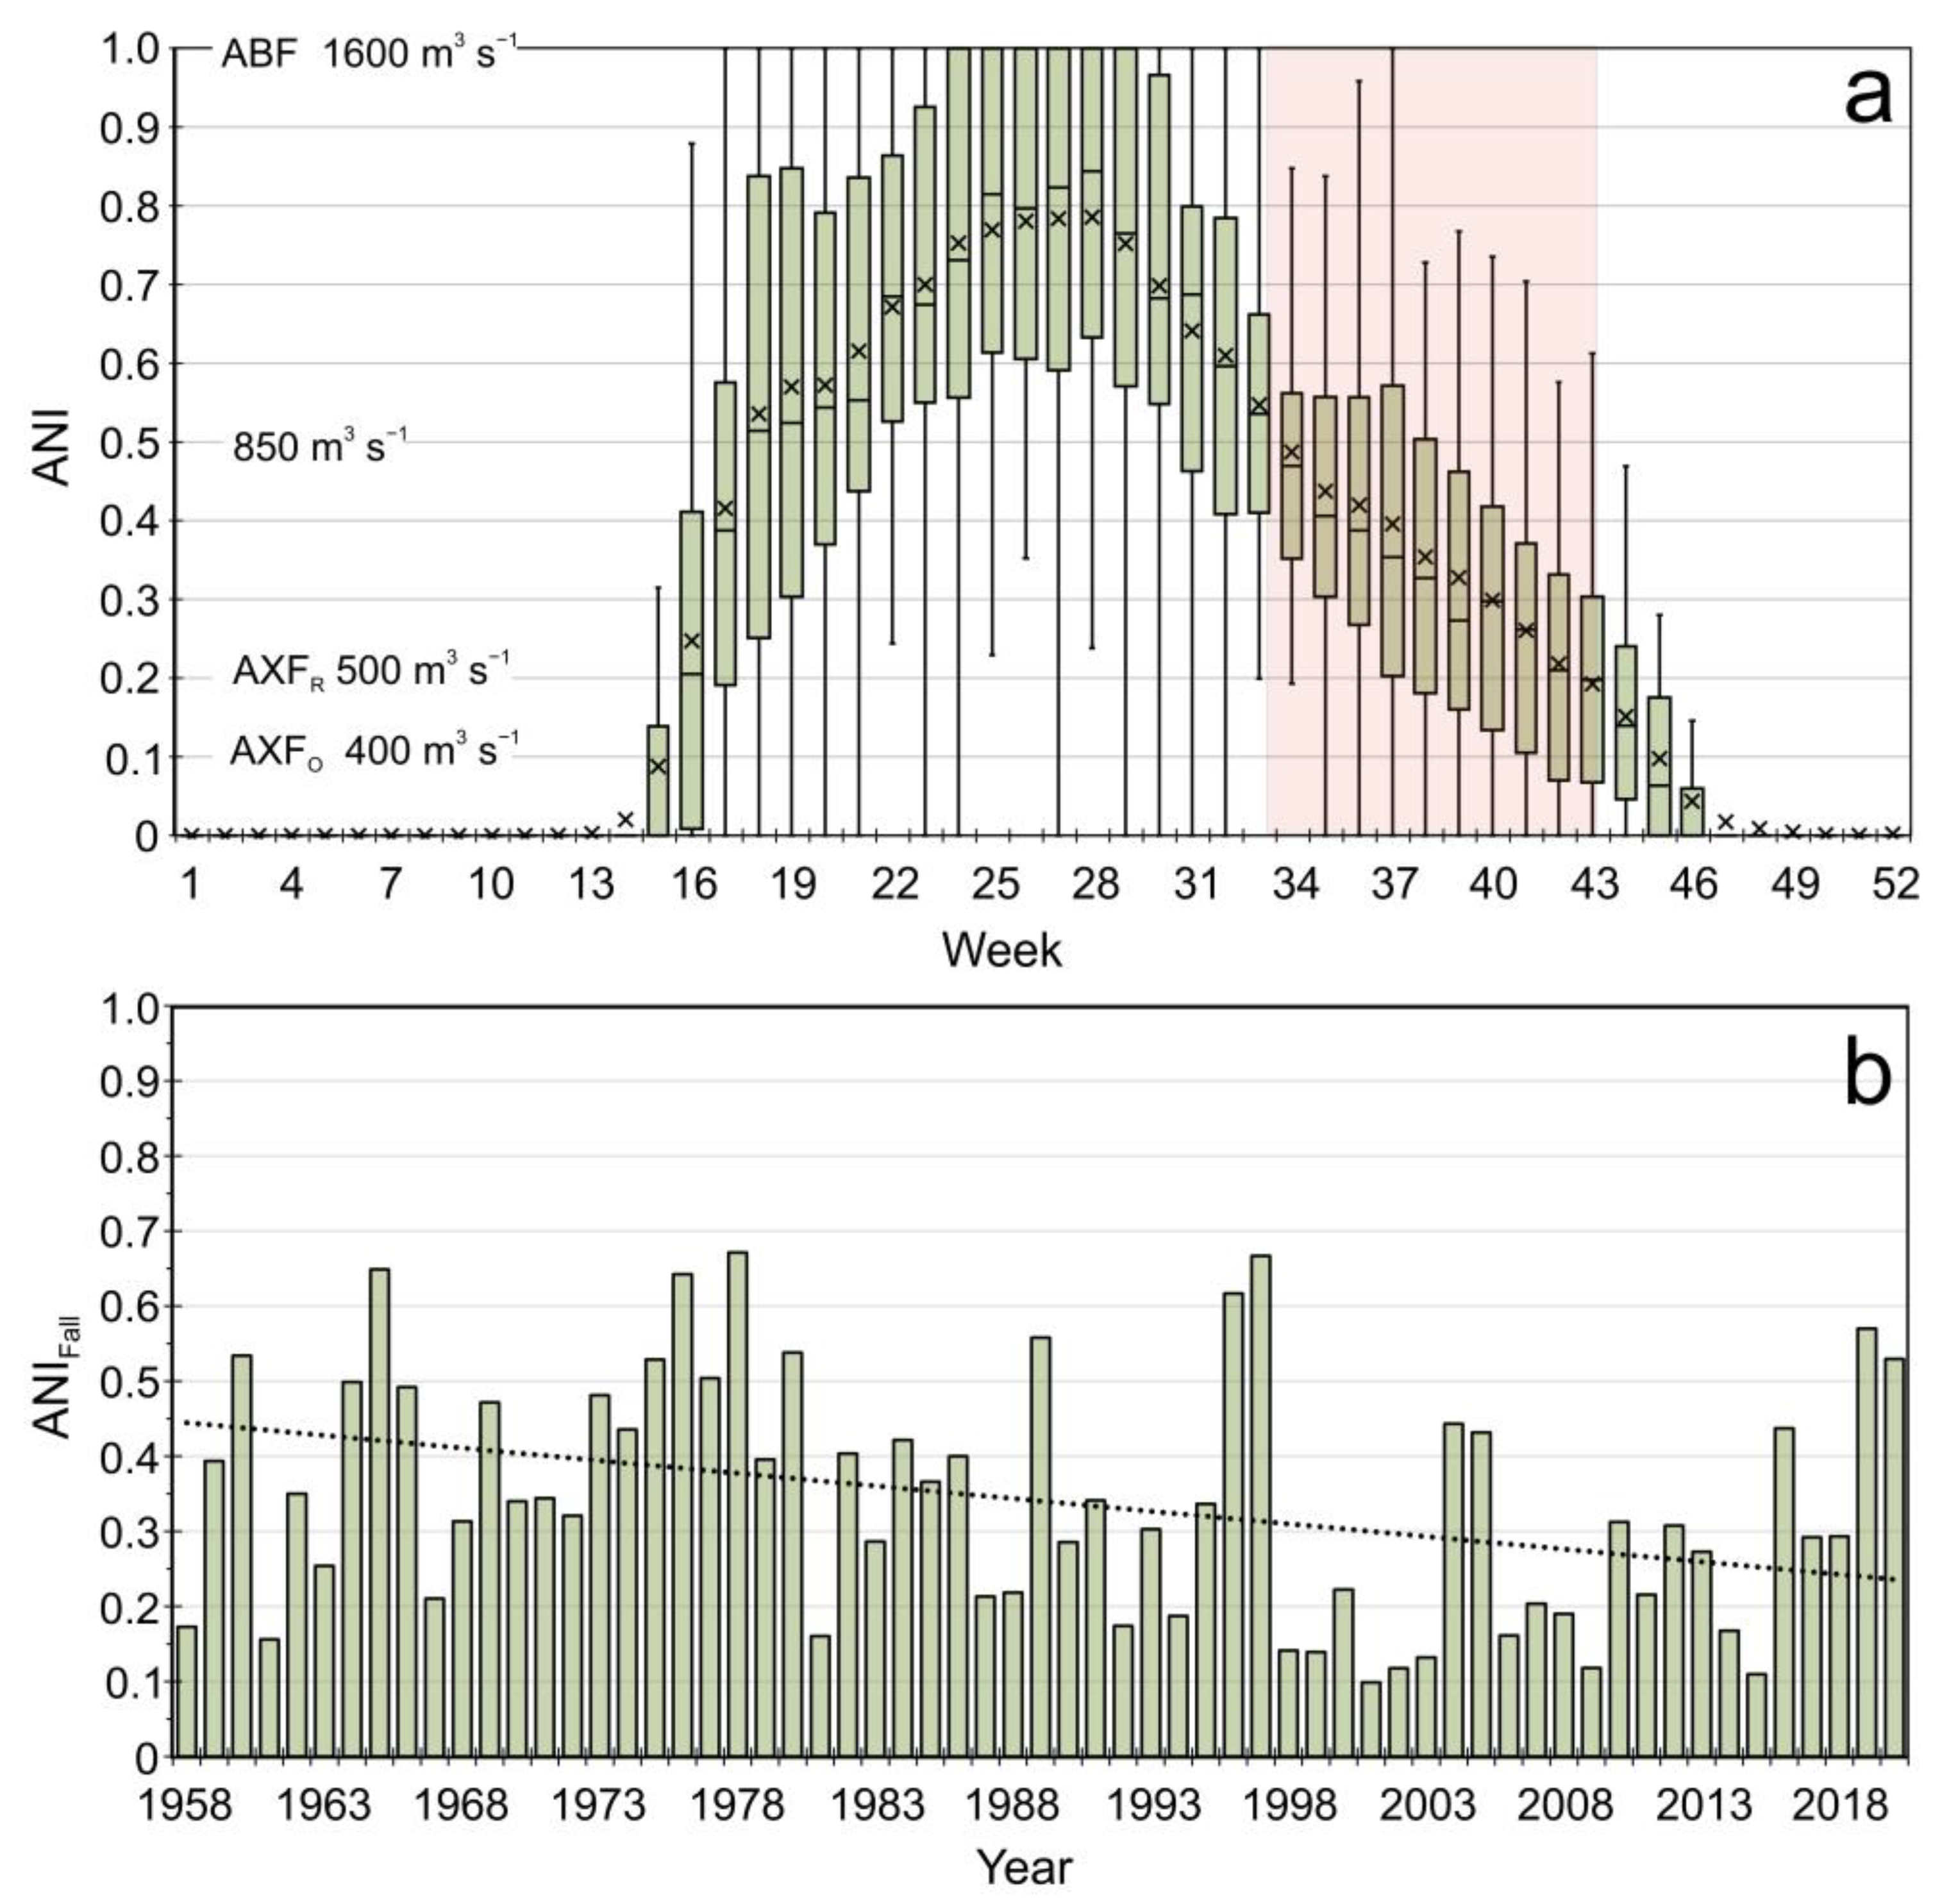
Overall, the exceedance of the ABF (POT1600) during the open-water period (~weeks 18 to 43) was not a given in any particular year, with a weekly occurrence range spanning 100% down to 0%, and the best boating conditions (e.g., deepest waters) typically occurring during the mid-summer weeks (Figure 5a). For instance, in week 26 around which the annual peak flow typically occurs on the LAR [21,29,52], the bulk of the years (mean of 67%) did not exceed the ABF (1600 m3 s−1) threshold and thus were less than good boating conditions; similar findings are seen for adjacent weeks. Noteworthily, the vast majority of years had very low to no daily occurrences of ABF exceedances during the ANIFall period spanning weeks 34 to 43, indicating that this period of interest was historically not always ideal for boating and accessing areas of importance, especially with a heavy load that would require greater water depth.
Historically, daily flows were typically above the AXFR (POT500) during the open-water period, but flow below this threshold increased in frequency after week 33, i.e., a mean of ~2% for week 34 to a mean of 54% for week 43 (Figure 5b). This response pattern aligns with the period identified by the Water Framework [18] for the ANIFall, which in combination with the hydraulic modeling verification [20,53], further indicates that this revised AXFR threshold should be incorporated into the ANI in place of the original lower value as it is more conservative in detecting earlier in the year a change in flow/water depth critical for practicing boat-related traditional activities than the lower AXFO threshold (Figure 5c vs. Figure 5b). In line with studies that have reported declines in summer/early fall flows on the river [16,21,54,55], the total number of annual AXFR threshold exceedances (POT500) over weeks 34 to 43 significantly decreased (p < 0.05; β = −0.335 y−1) over 1958 to 2020, which would have negatively impacted navigability, as noted by Elders [42].
According to the Water Framework [18], ANI = 0 (300 m3 s−1) when navigation may become impossible with a fully loaded boat at a ~1 m or less water depth. Over the 63 years of data, the average number of days when the flow was above 300 m3 s−1 (POT300) was 100% for weeks 34 to 40, 95.7% for week 41, 94.6% for week 42, and 91.4% for week 43 (Figure 5d). The minimum flows observed for these latter three weeks were 282, 258, and 238 m3 s−1, respectively. Overall, less than 300 m3 s−1 during the open-water period did occur, but this was historically uncommon. However, such occurrences may become more frequent under a changing climate and increasing water abstractions that could yield further diminished flows during critical navigation periods.
Carver [53] disputed the validity of assigning a value of 300 m3 s−1 for ANI = 0 and recommended that the AXFR be incorporated into a proposed Indigenous Navigability Index (INI) in which INI = 0 at 500 m3 s−1 and flow values below this flow threshold are retained in the calculation, and INI is assigned negative values. In light of this suggestion and taking into account the anticipated future climate change impacts on open-water flows and yet unknown changes to the channel bathymetry that may alter the AXF value associated with a ~1.2 m depth, it would be worthwhile for the Water Framework to revisit and update the preliminary index via setting ANI = 0 at 0 m3 s−1. Although a relatively rare occurrence historically, the inclusion of <300 m3 s−1 days in the ANI calculation would enable the index to be adaptable to changing channel conditions and incorporate diminishing flows beyond this threshold. Having said that, assessing the applicability of the ANI and INI is beyond the scope of this paper, but it is worth mentioning that work to further refine indicators from an Indigenous knowledge and science perspective is ongoing prior to arriving at what one would consider a “final” navigability index for the lower Athabasca River and downstream into the Peace–Athabasca Delta.

4.2. Historical Aboriginal Navigation Index

Using the preliminary Aboriginal Navigation Index formulation outlined in Equation (1) from the Water Framework [18], the weekly ANI was calculated for the period spanning 1958 to 2020, with the range of this navigability index plotted in Figure 6a. As shown in the whisker-box plots, weekly ANI values were notably variable from year-to-year, and a general pattern emerged in the mean values. In line with the percentage days above a threshold presented in the prior section, the ANI value increased rapidly in response to the spring snowmelt water influx to the river mainstem (~week 16), rising to a peak of ~0.78 during mid-summer with the addition of rainwater runoff (~weeks 25–28), and subsequently, declining to ~0.20 by the end of the summer/early fall period (week 43). Overall, the open-water period experienced general decreases in weekly ANI values over the 63-year period, with cumulative weeks 36 to 39 significant at p < 0.05 (β = −0.004), which has important implications for the Fall ANI period focused upon in the Water Framework.
The annual ANIFall index, which represents an integrated view of weeks 34 to 43 (Equation (2)), varied considerably from 1958 to 2020, ranging from 0.10 to 0.67 and experiencing intermittent low and high index periods (Figure 6b). Of concern are years with low summer/fall flows, such as 2015, with an ANIFall value of 0.11 (equal to AXFO = 400 m3 s−1), that have occurred sporadically over the historical period. Even the slightly higher AXFR (ANI = 0.21) was not surpassed in 15 of the 63 years (Figure 6b). These results indicate that fall navigability would have been a challenge (shallow water depths) in nearly ¼ of the years since 1958 and thus is part of the natural variability of the Athabasca River flow regime but occurred more frequently in the second half of the hydrometric record. Overall, a significant decline (p < 0.05; β = −0.003) in ANIFall was observed over the study period.
These historical ANI results presented in this section are consistent with prior studies that reported important declines in annual and particularly summer flows on the lower Athabasca River post-1958 [11,16,21,54,56,57]. Although there is multidecadal flow variability associated with low-frequency, large-scale climate oscillations (i.e., Pacific Decadal Oscillation) [11,56,58], it is worth noting that post-1900s studies using reconstructed datasets indicated little long-term monotonic change in annual flows [21,59,60].
This ANI index has been part of the annual Water Framework status reporting [25,61,62,63,64] since its implementation in 2016 to determine whether or not ANI decreased by >10% in a given year after accounting for water withdrawals from oil sands operations. For instance, the Water Framework reported that the weekly ANIs decreased by 0.8 to 3.0% and ANIFall by 1.4% in 2017 with water abstractions, resulting in the Preliminary Aboriginal Navigation Index trigger not being exceeded in that year [61]. ANI calculations in this study revealed that even for the 2015 low-flow year, the 10% threshold would not have been exceeded, with weekly ANIs decreased by 2 to 8%, but also showed that the occurrence of ANI = 0 precluded the calculation of a percentage water abstraction change for week 43. The latter occurrence supports our earlier suggestion of including flows of <300 m3 s−1 in the index to avoid this situation, which may become more frequent in the future. Although water abstractions are shown here to play a role in reducing flows, the goal of this study is to answer the critical question: “what are the projected impacts of climate change on flows during the fall navigation period of the year”.

4.3. Climate Change Impacts on Future Navigation Thresholds

The studies on future climate change impacts in western Canada have consensus that important changes in the streamflow regime, which include shifts in the timing of the annual peak and low-flow periods, are anticipated to take place in the coming decades [36,65,66,67,68,69,70]. For instance, a recent climate change assessment by Dibike et al. [34] using the same hydrological model and climate change scenarios as in the current study revealed the following key findings for the lower Athabasca River streamflow regime: Near (2041–2070) and far (2071–2100) future projected streamflow increases for most months of the year with the exception of decreases for July through October (see Figure 3 in [34]); the latter would have negative implications for navigability and users of the river.
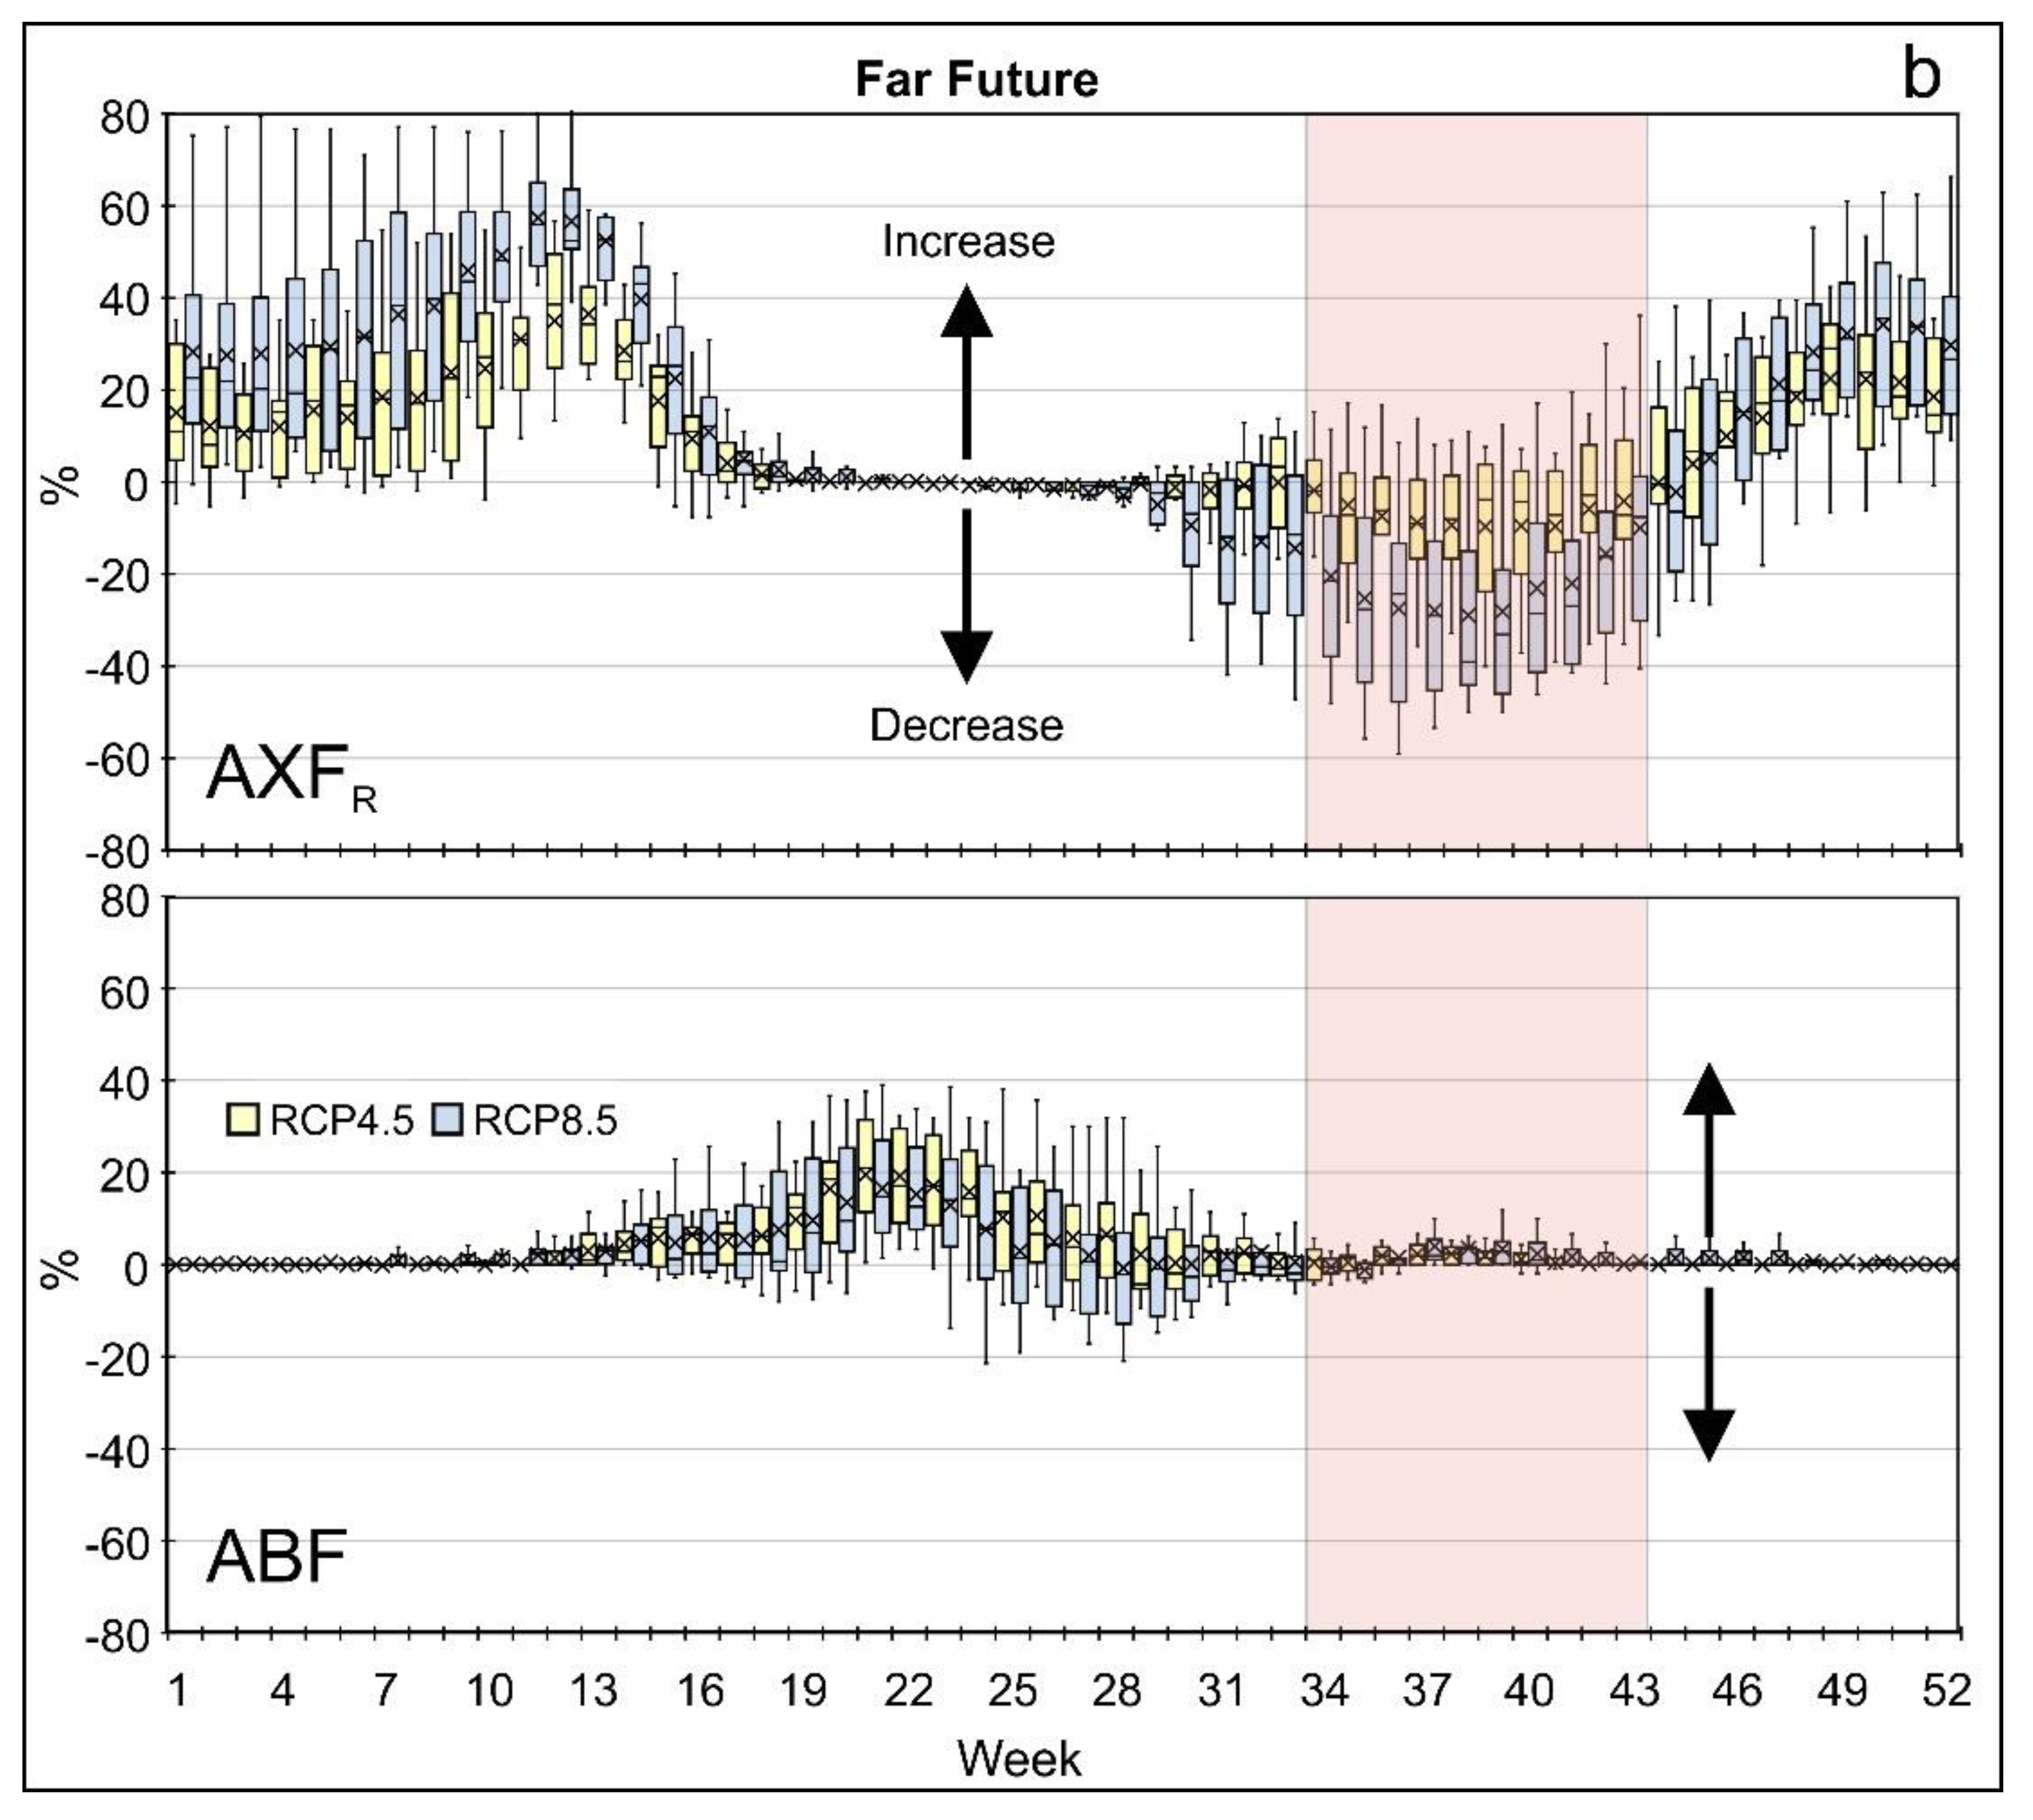
Near future exceedances of the ABF (POT1600) are projected to increase in early April (~week 15) and into May, shift towards decreases in mid-June, and back to no notable (<10%) changes by the end of August (week 34) (Figure 7). Although a similar pattern of changes can be seen for the far future period, increases in ABF exceedances are projected to occur slightly earlier in the year, peaking in late May/early April at a greater frequency (e.g., up to a mean of 20%), and extend slightly later into the summer months prior to switching to more intense decreases in occurrences on a weekly basis. However, in both future periods, the overall projected change in ABF exceedance during the fall navigation period of weeks 34 to 43 is almost negligible, which is not surprising given that such occurrences were uncommon over the observed historical period.
Although the winter months (weeks 1 to 17 and 44 to 52) are projected to experience notable (>10%) and important increases in the occurrences of days that surpass the AXFR threshold (Figure 7), of critical concern for navigability are changes during the open-water period that will affect the water depths along the lower Athabasca River. It can be clearly seen in Figure 7 that the fall navigability period spanning weeks 34 to 43 is projected to experience important reductions in AXFR threshold exceedances (POT500) in the near future (up to a mean of −15% for both RCPs) and far future (mean peaks of −10% for RCP4.5 and −28% for RCP8.5) periods, especially under RCP8.5 (worst case scenario) for 2071–2100. These results based on an ensemble of simulations indicate that low open-water flow events, such as the challenging boating conditions depicted in Figure 4, may become more frequent occurrences in the second half of the 21st century during the Fall ANI weeks of interest to Indigenous Peoples, as identified in the Water Framework [18].

4.4. Climate Change Impacts on Future Aboriginal Navigation Index

The projected positive and negative changes in weekly ANI for the near (2041–2070) and far (2071–2100) future periods are shown in Figure 8. Although not the case for the early portion of the year prior to week 25, the majority of the open-water period is anticipated to experience decreases in weekly ANI, more so in the latter part of the century and under the RCP8.5 scenario. Continued declines in ANI are of particular concern for the end of season weeks 40 to 43, which are already experiencing occasional poor boating conditions and are projected in this study to be further impacted by climate change with a likelihood of more frequent instances of ANI = 0. The “final ANI” should thus take this into consideration in order to avoid “0” values in the calculation of the Fall ANI, especially when assessing the additional impact of water abstraction for annual Water Framework reporting.
Over the historical reference baseline spanning 1981–2010, the ANIFall averaged 0.29, with a fairly wide yearly variation ranging from 0.10 to 0.67 (Figure 9a). As suggested from the findings above for weekly ABF, AXFR, and ANI and in line with the monthly flow finding reported by Dibike et al. [34], the ANIFall is projected to decrease (a mean of approximately −0.04 to −0.03) for the near future period, with a wider spread of decline projected for the far future period mean value for the RCP4.5 (~ −0.02) and RCP8.5 (~ −0.08) climate scenarios (Figure 9b). The projected change in ANIFall is, to some extent, driven by decreases in the early part of this 10-week period (Figure 8). As would be expected from the results of other climate change studies on the Athabasca River Basin [34,36], the inter-model variability in the projected changes in ANIFall for the far future period and RCP8.5 scenario is higher than for the RCP4.5 or the near future period.
Under both the near (2041–2070) and far (2071–2100) future scenarios, the projected reductions in the ANIFall are anticipated to inch closer to the critical AXFR value of 0.21 identified as the minimum water depth (~1.2 m) necessary for boats during weeks 34 to 43, especially under the far future worst case emission scenario. Such a projected negative change would have major implications for Indigenous Peoples’ ability to practice traditional navigational activities and access the lower Athabasca River and connected Lake Athabasca and Peace–Athabasca Delta waterways.
In addition to climate impact on streamflow magnitude and timing, fluvial geomorphological processes that shape water movement within deltaic environments warrant monitoring the water depth at key sites (i.e., pinch points), which currently and may yet pose problems to navigability. Such an example is channel avulsions in the early 1980s that re-routed Athabasca River water and sediments towards the heart of the delta and led to navigability issues identified as part of community-based monitoring [42,71,72].

5. Conclusions

The Athabasca River is an important source of water to the downstream Peace–Athabasca Delta and a navigational route that provides access to traditional activities and landscapes for Indigenous Peoples. Boat operation has been identified as a challenging endeavor during periods of low flow, typically during the end of summer and early fall months prior to the winter freeze. This paper investigated the potential impacts of climate change on navigability indices for the lower Athabasca River using both observed historical and projected future flows.
A weekly flow exceedance index was developed to gain a better understanding of daily limitations to boating that can be lost within a mean weekly flow or integrated fall period metric. For instance, achieving a daily flow greater than the Aboriginal Base Flow (ABF; 600 m3 s−1) was not a given in any year of the historical record, and the vast majority of the years had infrequent daily ABF exceedances (percentage over the threshold; POT1600) during the period spanning weeks 34 to 43. The latter result indicates that this period of interest was historically not always ideal for boating, which is further supported by the findings that the revised Aboriginal Extreme Flow (AXFR; 500 m3 s−1) exceedances (POT500) after week 34 have been generally decreasing, which aligned with a general decline in the Fall Aboriginal Navigation Index (ANIFall) from 1958 to 2020.
Comparisons of near (2041–2070) and far (2071–2100) future periods to the historical baseline (1981–2010) yielded results that project important reductions in AXFR exceedances during the fall navigability period spanning weeks 34 to 43 and the ANIFall indices achieved. These results, based on an ensemble of hydrologic simulations, indicate that challenging navigational conditions may become more frequent in the second half of the 21st century, not only during the fall period but also earlier into the summer, with potentially severe impacts on users of the rivers.
Based on our historical and future scenario analyses, the following recommendations should be considered in finalizing the ANIFall: (i) update the ANI and use the updated AXFR of 500 m3 s−1, as validated by hydraulic modeling and community-based monitoring and (ii) set ANI = 0 at 0 m3 s−1 to consider lower flow conditions that are currently and likely to happen more frequently into the future. To overcome the potential loss of daily navigability information in a weekly ANI and integrated ANIFall index, the lower Athabasca River Surface Water Quantity Management Framework should consider the addition of a daily index, such as a percentage threshold occurrence index (e.g., POT500), to the annual reporting in order to present the river users a summary of the number of days when boating conditions were challenging and how this is changing over time due to climate and water use.
The navigability indices and assessment approach employed in this study are transferable to other river systems but require focused fieldwork to establish boating thresholds (e.g., ABF and AXF) that are specific to river reaches of interest (i.e., flow versus depth). For instance, a major task underway by Indigenous community-based monitoring in the downstream Lake Athabasca and Peace–Athabasca Delta system into which the Athabasca River drains is the development of navigability indices that are specific to lakes and connecting channels [71]. Overall, holistic hydrological assessments of changes, such as the Indicators of Hydrological Alteration [73] or the Cold-regions Hydrological Indicators of Change [74] approaches, should include navigability indices that inform water assessment and management decisions. This is the case for the environmental flow framework that is under development for the Peace–Athabasca Delta system as part of the Wood Buffalo National Park World Heritage Site action plan [75].

Author Contributions

Conceptualization, D.L.P., Y.B.D., J.S., W.A.M. and D.J.B.; methodology, D.L.P., Y.B.D. and J.S.; formal analysis, D.L.P., Y.B.D. and J.S.; investigation, D.L.P., Y.B.D., J.S., W.A.M. and D.J.B.; resources, D.L.P.; writing—original draft preparation, D.L.P.; writing—review and editing, D.L.P., Y.B.D., J.S., W.A.M. and D.J.B.; supervision, D.L.P. and Y.B.D.; project administration, D.L.P.; funding acquisition, D.L.P. All authors have read and agreed to the published version of the manuscript.

Funding

This research was funded by Environment and Climate Change Canada.

Data Availability Statement

Data are available upon request.

Acknowledgments

This project was built upon climate change flow simulation products produced for the Joint Alberta-Canada Oil Sands Program. The study was supported by the Climate Change Adaptation Program of Environment and Climate Change Canada. We thank the reviewers who provided helpful comments that improved our paper.

Conflicts of Interest

The authors declare no conflict of interest.

Abbreviations

List of Acronyms for Navigability Metrics
ABFAboriginal Base Flow threshold (1600 m3 s−1)
ANIAboriginal Navigation Index (0 to 1 range)
ANIFallFall Aboriginal Navigation Index (0 to 1 range)
AXFOAboriginal Extreme Flow original threshold (400 m3 s−1)
AXFRAboriginal Extreme Flow revised threshold (500 m3 s−1)
INIIndigenous Navigability Index
POT300Number of days in a week expressed as a percentage over threshold (POT) of 300 m3 s−1
POT400Number of days in a week expressed as a percentage over threshold (POT) of 400 m3 s−1
POT500Number of days in a week expressed as a percentage over threshold (POT) of 500 m3 s−1
POT1600Number of days in a week expressed as a percentage over threshold (POT) of 1600 m3 s−1

References

  1. Cuo, L.; Zhang, Y.; Gao, Y.; Hao, Z.; Cairang, L. The Impacts of Climate Change and Land Cover/Use Transition on the Hydrology in the Upper Yellow River Basin, China. J. Hydrol. 2013, 502, 37–52. [Google Scholar] [CrossRef]
  2. Prowse, T.D.; Beltaos, S.; Gardner, J.T.; Gibson, J.J.; Granger, R.J.; Leconte, R.; Peters, D.L.; Pietroniro, A.; Romolo, L.A.; Toth, B. Climate Change, Flow Regulation and Land-Use Effects on the Hydrology of the Peace-Athabasca-Slave System; Findings from the Northern Rivers Ecosystem Initiative. Environ. Monit. Assess. 2006, 113, 167–197. [Google Scholar] [CrossRef] [Green Version]
  3. Wilcox, B.P.; Huang, Y.; Walker, J.W. Long-Term Trends in Streamflow from Semiarid Rangelands: Uncovering Drivers of Change. Glob. Chang. Biol. 2008, 14, 1676–1689. [Google Scholar] [CrossRef]
  4. Zarfl, C.; Lehner, B. European Rivers Are Fragmented by Many More Barriers than Had Been Recorded. Nature 2020, 588, 395–396. [Google Scholar] [CrossRef]
  5. Grill, G.; Lehner, B.; Lumsdon, A.E.; MacDonald, G.K.; Zarfl, C.; Liermann, C.R. An Index-Based Framework for Assessing Patterns and Trends in River Fragmentation and Flow Regulation by Global Dams at Multiple Scales. Environ. Res. Lett. 2015, 10, 015001. [Google Scholar] [CrossRef]
  6. Grill, G.; Lehner, B.; Thieme, M.; Geenen, B.; Tickner, D.; Antonelli, F.; Babu, S.; Borrelli, P.; Cheng, L.; Crochetiere, H.; et al. Mapping the World’s Free-Flowing Rivers. Nature 2019, 569, 215–221. [Google Scholar] [CrossRef]
  7. Ionita, M.; Nagavciuc, V. Forecasting Low Flow Conditions Months in Advance through Teleconnection Patterns, with a Special Focus on Summer 2018. Sci. Rep. 2020, 10, 13258. [Google Scholar] [CrossRef]
  8. Sung, R.Y.-J.; Burn, D.H.; Soulis, E.D. A Case Study of Climate Change Impacts on Navigation on the Mackenzie River. Can. Water Resour. J. 2006, 31, 57–68. [Google Scholar] [CrossRef]
  9. Woo, M.; Thorne, R. Summer Low Flow Events in the Mackenzie River System. Arctic 2016, 69, 286–304. [Google Scholar] [CrossRef] [Green Version]
  10. Whittaker, D.; Shelby, B.; Jackson, W.; Beschta, R.L. Instream Flows for Recreation: A Handbook on Concepts and Research Methods: A Handbook on Concepts and Research Methods; United States Department of the Interior National Park Service: Washington, DC, USA; Oregon State University: Corvallis, OR, USA, 1993; Available online: http://npshistory.com/publications/water/instream-flows.pdf (accessed on 11 March 2023).
  11. Rood, S.B.; George, C.; George, B.; Tymensen, W. Instream Flows for Recreation Are Closely Correlated with Mean Discharge for Rivers of Western North America. River Res. Appl. 2006, 22, 91–108. [Google Scholar] [CrossRef]
  12. Loomis, J.; McTernan, J. Economic Value of Instream Flow for Non-Commercial Whitewater Boating Using Recreation Demand and Contingent Valuation Methods. Environ. Manag. 2014, 53, 510–519. [Google Scholar] [CrossRef]
  13. Bonsal, B.; Peters, D.L.; Seglenieks, F.; Rivera, A.; Berg, A. Changes in Freshwater Availability across Canada. In Chapter 6 in Canada’s Changing Climate Report; Bush, E., Lemmen, D.S., Eds.; Government of Canada: Ottawa, ON, Canada, 2019; pp. 261–342. Available online: https://natural-resources.canada.ca/sites/www.nrcan.gc.ca/files/energy/Climate-change/pdf/CCCR-Chapter6-ChangesInFreshwaterAvailabilityAcrossCanada.pdf (accessed on 11 March 2023).
  14. DeBeer, C.M.; Wheater, H.S.; Pomeroy, J.W.; Barr, A.G.; Baltzer, J.L.; Johnstone, J.F.; Turetsky, M.R.; Stewart, R.E.; Hayashi, M.; van der Kamp, G.; et al. Summary and Synthesis of Changing Cold Regions Network (CCRN) Research in the Interior of Western Canada—Part 2: Future Change in Cryosphere, Vegetation, and Hydrology. Hydrol. Earth Syst. Sci. 2021, 25, 1849–1882. [Google Scholar] [CrossRef]
  15. Mannix, A.E.; Dridi, C.; Adamowicz, W.L. Water Availability in the Oil Sands under Projections of Increasing Demands and a Changing Climate: An Assessment of the Lower Athabasca Water Management Framework (Phase 1). Can. Water Resour. J. 2010, 35, 29–52. [Google Scholar] [CrossRef]
  16. Schindler, D.W.; Donahue, W.F. An Impending Water Crisis in Canada’s Western Prairie Provinces. Proc. Natl. Acad. Sci. USA 2006, 103, 7210–7216. [Google Scholar] [CrossRef] [Green Version]
  17. MCFN. Petition to the World Heritage Committee Requesting Inclusion of Wood Buffalo National Park on the List of World Heritage in Danger; Mikisew Cree First Nation Government & Industry Relations: Fort McMurray, AB, Canada, 2014; p. 43. Available online: https://cpawsnab.org/wp-content/uploads/2018/03/Mikisew_Petition_respecting_UNESCO_Site_256_-_December_8_2014.pdf (accessed on 11 March 2023).
  18. GoA. Surface Water Quantity Management Framework for the Lower Athabasca River; Alberta Environment and Sustainable Resource Development, Government of Alberta: Edmonton, AB, Canada, 2015; p. 80. Available online: https://open.alberta.ca/publications/9781460121733 (accessed on 11 March 2023).
  19. MCFN. Final Argument of the Mikisew Cree First Nation for the Hearing Regarding the Proposed Frontier Project; Canadian Environmental Assessment Agency: Ottawa, ON, Canada, 2018; p. 67. Available online: https://iaac-aeic.gc.ca/050/evaluations/document/126352 (accessed on 11 March 2023).
  20. Dillon Consulting. Athabasca River Navigation Study—Final Report Phases 3 and 4; Transport Canada: Ottawa, ON, Canada, 2019; p. 77. Available online: https://tc.canada.ca/en/marine/navigation-study-lower-athabasca-river (accessed on 11 March 2023).
  21. Peters, D.L.; Watt, D.; Devito, K.; Monk, W.A.; Shrestha, R.R.; Baird, D.J. Changes in Geographical Runoff Generation in Regions Affected by Climate and Resource Development: A Case Study of the Athabasca River. J. Hydrol. Reg. Stud. 2022, 39, 100981. [Google Scholar] [CrossRef]
  22. Downing, D.J.; Pettapiece, W.W. Natural Regions and Subregions of Alberta: Natural Regions Committee; Government of Alberta: Edmonton, AB, Canada, 2006; p. 852. Available online: https://www.albertaparks.ca/media/2942026/nrsrcomplete_may_06.pdf (accessed on 11 March 2023).
  23. NRBS. Northern Rivers Basins Study—Report to the Ministries 1996; Alberta Environmental Protection: Edmonton, AB, Canada, 1996; p. 287. Available online: https://www.ceaa.gc.ca/050/documents_staticpost/63919/96375/3-1996-Northern_River_Basins_Study-Report_to_the_Ministers.pdf (accessed on 11 March 2023).
  24. GOA Oil Sands Mine Reclamation and Disturbance Tracking by Year. Available online: https://osip.alberta.ca/library/Dataset/Details/27 (accessed on 2 February 2023).
  25. Newton, B.; Kashyap, S. 2019 Status of Surface Water Quantity—Lower Athabasca River Region; Government of Alberta; Alberta Environment and Parks: Edmonton, AB, Canada, 2021; p. 40. Available online: https://open.alberta.ca/publications/status-of-surface-water-quantity-lower-athabasca-region-alberta (accessed on 11 March 2023).
  26. AER Alberta Energy Regulator Oil Sands Water Use Data 2021. Available upon request: https://www.aer.ca/ (accessed on 21 March 2023).
  27. Kellerhals, R.; Neill, C.R.; Bray, D.I. Hydraulic and Geomorphic Characteristics of Rivers in Alberta; Alberta Cooperative Research Program in Highway and River Engineering: Edmonton, AB, Canada, 1972. [Google Scholar]
  28. Doyle, P.F. Hydrologic and Hydraulic Characteristics of the Athabasca River from Fort McMurray to Embarras; Alberta Research Council: Edmonton, AB, Canada, 1977; Available online: https://ags.aer.ca/publication/ofr-1977-13 (accessed on 11 March 2023).
  29. Peters, D.L.; Prowse, T.D. Generation of Streamflow to Seasonal High Waters in a Freshwater Delta, Northwestern Canada. Hydrol. Process. 2006, 20, 4173–4196. [Google Scholar] [CrossRef]
  30. Culp, J.; Droppo, I.; di Cenzo, P.; Alexander, A.; Baird, D.; Beltaos, S.; Bickerton, G.; Bonsal, B.; Brua, B.; Chambers, P.; et al. Synthesis Report for the Water Component, Canada-Alberta Joint Oil Sands Monitoring: Key Findings and Recommendations; 2018. Available online: https://open.alberta.ca/publications/9781460140253 (accessed on 11 March 2023).
  31. Culp, J.M.; Droppo, I.G.; di Cenzo, P.D.; Alexander, A.C.; Baird, D.J.; Beltaos, S.; Bickerton, G.; Bonsal, B.; Brua, R.B.; Chambers, P.A.; et al. Ecological Effects and Causal Synthesis of Oil Sands Activity Impacts on River Ecosystems: Water Synthesis Review. Environ. Rev. 2021, 29, 315–327. [Google Scholar] [CrossRef]
  32. JOSM. The Joint Canada|Alberta Implementation Plan for Oil Sands Monitoring Annual Report; Government of Canada: Ottawa, ON, Canada, 2012; p. 32. Available online: http://www.publications.gc.ca/site/eng/9.697128/publication.html (accessed on 11 March 2023).
  33. ECCC HYDAT Water Survey Data Products. Available online: https://www.canada.ca/en/environment-climate-change/services/water-overview/quantity/monitoring/survey/data-products-services.html (accessed on 21 February 2023).
  34. Dibike, Y.; Eum, H.-I.; Coulibaly, P.; Hartmann, J. Projected Changes in the Frequency of Peak Flows along the Athabasca River: Sensitivity of Results to Statistical Methods of Analysis. Climate 2019, 7, 88. [Google Scholar] [CrossRef] [Green Version]
  35. Taylor, K.E.; Stouffer, R.J.; Meehl, G.A. An Overview of CMIP5 and the Experiment Design. Bull. Am. Meteorol. Soc. 2012, 93, 485–498. [Google Scholar] [CrossRef] [Green Version]
  36. Eum, H.-I.; Dibike, Y.; Prowse, T. Climate-Induced Alteration of Hydrologic Indicators in the Athabasca River Basin, Alberta, Canada. J. Hydrol. 2017, 544, 327–342. [Google Scholar] [CrossRef]
  37. Eum, H.-I.; Dibike, Y.; Prowse, T. Comparative Evaluation of the Effects of Climate and Land-Cover Changes on Hydrologic Responses of the Muskeg River, Alberta, Canada. J. Hydrol. Reg. Stud. 2016, 8, 198–221. [Google Scholar] [CrossRef] [Green Version]
  38. Eum, H.-I.; Yonas, D.; Prowse, T. Uncertainty in Modelling the Hydrologic Responses of a Large Watershed: A Case Study of the Athabasca River Basin, Canada. Hydrol. Process. 2014, 28, 4272–4293. [Google Scholar] [CrossRef]
  39. Dibike, Y.; Eum, H.-I.; Prowse, T. Modelling the Athabasca Watershed Snow Response to a Changing Climate. J. Hydrol. Reg. Stud. 2018, 15, 134–148. [Google Scholar] [CrossRef]
  40. Candler, C.; Olson, R.; Deroy, S. As Long as the Rivers Flow: Athabasca River Knowledge, Use and Change; Parkland Institute: Edmonton, AB, Canada, 2010; p. 84. Available online: https://www.parklandinstitute.ca/as_long_as_the_rivers_flow (accessed on 11 March 2023).
  41. Carver, M. Indigenous Navigability of the Lower Athabasca River: Alberta’s SWQMF & Teck’s Effects Assessment—Submission to the Joint Review Panel for the Frontier Mine. Presented at the Joint Review Panel for the Frontier Oil Sands Mine. 2018. Available online: https://www.ceaa-acee.gc.ca (accessed on 11 March 2023).
  42. Carver, M.; Maclean, B. Community-Based Water-Depth Monitoring in the Peace-Athabasca Delta: Insights and Evaluation; Prepared by Aqua Environmental Associates for Athabasca Chipewyan First Nation and Mikisew Cree First Nation: Nelson, BC, Canada, 2016; Available online: http://mikisewgir.com/cbm (accessed on 11 March 2023)(upon request).
  43. Kashyap, S.; Kerkhoven, E.; Islam, Z.; Petty, A.; Depoe, S. Predicting Navigability in the Lower Athabasca River System Through Numerical Modelling. In Proceedings of the Canadian Society of Civil Engineering Annual Conference 2021; Walbridge, S., Nik-Bakht, M., Ng, K.T.W., Shome, M., Alam, M.S., El Damatty, A., Lovegrove, G., Eds.; Springer Nature: Singapore, 2022; pp. 479–490. [Google Scholar] [CrossRef]
  44. Kendall, M.G. Rank Correlation Methods; Charles Griffin: London, UK, 1975. [Google Scholar]
  45. Mann, H.B. Non-Parametric Test against Trend. Econometrika 1945, 13, 245–259. [Google Scholar] [CrossRef]
  46. R Development Core Team R: A Language and Environment for Statistical Computing. 2016. Available online: http://www.R-project.org (accessed on 21 March 2023).
  47. Bronaugh, D.; Werner, A.T. ZYP Package. 2019. Available online: https://cran.r-project.org/package=zyp/zyp.pdf (accessed on 21 March 2023).
  48. Zhang, X.; Zwiers, F.W. Comment on “Applicability of Prewhitening to Eliminate the Influence of Serial Correlation on the Mann-Kendall Test” by Sheng Yue and Chun Yuan Wang. Water Resour. Res. 2004, 40. [Google Scholar] [CrossRef] [Green Version]
  49. Bürger, G. On Trend Detection. Hydrol. Process. 2017, 31, 4039–4042. [Google Scholar] [CrossRef]
  50. Zhang, X.; Vincent, L.A.; Hogg, W.D.; Niitsoo, A. Temperature and Precipitation Trends in Canada during the 20th Century. Atmos.-Ocean. 2000, 38, 395–429. [Google Scholar] [CrossRef]
  51. Sen, P.K. Estimates of the Regression Coefficient Based on Kendall’s Tau. J. Am. Stat. Assoc. 1968, 63, 1379–1389. [Google Scholar] [CrossRef]
  52. Monk, W.A.; Peters, D.L.; Baird, D.J. Assessment of Ecologically Relevant Hydrological Variables Influencing a Cold-Region River and Its Delta: The Athabasca River and the Peace–Athabasca Delta, Northwestern Canada. Hydrol. Process. 2012, 26, 1827–1839. [Google Scholar] [CrossRef]
  53. Carver, M. Transport Canada Navigational Study of the Lower Athabasca River—Outcomes and Technical Review; Prepared by Aqua Environmental Associates for Athabasca Chipewyan First Nation and Mikisew Cree First Nation: Nelson, BC, Canada, 2020; Available online: https://registrydocumentsprd.blob.core.windows.net/commentsblob/project-80521/comment-54376/TC-nav-study_review-FINAL.pdf (accessed on 11 March 2023).
  54. Bawden, A.J.; Linton, H.C.; Burn, D.H.; Prowse, T.D. A Spatiotemporal Analysis of Hydrological Trends and Variability in the Athabasca River Region, Canada. J. Hydrol. 2014, 509, 333–342. [Google Scholar] [CrossRef]
  55. Peters, D.L. Multi-Scale Hydroclimatic Controls on the Duration of Water in Perched Wetlands of a Cold Regions Delta, Northwestern Canada; Environment Canada: Saskatoon, SK, Canada, 2013; p. 43. [Google Scholar]
  56. Peters, D.L.; Atkinson, D.; Monk, W.A.; Tenenbaum, D.E.; Baird, D.J. A Multi-Scale Hydroclimatic Analysis of Runoff Generation in the Athabasca River, Western Canada. Hydrol. Process. 2013, 27, 1915–1934. [Google Scholar] [CrossRef]
  57. Rasouli, K.; Hernández-Henríquez, M.A.; Déry, S.J. Streamflow Input to Lake Athabasca, Canada. Hydrol. Earth Syst. Sci. 2013, 17, 1681–1691. [Google Scholar] [CrossRef] [Green Version]
  58. Sauchyn, D.J.; St-Jacques, J.-M.; Luckman, B.H. Long-Term Reliability of the Athabasca River (Alberta, Canada) as the Water Source for Oil Sands Mining. Proc. Natl. Acad. Sci. USA 2015, 112, 12621–12626. [Google Scholar] [CrossRef] [Green Version]
  59. Rood, S.B.; Stupple, G.W.; Gill, K.M. Century-Long Records Reveal Slight, Ecoregion-Localized Changes in Athabasca River Flows. Hydrol. Process. 2015, 29, 805–816. [Google Scholar] [CrossRef]
  60. Chen, Z.; Grasby, S.E. Reconstructing River Discharge Trends from Climate Variables and Prediction of Future Trends. J. Hydrol. 2014, 511, 267–278. [Google Scholar] [CrossRef]
  61. Newton, B.; Kashyap, S. 2017 Status of Surface Water Quantity—Lower Athabasca River Region; Government of Alberta, Alberta Environment and Parks: Edmonton, AB, Canada, 2019; p. 27. Available online: https://open.alberta.ca/publications/status-of-surface-water-quantity-lower-athabasca-region-alberta (accessed on 11 March 2023).
  62. Newton, B. 2018 Status of Surface Water Quantity—Lower Athabasca River Region; Government of Alberta, Alberta Environment and Parks: Edmonton, AB, Canada, 2020; p. 33. Available online: https://open.alberta.ca/publications/status-of-surface-water-quantity-lower-athabasca-region-alberta (accessed on 11 March 2023).
  63. Newton, B.; Kashyap, S. 2020 Status of Surface Water Quantity—Lower Athabasca River Region; Government of Alberta, Alberta Environment and Parks: Edmonton, AB, Canada, 2022; p. 33. Available online: https://open.alberta.ca/publications/status-of-surface-water-quantity-lower-athabasca-region-alberta (accessed on 11 March 2023).
  64. Islam, Z.; Chantelle, L. 2015 and 2016 Status of Surface Water Quantity—Lower Athabasca River Region; Government of Alberta, Alberta Environment and Parks: Edmonton, AB, Canada, 2018; p. 25. Available online: https://open.alberta.ca/publications/status-of-surface-water-quantity-lower-athabasca-region-alberta (accessed on 11 March 2023).
  65. Bonsal, B.; Shrestha, R.R.; Dibike, Y.; Peters, D.L.; Spence, C.; Mudryk, L.; Yang, D. Western Canadian Freshwater Availability: Current and Future Vulnerabilities. Environ. Rev. 2020, 28, 528–545. [Google Scholar] [CrossRef]
  66. Leong, D.N.S.; Donner, S.D. Climate Change Impacts on Streamflow Availability for the Athabasca Oil Sands. Clim. Chang. 2015, 133, 651–663. [Google Scholar] [CrossRef]
  67. Rokaya, P.; Peters, D.L.; Elshamy, M.; Budhathoki, S.; Lindenschmidt, K.-E. Impacts of Future Climate on the Hydrology of a Northern Headwaters Basin and Its Implications for a Downstream Deltaic Ecosystem. Hydrol. Process. 2020, 34, 1630–1646. [Google Scholar] [CrossRef]
  68. Schnorbus, M.; Werner, A.; Bennett, K. Impacts of Climate Change in Three Hydrologic Regimes in British Columbia, Canada. Hydrol. Process. 2014, 28, 1170–1189. [Google Scholar] [CrossRef]
  69. Shrestha, R.R.; Schnorbus, M.A.; Peters, D.L. Assessment of a Hydrologic Model’s Reliability in Simulating Flow Regime Alterations in a Changing Climate. Hydrol. Process. 2016, 30, 2628–2643. [Google Scholar] [CrossRef]
  70. Shrestha, N.K.; Du, X.; Wang, J. Assessing Climate Change Impacts on Fresh Water Resources of the Athabasca River Basin, Canada. Sci. Total Environ. 2017, 601–602, 425–440. [Google Scholar] [CrossRef]
  71. Carver, M.; Maclean, B. Community-Based Monitoring of Water Depth in and around the Peace-Athabasca Delta: Ten-Year Review; Prepared by Aqua Environmental Associates for Athabasca Chipewyan First Nation and Mikisew Cree First Nation: Nelson, BC, Canada, 2022; p. 88. Available online: http://mikisewgir.com/cbm (accessed on 11 March 2023)(upon request).
  72. Wang, B.; Smith, L.C.; Gleason, C.J.; Kyzivat, E.D.; FAYNE, J.V.; Harlan, M.E.; Langhorst, T.; Feng, D.; Eidam, E.; Munoz, S.; et al. Athabasca River Avulsion Underway in the Peace-Athabasca Delta, Canada. Water Resour. Res. 2023, 59, e2022WR034114. [Google Scholar] [CrossRef]
  73. Richter, B.D.; Baumgartner, J.V.; Powell, J.; Braun, D.P. A Method for Assessing Hydrologic Alteration within Ecosystems. Conserv. Biol. 1996, 10, 1163–1174. [Google Scholar] [CrossRef] [Green Version]
  74. Peters, D.L.; Monk, W.A.; Baird, D.J. Cold-Regions Hydrological Indicators of Change (CHIC) for Ecological Flow Needs Assessment. Hydrol. Sci. J. 2014, 59, 502–516. [Google Scholar] [CrossRef]
  75. WBNP. Development of a Multi-Jurisdiction Action Plan to Protect the World Heritage Values of Wood Buffalo National Park; Parks Canada: Ottawa, ON, Canada, 2019; Available online: https://www.pc.gc.ca/en/pn-np/nt/woodbuffalo/info/action (accessed on 11 March 2023).
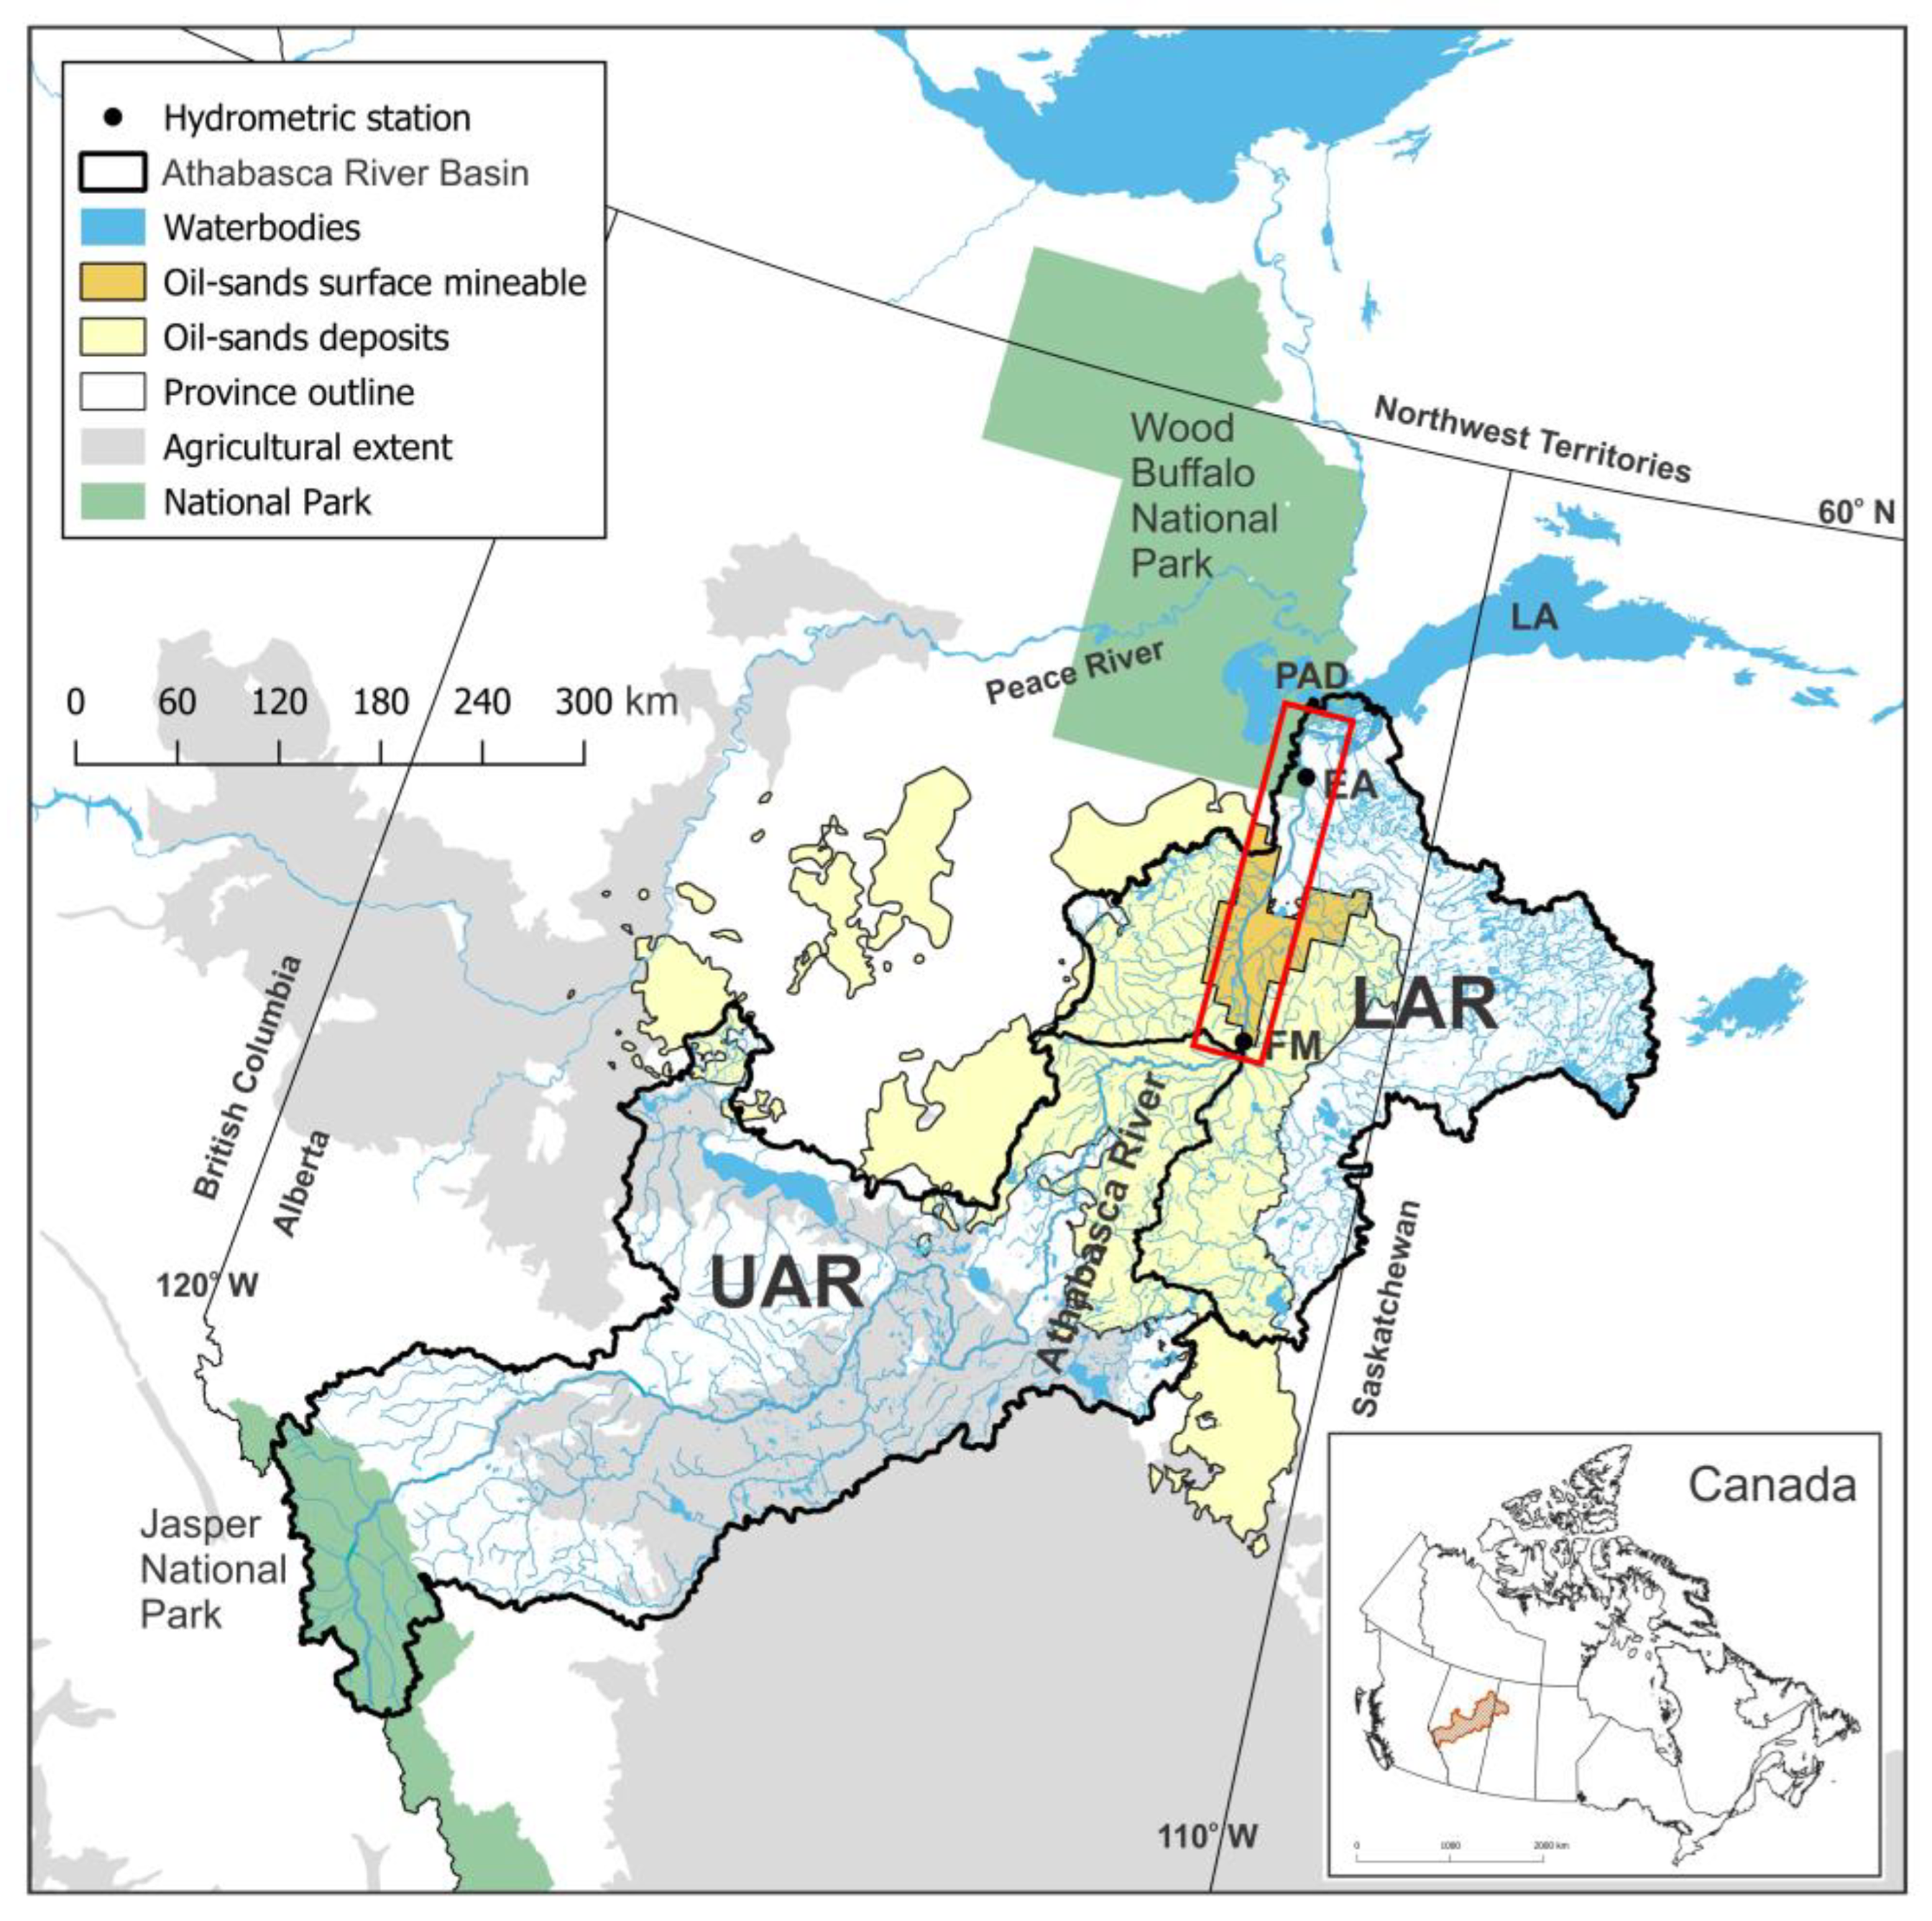
Figure 1. Athabasca River Basin in western Canada (modified from [21]). UAR and LAR are the upper and lower Athabasca River drainage areas, respectively. The study reach of interest is outlined in a red polygon with hydrometric gauges on the Athabasca River mainstem just below city of Fort McMurray (FM) and at Embarras Airport (EA). The Peace–Athabasca Delta (PAD) and Lake Athabasca (LA) are also shown. Inset map shows location of study basin within western Canada.
Water 15 01373 g001
Figure 2. (a) Lower Athabasca River mainstem from Fort McMurray to Embarras Airport to Lake Athabasca and the Peace–Athabasca Delta system. Examples of (b) islands, mid-channel bars, and sand bars; (c) a high summer flow year in 2020; and (d) a low summer flow year in 2015.
Water 15 01373 g002
Figure 3. Observed historical flow for the Athabasca River just below Fort McMurray (07DA001) for 1958 to 2020. Each green line corresponds to one year of flow in weekly averages, with the long-term mean highlighted in bold green line and the fall navigability period in transparent red.
Water 15 01373 g003
Figure 4. Picture of Indigenous People disembarked and pulling their boat due to extreme low-flow/shallow depth (appears to be ~knee deep) on the Embarras River divergence from the Athabasca River on 14 October 2015 (328 m3 s−1; week 41). Reproduced with permission from and photo credited to Mr. Bruce Maclean.
Water 15 01373 g004
Figure 5. Observed historical mean percentage over threshold (POT) in a given week when daily flows were greater than navigation thresholds (a) 1600 m3 s−1 (POT1600), (b) 500 m3 s−1 (POT500), (c) 400 m3 s−1 (POT400), and (d) 300 m3 s−1 (POT300) for the period spanning 1958 to 2020. The fall navigability period is highlighted in transparent red.
Water 15 01373 g005
Figure 6. Observed historical (a) weekly Aboriginal Navigation Index (ANI) with the fall period (weeks 34–43) highlighted in red and (b) annual Fall Aboriginal Navigation Index (ANIFall) time series with significant (Sen’s slope) trend line (p < 0.05; β = −0.003 y−1) drawn through the data 1958–2020. ABF, AXFO, and AXFR are Aboriginal Base Flow and original and revised Aboriginal Extreme Flow, respectively.
Water 15 01373 g006
Figure 7. Simulated projected changes of the percentage over threshold (POT) occurrences for navigation thresholds 500 m3 s−1 (POT500) and 1600 m3 s−1 (POT1600) that correspond to the revised Aboriginal Extreme Flow (AXFR) and Aboriginal Base Flow (ABF), respectively, under (a) near (2041–2070) and (b) far future (2071–2100) periods relative to the historical baseline reference (1981–2010). Flow data were derived via the variable infiltration capacity model based on 12 sets of climate projections (6 global circulation models × 2 statistically downscaled models) and 2 representative concentration pathways (RCPs 4.5 and 8.5). The fall navigability period is highlighted in red.
Water 15 01373 g007aWater 15 01373 g007b
Figure 8. Simulated projected changes in weekly Aboriginal Navigation Index (ANI) under (a) near future (2041–2070) and (b) far future (2071–2100) periods relative to the historical baseline reference period (1981–2010) derived via hydrological simulations based on 12 sets of climate projections (6 global circulation models × 2 statistically downscaled models) and 2 representative concentration pathways (RCPs 4.5 and 8.5). The fall navigability period is highlighted in transparent red.
Water 15 01373 g008
Figure 9. (a) Observed Fall Aboriginal Navigation Index (ANIFall) for the historical baseline period (1981–2010) and (b) simulated projected change in ANIFall for the near future (2041–2070) and far future (2071–2100) relative to the baseline derived via hydrological model simulations based on 12 sets of climate projections (6 global circulation models × 2 statistically downscaled models) and 2 representative concentration pathways (RCPs 4.5 and 8.5).
Water 15 01373 g009
Disclaimer/Publisher’s Note: The statements, opinions and data contained in all publications are solely those of the individual author(s) and contributor(s) and not of MDPI and/or the editor(s). MDPI and/or the editor(s) disclaim responsibility for any injury to people or property resulting from any ideas, methods, instructions or products referred to in the content.