Article

Application of Newton–Raphson Method for Computing the Final Air–Water Interface Location in a Pipe Water Filling

by
Dalia M. Bonilla-Correa
1,
Óscar E. Coronado-Hernández
2,*,
Vicente S. Fuertes-Miquel
3,
Mohsen Besharat
4 and
Helena M. Ramos
5
1
Facultad de Ciencias Exactas y Naturales, Universidad de Cartagena, Cartagena 1310014, Colombia
2
Facultad de Ingeniería, Universidad Tecnológica de Bolívar, Cartagena 131001, Colombia
3
Departamento de Ingeniería Hidráulica y Medio Ambiente, Universitat Politècnica de València, 46022 Valencia, Spain
4
School of Civil Engineering, University of Leeds, Leeds LS2 9JT, UK
5
Department of Civil Engineering, Architecture and Georesources, CERIS, Instituto Superior Técnico, University of Lisbon, 1049-001 Lisbon, Portugal
*
Author to whom correspondence should be addressed.
Water 2023, 15(7), 1304; https://doi.org/10.3390/w15071304
Submission received: 28 February 2023 / Revised: 24 March 2023 / Accepted: 24 March 2023 / Published: 26 March 2023

Abstract

:
The estimation of thermodynamic behavior during filling processes with entrapped air in water pipelines is a complex task as it requires solving a system of algebraic-differential equations. A lot of different numerical methods have been used for this purpose in literature including the rigid water column (RWC) model. The main advantage of the RWC model is its acceptable accuracy with very low computational load. In that context, this research presents the computation of critical points of the physical equations that describe the phenomenon. These points provide information about the final position of the air–water interface. The Newton–Raphson method was then applied to obtain a unique equation that can be used by engineers to directly compute variables such as air pocket pressure and water column length at the end of the hydraulic event. A case study was analyzed to compare the results of the mathematical model with the obtained equation for computing critical points. Both methods provided the same values for the water column length at the end of the hydraulic event. A sensitivity analysis was conducted to identify dependent and non-dependent parameters for evaluating the critical points. The proposed formulation was validated through an experimental set of data.

1. Introduction

Air–water two-phase pressurized flow is a frequently encountered phenomenon within hydraulic conduits or pipelines. It is complex to analyze since a combination of thermodynamic and hydraulic equations need to be solved. Nevertheless, this flow condition may result in catastrophic events under specific circumstances, primarily due to the amplification of unwanted pressure surges by the high compressibility of entrapped air. Such flow condition has the potential to generate a sudden, transient flow state within the system, which, in turn, can provoke rapid pressure fluctuations, characterized by exceedingly high peaks. This can occur in many industrial applications, such as in power plants, water distributions systems, water treatment facilities, and oil and gas production. An additional downside to the presence of air within a hydraulic system is its impact on the energy expenditure required for the transportation of water. When air is trapped in pipelines, it can reduce the effective cross-sectional area of flow, resulting in increased friction losses and pressure drop. This, in turn, can lead to decreased flow rates, increased energy consumption, and increased operating costs [1]. Furthermore, the presence of entrapped air pockets within water pipelines can lead to additional complications, such as unstable system operations, challenges in filter performance, a decline in pump efficiency, and pipeline corrosion. Numerous factors can lead to the entrapment or formation of air within hydraulic systems. These may include incomplete removal of air during the initial filling of the pipes, significant pressure drops that fall below the vapor pressure, malfunctions within auxiliary devices, and the operation of hydraulic machinery. For instance, a water-column separation can result in large air pockets inside hydraulic installations because of pressure drop [2,3,4]. Other examples of how air pockets can be introduced into pipelines are vortices in the pump intake, the operation of air vacuum valves, pipe rupture in regions of sub-atmospheric pressure, and release of dissolved air in water [5]. Despite a wealth of research, endeavors focused on developing air removal strategies to prevent the accumulation of air within hydraulic systems, a universally applicable solution remains elusive due to the highly variable nature of hydraulic systems and their operating conditions. Overall, the choice of air removal strategy will depend on the specific needs and characteristics of the pipeline system. Nevertheless, it is important to consider factors such as the size and length of the pipeline, the flow rate, and the presence of any high points or low points in the system when selecting an appropriate air removal strategy. Therefore, two-phase transient flow cannot be avoided, and water utility companies need to consider such conditions in the design and operation of water systems. From the theoretical point of view, to avoid pressure surges generated by the rapid compression of trapped air pockets during filling operations, air pockets should be continuously expelled, usually using air release valves (ARVs) [4]. Practically this can be challenging, due to common operational issues in ARVs; hence, adequate maintenance should be performed on ARVs to ensure proper operation. Furthermore, ARVs must be positioned properly to prevent pressure surges and ensure efficient air removal. For example, ARVs should be positioned at the highest point of the pipe profile where air is likely to accumulate. Pipe filling should be performed considering technical recommendations, such as the slow maneuvers of discharge valves, a pressure differential of 13.79 kPa, and considering a water flow equal to the air flow rate using a water pipe velocity around 3 m/s [5]. The most severe scenario concerning extreme pressure surges during pipe filling occurs when air release valves (ARVs) fail to function, either due to their absence or unsatisfactory maintenance. Numerous researchers have experimentally and numerically validated formulations for simulating pipe filling processes, incorporating either an elastic column model or a rigid water approach within 1D models, for systems with or without air expulsion [4,6,7,8,9]. Both types of models are used to predict pressure surges and other hydraulic transient events that may occur in the system. The choice of model depends on the specific hydraulic system and the level of accuracy required. In the majority of cases, these numerical models yield comparable results, given that the elasticity of air is significantly greater than that of water and pipe material. Furthermore, 2D and 3D Computational Fluid Dynamics (CFD) models have been utilized in recent times to simulate water filling operations in pipelines, with the aim of examining the separation of the water column, formation of geyser, displacement of manhole covers, and maximum pressure surges that are reached, among other factors [10,11,12,13]. Nonetheless, owing to their relative simplicity, 1D models are generally more convenient to utilize when compared to 2D and 3D models. As a result, the majority of the current research is directed towards refining their efficacy, covering aspects such as alternative calculation methods, examination of the unsteady friction factor, analysis of optimal orifice size for ARVs, and other relevant factors [14,15,16,17].
As a result, the numerical resolution of algebraic and differential equations for 1D models should be performed to understand the behavior of hydraulic and thermodynamic variables during the process. The calculation of the final air–water interface location is important in practical applications as well, as it provides information regarding the air pocket pressure and water column length at the end of a pipe filling, where water velocity tends to be null. An implicit formulation for calculation of the air–water interface for emptying process has been proposed [18]; however, a similar formulation is missing for filling process.
Following those lines, this research focuses on the application of the Newton–Raphson method to compute the final position of the air–water interface that occurs in a pipe filling scenario without expelled air. The Newton–Raphson method was utilized because is at least quadratically convergent. It has been applied in many applications in the hydraulic field [19]. A flowchart is presented for computing air pocket pressure and water column length at the end of a transient event using an explicit formulation, without solving the numerical resolution of the algebraic-differential equations system. A sensitivity analysis was conducted to identify parameters that can affect the final location of the air–water interface in a pipe filling, such as the polytropic coefficient, pipe slope, air pocket size, and the initial absolute pressure supplied by an energy source. In addition, a detailed velocity field analysis was performed for a case study. Finally, the developed methodology was checked using six experimental measurements in an experimental facility with a total length of 7.36 m and a nominal pipe diameter of 63 mm. Results showed that the proposed formulation provided is suitable not only for the experimental measurements but also for the analyzed case study.

2. Numerical Approach

2.1. Filling Operation

Filling processes are operations that water utility companies perform frequently in water supply networks. Water filling columns start to come into hydraulic installations while entrapped air columns are compressing, then pressure surges are achieved. The system is supplied by an energy source (tanks or pumps), which is named as p 0 * . A regulating valve (RV) is installed at the upstream end to inject water flows. Figure 1 shows a configuration of a water filling process, which is an inclined pipeline with a longitudinal slope of θ . The entrapped air pocket is at atmospheric condition ( p a t m * ) when the hydraulic system is at rest (t = 0). During this time, the system has a null water velocity (see Figure 1a). After that, the RV is opened to fill the single pipeline, and the air pocket compression begins with a water velocity ( v ) and a water column length ( L ). The air pocket pressure ( p 1 * ) is chaging over time (see Figure 1b).

2.2. Governing Equations

Under the assumptions of the rigid water model approach with a resistance coefficient, the filling water process is modelled as follows [3]:
  • Mass oscillation equation: Equation (1) represents the behavior of a water column along an entire pipe system [4,20].
    d v d t = p 0 * p 1 * ρ L + g sin θ f 2 D v | v | R v g A 2 L v | v |    
  • Air–water interface position is given by:
    d L d t = v
  • Polytropic model: this formulation describes how the air pocket size changes with air pocket pressure pulses. These changes are described by the polytropic law (see Equation (3)), which is applied without injected air into hydraulic installations.
p 1 * = p 1 , 0 * x 0 k ( L T L ) k
where v = water filling velocity (m/s); p 0 * = initial pressure supplied by a tank or pump (Pa); p 1 * = air pocket pressure (Pa); ρ = water density for a specific environmental temperature; θ = pipe slope (rad), g = gravitational acceleration (m/s2); f = friction factor; and D = internal pipe diameter; L = length of a water filling column; R v = resistance coefficient of a valve (s2/m5); and A = cross-sectional area of a single pipe (m2).
Equations (1)–(3) can be rewritten to describe the 1D movement of a water column inside the pipe as follows:
d L d t = v    
d v d t = p 0 * ρ L p 1 , 0 * x 0 k   ρ L ( L T L ) k + g sin θ f 2 D v | v | R v g A 2 L v | v |

2.3. Initial Conditions

The initial conditions of a filling water process start at rest. It implies that v ( 0 ) = 0; L ( 0 ) = L 0   ;   p 1 * ( 0 ) = p a t m * ; x ( 0 ) = L T L ( 0 ) = x 0 .

2.4. Velocity Field

To compute the analysis of velocity field, then X ( t ) = ( L ( t ) , v ( t ) ) , where the variable X render the position at time t of a particle at point ( L , v ) in a cartesian plane L v   . Then X ( t ) = ( d L d t , d v d t ) is the vector velocity of a particle at time t . However, water velocity does not depend on t , since it is a function of the position ( L , v ) . In addition, X ( t ) is an autonomous system, thus the critical point of X corresponds to the final location of an air–water interface of a filling water operation. The vector field V ( L , v ) given by the right side of the Equations (4) and (5) is expressed as follows:
V ( L , v ) = ( v p 0 * ρ L p 1 , 0 * x 0 k   ρ L ( L T L ) k + g sin θ f 2 D v | v | R v g A 2 L v | v | )   ,  
Equation (6) depends on L and v, then V ( L , v ) represents the vectors with initial point at ( L , v ) . Thus, for a filling water process it is possible to show how a point ( L , v ) moves through a vector field V over time, which can be computed as:
X ( t ) = V ( X ( t ) ) ,

2.5. Computation of Critical Point

Critical points are presented when X ( t ) = ( 0 ,   0 ) ; this means that d L d t = 0 and d v d t = 0. Considering a null velocity ( v = 0 ) and by plugging Equation (5) into Equation (6), then:
p 0 * ρ L f p 1 , 0 * x 0 k   ρ L f ( L T L f ) k + g sin θ = 0    
The numerical resolution of Equation (8) involves the utilization of an implicit solver to obtain the final position of a filling water column (Lf). An isothermal process is characterized by a slow transient event; thus, a polytropic coefficient of k = 1.0 can be used to compute the value of L f (see Equation (9)):
p 0 L T L f p 1 , 0 x 0 + ρ g sin θ L f L T L f ρ L f L T L f = 0
Organizing some terms:
ρ g sin θ L f 2 + ρ g sin θ L T p 0 L f + p 0 L T p 1 , 0 x 0 = 0
Applying a quadratic equation for computing L f , then:
L f | k = 1 = ρ g sin θ L T   p 0 * + ( ρ g sin θ L T   p 0     * ) 2 + 4   ρ g sin θ   ( p 0 * L T     p 1 , 0 * x 0 ) 2 ρ g sin θ  
Equation (11) can be used to compute the final position of an air–water interface during a filling operation in a single pipeline considering an isothermal evolution. However, when a polytropic evolution ( 1.0 < k 1.4 ) is detected, there is not an explicit formulation to compute the final position of a filling water column. The Newton–Raphson method [21] was applied to get the numerical resolution for computing the value of L f for a polytropic evolution. In this sense, the function j ( L f i ) is defined as:
j ( L f i ) = p 0 * ρ L f i p 1 , 0 * x 0 k ρ L f i ( L T L f i ) k + g sin θ   ,  
By deriving the Equation (12):
j ( L f i ) = p 0 * ρ L f i 2 + p 1 , 0 * x 0 k ρ [   1   L f i 2 ( L T L f i ) k   k   L f i ( L T L f i ) k + 1 ]  
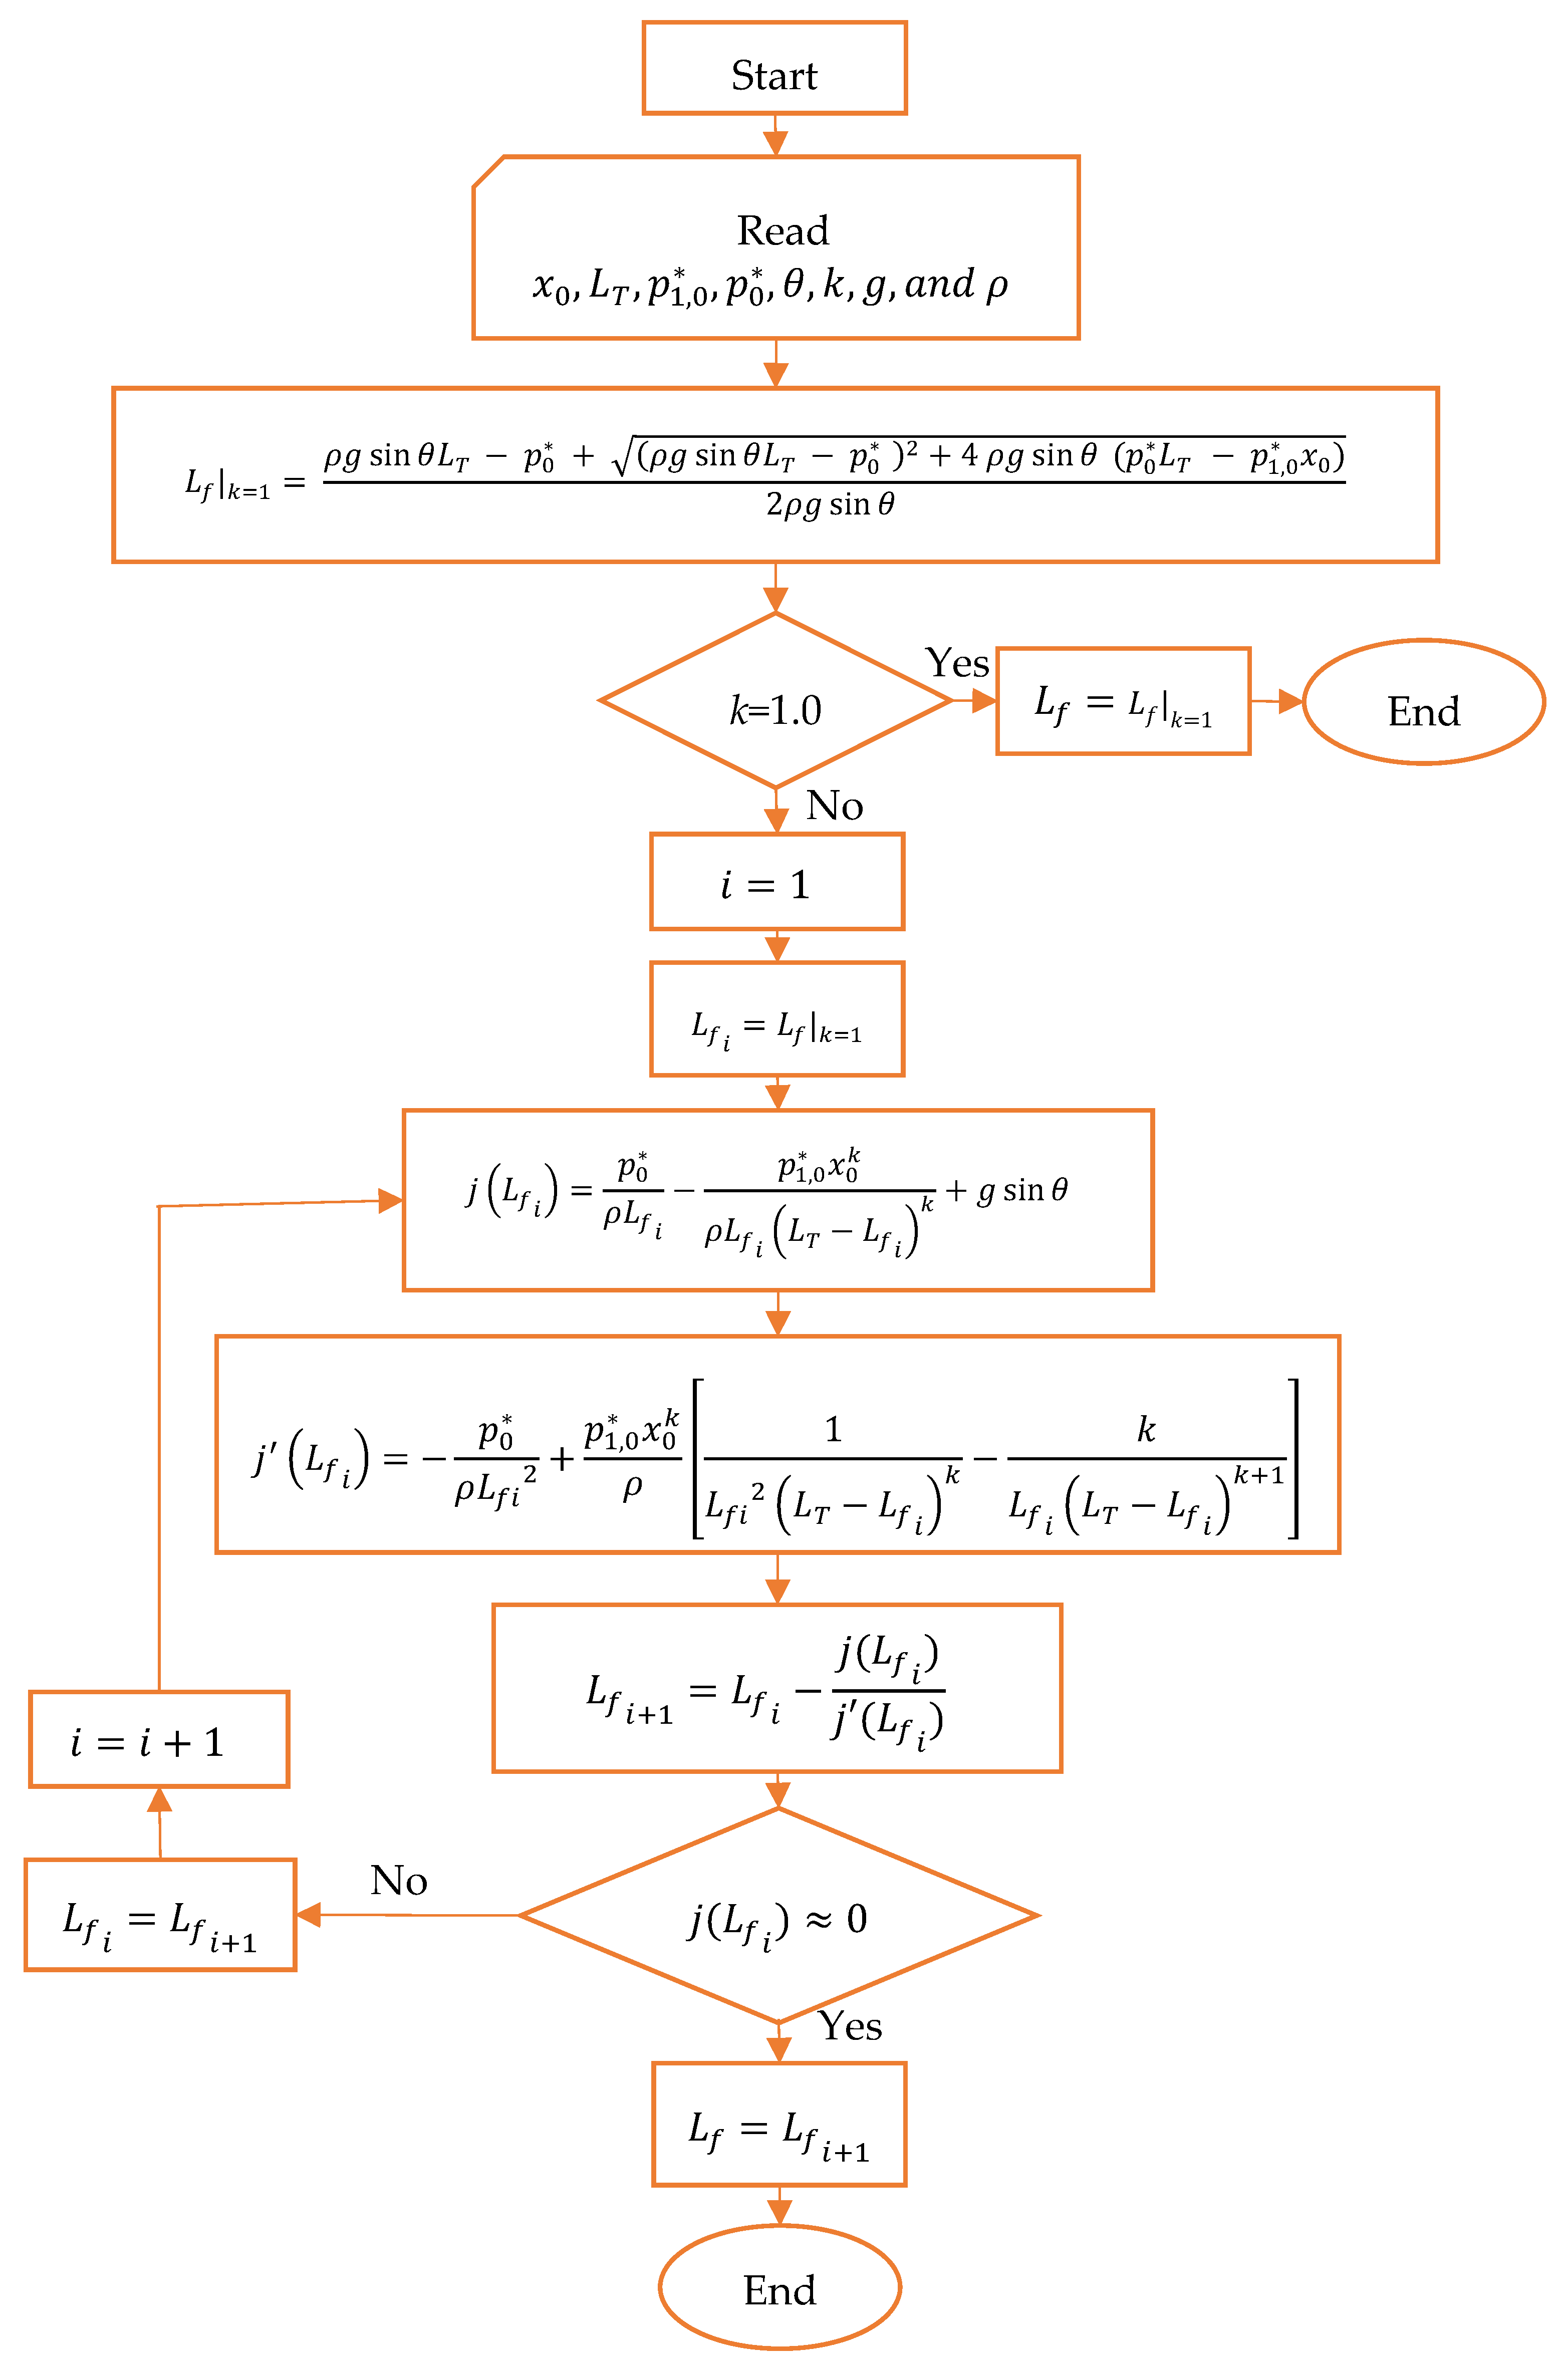
An iterative process is conducted to obtain the final position L f for a polytropic evolution. j ( L f i ) is always different than zero. This process starts using an initial value of L f | k = 1 based on Equation (11). After that, the L f i consecutive values are computed as follows:
L f i + 1 = L f i j ( L f i ) j ( L f i )  
A flowchart was created to compute the final position of L f considering different kinds of polytropic evolutions as shown in Figure 2.
The Newton–Raphson method cannot diverge for the j ( L f i ) function, as its first derivative is negative. Therefore, j ( L f i ) always exhibits a decreasing trend without any maximum or minimum points. Additionally, the second derivative is negative, when it is close to the root, as well as when the proposed seed value is close to the solution. The j ( L f i ) function intersects the x-axis only once, making the Newton–Raphson method suitable for solving this problem.
The application of the flowchart (see Figure 2) is supported based on assumptions as follows: (i) a constant friction factor, (ii) an air–water interface is modeled using a piston-flow approach, (iii) the mass oscillation equation is considered for the water phase, (iv) the polytropic law describes an entrapped air pocket evolution, and (v) the critical point theory is used to compute final positions of the hydraulic filling event.

3. Analysis of Results and Discussion

3.1. Case Study

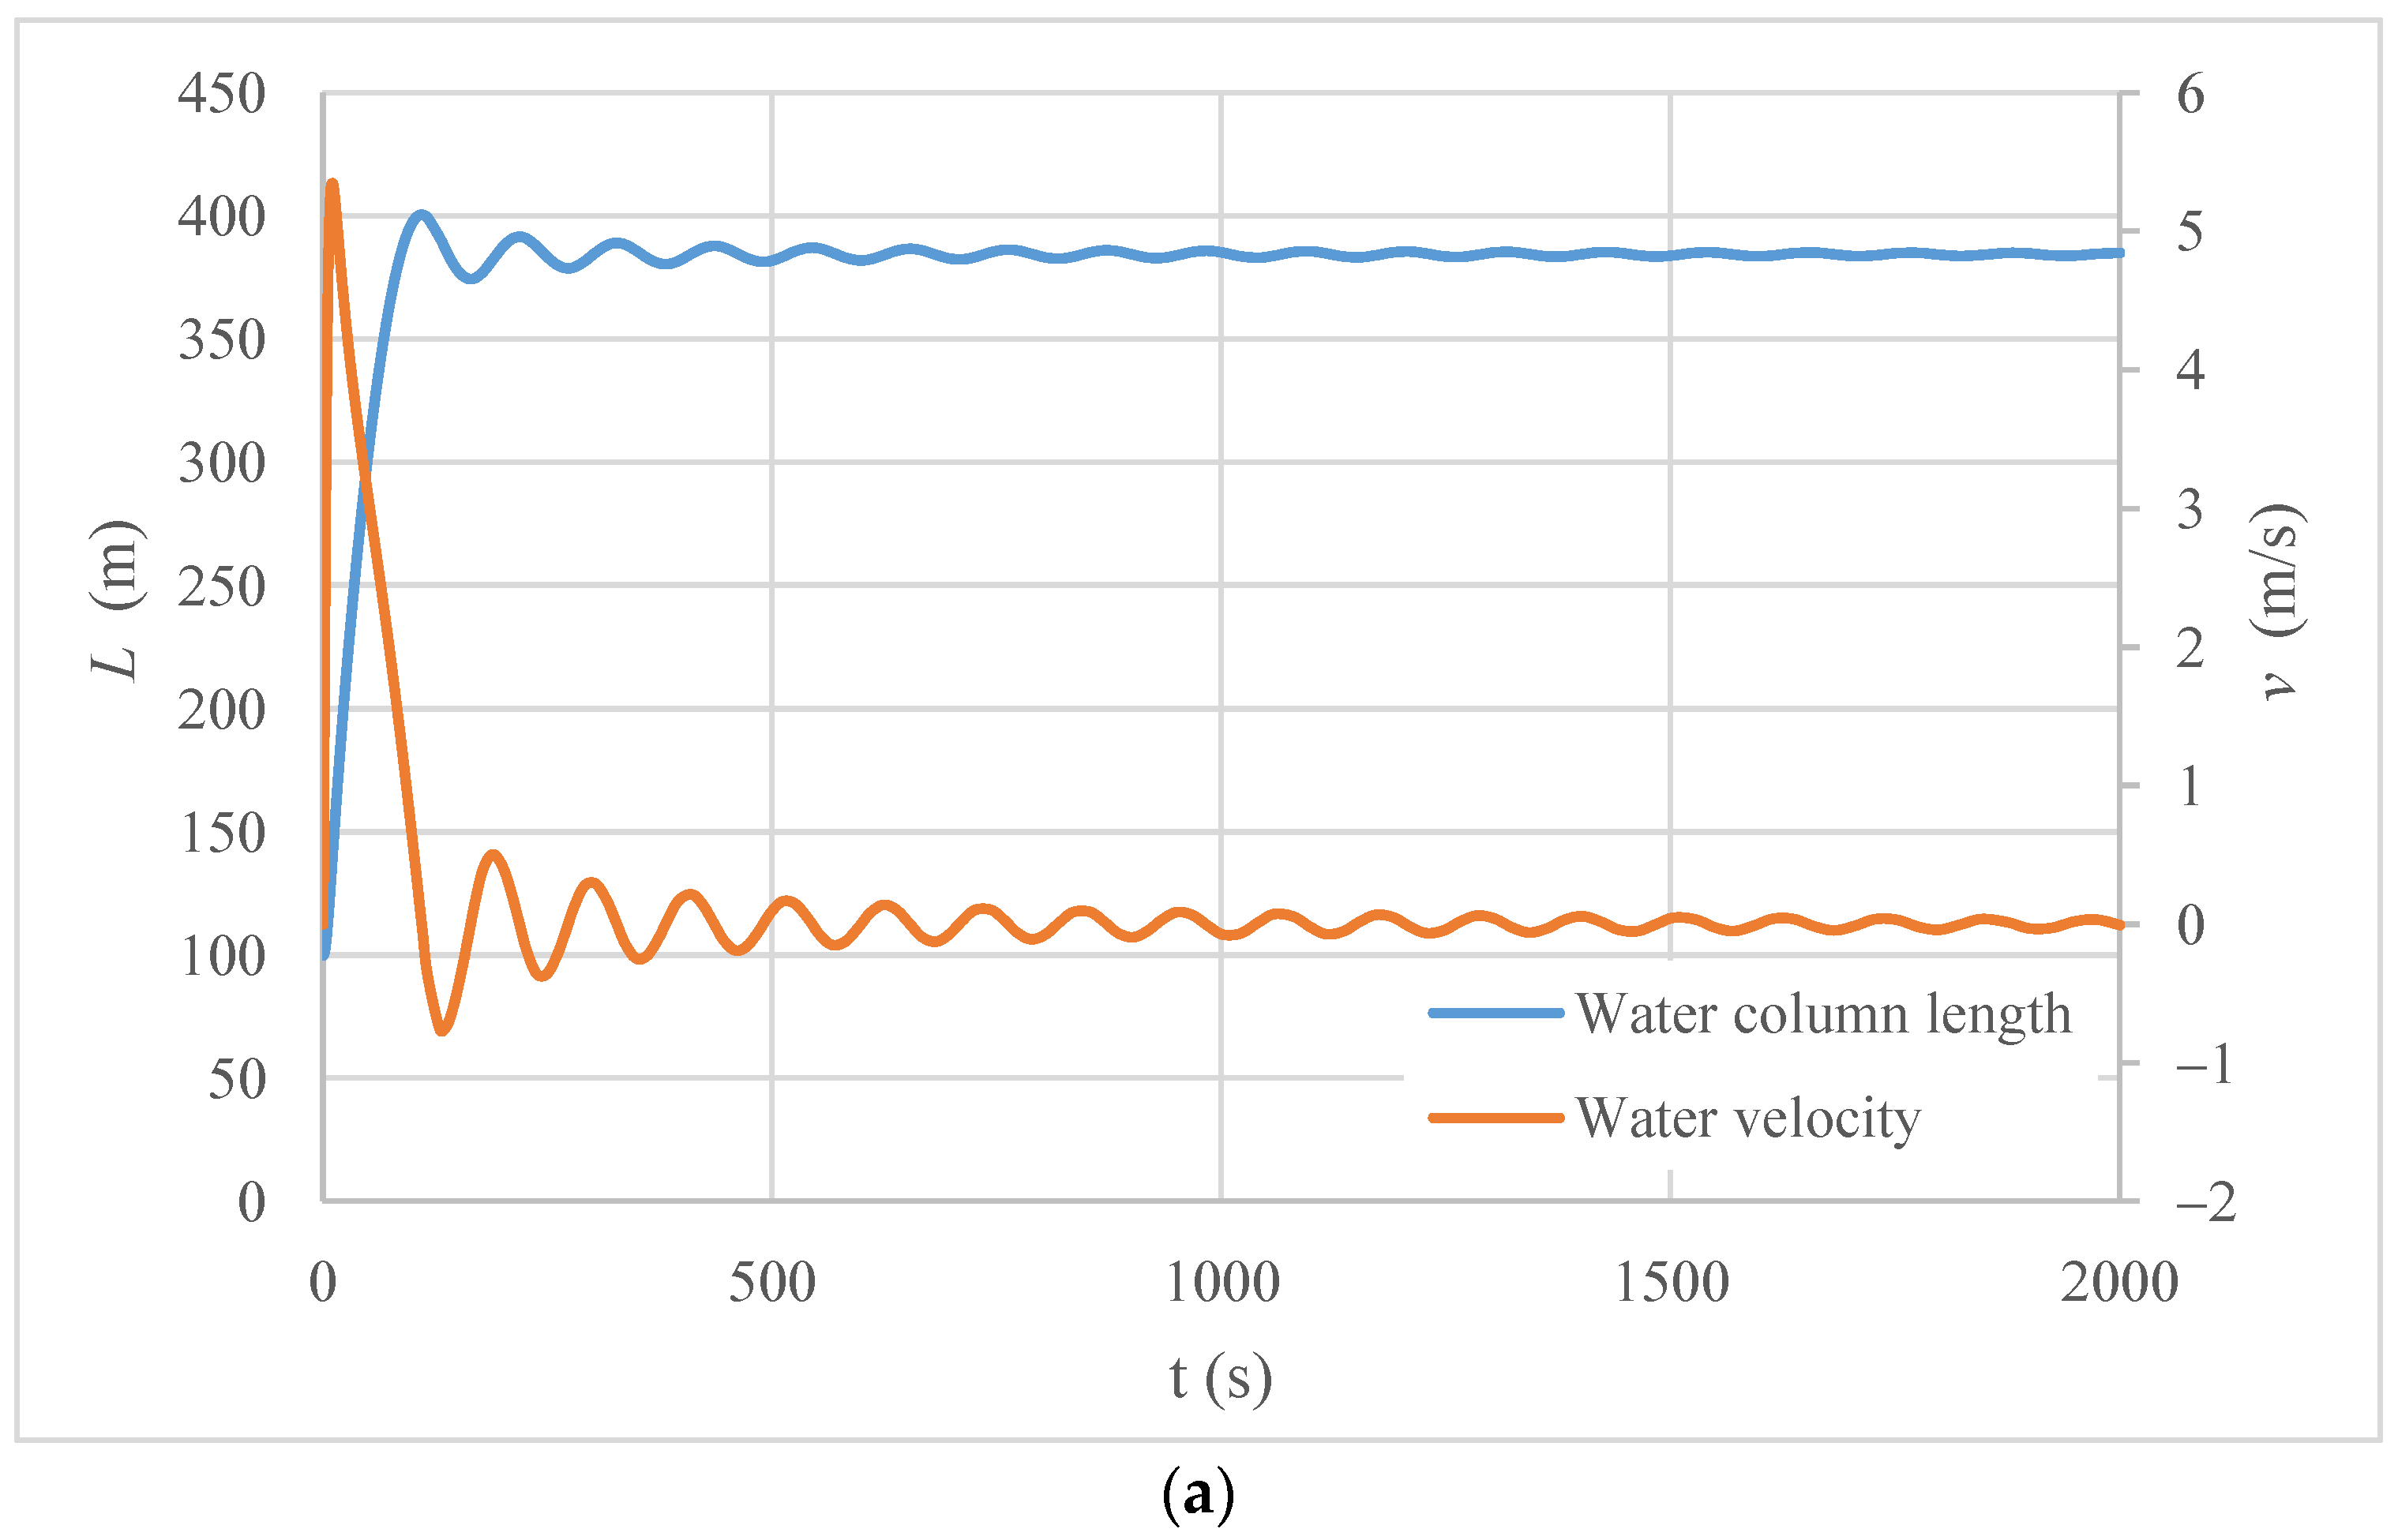
A filling operation was simulated in a single pipe considering a total length of 600 m, an internal pipe diameter of 0.30 m, a pipe slope of 0.02 rad, a polytropic coefficient of 1.2, an initial air pocket of 500 m, a constant friction factor de 0.018, a resistance coefficient of 0.11 s2/m5, and an initial pressure supplied by a tank of 202,650 Pa. Figure 3 shows the evolution of the main hydraulic and thermodynamic variables over time for the analyzed case study. Figure 3a presents that the maximum water velocity occurs at 10.7 s with a value of 5.34 m/s, while the minimum value reached was −0.76 m/s (at 130.0 s), indicating a reverse water flow. After that, many oscillations occur, since the system trends to a resting position ( v = 0) at the end of the hydraulic event. The pipe is filled rapidly by the water column since it takes only 130.0 s to reach a maximum value of 390.9 m. After that, the air–water interface exhibits many pulses moving around its final position (384.42 m). Figure 3b presents the evolution of air pocket pulses for the analyzed case study. The air pocket starts at atmospheric condition (101,325 Pa). The air pocket pressure head reached a peak value of 31.1 m (at 110.6 s) which was provoked by the compression of the filling water column. A similar trend is detected with regard to air pocket pressure oscillations, where the system finished with a value of 28.3 m.
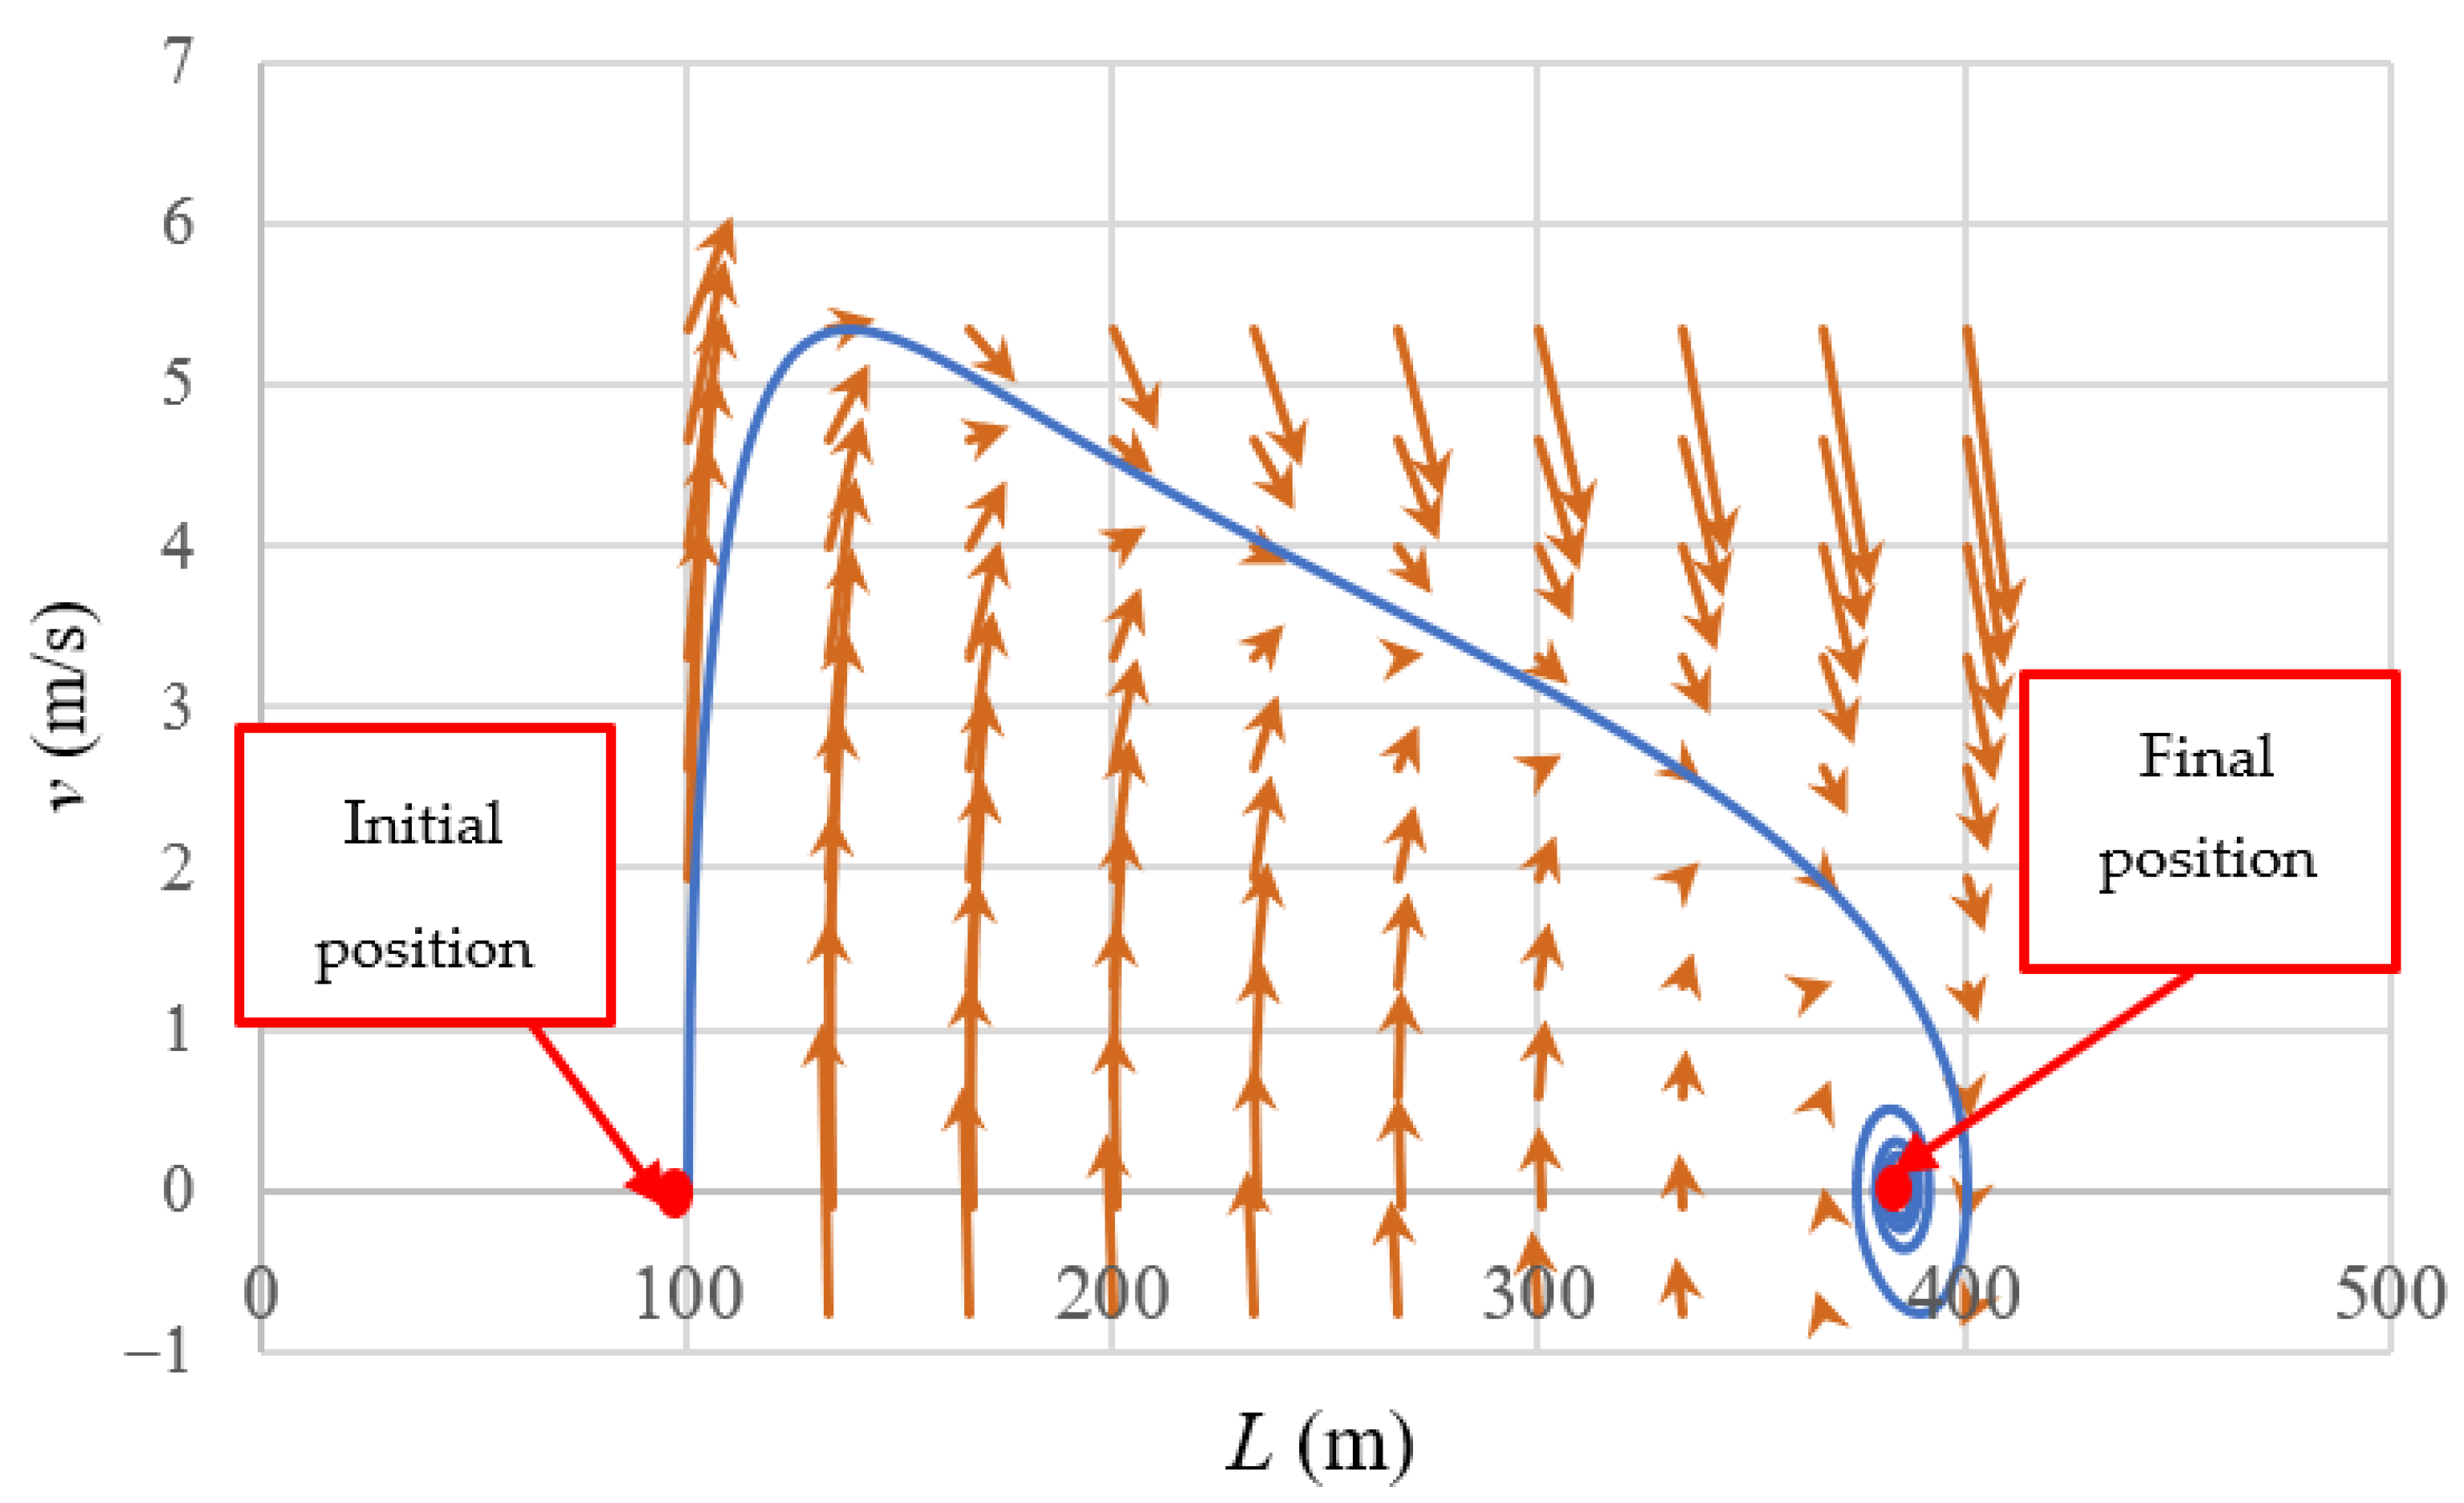
It is important to highlight that there is a relationship between the water velocity and the filling water column position as shown in Figure 4. When the system is at rest ( v = 0), the initial position of the water column length is 100 m. The end of the hydraulic event is characterized by a null water velocity as the water column length reaches its final position (384.4 m). Thus, the pipe is not completely emptied, where an air pocket size of 215.6 m is trapped at the end of the transient flow. Red points show initial and final positions of water column lengths. Orange vectors show the velocity field during the filling process occurrence. The norm of V shows how fast the water is moving along the pipeline.

3.2. Final Position of Air–Water Interface

The flowchart presented in Figure 2 contains a procedure that can be used to directly compute the final position of an air–water interface. The numerical resolution of the algebraic-differential equations system (Equations (1)–(3)) of the analyzed case study gave a final water column length of 384.42 m. The flowchart recommends starting with a seed value for an isothermal evolution since the final position can be directly computed using Equation (11), obtaining a value of 422.58 m. Table 1 shows the calculation of L f , where the third iteration provides the required response of 384.42 m. The application of the Newton-Raphson method is suitable for predicting the final position of the air–water interface. Only three iterations were required to find the final value L f .
An analysis of Equations (1)–(3) was conducted to determine a range of seed values. The maximum value of the seed value corresponds to the total length of a water pipeline ( L T ) and in all cases the final position should be greater than zero (0). Then, a sensitivity analysis of the seed value was performed considering initial values varying from 0.1 to 599 m (see Figure 5). Most selected seed values use a maximum of four iterations to find the required value (384.42 m). Many iterations are needed when selected seed values are found at the limits of physical constraints (0 < L < L T ), where 12 iterations were required for a seed value of 599.0 m and 15 iterations using a seed value of 0.1 m.

3.3. Sensitivity Analysis

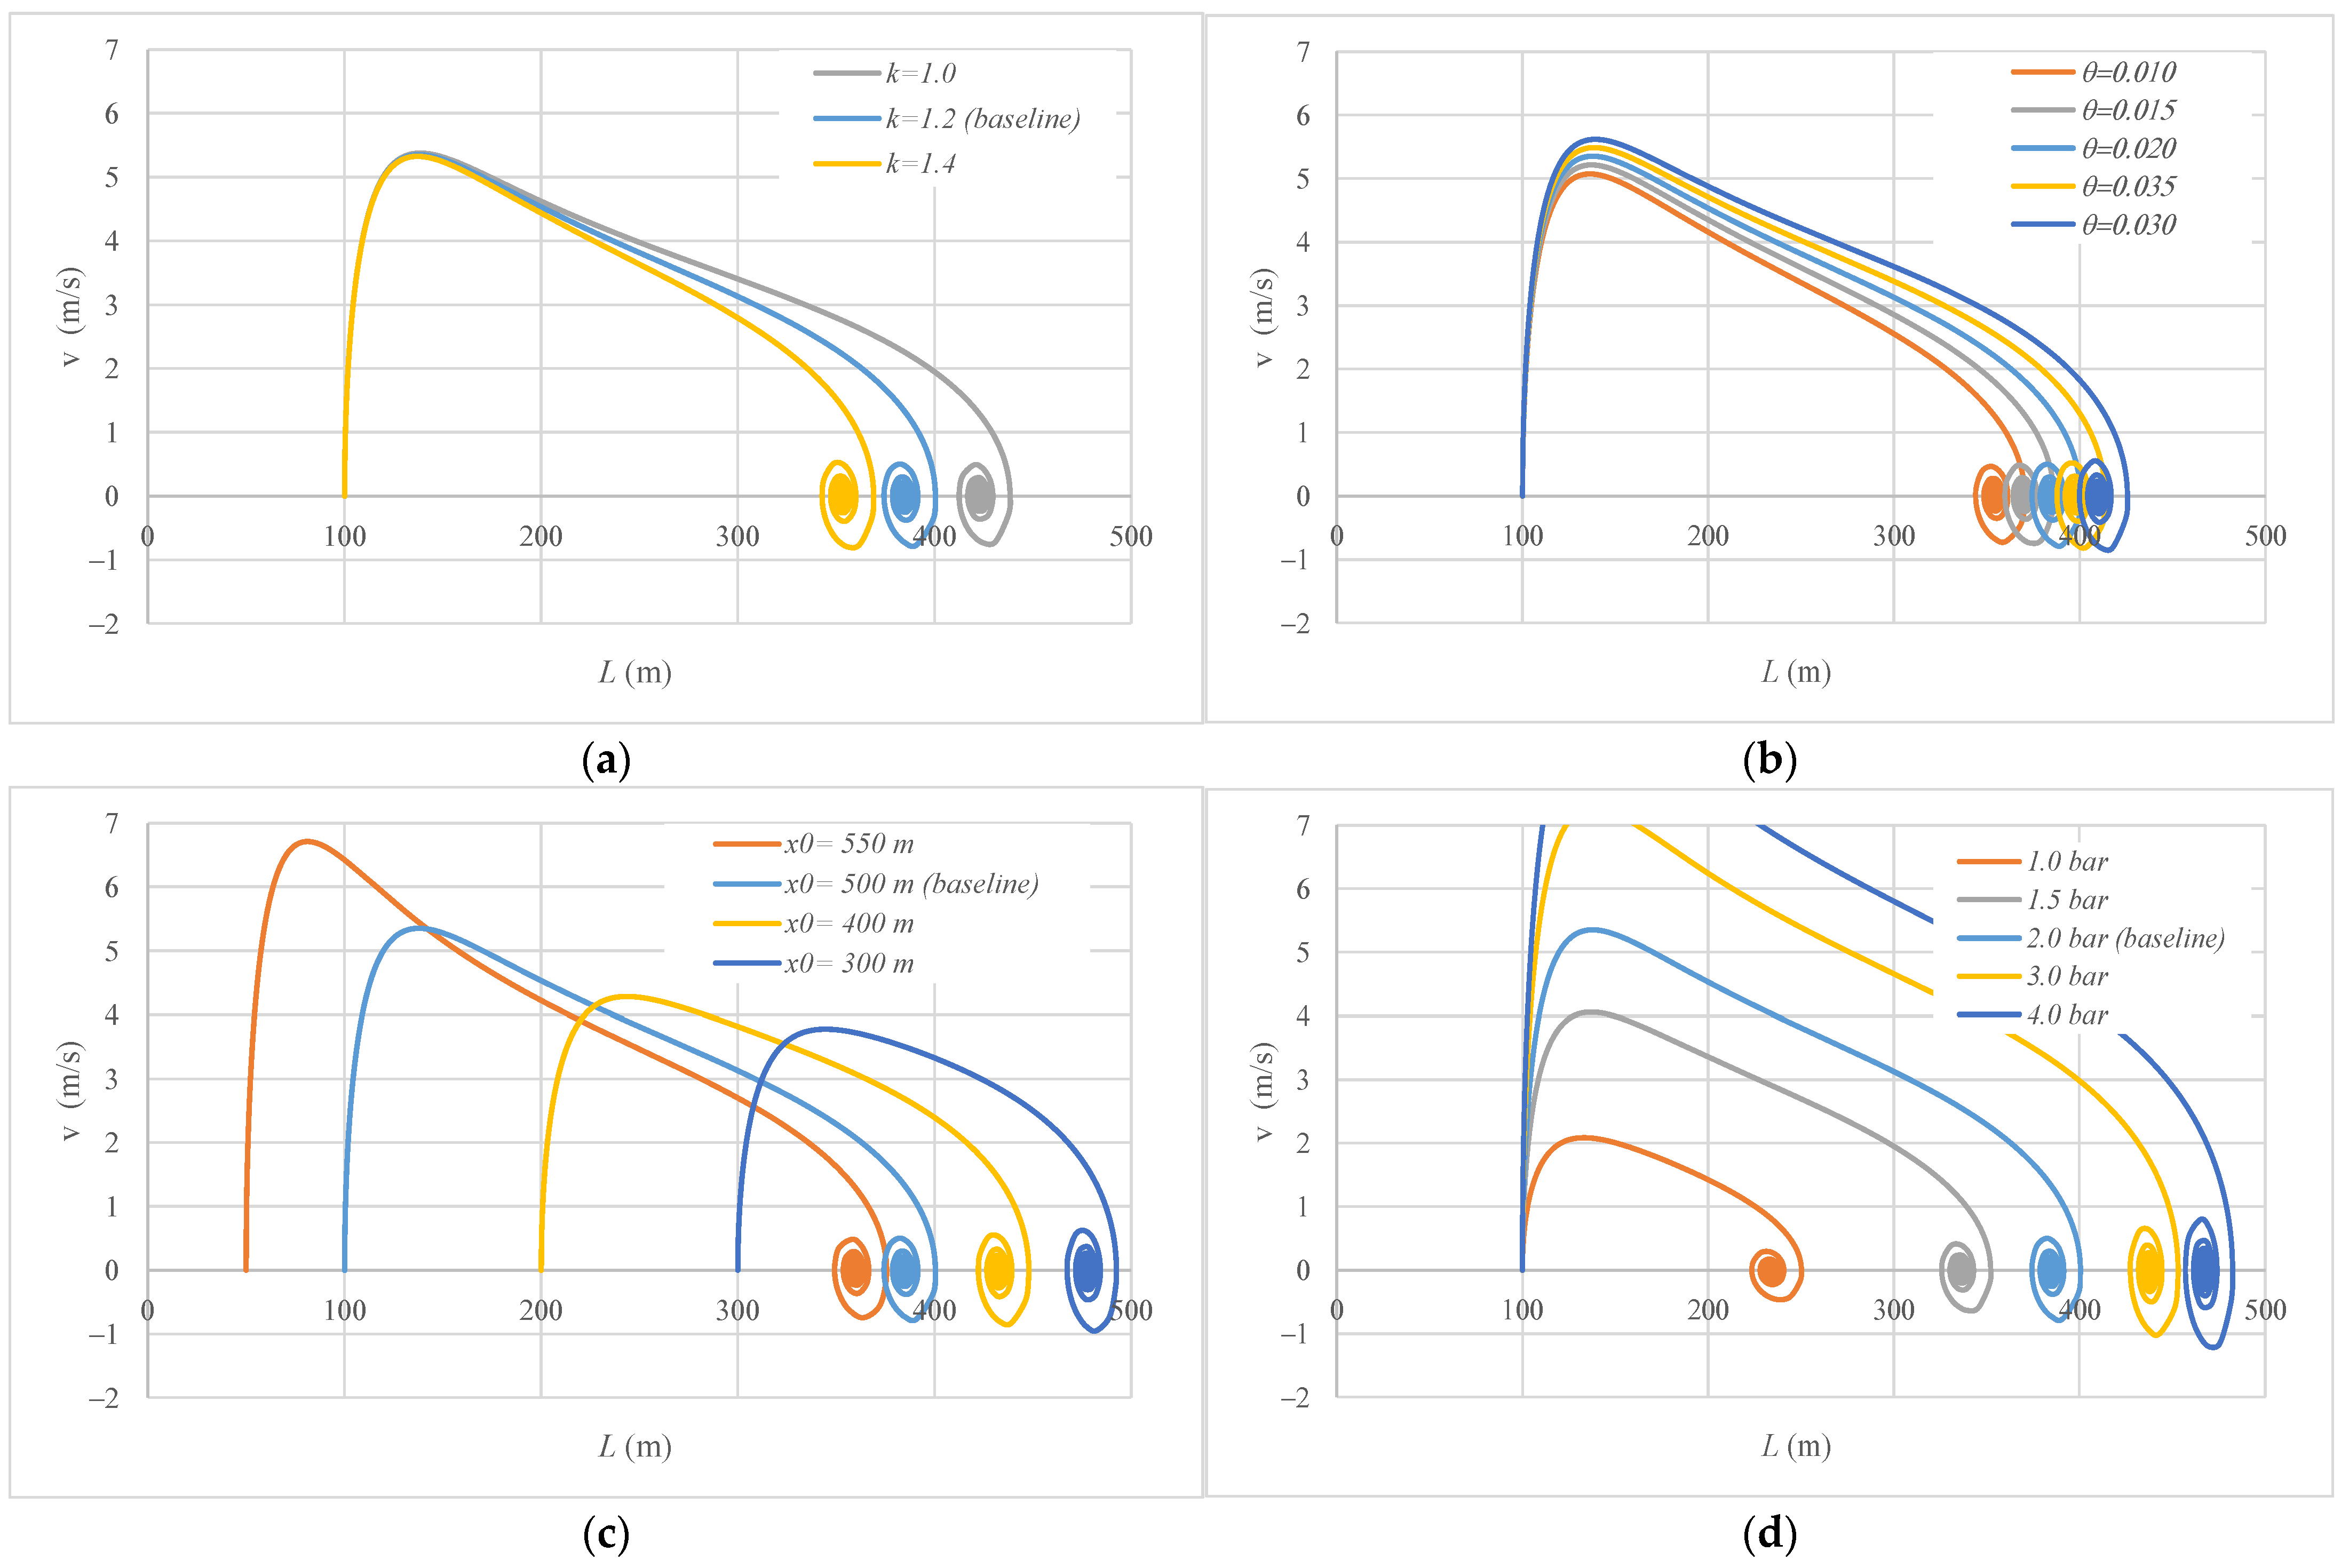
Based on data of the case study (Section 3.1), the following sensitivity analysis was conducted where only one parameter was varied in order to see the order of magnitude of the water column length and especially its final position. The analysis of Equation (8) shows that there are dependent and non-dependent parameters for computing the final position of a water column. In this sense, the final position of a water filling column ( L f ) is affected by pipe slope ( θ ) , initial air pocket size ( x 0 ) , polytropic coefficient ( k ) , and upstream absolute pressure ( p 0 * ) . Figure 6 shows how the value L f can change according to the variations of these parameters. Figure 6a presents how the polytropic coefficient can affect the water velocity curve versus water column length. The lower the polytropic coefficient, the higher the final position of the obtained water column length. A value of 422.58 m is attained considering an isothermal evolution ( k = 1.0), while an adiabatic behavior ( k = 1.4) gives a final value of 352.96 m. Regarding the pipe slope (see Figure 6b), the lower its value, the lower the value L f obtained. This indicates that a high pipe slope produces a more efficient filling process. The initial air pocket size is another dependent parameter that can influence the final position of an air–water interface. Small values indicate that the process will finish in a short time compared to big ones. Figure 6d shows the variation of L f as a function of the initial absolute pressure. The smaller the initial absolute pressure supplied by a source of energy, the larger the air pocket size at the end of the hydraulic event remaining inside of the hydraulic installation. For instance, with an absolute pressure of 101,325 Pa (1 bar), the value L f is 233.65 m, while assuming an absolute pressure of 405,300 Pa (4 bar), a value L f of 467.11 m is achieved.
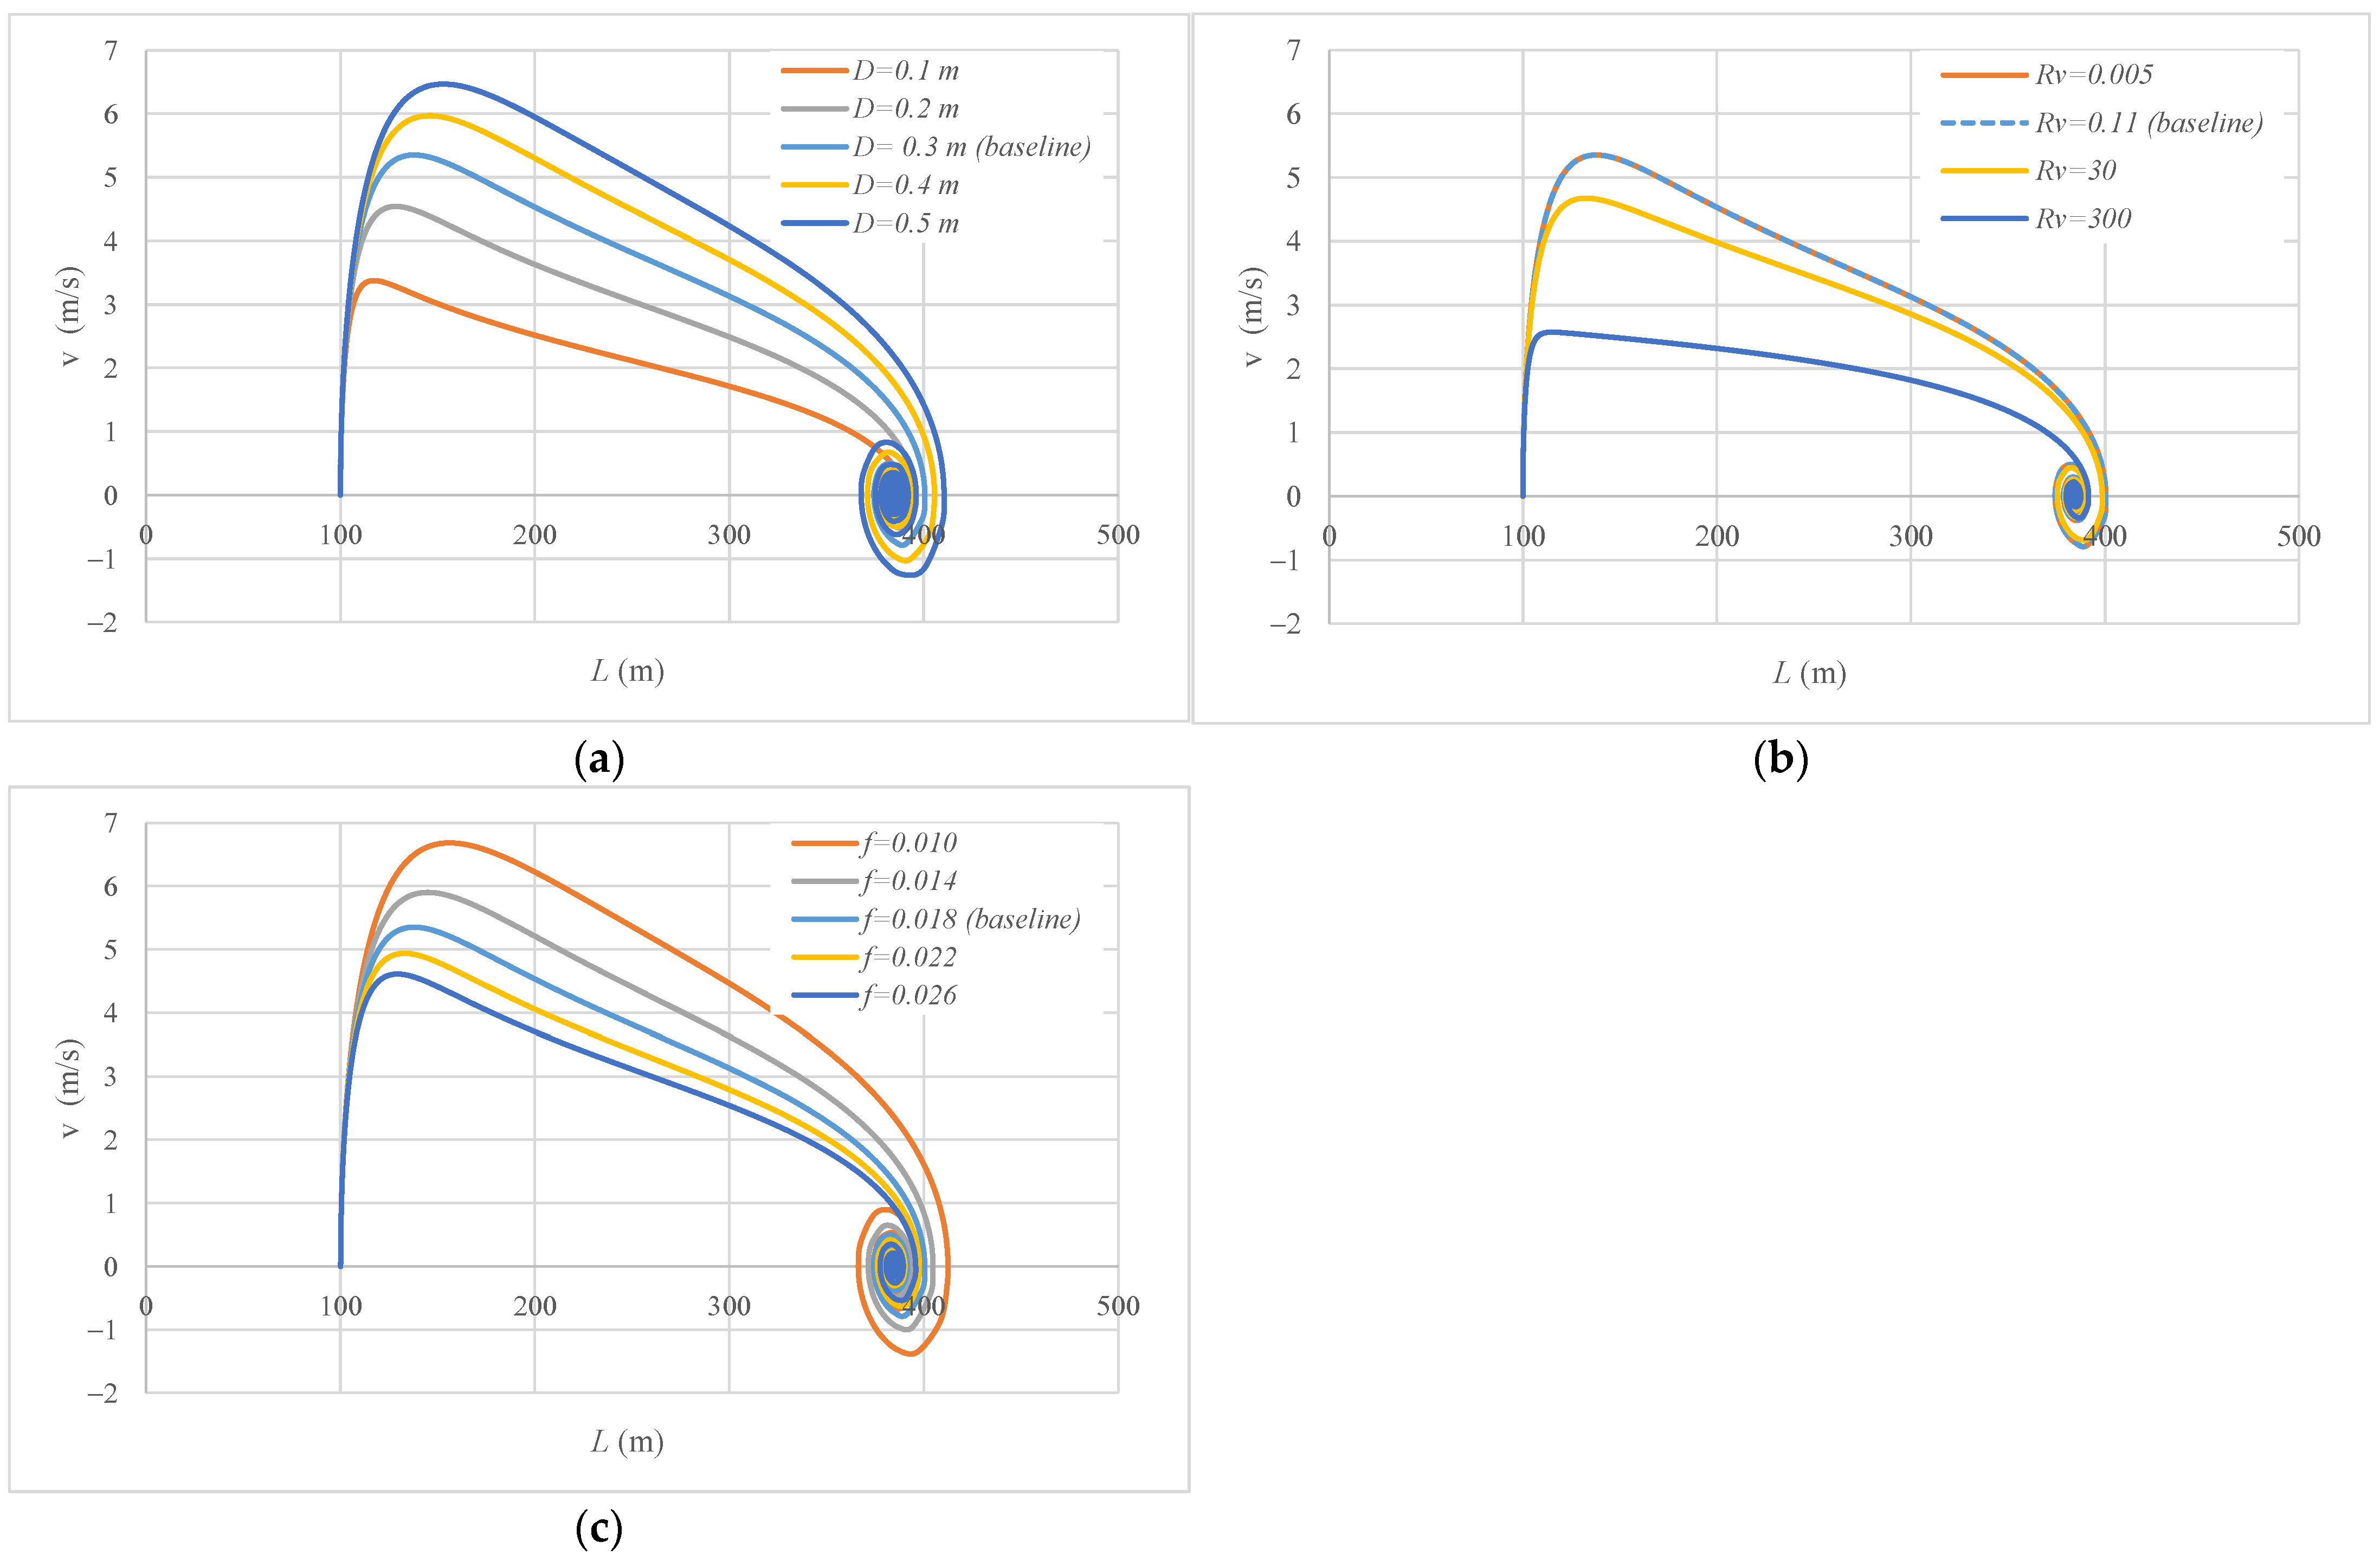
Figure 7 shows that internal pipe diameter, resistance coefficient, and friction factor do not affect the final position of the water column length. However, it is important to bear in mind that during the filling process, these parameters produce peak values that should be considered for design purposes. The final position of the water column length is the same independent of the variation of these parameters.

3.4. Experimental Validation

An experimental facility was set-up at the hydraulic lab at the Instituto Superior Técnico, University of Lisbon, Portugal in order to validate the methodology proposed in Figure 2. The installation is composed of a 7.36 m long PVC pipeline with a nominal diameter of 63 mm, a hydro-pneumatic tank to supply initial gauge pressures of 0.75 and 1.25 bar, and an electro-valve located at the upstream end. An entrapped air pocket was configured at the highest point of the hydraulic installation with sizes ( x 0 ) of 0.46, 0.96, and 1.36 m, which include the configuration on the top part of the pipeline. The two inclined branch pipes have a length of 1.5 m and a longitudinal slope of 30°. The filling process starts with the opening of the electro-valve 1 (EV1). The EV2 remained closed for all experimental measurements, so the right water column did not change over time (boundary condition). Figure 8 shows the experimental facility. The left water column remained static for all experimental measurements. Table 2 presents the experimental measurements.
A pressure transducer was installed at the highest point of the experimental facility to measure air pocket pressure. Each test was repeated twice to check the measurements. The average experimental measurements were used to validate the methodology presented in Figure 2. Figure 9a contains average absolute pressure patterns for Tests 1 to 6. The maximum value of air pocket pressure of 51.03 m (at 0.39 s) was obtained for Test No. 5, while the minimum value of air pocket pressure was obtained for Test No. 3 with a value of 31.33 m. Water column length pulses (see Figure 9b) were computed based on the polytropic law as follows:
L = L T ( p 1 , 0 * p 1 * ) 1 / k x 0  
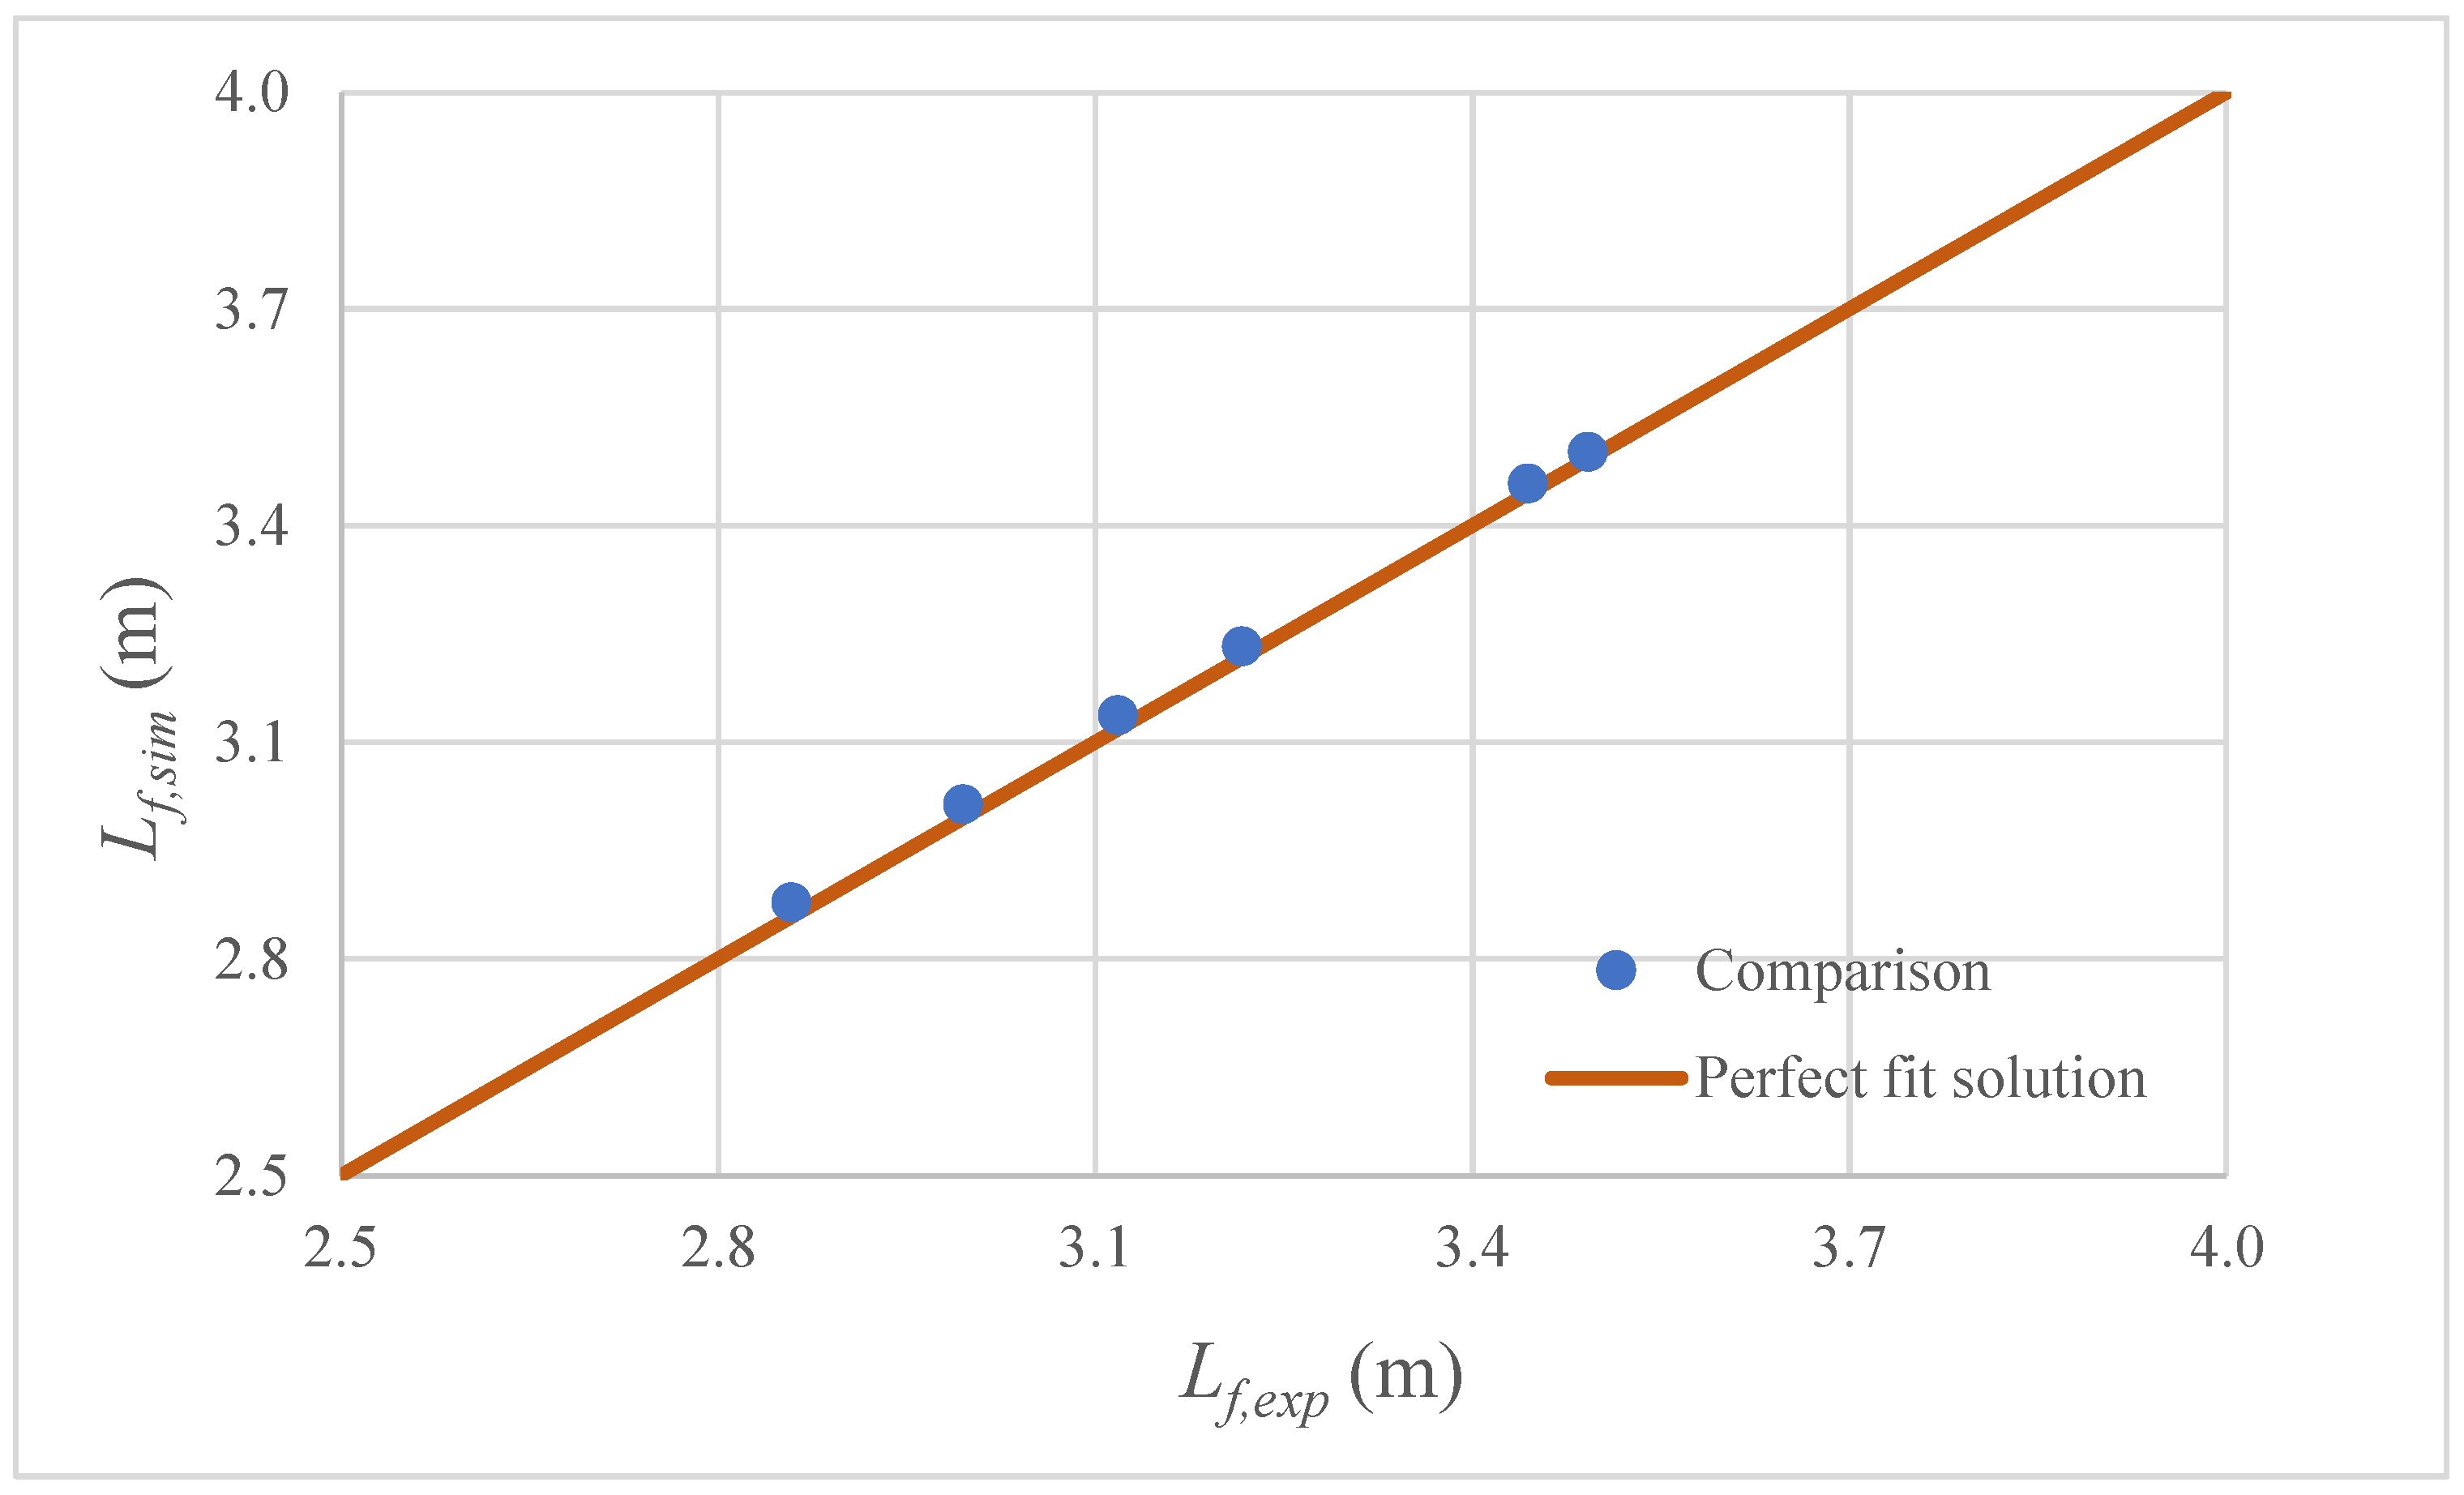
Finally, the validation of the proposed methodology was based on the final values of the water column lengths as shown in Figure 10. The comparison shows that the proposed methodology is suitable to compute the final position of an air–water interface since experimental and simulated data are similar. For instance, for Test No. 2 both experimental measurements ( L f , e x p ) and simulated ( L f , s i m ) data provided a final value of the water column length of 3.12 m. The root mean square error ( R M S E ) was computed obtaining a value of 0.017 m.
R M S E = s = 1 N ( L f , s , e x p L f , s , s i m ) 2 N  
where N is the total amount of experimental tests, and the subscript s represents a specific experimental test.

4. Conclusions

The analysis of filling processes with entrapped air requires the numerical resolution of an algebraic-differential equations system. However, in this research, critical points of the hydraulic system were evaluated to know the behavior of the main hydraulic and thermodynamic variables. These points represent the final position during a filling water process, where the water velocity is null, and the air pocket pressure and the water column length reach their final values. The Newton–Raphson method was applied to obtain the numerical resolution of the obtained algebraic equation. A flowchart was developed to compute the final position of an air–water interface, which contains all used equations for its calculation. The obtained equation to compute the final position of an air–water interface indicates that it depends on the polytropic coefficient, pipe slope, initial air pocket size, and absolute pressure supplied by an energy source (tank or pump). However, the internal pipe diameter, resistance coefficient, and friction factor do not alter the final location of an air–water interface. The proposed methodology was validated in an experimental facility of 7.6 m long PVC pipeline with nominal diameter of 63 mm. Results showed that experimental measurements and simulated data were very close.
Water utility companies can use the obtained formulation (see Equation (8) and Figure 1) to know the final position of an air–water interface without running the complex algebraic-differential equations system (see Equations (1)–(3)) during filling processes without an entrapped air pocket. Future research should be focused on the development of analytical solutions for computing final locations of air–water interface in rapid filling processes considering air valves.

Author Contributions

Conceptualization, Ó.E.C.-H. and D.M.B.-C.; methodology, V.S.F.-M., M.B., and H.M.R.; formal analysis, Ó.E.C.-H. and D.M.B.-C.; writing—original draft preparation, Ó.E.C.-H. and D.M.B.-C.; supervision, V.S.F.-M., M.B., and H.M.R. All authors have read and agreed to the published version of the manuscript.

Funding

This research projects did not receive either external or internal funds.

Data Availability Statement

Databases are available from the corresponding author.

Conflicts of Interest

The authors declare no conflict of interest.

Abbreviations

ACross-sectional area of pipe (m2)
DInternal pipe diameter (m)
fFriction factor (-)
gGravity acceleration (m s−2)
kPolytropic coefficient (-)
jUsed function in the Newton–Raphson equation
LWater column length (m)
LTPipe length (m)
p0*Initial absolute pressure supplied by an energy source (Pa)
patm*Atmospheric pressure (101,325 Pa)
p*1Air pocket pressure (Pa)
RvResistance coefficient (ms2m−6)
tTime (s)
vWater velocity (m s−1)
VVector field on a region in the plane (L, v)
xAir pocket size (m)
XVector function of t
ρ Water density (kg m−3)
θPipe slope (rad)
γwWater unit weight (N m−3)
Subscripts
0Refers to an initial condition
fRefers to a final condition
iIteration number
sSpecific experimental test
Superscripts
Derivative

References

  1. Tasca, E.; Besharat, M.; Ramos, H.M.; Luvizotto, E., Jr.; Karney, B. Contribution of Air Management to the Energy Efficiency of Water Pipelines. Sustainability 2023, 15, 3875. [Google Scholar] [CrossRef]
  2. Martins, N.M.; Soares, A.K.; Ramos, H.M.; Covas, D.I. CFD modeling of transient flow in pressurized pipes. Comput. Fluids 2016, 126, 129–140. [Google Scholar] [CrossRef]
  3. Maddahian, R.; Shaygan, F.; Bucur, D.M. Developing a 1D-3D model to investigate the effect of entrapped air on pressure surge during the rapid filling of a pipe. IOP Conf. Ser. Earth Environ. Sci. 2021, 774, 012069. [Google Scholar] [CrossRef]
  4. Fuertes-Miquel, V.S.; Coronado-Hernández, Ó.E.; Mora-Melia, D.; Iglesias-Rey, P.L. Hydraulic Modeling during Filling and Emptying Processes in Pressurized Pipelines: A Literature Review. Urban Water J. 2019, 16, 299–311. [Google Scholar] [CrossRef]
  5. AWWA (American Water Works Association). Manual of Water Supply Practices M51—Air Valves: Air Release, Air/Vacuum and Combination; AWWA: Denver, CO, USA, 2016. [Google Scholar]
  6. Zhou, L.; Liu, D. Experimental Investigation of Entrapped Air Pocket in a Partially Full Water Pipe. J. Hydraul. Res. 2013, 51, 469–474. [Google Scholar] [CrossRef]
  7. Tijsseling, A.S.; Hou, Q.; Bozkuş, Z. Rapid Liquid Filling of a Pipe With Venting Entrapped Gas: Analytical and Numerical Solutions. J. Press. Vessel. Technol. 2019, 141, 041301. [Google Scholar] [CrossRef]
  8. Liou, C.P.; Hunt, W.A. Filling of pipelines with undulating elevation profiles. J. Hydraul. Eng. 1996, 122, 534–539. [Google Scholar] [CrossRef]
  9. Izquierdo, J.; Fuertes, V.; Cabrera, E.; Iglesias, P.; Garcia-Serra, J. Pipeline start-up with entrapped air. J. Hydraul. Res. 1999, 37, 579–590. [Google Scholar] [CrossRef]
  10. Wang, H.; Zhou, L.; Liu, D.; Karney, B.; Wang, P.; Xia, L.; Ma, J.; Xu, C. CFD approach for column separation in water pipelines. J. Hydraul. Eng. 2016, 142, 04016036. [Google Scholar] [CrossRef] [Green Version]
  11. Chan, S.N.; Cong, J.; Lee, J.H. 3d numerical modeling of geyser formation by release of entrapped air from horizontal pipe into vertical shaft. J. Hydraul. Eng. 2018, 144, 04017071. [Google Scholar] [CrossRef]
  12. Wang, J.; Vasconcelos, J. Manhole cover displacement caused by the release of entrapped air pockets. J. Water Manag. Model. 2018, 26, 1–6. [Google Scholar] [CrossRef] [Green Version]
  13. Martins, N.M.; Delgado, J.N.; Ramos, H.M.; Covas, D.I. Maximum transient pressures in a rapidly filling pipeline with entrapped air using a CFD model. J. Hydraul. Res. 2017, 55, 506–519. [Google Scholar] [CrossRef]
  14. Tijsseling, A.; Hou, Q.; Bozku¸s, Z.; Laanearu, J. Improved One-Dimensional Models for Rapid Emptying and Filling of Pipelines. J. Press. Vessel Technol. 2016, 138, 031301. [Google Scholar] [CrossRef] [Green Version]
  15. Zhou, L.; Cao, Y.; Karney, B.; Vasconcelos, J.; Liu, D.; Wang, P. Unsteady friction in transient vertical-pipe flow with trapped air. J. Hydraul. Res. 2021, 59, 820–834. [Google Scholar] [CrossRef]
  16. Zhou, L.; Pan, T.; Wang, H.; Liu, D.; Wang, P. Rapid air expulsion through an orifice in a vertical water pipe. J. Hydraul. Res. 2019, 57, 307–317. [Google Scholar] [CrossRef]
  17. Zhou, L.; Cao, Y.; Karney, B.; Bergant, A.; Tijsseling, A.S.; Liu, D.; Wang, P. Expulsion of Entrapped Air in a Rapidly Filling Horizontal Pipe. J. Hydraul. Eng. 2020, 146, 04020047. [Google Scholar] [CrossRef]
  18. Coronado-Hernández, O.E.; Bonilla-Correa, D.M.; Lovo, A.; Fuertes-Miquel, V.S.; Gatica, G.; Linfati, R.; Coronado-Hernández, J.R. An Implicit Formulation for Calculating Final Conditions in Drainage Maneuvers in Pressurized Water Installations. Water 2022, 14, 3364. [Google Scholar] [CrossRef]
  19. Canelon, D.J. Pivoting Strategies in the Solution of the Saint-Venant Equations. J. Irrig. Drain. Eng. 2009, 135, 96–101. [Google Scholar] [CrossRef]
  20. Martin, C.S. Entrapped Air in Pipelines. In Proceedings of the Second International Conference on Pressure Surges, London, UK, 22–24 September 1976. [Google Scholar]
  21. Chapra, S.; Canale, R. Numerical Methods for Engineers, 7th ed.; Mcgraw-Hill Education, Cop: New York, NY, USA, 2015. [Google Scholar]
Figure 1. A filling process configuration: (a) hydraulic system at rest (t = 0); and (b) hydraulic system at t 0 .
Water 15 01304 g001
Figure 2. Flowchart for computing the final position Lf in a filling water process.
Water 15 01304 g002
Figure 3. Evolution of hydraulic and thermodynamic variables: (a) water velocity and water column length; and (b) air pocket pressure.
Water 15 01304 g003aWater 15 01304 g003b
Figure 4. Relationship between water velocity and filling water column position.
Water 15 01304 g004
Figure 5. Sensitivity analysis of seed values.
Water 15 01304 g005
Figure 6. Sensitivity analysis for dependent parameters: (a) polytropic coefficient ( k ); (b) pipe slope ( θ ); (c) air pocket size ( x 0 ); and (d) initial absolute pressure ( p 0 * ).
Water 15 01304 g006
Figure 7. Sensitivity analysis for non-dependent parameters: (a) internal pipe diameter ( D ); (b) resistance coefficient of a regulating valve ( R v ); and (c) friction factor ( f ).
Water 15 01304 g007
Figure 8. Experimental facility.
Water 15 01304 g008
Figure 9. Evolution of the analyzed variables for the experimental facility: (a) air pocket pressure; and (b) water column lengths.
Water 15 01304 g009
Figure 10. Comparison between experimental and simulated final water column lengths.
Water 15 01304 g010
Table 1. Application using the Newton–Raphson method.
i L i   ( m ) j ( y ) j ( y ) L i + 1   ( m ) L i + 1 L i   ( m )
0422.58−0.15559−0.00479390.10−32.48
1390.10−0.02036−0.00365384.53−5.57
2384.53−0.00038−0.00352384.42−0.11
3384.420.00000−0.00352384.420.00
Table 2. Experimental measurements.
Test No.123456
x0 (m)0.460.961.360.460.961.36
p 0 * (bar)1.751.751.752.252.252.25
Disclaimer/Publisher’s Note: The statements, opinions and data contained in all publications are solely those of the individual author(s) and contributor(s) and not of MDPI and/or the editor(s). MDPI and/or the editor(s) disclaim responsibility for any injury to people or property resulting from any ideas, methods, instructions or products referred to in the content.