

Identifying Key Influences on Surface Water Quality in Freshwater Areas of the Vietnamese Mekong Delta from 2018 to 2020


Abstract
1. Introduction
2. Materials and Methods
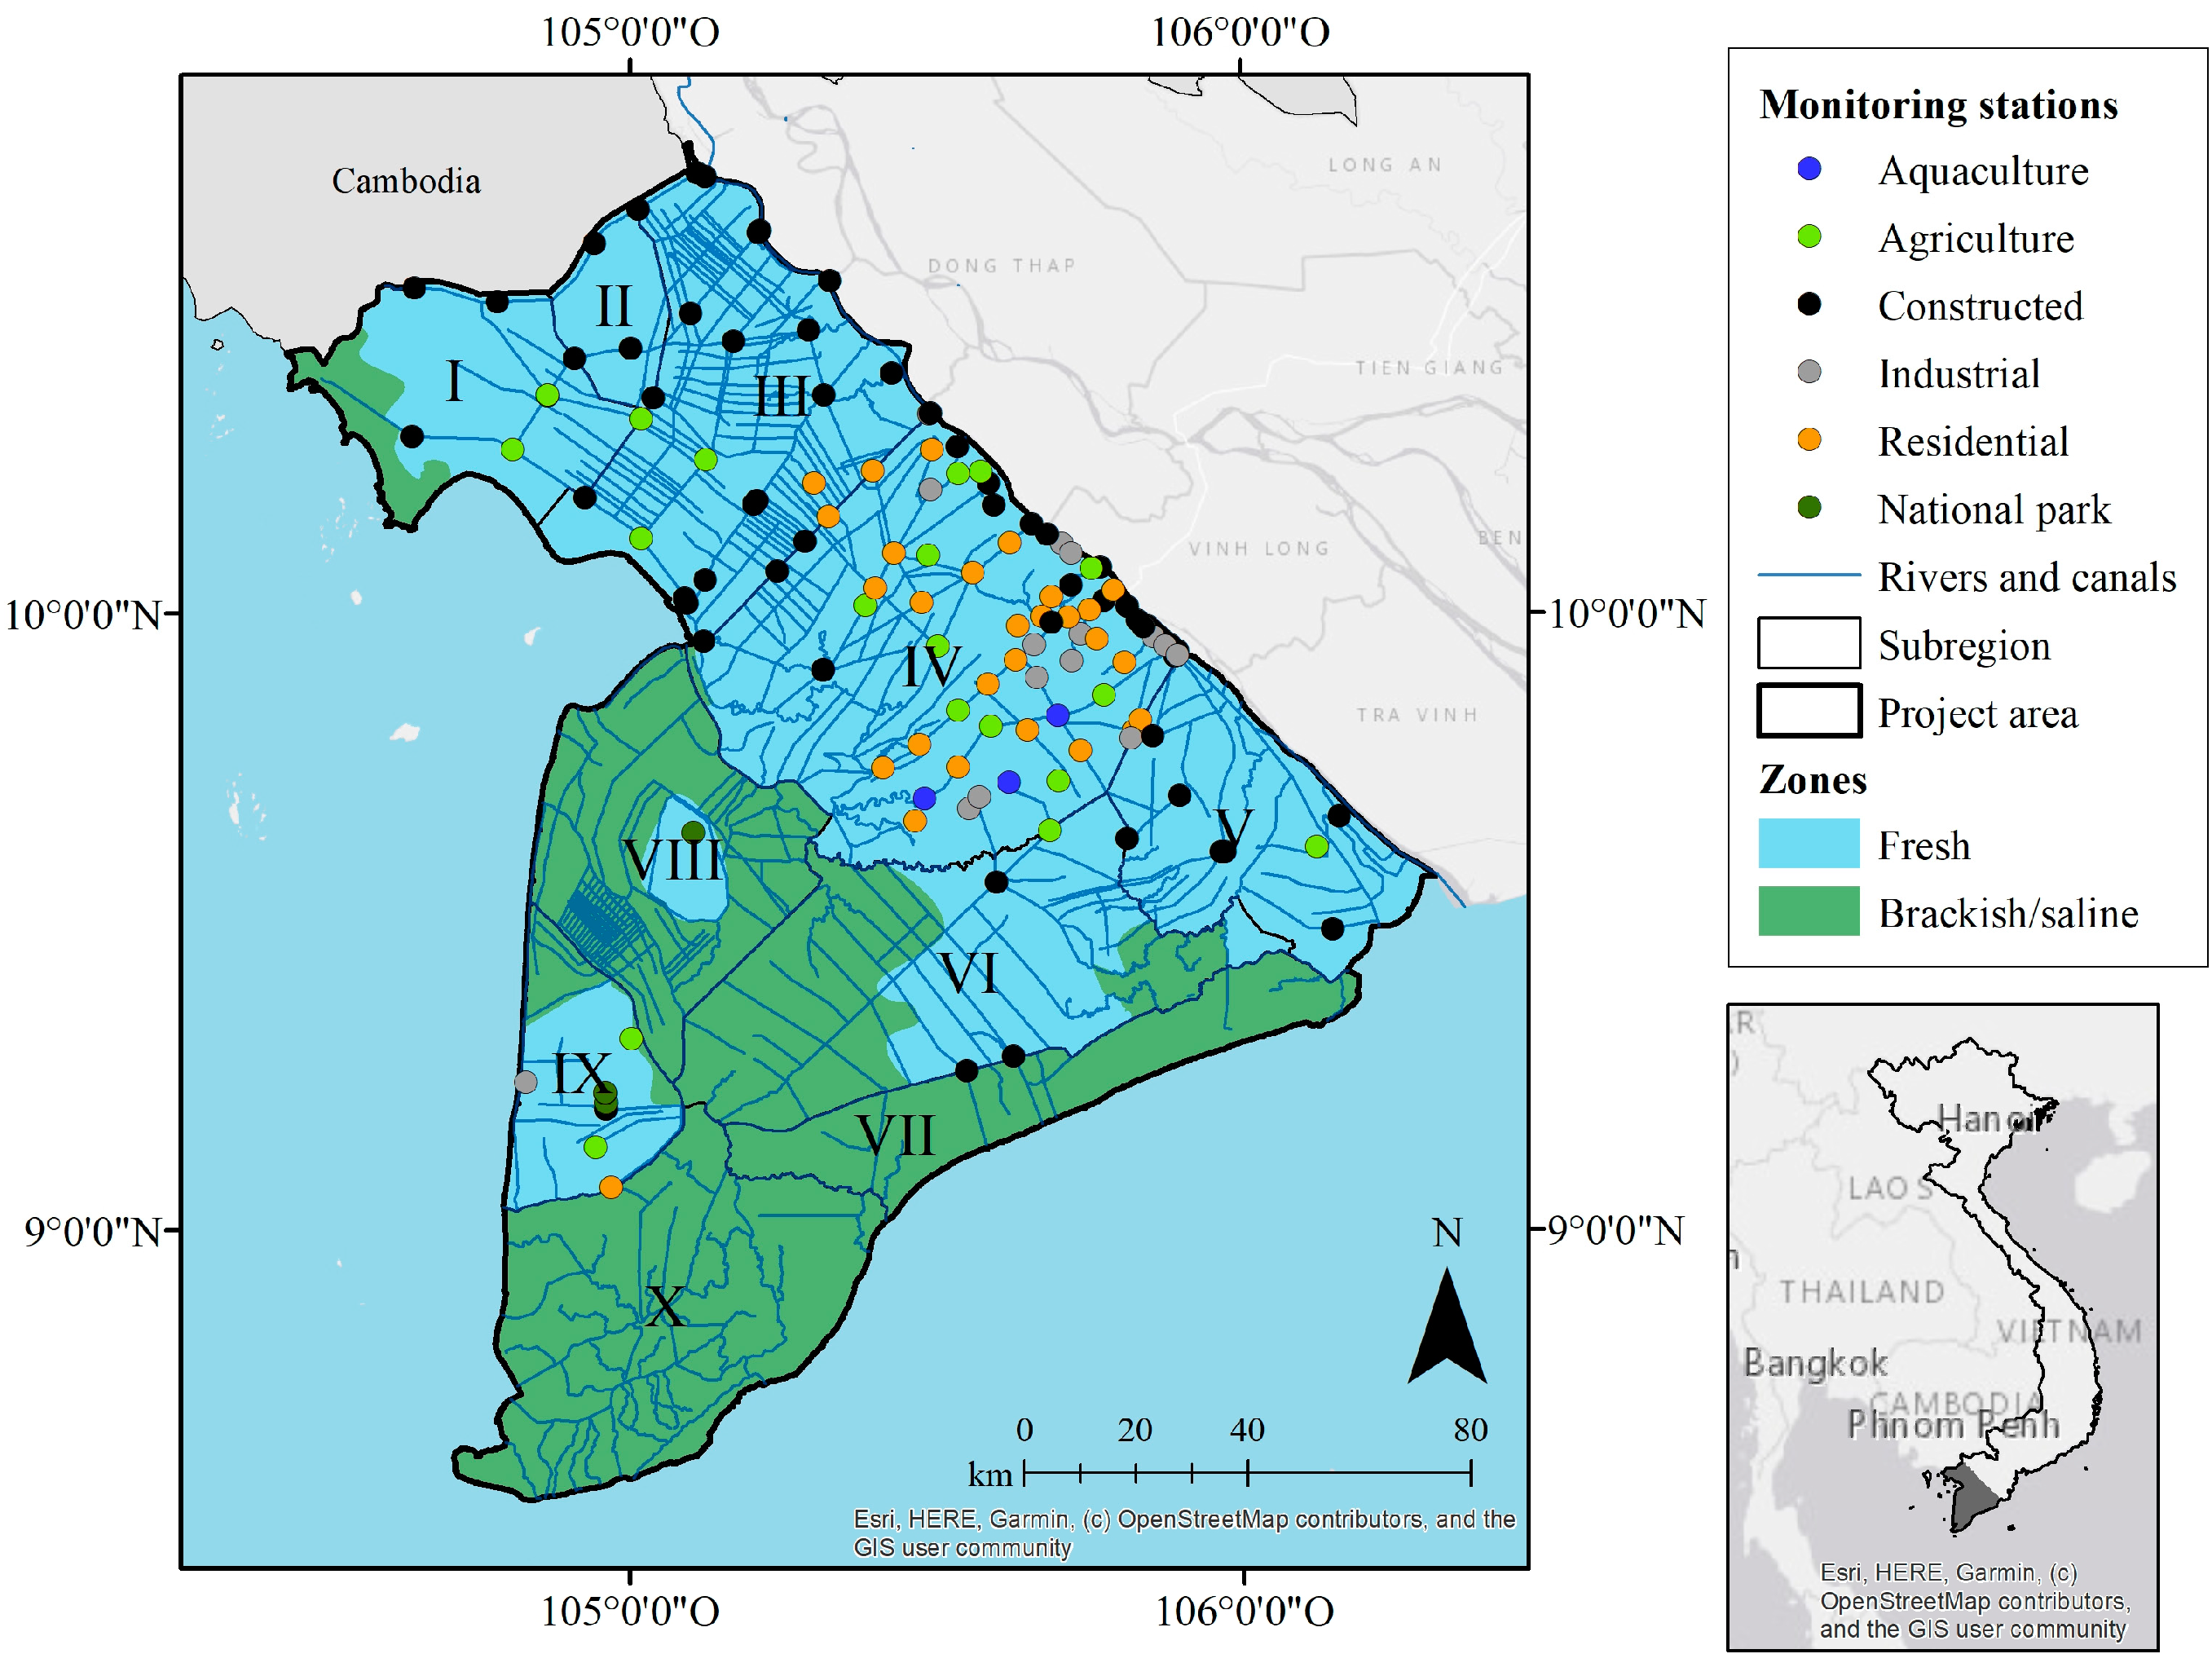
2.1. The Study Area
2.2. Data Collection and Pre-Processing
2.3. Methods of Water Quality Assessment
2.3.1. Analysis of Surface Water Quality and Surrounding Land Use
2.3.2. Correlation Analysis
2.3.3. Principal Component Analysis
3. Results and Discussion
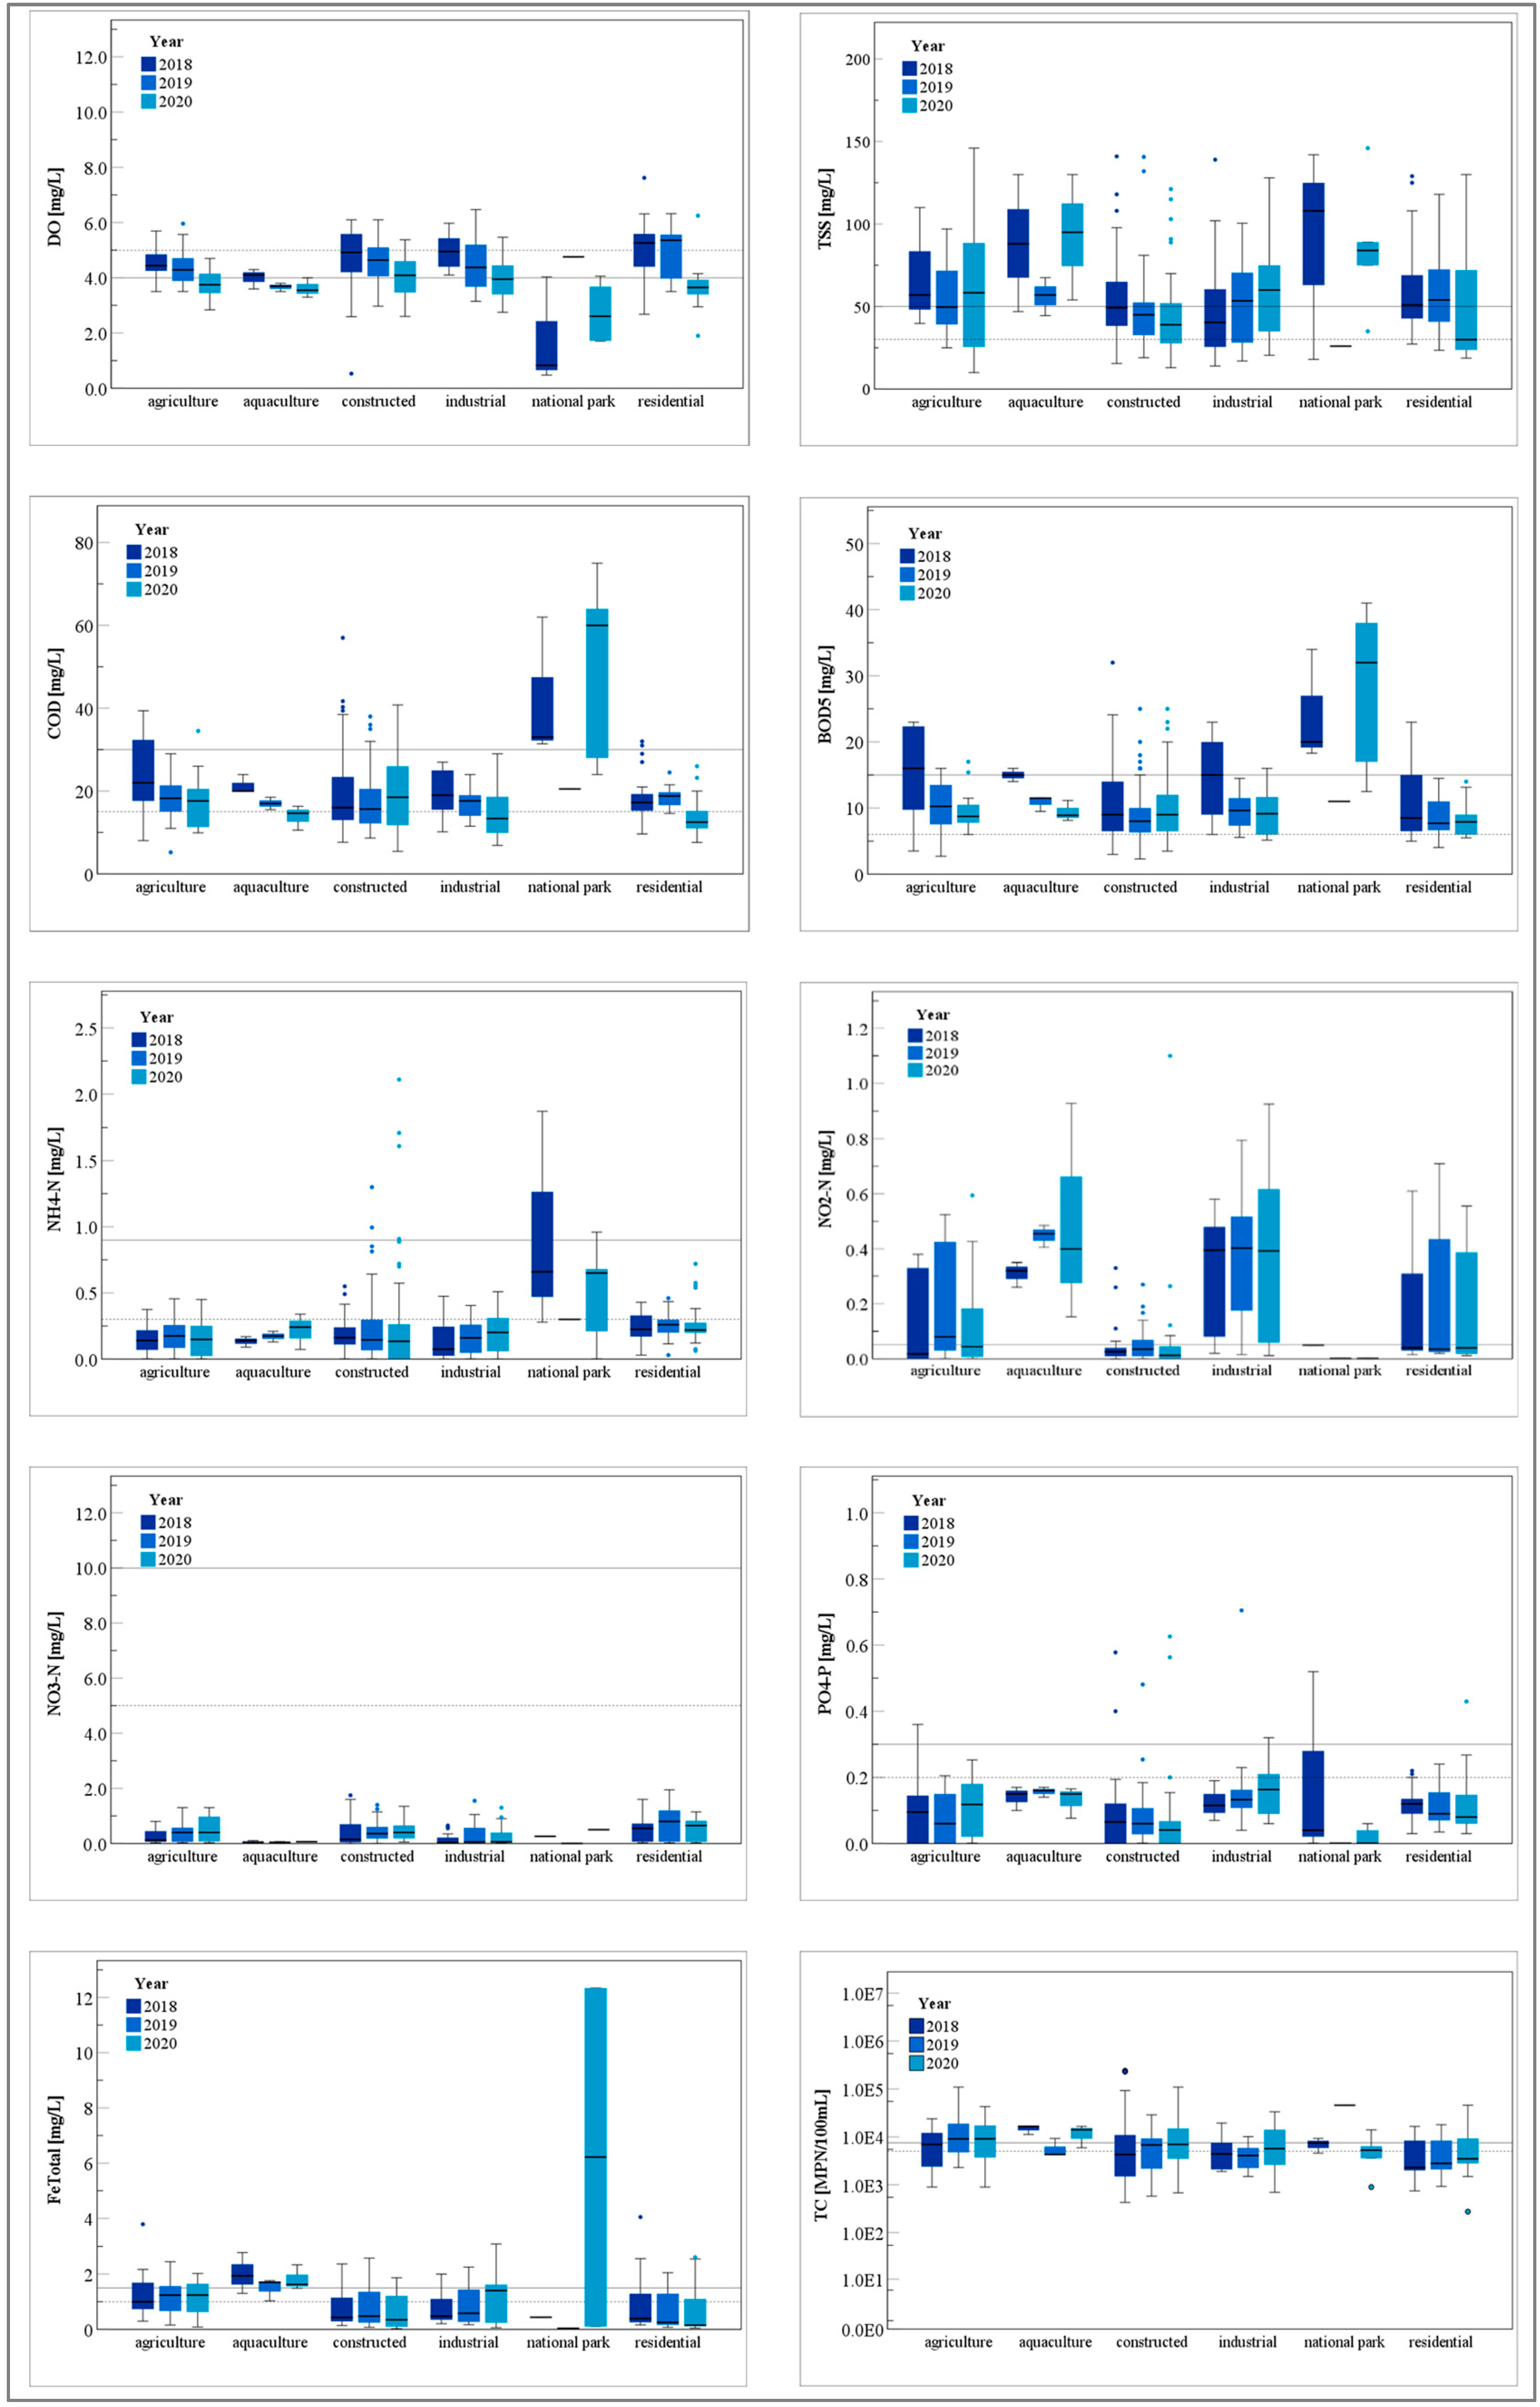
3.1. Analysis of Surface Water Quality and Surrounding Land Use
3.1.1. Dissolved Oxygen
3.1.2. Total Suspended Solids
3.1.3. Chemical Oxygen Demand and Biochemical Oxygen Demand
3.1.4. Nutrients
3.1.5. Iron
3.1.6. Microbiology
3.2. Correlation Analysis of River and Canal Hierarchy and Water Quality
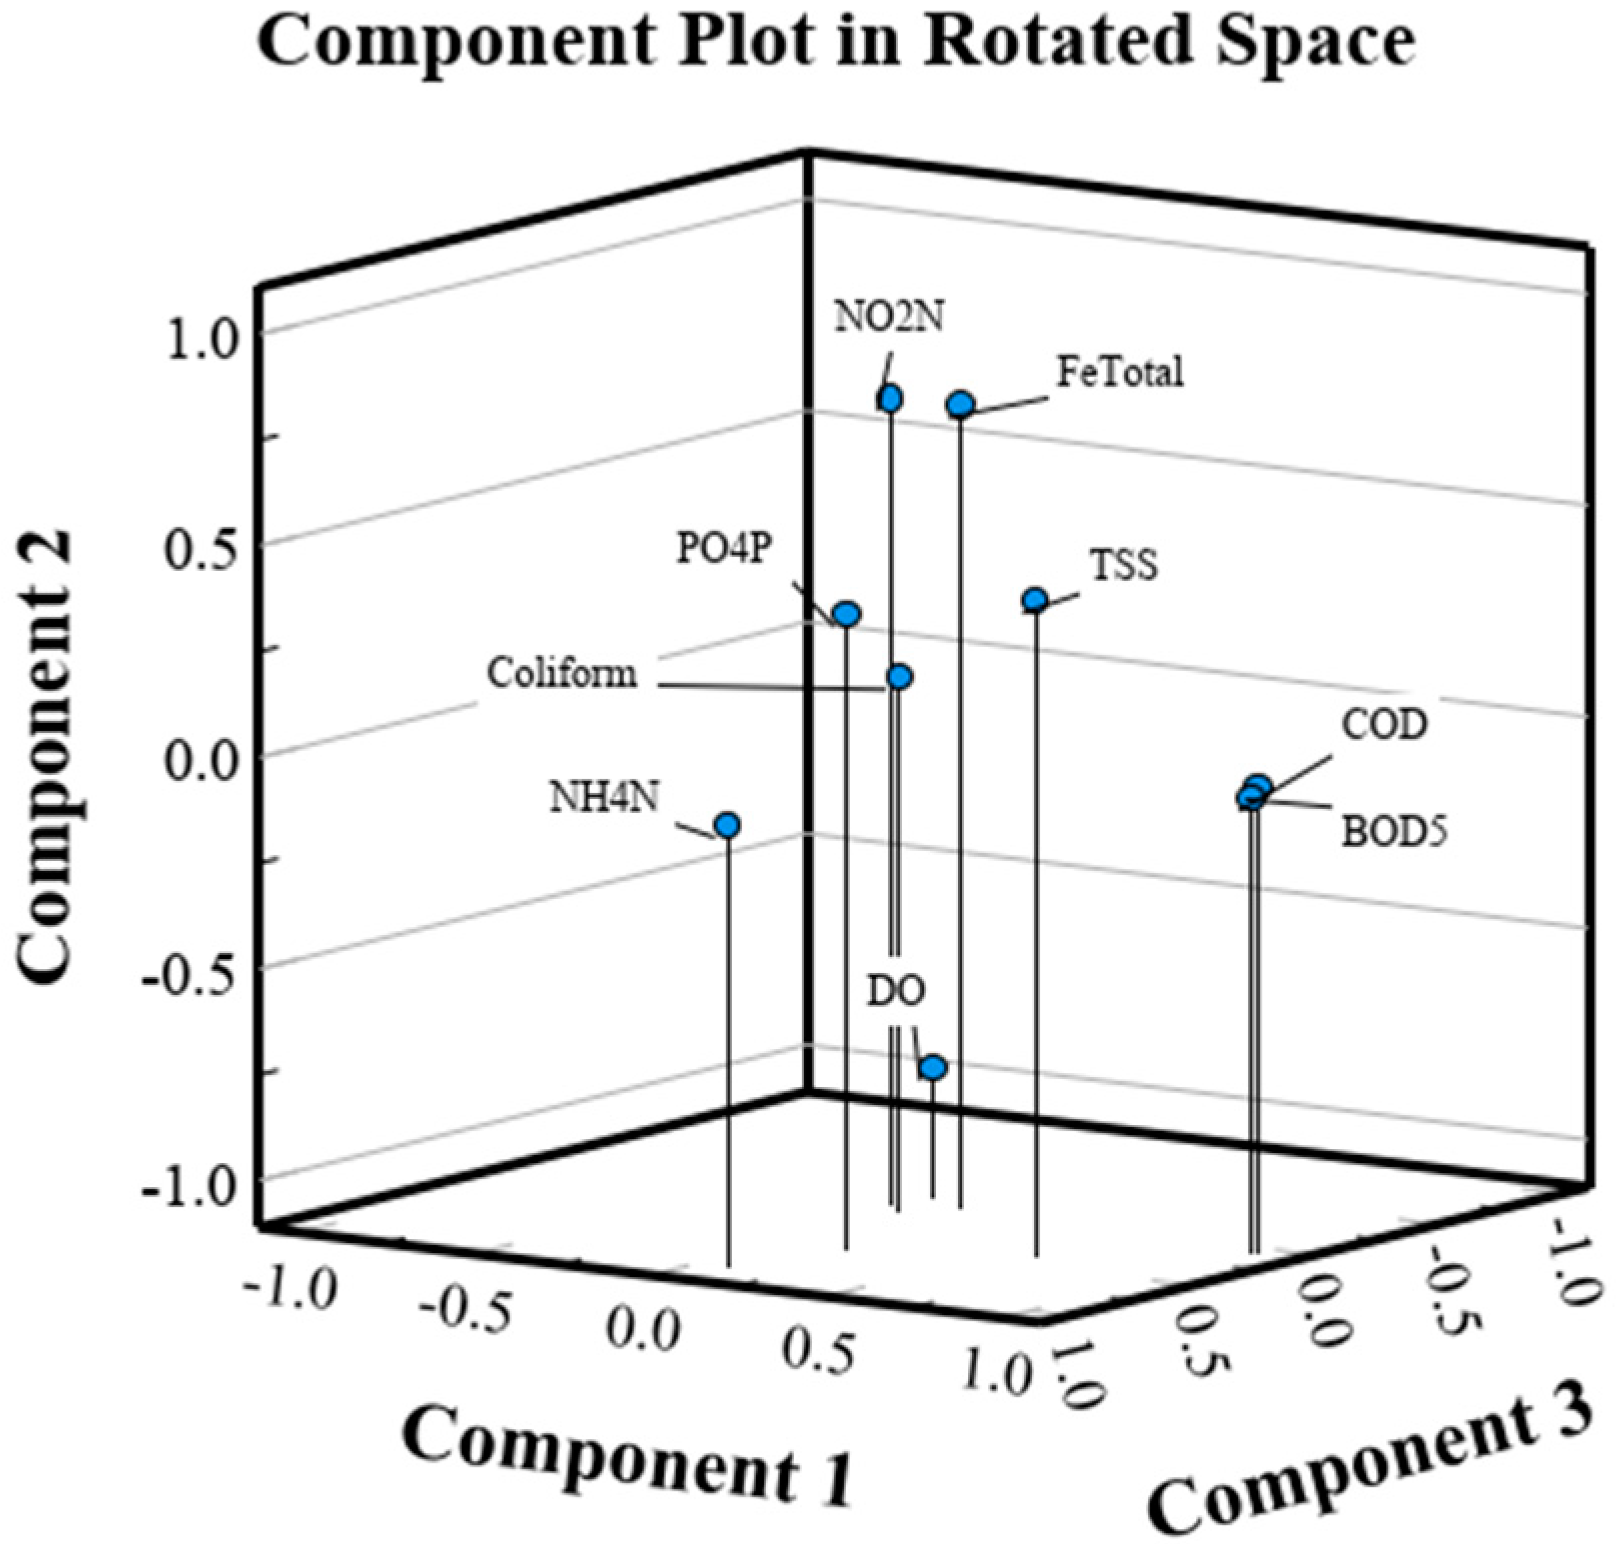
3.3. Principal Component Analysis of Investigated Water Quality Parameters
4. Conclusions
Supplementary Materials
Author Contributions
Funding
Data Availability Statement
Acknowledgments
Conflicts of Interest
References
- Renaud, F.G.; Kuenzer, C. (Eds.) The Mekong Delta System: Interdisciplinary Analyses of a River Delta; Springer: Berlin/Heidelberg, Germany, 2012; ISBN 978-94-007-3961-1. [Google Scholar]
- Nguyen, C.V. An Overview of Aquaculture Pollution in Vietnam; The Aquaculture Sector: Washington, DC, USA, 2017. [Google Scholar]
- Nguyen, T.H. An Overview of Agricultural Pollution in Vietnam; The Crops Sector: Washington, DC, USA, 2017. [Google Scholar]
- Zhu, Z.; Wang, K.; Lei, M.; Li, X.; Li, X.; Jiang, L.; Gao, X.; Li, S.; Liang, J. Identification of Priority Areas for Water Ecosystem Services by a Techno-Economic, Social and Climate Change Modeling Framework. Water Res. 2022, 221, 118766. [Google Scholar] [CrossRef] [PubMed]
- Anh, P.T.; Kroeze, C.; Bush, S.R.; Mol, A.P. Water pollution by intensive brackish shrimp farming in south-east Vietnam: Causes and options for control. Agric. Water Manag. 2010, 97, 872–882. [Google Scholar] [CrossRef]
- Anh, P.T.; Kroeze, C.; Bush, S.R.; Mol, A.P.J. Water pollution by Pangasius production in the Mekong Delta, Vietnam: Causes and options for control. Aquac. Res. 2010, 42, 108–128. [Google Scholar] [CrossRef]
- Huyen, D.T.T.; Lai, T.D. Assessment of wastewater management in Mekong River delta region. STCE 2019, 13, 82–91. [Google Scholar] [CrossRef] [PubMed]
- Vietnam, G.S.O. Survey on Disposing Solid Waste and Wastewater of Industrial Zones; General Statistics Office of Vietnam: Hanoi, Vietnam, 2020.
- World Bank. Socialist Republic of Vietnam: Performance of the Wastewater Sector in Urban Areas, A Review and Recommendations for Improvement; World Bank: Washington, DC, USA, 2013. [Google Scholar]
- Anh, P.T. Mitigating Water Pollution in Vietnamese Aquaculture Production and Processing Industry. The Case of Pangasius and Shrimp. Ph.D. Thesis, Wageningen University & Research, Wageningen, The Netherlands, 2010. [Google Scholar]
- Ministry of Natural Resources and Environment. National Environment Status Report in 2018. Water Environment of River Basins (Vietnamese); Publishing House Natural Resources—Environment and Maps of Vietnam: Hanoi, Vietnam, 2018; ISBN 978-604-952-409-7.
- Ozaki, H.; Co, T.K.; Le, A.K.; Pham, V.N.; van Nguyen, B.; Tarao, M.; Nguyen, H.C.; Le, V.D.; Nguyen, H.T.; Sage-hashi, M.; et al. Human factors and tidal influences on water quality of an urban river in Can Tho, a major city of the Mekong Delta, Vietnam. Environ. Monit. Assess. 2014, 186, 845–858. [Google Scholar] [CrossRef] [PubMed]
- Wilbers, G.-J.; Becker, M.; La Nga, T.; Sebesvari, Z.; Renaud, F.G. Spatial and temporal variability of surface water pollution in the Mekong Delta, Vietnam. Sci. Total Environ. 2014, 485–486, 653–665. [Google Scholar] [CrossRef] [PubMed]
- Buschmann, J.; Berg, M.; Stengel, C.; Winkel, L.; Sampson, M.L.; Trang, P.; Viet, P.H. Contamination of drinking water resources in the Mekong delta floodplains: Arsenic and other trace metals pose serious health risks to population. Environ. Int. 2008, 34, 756–764. [Google Scholar] [CrossRef] [PubMed]
- SIWRP. Draft Report on Water Resource Infrastructure Assessment Study in the Mekong Delta; Vietnam-Netherlands Mekong Delta Masterplan project; SIWRP: Ho Chi Minh, Vietnam, 2010. [Google Scholar]
- Phung, D.; Huang, C.; Rutherford, S.; Dwirahmadi, F.; Chu, C.; Wang, X.; Nguyen, M.; Nguyen, N.H.; Do, C.M.; Nguyen, T.H.; et al. Temporal and spatial assessment of river surface water quality using multivariate statistical techniques: A study in Can Tho City, a Mekong Delta area. Vietnam. Environ. Monit. Assess. 2015, 187, 229. [Google Scholar] [CrossRef] [PubMed]
- Thu Minh, H.V.; Avtar, R.; Kumar, P.; Le, K.N.; Kurasaki, M.; van Ty, T. Impact of Rice Intensification and Urbanization on Surface Water Quality in An Giang Using a Statistical Approach. Water 2020, 12, 1710. [Google Scholar] [CrossRef]
- Nguyen, T.G.; Phan, K.A.; Huynh, T.H.N. Major concerns of surface water quality in south-west coastal regions of Vietnamese Mekong Delta. Sustain. Environ. Res. 2022, 32, 46. [Google Scholar] [CrossRef]
- Giao, N.T.; van Cong, N.; Nhien, H.T.H. Using Remote Sensing and Multivariate Statistics in Analyzing the Relationship between Land Use Pattern and Water Quality in Tien Giang Province, Vietnam. Water 2021, 13, 1093. [Google Scholar] [CrossRef]
- Giao, N.T.; Nhien, H.T.H.; Anh, P.K.; Thuptimdang, P. Combination of water quality, pollution indices, and multivariate statistical techniques for evaluating the surface water quality variation in Can Tho City, Vietnam. Environ. Monit. Assess. 2022, 194, 844. [Google Scholar] [CrossRef] [PubMed]
- Wong, Y.J.; Shimizu, Y.; He, K.; Nik Sulaiman, N.M. Comparison among different ASEAN water quality indices for the assessment of the spatial variation of surface water quality in the Selangor river basin, Malaysia. Environ. Monit. Assess. 2020, 192, 644. [Google Scholar] [CrossRef] [PubMed]
- Stolpe, H.; Ngoc Ha, N.; Jolk, C. Regional Water and Land Use Planning: Systematic Planning Support. In Water Conservation-Inevitable Strategy; Eyvaz, M., Albahnasawi, A., Gürbulak, E., Yüksel, E., Eds.; IntechOpen: London, UK, 2022. [Google Scholar] [CrossRef]
- Ouyang, Y. Evaluation of river water quality monitoring stations by principal component analysis. Water Res. 2015, 39, 2621–2635. [Google Scholar] [CrossRef] [PubMed]
- Kuenzer, C.; Guo, H.; Huth, J.; Leinenkugel, P.; Li, X.; Dech, S. Flood Mapping and Flood Dynamics of the Mekong Delta: ENVISAT-ASAR-WSM Based Time Series Analyses. Remote Sens. 2013, 5, 687–715. [Google Scholar] [CrossRef]
- Haskoning, D.H.V.; Wageningen, U.R.; Deltares, R. Long-Term Vision and Strategy for a Safe, Prosperous and Sustainable Delta. In Mekong Delta Plan; Royal HaskoningDHV: Amersfoort, The Netherlands, 2013. [Google Scholar]
- Chapman, D.V. Water Quality Assessments. In A Guide to the Use of Biota, Sediments and Water in Environmental Monitoring, 2nd ed.; Taylor & Francis Group: Milton, Abingdon, UK, 1996; ISBN 0-419-21590-5. [Google Scholar]
- Daniel, W.W. Applied Nonparametric Statistics, 3rd ed.; PWS-KENT: Boston, MA, USA, 2001. [Google Scholar]
- Kaiser, H.F. The varimax criterion for analytic rotation in factor analysis. Psychometrika 1958, 23, 187–200. [Google Scholar] [CrossRef]
- Chatfield, C.; Collins, A.J. Introduction to Multivariate Analysis; Springer: Boston, MA, USA, 1980; ISBN 978-0-412-16030-1. [Google Scholar]
- General Statistics Office of Vietnam. Agriculture, Forestry and Fishery: Survey on Yield of Paddy Rice; General Statistics Office of Vietnam: Hanoi, Vietnam, 2022.
- General Statistics Office of Vietnam. Industry: Survey on Index of Industrial Production; General Statistics Office of Vietnam: Hanoi, Vietnam, 2022.
- General Statistics Office of Vietnam. Agriculture, Forestry and Fishery: Survey on Production of Aquaculture Fish and Shrimp; General Statistics Office of Vietnam: Hanoi, Vietnam, 2022.
- Huff, L.; Delos, C.; Gallagher, K.; Beaman, J. Aquatic Life Ambient Water Quality Criteria for Ammonia-Freshwater; U.S. Environmental Protection Agency: Washington, DC, USA, 2013.
- U.S. Environmental Protection Agency. Quality Criteria for Water; U.S. Environmental Protection Agency: Washington, DC, USA, 1986; ISBN 0160175739.
- Boyd, C.E. Water Quality: An Introduction, 3rd ed.; Springer: Cham, Switzerland, 2020; ISBN 978-3-030-23334-1. [Google Scholar]
- World Health Organization. Guidelines for Drinking-Water Quality, 4th ed.; World Health Organization: Geneva, Switzerland, 2022. [Google Scholar]
- Stärz, C. Raumzeitliche Variabilität der Oberflächenwasserqualität in der Provinz Can Tho, Vietnam. In Ein Surface Water Quality Tool Als Beitrag Zum Integrierten Wassermanagement, 1st ed.; Meine Verlag: Magdeburg, Germany, 2012; ISBN 978-3-941305-34-2. [Google Scholar]
- Nguyen, T.G.; Minh, V.Q. Evaluating surface water quality and water monitoring parameters in the Tien River, Vietnamese Mekong Delta. J. Teknol. 2021, 83, 29–36. [Google Scholar] [CrossRef]
- Nhan, D.; Be, N.; Trung, N. Water use and competition in the Mekong Delta, Vietnam. In Challenges to Sustainable Development in the Mekong Delta: Regional and National Policy Issues and Research Needs; Sustainable Mekong Research Network: Bangkok, Thailand, 2007. [Google Scholar]
- EJF. Vietnamese Shrimp Aquaculture-Impacts and Improvements; Risky Business: London, UK, 2003. [Google Scholar]
- Asian Development Bank. Viet Nam Urban Environment Program; Urban Sanitation Issues in Viet Nam; Asian Development Bank: Mandaluyong, Philippines, 2015. [Google Scholar]
- Nguyen Dang Giang, C.; Sebesvari, Z.; Renaud, F.; Rosendahl, I.; Hoang Minh, Q.; Amelung, W. Occurrence and Dissipation of the Antibiotics Sulfamethoxazole, Sulfadiazine, Trimethoprim, and Enrofloxacin in the Mekong Delta, Vietnam. PLoS ONE 2015, 10, e0131855. [Google Scholar] [CrossRef] [PubMed]
- Sudaryanto, A.; Isobe, T.; Takahashi, S.; Tanabe, S. Assessment of persistent organic pollutants in sediments from Lower Mekong River Basin. Chemosphere 2011, 82, 679–686. [Google Scholar] [CrossRef] [PubMed]


| Type of Land Use | Area (ha) | Percent of Total (%) | Monitoring Stations |
|---|---|---|---|
| agriculture | 1,057,050 | 83.6 | 18 |
| freshwater aquaculture | 46,970 | 3.7 | 3 |
| forest (national park) | 48,290 | 3.8 | 5 |
| residential land | 83,310 | 6.6 | 28 |
| constructed land | 28,290 | 2.2 | 61 |
| industrial land | n.a. | n.a. | 17 |
| total | 1,263,910 | 99.9 | 132 |
| QCVN08-MT-2015/BTNMT | |||||||||
|---|---|---|---|---|---|---|---|---|---|
| Parameter | Unit | n | Min | Max | Median (±STD) | A (Domestic) | B (Agriculture) | Median Exceedance/Undercut A | Median Exceedance/Undercut B |
| T | °C | 362 | 26.9 | 32.3 | 29.2 (±1.20) | - | - | - | - |
| pH | - | 374 | 5.36 | 8.65 | 7.16 (±0.40) | 6–8.5 | 5.5–9 | 0.0% | 0.0% |
| DO | mg/L | 336 | 0.48 | 7.62 | 4.46 (±1.00) | ≥5 | ≥4 | 11% | 0.0% |
| TSS | mg/L | 374 | 10.0 | 146.0 | 48.4 (±28.0) | 30 | 50 | 61.3% | 0.0% |
| COD | mg/L | 374 | 5.22 | 75.0 | 17.0 (±9.28) | 15 | 30 | 13.3% | 0.0% |
| BOD5 | mg/L | 374 | 2.30 | 41.0 | 9.00 (±5.74) | 6 | 15 | 50.0% | 0.0% |
| NH4-N | mg/L | 374 | bdl 1 | 2.11 | 0.19 (±0.25) | 0.3 | 0.9 | 0.0% | 0.0% |
| NO3-N | mg/L | 362 | bdl 1 | 1.95 | 0.30 (±0.42) | 5 | 10 | 0.0% | 0.0% |
| NO2-N | mg/L | 305 | bdl 1 | 1.10 | 0.04 (±0.21) | 0.05 | 0.05 | 0.0% | 0.0% |
| PO4-P | mg/L | 374 | bdl 1 | 3.03 | 0.09 (±0.18) | 0.2 | 0.3 | 0.0% | 0.0% |
| Fetotal | mg/L | 311 | 0.03 | 12.3 | 0.53 (±0.99) | 1.0 | 1.5 | 0.0% | 0.0% |
| TC | MPN 2/100 mL | 367 | 275 | 2.4 × 10⁵ | 5.4 × 10³ (±2.1 × 10⁴) | 5000 | 7500 | 8.0% | 0.0% |
| River and Canal Hierarchy (1,2,3) | NH4-N (mg/L) | NO3-N (mg/L) | |
|---|---|---|---|
| river and canal hierarchy (1,2,3) | 1.00 | 0.30 ** | 0.20 ** |
| NH4-N (mg/L) | 0.30 ** | 1.00 | 0.21 ** |
| NO3-N (mg/L) | 0.20 ** | 0.21 ** | 1.00 |
| Component | 1 | 2 | 3 | 4 |
|---|---|---|---|---|
| DO | −0.04 | −0.80 | −0.10 | −0.14 |
| TSS | 0.59 | 0.44 | 0.39 | 0.13 |
| COD | 0.98 | −0.03 | 0.07 | −0.03 |
| BOD5 | 0.99 | −0.01 | 0.05 | −0.05 |
| NH4-N | 0.10 | −0.06 | 0.93 | 0.13 |
| NO2-N | −0.08 | 0.80 | 0.02 | −0.29 |
| PO4-P | 0.18 | 0.39 | 0.57 | −0.49 |
| FeTotal | 0.08 | 0.79 | −0.04 | 0.22 |
| Coliform | 0.00 | 0.16 | 0.10 | 0.85 |
Disclaimer/Publisher’s Note: The statements, opinions and data contained in all publications are solely those of the individual author(s) and contributor(s) and not of MDPI and/or the editor(s). MDPI and/or the editor(s) disclaim responsibility for any injury to people or property resulting from any ideas, methods, instructions or products referred to in the content. |
© 2023 by the authors. Licensee MDPI, Basel, Switzerland. This article is an open access article distributed under the terms and conditions of the Creative Commons Attribution (CC BY) license (https://creativecommons.org/licenses/by/4.0/).
Share and Cite
Wehrheim, C.; Lübken, M.; Stolpe, H.; Wichern, M. Identifying Key Influences on Surface Water Quality in Freshwater Areas of the Vietnamese Mekong Delta from 2018 to 2020. Water 2023, 15, 1295. https://doi.org/10.3390/w15071295
Wehrheim C, Lübken M, Stolpe H, Wichern M. Identifying Key Influences on Surface Water Quality in Freshwater Areas of the Vietnamese Mekong Delta from 2018 to 2020. Water. 2023; 15(7):1295. https://doi.org/10.3390/w15071295
Chicago/Turabian StyleWehrheim, Carolin, Manfred Lübken, Harro Stolpe, and Marc Wichern. 2023. "Identifying Key Influences on Surface Water Quality in Freshwater Areas of the Vietnamese Mekong Delta from 2018 to 2020" Water 15, no. 7: 1295. https://doi.org/10.3390/w15071295
APA StyleWehrheim, C., Lübken, M., Stolpe, H., & Wichern, M. (2023). Identifying Key Influences on Surface Water Quality in Freshwater Areas of the Vietnamese Mekong Delta from 2018 to 2020. Water, 15(7), 1295. https://doi.org/10.3390/w15071295